The Belle II Collaboration
Search for decays at the Belle II experiment
Abstract
We present a search for the rare flavor-changing neutral-current decay with data collected by the Belle II experiment at the SuperKEKB electron-positron collider. The analysis uses a 365 data sample recorded at the center-of-mass energy of the resonance. One of the mesons produced in the process is fully reconstructed in a hadronic decay mode, while its companion meson is required to decay into a and two leptons of opposite charge. The leptons are reconstructed in final states with a single electron, muon, charged pion or charged meson, and additional neutrinos. We set an upper limit on the branching fraction of at the 90% confidence level, which is the most stringent constraint reported to date.
In the standard model (SM) transitions occur only at the loop level via penguin or box diagrams, and are therefore suppressed. Combining the charged and neutral modes Kst , the predicted SM branching fraction is Hewett (1996); Capdevila et al. (2018). New physics models can enhance rates by up to four orders of magnitude Capdevila et al. (2018). In some scenarios, the leading new physics couplings are those involving the third-fermion generation, making transitions a better probe than and Cornella et al. (2021). Enhancements to are also foreseen in models that explain the recently observed 2.7 departure from the SM expectation in the decay rate Adachi et al. (2024); Allwicher et al. (2024), together with the anomalies Banerjee et al. (2024); Capdevila et al. (2018).
The Belle experiment has reported an upper limit at the 90% confidence level on the branching fraction of , using a 711 data sample recorded at the resonance and reconstructing the accompanying meson in fully hadronic decay modes Dong et al. (2023). Other searches have been conducted by BABAR Lees et al. (2017) and LHCb Aaij et al. (2017). None of these searches led to evidence for a signal, and all the upper limits are above the SM predictions.
We report a search for cha decay at Belle II. The main challenge is the presence of up to four final-state neutrinos. Reconstructing one meson () in isolates the accompanying meson () and constrains the kinematics of the missing neutrinos. We reconstruct the in hadronic decay modes and search for a decay of the partner , where the mode is used. All the combinations of the decay modes , , , and are utilized for the two ’s. A multivariate approach with a binary classifier is adopted to separate signal from background events. The classifier output is used in a binned profile-likelihood fit to extract the signal branching fraction. To minimize experimental bias, we finalized the full analysis procedure before examining the data in the signal region. The main new features compared to the previous search Dong et al. (2023) are the use of an improved tagging method Keck et al. (2019) and the inclusion of decay modes. The Belle II analysis described here improves the expected sensitivity by a factor of 2.6, despite using a smaller dataset.
We use a 365 data sample recorded by the Belle II detector, located at the SuperKEKB asymmetric electron-positron collider Akai et al. (2018), between 2019 and 2022. The data are collected at a center-of-mass (c.m.) energy , corresponding to the peak of the resonance. An additional 43 data sample, collected at a c.m. energy 60 below the mass of the resonance (off-resonance), is used to study backgrounds from events, where indicates a , , , or quark. The Belle II detector Abe (2010) consists of a nearly hermetic magnetic spectrometer, composed by silicon detectors and a central drift chamber (CDC), surrounded by particle identification (PID), electromagnetic calorimetry (ECL), and muon and subdetectors. Simulated samples are used to suppress backgrounds, estimate the signal efficiency, and define fit templates for the branching fraction extraction. Various Monte Carlo (MC) event generators are utilized. The EvtGen Lange (2001), PYTHIA8 Sjöstrand et al. (2015), KKMC Jadach et al. (2000), and TAUOLA Jadach et al. (1990) software packages are used to model particle production and decay, PHOTOS Barberio and Wa̧s (1994) is used for photon radiation from final state charged particles, and Geant4 Agostinelli et al. (2003) simulates material interaction and detector response. We simulate signal decays using SM form factor calculations from Ref. Ali et al. (2000). Simulated beam-induced backgrounds are overlaid onto the events Natochii et al. (2022). The Belle II analysis software framework Kuhr et al. (2019); Belle II Collaboration is used for event reconstruction.
The analysis starts by reconstructing a into one of 32 hadronic decay modes using the Full Event Interpretation algorithm (FEI) Keck et al. (2019), in which final state particles, reconstructed from tracks and energy deposits in the ECL (clusters), are combined into intermediate particles until the final candidates are formed. For each decay chain, the algorithm calculates the probability () that the reconstructed decay mode is correct, using gradient-boosted decision trees Keck (2017). Known kinematic properties can be exploited using the beam-energy-constrained mass and the energy difference , where and represent the momentum and energy of the in the c.m. frame, respectively. Correctly reconstructed mesons peak in the distribution at the known mass and have values close to zero for . We select candidates with , , and . At this stage, for the simulated signal sample, 0.9% of events are retained, with an average multiplicity of 1.5 candidates. To minimize possible mismodeling in the combination step, for each event only the candidate with the highest value of is retained. In the signal MC sample, this selection picks the correctly reconstructed candidate about 87% of the time.
Tracks and clusters not associated to the selected are used to reconstruct candidates. Spurious tracks from beam-induced background are rejected by selecting only the tracks that originate close to the interaction point by requiring small transverse and longitudinal impact parameters, and , respectively. Furthermore, tracks should have polar angles in the CDC acceptance () and transverse momenta . In order to have a reliable d/d measurement for PID, only tracks having at least 20 CDC hits are retained. For each track, a charged particle hypothesis is assigned using PID selectors, which combine information from the different sub-detectors. A likelihood-based binary classifier separates charged pions from kaons. For muon identification, a likelihood-based selector is used as well, while for electrons a selector based on a boosted decision tree (BDT) Hocker et al. (2007) is applied. We choose selection thresholds resulting in efficiencies of 95% for hadrons, 82% for electrons, and 77% for muons; in the selected sample, 6%, 3%, and 30% of the respective candidates are misidentified, according to the simulation. PID selection efficiencies and misidentification probabilities are evaluated via data control channels in bins of momentum and polar angle of the reconstructed particles Adachi et al. (2024); Belle II Collaboration (2020). Simulated events are weighted to correct for the differences compared to the data. Clusters that are not matched to any extrapolated track, and have polar angles in the CDC acceptance, are used to identify photon candidates. We reconstruct candidates using photons with energy thresholds of , , and in the forward, barrel, and backward region of the ECL respectively. These thresholds are optimized to suppress background from high multiplicity decays. Photon pairs are then combined if their invariant mass is in the range , corresponding to approximately two times the experimental resolution around the known mass Navas et al. (2024), and their maximum angular separation is 1.5 in the transverse plane and 1.4 in the 3D space. The selection criteria result in a reconstruction efficiency of about 30%. The reconstruction efficiency is computed in bins of momentum using data control samples from and decays. The observed differences between data and simulation are used to correct the simulated distributions. The candidates are then used to construct candidates. We require an invariant mass in the range (0.65, 0.9) , which is chosen to reduce the contamination from combinatorial background. Pairs of charged kaons and pions having opposite charges are combined to form candidates if their invariant mass is in the range (0.80, 0.99) , corresponding to four times the decay width. A vertex fit Krohn et al. (2020) constrains the two tracks to originate from a common vertex, which is identified as the candidate decay point. Candidate mesons that have a -value for the vertex fit smaller than are rejected.
Each candidate is formed by combining a reconstructed with the daughters of two oppositely charged leptons, in combinations of , , , and . The daughters of the two leptons are henceforth denoted as and , where has the same charge sign as the charged kaon from the . A total of 16 possible combinations of final states are examined. The invariant mass of the , , and system should be less than 6.0 , to reject badly misreconstructed combinations.
Multiple candidates can be reconstructed for a single event. At this stage, all the candidates are retained and combined with the unique , to form candidates. For each candidate, the rest of the event (ROE) contains all the remaining tracks and clusters not used either for or for reconstruction. We require zero charged tracks in the ROE. The track selection in the ROE is the same as for the signal candidate except that the requirement on the number of CDC hits is removed. The selection of clusters in the ROE also follows the procedure adopted for photons, with energy thresholds of 100, 60, and 150 in the forward, barrel, and backward regions of the ECL, respectively, optimized to reject clusters from beam background. We also require no track trajectory extrapolating to the ECL in a 20 radius around the cluster center. The latter requirement suppresses background clusters due to secondary particles generated in nuclear interactions of hadrons with the ECL material. We define the extra energy () as the sum of the energies of all the clusters assigned to the ROE.
To reduce the contamination from events with particles outside of the acceptance of the tracking detectors, the polar angle of the missing momentum should be inside the CDC angular acceptance. The missing four-momentum of the event is defined as , where is the initial total four-momentum of the colliding beams, and the sum runs over the four-momenta of all the tracks and all the clusters in the ECL without an associated track. The flavor of the reconstructed , determined by the charge of the kaon from the decay, is required to be opposite to the flavor of the partner candidate. The opposite correlation is also used to define the “same-flavor” control sample, with reconstructed and pairs. This sample also includes signal events in which one of the two mesons has undergone flavor mixing before decaying, with a mixing probability Navas et al. (2024), resulting in a signal contamination below the expected sensitivity of the analysis. The signal efficiency at this stage is with an expected background yield of events, about 35% of which are events. The next largest source of background, about 30% of the total, is from continuum processes.
The kinematic features of the signal side depend on the decay modes of the two leptons. Therefore, we separate the reconstructed events into four signal categories: three categories, namely , , and , where = indicates the daughter, and the category, in which one decays as , while the other decays to any of the four reconstructed modes. The first three categories differ in the number of neutrinos in the final state. The category can have one or two reconstructed ’s from , while the number of neutrinos is not fixed. In the simulated signal sample, the average candidate multiplicity per event is 4.4, and the fraction of events with one correctly reconstructed candidate is 77%. To avoid double counting due to cross-feed among signal categories, we select a single candidate in each event, as follows. First, we select the candidate(s) having the closest mass to the measured value Navas et al. (2024). If a reconstructed is present in the event, we retain only the candidates assigned to the category to prevent the from contributing to the ROE. Candidates with more identified electrons or muons are then selected to maintain a high signal efficiency for the purest categories. At this stage, the average candidate multiplicity in each event is 1.3, and for the events that have multiple candidates, the final choice is performed randomly. A comparison using a fully random selection of the candidate shows that the procedure outlined above results in a 15% higher fraction of correctly reconstructed signal events, with no bias introduced in the observables used for the signal extraction.
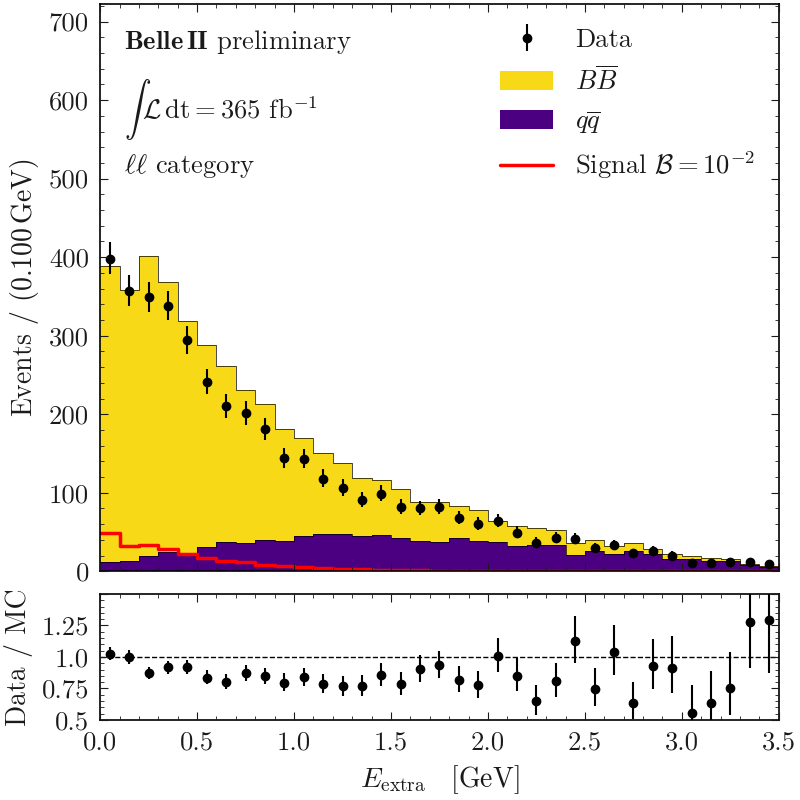
A control sample with a clean decay is used to validate the simulated signal, using the same strategy described in Adachi et al. (2024). The tracks and clusters associated with the candidate are replaced with those originating from a decay, extracted from simulated events, so that only the and the ROE’s are taken from the control sample. A difference in efficiency between data and simulation of is found and the central value is used as a correction for the signal efficiency. The same factor is also used to scale the background events having a correctly reconstructed (peaking ). The remaining portion of the events (combinatorial ) is normalized with the same-flavor control sample. The same-flavor sample is also used to correct the ROE cluster multiplicity, separately for each signal category, since MC simulation mismodelling affects the distribution. Figure 1 shows the distribution for the category with the ROE cluster multiplicity correction applied. The residual data/MC discrepancies for are covered by the systematic uncertainties, described below. The normalization of backgrounds events is adjusted for each signal category using the off-resonance data sample.
We separate signal from background through BDT binary classifiers Chen and Guestrin (2016), trained on simulated samples, separately for each signal category. Each BDT uses the same set of 14 variables, selected based on their discriminating power and on the level of data-simulation agreement observed in the same-flavor control sample. These variables combine information about the event shape, the kinematics of and candidates, the missing four-momentum, and . In addition, the invariant masses , are used as inputs to target backgrounds. The most discriminating input variables are the missing energy, , , and sup . To use the entire simulated sample, we perform a two-fold training: the samples are randomly split into two halves, and the classifier is trained separately on each half. The set of model weights obtained from each training are then applied to the complementary half sample. Good agreement between the outputs of the two trainings is observed.
The range of the BDT output (), defined as signal region (SR), is used in the fit for the branching fraction. The SR is common to all signal categories and is determined by the need to maintain high signal efficiency while limiting the impact of background-related systematic uncertainties on the expected branching fraction. Table 1 gives the signal efficiencies () and the expected background composition in the SR. The category is the most sensitive. In this category, the largest background contamination comes from , 60% of which are peaking pairs. In about of the events, a neutral is correctly reconstructed while the other decays to a semileptonic or semitauonic final state. This fraction is lower for the other signal categories and is for the one.
| Signal category | |||
|---|---|---|---|
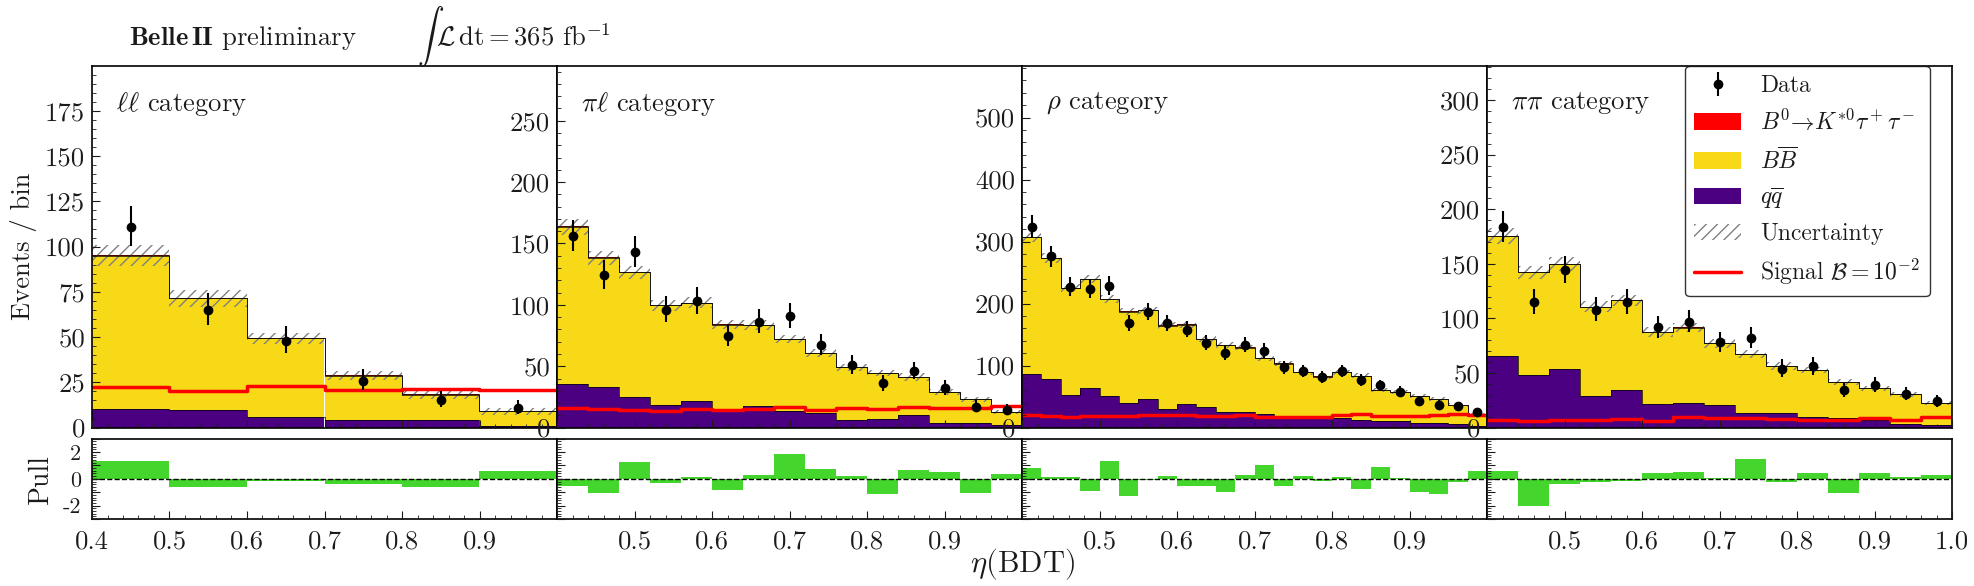
The signal branching fraction is extracted from an binned maximum likelihood fit to the distribution in the SR, simultaneously for all four signal categories, using the pyhf Heinrich et al. (2024, 2021) and the Cabinetry libraries Cranmer and Held (2021). The parameter of interest is , where is the number of produced , estimated from a data-driven approach in which non- events are subtracted from on-resonance data, and Banerjee et al. (2024) is the decay rate. A uniform bin width is chosen for each signal category, such that each bin contains more than 10 expected background events. The templates for the fit components (signal, and backgrounds) are obtained from simulated samples.
The parameter of interest is unconstrained in the fit, while systematic uncertainties are incorporated into the likelihood as nuisance parameters with Gaussian constraints. The uncertainties on the correction factors for the pion, kaon, and lepton identification efficiencies and misidentification probabilities, as well as for the efficiency, are determined from the auxiliary measurements, as described above. We assign a systematic uncertainty to the correction of the ROE cluster multiplicity. The uncertainty is taken to be 100% of the residual difference in the data-to-simulation ratio observed in the control region, after applying the correction derived from the same-flavor sample. The branching fractions of decay modes contributing to about 70% of decays and 50% of decays in the SR are allowed to vary according to their known uncertainties Navas et al. (2024). We assign a 50% uncertainty on the branching fractions of decays, which are poorly known and constitute about 5% (9%) of the residual () background. The events in which a meson decays to a final state with a are scaled by 1.30, and a 10% systematic uncertainty is assigned to them Adachi et al. (2024). The normalization factors for , combinatorial , peaking backgrounds, and signal efficiency are evaluated in the SR using the same control samples previously described, and they are found to be consistent with the values determined in the full region. Thus no further correction is applied; systematic uncertainties associated with the corrections are described below. An uncertainty on the normalization factor for the background, due to the statistical uncertainty of the off-resonance sample and ranging from 70% for the mode to 15% for the and signal categories, is assigned. The combinatorial yield is allowed to vary by , while the peaking and signal normalizations are assumed to be known at the 14% level. We use a dedicated MC sample, generated with modified form factors Ali et al. (2000), to evaluate the systematic uncertainty due to the knowledge of signal form factors. Global normalization uncertainties on the luminosity measurement (0.5%), the number of (1.5%), and the parameter () are treated with one nuisance parameter each. Finally, the systematic uncertainty due to the limited size of simulated samples is also taken into account.
Before examining the SR, we validate the fit procedure with MC pseudo-experiments, in which both statistical and systematic uncertainties are taken into account. No bias in the branching fraction and its uncertainty is observed, with an injected signal branching fraction ranging from zero to the current upper limit value Dong et al. (2023). As an additional check, a set of pseudo-experiments is constructed by varying the number of expected events in each bin of the fit variable. The variations are derived from the data-simulation discrepancies observed in those bins for the same-flavor control sample. Again in this case, no bias is observed when performing a fit. Assuming the background-only hypothesis, the expected branching fraction uncertainty on simulated events is computed to be . This corresponds to an expected 90% confidence level (C.L.) upper limit of , which was determined using the CLs method Read (2002), a modified frequentist approach that is based on a profile likelihood ratio Cowan et al. (2011).
The result of the fit to data is shown in Fig. 2, corresponding to a measured branching fraction of . Compatibility between the data and fit result is assessed using simplified MC pseudo-experiments, and a -value of is obtained. The measurement is statistically limited. The impact of the various systematic uncertainties on the branching fraction is given in Table 2; the knowledge of the decays branching fractions and the simulated sample size are the largest contributions. As no significant signal is observed, we obtain a 90% C.L. upper limit of .
| Source | Impact on |
|---|---|
| branching fractions | 0.29 |
| Simulated sample size | 0.27 |
| normalization | 0.18 |
| ROE cluster multiplicity | 0.17 |
| and ID | 0.14 |
| decay branching fraction | 0.11 |
| Combinatorial normalization | 0.09 |
| Signal and peaking normalization | 0.07 |
| Lepton ID | 0.04 |
| efficiency | 0.03 |
| 0.01 | |
| 0.01 | |
| decays | 0.01 |
| Signal form factors | 0.01 |
| Luminosity | |
| Total systematics | 0.52 |
| Statistics | 0.86 |
In summary, we present the first search for the decays at Belle II, utilizing the hadronic tagging technique. We analyze a 365 dataset collected by the Belle II experiment at the SuperKEKB collider. No evidence for a signal is observed, and an upper limit on the branching fraction of at the 90% confidence level is set, assuming a signal with SM-like properties. This is the most stringent limit on the decay to date.
Acknowledgements.
This work, based on data collected using the Belle II detector, which was built and commissioned prior to March 2019, was supported by Higher Education and Science Committee of the Republic of Armenia Grant No. 23LCG-1C011; Australian Research Council and Research Grants No. DP200101792, No. DP210101900, No. DP210102831, No. DE220100462, No. LE210100098, and No. LE230100085; Austrian Federal Ministry of Education, Science and Research, Austrian Science Fund (FWF) Grants DOI: 10.55776/P34529, DOI: 10.55776/J4731, DOI: 10.55776/J4625, DOI: 10.55776/M3153, and DOI: 10.55776/PAT1836324, and Horizon 2020 ERC Starting Grant No. 947006 “InterLeptons”; Natural Sciences and Engineering Research Council of Canada, Compute Canada and CANARIE; National Key R&D Program of China under Contract No. 2022YFA1601903, National Natural Science Foundation of China and Research Grants No. 11575017, No. 11761141009, No. 11705209, No. 11975076, No. 12135005, No. 12150004, No. 12161141008, No. 12475093, and No. 12175041, and Shandong Provincial Natural Science Foundation Project ZR2022JQ02; the Czech Science Foundation Grant No. 22-18469S and Charles University Grant Agency project No. 246122; European Research Council, Seventh Framework PIEF-GA-2013-622527, Horizon 2020 ERC-Advanced Grants No. 267104 and No. 884719, Horizon 2020 ERC-Consolidator Grant No. 819127, Horizon 2020 Marie Sklodowska-Curie Grant Agreement No. 700525 “NIOBE” and No. 101026516, and Horizon 2020 Marie Sklodowska-Curie RISE project JENNIFER2 Grant Agreement No. 822070 (European grants); L’Institut National de Physique Nucléaire et de Physique des Particules (IN2P3) du CNRS and L’Agence Nationale de la Recherche (ANR) under Grant No. ANR-21-CE31-0009 (France); BMBF, DFG, HGF, MPG, and AvH Foundation (Germany); Department of Atomic Energy under Project Identification No. RTI 4002, Department of Science and Technology, and UPES SEED funding programs No. UPES/R&D-SEED-INFRA/17052023/01 and No. UPES/R&D-SOE/20062022/06 (India); Israel Science Foundation Grant No. 2476/17, U.S.-Israel Binational Science Foundation Grant No. 2016113, and Israel Ministry of Science Grant No. 3-16543; Istituto Nazionale di Fisica Nucleare and the Research Grants BELLE2, and the ICSC – Centro Nazionale di Ricerca in High Performance Computing, Big Data and Quantum Computing, funded by European Union – NextGenerationEU; Japan Society for the Promotion of Science, Grant-in-Aid for Scientific Research Grants No. 16H03968, No. 16H03993, No. 16H06492, No. 16K05323, No. 17H01133, No. 17H05405, No. 18K03621, No. 18H03710, No. 18H05226, No. 19H00682, No. 20H05850, No. 20H05858, No. 22H00144, No. 22K14056, No. 22K21347, No. 23H05433, No. 26220706, and No. 26400255, and the Ministry of Education, Culture, Sports, Science, and Technology (MEXT) of Japan; National Research Foundation (NRF) of Korea Grants No. 2016R1-D1A1B-02012900, No. 2018R1-A6A1A-06024970, No. 2021R1-A6A1A-03043957, No. 2021R1-F1A-1060423, No. 2021R1-F1A-1064008, No. 2022R1-A2C-1003993, No. 2022R1-A2C-1092335, No. RS-2023-00208693, No. RS-2024-00354342 and No. RS-2022-00197659, Radiation Science Research Institute, Foreign Large-Size Research Facility Application Supporting project, the Global Science Experimental Data Hub Center, the Korea Institute of Science and Technology Information (K24L2M1C4) and KREONET/GLORIAD; Universiti Malaya RU grant, Akademi Sains Malaysia, and Ministry of Education Malaysia; Frontiers of Science Program Contracts No. FOINS-296, No. CB-221329, No. CB-236394, No. CB-254409, and No. CB-180023, and SEP-CINVESTAV Research Grant No. 237 (Mexico); the Polish Ministry of Science and Higher Education and the National Science Center; the Ministry of Science and Higher Education of the Russian Federation and the HSE University Basic Research Program, Moscow; University of Tabuk Research Grants No. S-0256-1438 and No. S-0280-1439 (Saudi Arabia), and Researchers Supporting Project number (RSPD2025R873), King Saud University, Riyadh, Saudi Arabia; Slovenian Research Agency and Research Grants No. J1-9124 and No. P1-0135; Agencia Estatal de Investigacion, Spain Grant No. RYC2020-029875-I and Generalitat Valenciana, Spain Grant No. CIDEGENT/2018/020; The Knut and Alice Wallenberg Foundation (Sweden), Contracts No. 2021.0174 and No. 2021.0299; National Science and Technology Council, and Ministry of Education (Taiwan); Thailand Center of Excellence in Physics; TUBITAK ULAKBIM (Turkey); National Research Foundation of Ukraine, Project No. 2020.02/0257, and Ministry of Education and Science of Ukraine; the U.S. National Science Foundation and Research Grants No. PHY-1913789 and No. PHY-2111604, and the U.S. Department of Energy and Research Awards No. DE-AC06-76RLO1830, No. DE-SC0007983, No. DE-SC0009824, No. DE-SC0009973, No. DE-SC0010007, No. DE-SC0010073, No. DE-SC0010118, No. DE-SC0010504, No. DE-SC0011784, No. DE-SC0012704, No. DE-SC0019230, No. DE-SC0021274, No. DE-SC0021616, No. DE-SC0022350, No. DE-SC0023470; and the Vietnam Academy of Science and Technology (VAST) under Grants No. NVCC.05.12/22-23 and No. DL0000.02/24-25. These acknowledgements are not to be interpreted as an endorsement of any statement made by any of our institutes, funding agencies, governments, or their representatives. We thank the SuperKEKB team for delivering high-luminosity collisions; the KEK cryogenics group for the efficient operation of the detector solenoid magnet and IBBelle on site; the KEK Computer Research Center for on-site computing support; the NII for SINET6 network support; and the raw-data centers hosted by BNL, DESY, GridKa, IN2P3, INFN, and the University of Victoria.References
- (1) Henceforth, indicates the state.
- Hewett (1996) J. L. Hewett, Phys. Rev. D 53, 4964 (1996).
- Capdevila et al. (2018) B. Capdevila, A. Crivellin, S. Descotes-Genon, L. Hofer, and J. Matias, Phys. Rev. Lett. 120, 181802 (2018).
- Cornella et al. (2021) C. Cornella, D. A. Faroughy, J. Fuentes-Martin, G. Isidori, and M. Neubert, J. High Energy Phys. 08, 050.
- Adachi et al. (2024) I. Adachi et al. (Belle II Collaboration), Phys. Rev. D 109, 112006 (2024).
- Allwicher et al. (2024) L. Allwicher, D. Becirevic, G. Piazza, S. Rosauro-Alcaraz, and O. Sumensari, Phys. Lett. B 848, 138411 (2024).
- Banerjee et al. (2024) S. Banerjee et al. (HFLAV), Averages of -hadron, -hadron, and -lepton properties as of 2023 (2024), arXiv:2411.18639 [hep-ex] .
- Dong et al. (2023) T. V. Dong, T. Luo, et al. (Belle Collaboration), Phys. Rev. D 108, L011102 (2023).
- Lees et al. (2017) J. P. Lees, V. Poireau, V. Tisserand, et al. (BaBar Collaboration), Phys. Rev. Lett. 118, 031802 (2017).
- Aaij et al. (2017) R. Aaij, B. Adeva, M. Adinolfi, et al. (LHCb Collaboration), Phys. Rev. Lett. 118, 251802 (2017).
- (11) Charge conjugate modes are implied throughout the text.
- Keck et al. (2019) T. Keck et al., Comput. Softw. Big Sci. 3, 6 (2019).
- Akai et al. (2018) K. Akai, K. Furukawa, and H. Koiso, Nucl. Instrum. Meth. A907, 188 (2018).
- Abe (2010) T. Abe (Belle II Collaboration), Belle II technical design report (2010), arXiv:1011.0352 [physics.ins-det] .
- Lange (2001) D. J. Lange, Proceedings, 7th International Conference on physics at hadron machines (BEAUTY 2000): Maagan, Israel, September 13-18, 2000, Nucl. Instrum. Meth. A462, 152 (2001).
- Sjöstrand et al. (2015) T. Sjöstrand, S. Ask, J. R. Christiansen, R. Corke, N. Desai, P. Ilten, S. Mrenna, S. Prestel, C. O. Rasmussen, and P. Z. Skands, Comput. Phys. Commun. 191, 159 (2015).
- Jadach et al. (2000) S. Jadach, B. F. L. Ward, and Z. Wa̧s, Comput. Phys. Commun. 130, 260 (2000).
- Jadach et al. (1990) S. Jadach, J. H. Kuhn, and Z. Wa̧s, Comput. Phys. Commun. 64, 275 (1990).
- Barberio and Wa̧s (1994) E. Barberio and Z. Wa̧s, Comput. Phys. Commun. 79, 291 (1994).
- Agostinelli et al. (2003) S. Agostinelli et al. (GEANT4 collaboration), Nucl.Instrum.Meth. A506, 250 (2003).
- Ali et al. (2000) A. Ali, P. Ball, L. T. Handoko, and G. Hiller, Phys. Rev. D 61, 074024 (2000).
- Natochii et al. (2022) A. Natochii et al., in Snowmass 2021 (2022) arXiv:2203.05731 [hep-ex] .
- Kuhr et al. (2019) T. Kuhr, C. Pulvermacher, M. Ritter, T. Hauth, and N. Braun (Belle II Framework Software Group), Comput. Softw. Big Sci. 3, 1 (2019).
- (24) Belle II Collaboration, Belle II Analysis Software Framework (basf2), https://doi.org/10.5281/zenodo.5574115.
- Keck (2017) T. Keck, Comput. Softw. Big Sci. 1, 2 (2017).
- Hocker et al. (2007) A. Hocker et al., TMVA - Toolkit for Multivariate Data Analysis with ROOT: Users guide. TMVA - Toolkit for Multivariate Data Analysis, Tech. Rep. (CERN, Geneva, 2007).
- Belle II Collaboration (2020) Belle II Collaboration, BELLE2-NOTE-PL-2020-XXX (2020).
- Navas et al. (2024) S. Navas et al. (Particle Data Group), Phys. Rev. D 110, 030001 (2024).
- Krohn et al. (2020) J.-F. Krohn et al. (Belle II Analysis Software Group), Nucl. Instrum. Meth. A976, 164269 (2020).
- Chen and Guestrin (2016) T. Chen and C. Guestrin, in Proceedings of the 22nd ACM SIGKDD International Conference on Knowledge Discovery and Data Mining, KDD ’16 (ACM, New York, NY, USA, 2016) pp. 785–794.
- (31) See Supplemental Material at [URL] for more details on the input variables and on the BDT architecture.
- Heinrich et al. (2024) L. Heinrich, M. Feickert, and G. Stark, pyhf: v0.7.6 (2024), https://github.com/scikit-hep/pyhf/releases/tag/v0.7.6.
- Heinrich et al. (2021) L. Heinrich, M. Feickert, G. Stark, and K. Cranmer, Journal of Open Source Software 6, 2823 (2021).
- Cranmer and Held (2021) K. Cranmer and A. Held, 25th International Conference on Computing in High Energy and Nuclear Physics (CHEP 2021) 10.1051/epjconf/202125103067 (2021).
- Read (2002) A. L. Read, Journal of Physics G: Nuclear and Particle Physics 28, 2693 (2002).
- Cowan et al. (2011) G. Cowan, K. Cranmer, E. Gross, and O. Vitells, Eur. Phys. J. C 71, 1554 (2011), [Erratum: Eur.Phys.J.C 73, 2501 (2013)].
- Pinto et al. (2024) A. Pinto, Z. Wu, F. Balli, N. Berger, M. Boonekamp, E. Chapon, T. Kawamoto, and B. Malaescu, Eur. Phys. J. C 84, 593 (2024).