Using Reinforcement Learning to Integrate Subjective Wellbeing into Climate Adaptation
Decision Making
Abstract
Subjective wellbeing is a fundamental aspect of human life, influencing life expectancy and economic productivity, among others. Mobility plays a critical role in maintaining wellbeing, yet the increasing frequency and intensity of both nuisance and high-impact floods due to climate change are expected to significantly disrupt access to activities and destinations, thereby affecting overall wellbeing. Addressing climate adaptation presents a complex challenge for policymakers, who must select and implement policies from a broad set of options with varying effects while managing resource constraints and uncertain climate projections. In this work, we propose a multi-modular framework that uses reinforcement learning as a decision-support tool for climate adaptation in Copenhagen, Denmark. Our framework integrates four interconnected components: long-term rainfall projections, flood modeling, transport accessibility, and wellbeing modeling. This approach enables decision-makers to identify spatial and temporal policy interventions that help sustain or enhance subjective wellbeing over time. By modeling climate adaptation as an open-ended system, our framework provides a structured framework for exploring and evaluating adaptation policy pathways. In doing so, it supports policymakers to make informed decisions that maximize wellbeing in the long run.
1 Introduction
Subjective wellbeing can be described as how individuals self-assess their own wellbeing and how they experience positive or negative aspects in their lives, including both reflective cognitive judgements (e.g., satisfaction with life) and emotional responses (Diener et al., 2018). Subjective wellbeing has been associated with the maintenance of physical health and living a longer life (Steptoe et al., 2015), greater economic productivity (DiMaria et al., 2020), and social cohesion (Delhey & Dragolov, 2016). Research often divides subjective wellbeing into hedonic wellbeing, i.e., the presence or absence of pleasures and pains, and eudaimonic wellbeing, which relates to a more abstract notion of living a meaningful, actualised life in accordance with one’s ’true’ self (Ryan & Deci, 2001).
The ability to move through space underpins much of one’s wellbeing. The capacity to be mobile, also called a person’s motility (Kaufmann et al., 2018), is thought to have both a direct and indirect relationship with hedonic and eudaimonic wellbeing. Directly, because motility has value ’in and of itself’ as a form of freedom, autonomy, and independence, and indirectly, because a greater capacity to be mobile can facilitate participation in activities which cause immediate hedonic pleasure or support eudaimonic self-actualisation (De Vos et al., 2013).
Climate change has direct consequences on how people move through a city. In particular, due to increases in high-impact weather events (IPCC, 2023b), including more extreme rainfall and rising coastal waters (Olesen et al., 2014), urban floods are expected to increase. These can significantly disrupt social and economic activities or cause substantial physical damage to property (Hammond et al., 2015). Impacts on transportation systems can be both direct (e.g., road deterioration, washouts, or loss of vehicle control) and indirect (e.g., travel delays, increased congestion, or reduced accessibility) (Li et al., 2018; Wang et al., 2020; Lu et al., 2022; Shahdani et al., 2022). Taken together, these impacts have knock-on effects on individuals’ motility, and consequently also on their wellbeing.
Copenhagen, our case study, is one of Denmark’s social flood vulnerability hotspots (Prall et al., 2024). As rising coastal waters and increased pluvial flooding look set to severely affect the lives of Copenhagen’s residents (Olesen et al., 2014), policymakers are facing the urgent need to make adaptation choices to tackle climage change impacts. Yet, decision-makers need to navigate the difficult challenge of finding which policy, or sequence of policies, together with resource constraints and uncertain climate projections, maintain or even increase individuals’ wellbeing.
At the same time, there are few frameworks which comprehensively link climate change and wellbeing (IPCC, 2023a). Here, artificial intelligence tools, if used constructively, can serve as a guiding tool to use scientific evidence for policymaking (Tyler et al., 2023). We posit that this climate change adaptation policymaking challenge can be tackled by using reinforcement learning (RL). RL can allow for policy ambitions to be made actionable under complex and dynamic domains while also inspiring active engagement (Gilbert et al., 2022). By constructing an integrated framework combining climate, transport, and wellbeing models, and a shift in focus towards maximising individuals’ wellbeing, we can identify which policymaking pathways have the capacity to mitigate climate change impacts.
1.1 Objectives
Our aim is to demonstrate how wellbeing can be incorporated into policymaking decisions for climate change. We do this by integrating climate models, climate impacts, transport, and wellbeing in a RL framework. To showcase this multi-modular framework, we tackle climate-related flooding and adaptation in Copenhagen, though it can be applied to other cities and other climate hazards, too. By accounting for multiple climate scenarios, this approach allows us to identify the best set of plausible policy pathways that maximise individual wellbeing in the long run.
2 Proposed Methodology
Modeling Framework We propose to develop an integrated assessment model (IAM) to identify policy-relevant measures that maximise long-term wellbeing. IAMs provide simplified representations of complex physical and social systems and allow for assessing climate change responses and inherent uncertainties (Parson & Fisher-Vanden, 1997). While traditional IAMs primarily focus on physical or economic impacts, our model emphasizes social impacts, particularly wellbeing, and uses RL to determine optimal policies under uncertain climate scenarios. As shown in Figure 1, we structure our environment as four interconnected components, which we overview below. A more detailed description used in our preliminary experiments can be found in Appendix A.
Rainfall and Flood Modeling We focus on climate change’s impacts on increased intensity and frequency of rainfall events. We use Klimaatlas (Danmarks Meteorologiske Institut, 2023) to model rainfall. Rainfall is simulated following different projection scenarios (Van Vuuren et al., 2011) and range from no rainfall to intense precipitation over a short duration (e.g., cloudbursts).
Depending on the simulated rainfall intensity at one point in time, we model its associated flood, which can range from no accumulation of water to nuisance floods, or even high-impact floods. To model how water amasses on the ground, we use SCALGO Live (SCALGO, 2024). SCALGO Live is a simple interactive static event-based tool that allows for flood depths and flow direction modelling based on rainfall intensities. In essence, water accumulates over depressions and, when overflow occurs it continues downstream, allowing one to map water depth at any point over Copenhagen.
Transport Accessibility After modeling the distribution of water in Copenhagen for a specific rainfall, we model its impacts on transport accessibility, i.e., the ease of how land-use and transport systems enable individuals to reach activities or destinations (Litman, 2009). Floods directly impact the speed at which you can travel, e.g., by car or foot (Pregnolato et al., 2017; Finnis & Walton, 2008), and thus, they also impact accessibility. As water levels rise, travel speeds are reduced incrementally until a critical depth is reached, point at which a given segment (e.g., road) becomes untraversable. As a consequence, travel time increases because individuals travel at a reduced speed or because they need to take a different route to avoid a flooded segment. In either case, a decrease in accessibility occurs to, for example, critical infrastructure and emergency services (Coles et al., 2017), transport-related infrastructure (Li et al., 2018), or everyday activities (Wiśniewski et al., 2020). In our case, we model transport accessibility for different transport modes to key activities and destinations, which have been found to impact wellbeing (Mokhtarian, 2019; Conceição et al., 2023).
Wellbeing Modeling Tying motility to wellbeing is a two-step process. First, as motility is an unobservable construct, we use principal component analysis to extract measures of motility based on individuals’ transport access (as computed above), and survey responses to their abilities and attitudes regarding mobility (Kaufmann et al., 2018; Bernier et al., 2019). Second, based on these components we model the relationship between motility and wellbeing. Here, we link the extracted components with a self-reported life satisfaction measure by using a cumulative link (i.e. ordinal regression) model. The outputs of this model — and in particular a predicted life satisfaction score — is passed to the RL’s reward function.
Reinforcement Learning Under the current climate uncertainty, we posit to learn the best set of adaptation policies that maximise wellbeing using RL. RL uses an agent-based approach to interact with the previously defined environment by taking an action and maximising a given reward function (Sutton & Barto, 2018). This "trial-and-error" framework can overcome traditional methods in dealing with non-linearities, learning in an interactive environment while also adhering to its constraints, and maximise a delayed reward (Matsuo et al., 2022). At the same time, it can balance trade-offs between competing and diverse sets of actions and their rewards and allow for non-linear effects of the environment and its input uncertainties.
In this work, we propose a small set of actions that can be implemented over different areas of Copenhagen. Actions can have both short and long term effects, like increasing road drainage, permeable paving, or implementing early warning systems. Actions change the environment and directly or indirectly affect wellbeing. We define the reward function to optimize for as a metric of wellbeing, as defined above. To learn which action to perform at any time, our RL agent takes an action and collects information about the state of our digital city. Over time, the RL agent learns the best set of policies to take which maximise our long-term cumulative wellbeing. As a whole, this framework can be used as a tool to help guide policymaking for climate change adaptation.
3 Pathway to Impact
Our proposed approach serves as a queryable and comprehensive framework that enables policymakers to assess the long-term impacts of adaptation interventions with the goal of maximizing wellbeing. Despite the growing recognition of wellbeing as a critical factor in climate adaptation, there is a lack of integrated frameworks that explicitly incorporate wellbeing (IPCC, 2023a) and health co-benefits of adaptation interventions (Sharifi et al., 2021). Due to its dynamic and open-ended nature, it is challenging to study climate adaptation policy through traditional optimization-based approaches (Workman et al., 2021). This challenge is particularly pressing in Copenhagen, one of Denmark’s most flood-prone areas (Prall et al., 2024), where worsening climate conditions are increasing both the severity and frequency of flood events (Olesen et al., 2014).
Our model responds to these challenges by incorporating wellbeing into climate adaptation policy simulations in a modular and scaleable way. The RL framework, meanwhile, is well-suited to tackling the kinds of open-ended systems that characterise climate adaptation policy. Finally, our approach can support policymakers to identify plausible policy pathways which maximise the wellbeing of Copenhagen residents under climate stressed and resource constrained conditions.
References
- Adhikari et al. (2013) Kabindra Adhikari, Rania Bou Kheir, Mette B Greve, Peder K Bøcher, Brendan P Malone, Budiman Minasny, Alex B McBratney, and Mogens H Greve. High-resolution 3-d mapping of soil texture in denmark. Soil Science Society of America Journal, 77(3):860–876, 2013.
- Bellman (1957) Richard Bellman. A markovian decision process. Journal of Mathematics and Mechanics, pp. 679–684, 1957.
- Bernier et al. (2019) Éloi Bernier, Alexis Gumy, Guillaume Drevon, and Vincent Kaufmann. Motility as a tool to uncover mobility practices. 2019.
- Coles et al. (2017) Daniel Coles, Dapeng Yu, Robert L Wilby, Daniel Green, and Zara Herring. Beyond ‘flood hotspots’: Modelling emergency service accessibility during flooding in york, uk. Journal of hydrology, 546:419–436, 2017.
- Conceição et al. (2023) Marta Aranha Conceição, Mayara Moraes Monteiro, Dena Kasraian, Pauline van den Berg, Sonja Haustein, Inês Alves, Carlos Lima Azevedo, and Bruno Miranda. The effect of transport infrastructure, congestion and reliability on mental wellbeing: A systematic review of empirical studies. Transport Reviews, 43(2):264–302, March 2023. ISSN 0144-1647. doi: 10.1080/01441647.2022.2100943.
- Danmarks Meteorologiske Institut (2023) Danmarks Meteorologiske Institut. Klimaatlas, 2023. URL https://www.dmi.dk/klima-atlas/data-i-klimaatlas. Accessed: 2024-08-26.
- De Vos et al. (2013) Jonas De Vos, Tim Schwanen, Veronique Van Acker, and Frank Witlox. Travel and Subjective Well-Being: A Focus on Findings, Methods and Future Research Needs. Transport Reviews, 33(4):421–442, July 2013. ISSN 0144-1647. doi: 10.1080/01441647.2013.815665.
- Delhey & Dragolov (2016) Jan Delhey and Georgi Dragolov. Happier together. Social cohesion and subjective well-being in Europe. International Journal of Psychology, 51(3):163–176, 2016. ISSN 1464-066X. doi: 10.1002/ijop.12149.
- Diener et al. (2018) Ed Diener, Shigehiro Oishi, and Louis Tay. Advances in subjective well-being research. Nature human behaviour, 2(4):253–260, 2018.
- DiMaria et al. (2020) Charles Henri DiMaria, Chiara Peroni, and Francesco Sarracino. Happiness Matters: Productivity Gains from Subjective Well-Being. Journal of Happiness Studies, 21(1):139–160, January 2020. ISSN 1573-7780. doi: 10.1007/s10902-019-00074-1.
- Espeholt et al. (2018) Lasse Espeholt, Hubert Soyer, Remi Munos, Karen Simonyan, Volodymir Mnih, Tom Ward, Yotam Doron, Vlad Firoiu, Tim Harley, Iain Dunning, Shane Legg, and Koray Kavukcuoglu. Impala: Scalable distributed deep-rl with importance weighted actor-learner architectures. 2018. doi: 10.48550/arXiv.1802.01561.
- Finnis & Walton (2008) Kirsten K Finnis and Darren Walton. Field observations to determine the influence of population size, location and individual factors on pedestrian walking speeds. Ergonomics, 51(6):827–842, 2008. URL https://doi.org/10.1080/00140130701812147.
- Gilbert et al. (2022) Thomas Krendl Gilbert, Sarah Dean, Tom Zick, and Nathan Lambert. Choices, risks, and reward reports: Charting public policy for reinforcement learning systems, 2022. URL https://arxiv.org/abs/2202.05716.
- Hammond et al. (2015) Michael J Hammond, Albert S Chen, Slobodan Djordjević, David Butler, and Ole Mark. Urban flood impact assessment: A state-of-the-art review. Urban Water Journal, 12(1):14–29, 2015.
- IPCC (2023a) IPCC. 2022: Health, Wellbeing, and the Changing Structure of Communities. In Climate Change 2022 – Impacts, Adaptation and Vulnerability: Working Group II Contribution to the Sixth Assessment Report of the Intergovernmental Panel on Climate Change. Cambridge University Press, 1 edition, June 2023a. ISBN 978-1-00-932584-4. doi: 10.1017/9781009325844.
- IPCC (2023b) IPCC. Section 3: Long-Term Climate and Development Futures. In Climate Change 2023: Synthesis Report. Contribution of Working Groups I, II and III to the Sixth Assessment Report of the Intergovernmental Panel on Climate Change [Core Writing Team, H. Lee and J. Romero (eds.)], pp. 35–115. IPCC, Geneva, Switzerland, doi: 10.59327/IPCC/AR6-9789291691647, 2023b.
- Kaufmann et al. (2018) Vincent Kaufmann, Yann Dubois, and Emmanuel Ravalet. Measuring and typifying mobility using motility. Applied Mobilities, 3(2):198–213, July 2018. ISSN 2380-0127. doi: 10.1080/23800127.2017.1364540.
- Li et al. (2018) Mengya Li, Mei-Po Kwan, Jie Yin, Dapeng Yu, and Jun Wang. The potential effect of a 100-year pluvial flood event on metro accessibility and ridership: A case study of central shanghai, china. Applied Geography, 100:21–29, 2018. ISSN 0143-6228. doi: https://doi.org/10.1016/j.apgeog.2018.09.001. URL https://www.sciencedirect.com/science/article/pii/S0143622818302716.
- Liang et al. (2018) Eric Liang, Richard Liaw, Robert Nishihara, Philipp Moritz, Roy Fox, Ken Goldberg, Joseph E. Gonzalez, Michael I. Jordan, and Ion Stoica. RLlib: Abstractions for distributed reinforcement learning. Proceedings of the International Conference on Machine Learning (ICML), 2018. URL https://arxiv.org/pdf/1712.09381.
- Litman (2009) Todd Litman. Transportation cost and benefit analysis. Victoria Transport Policy Institute, 31:1–19, 2009.
- Lu et al. (2022) Xiaohui Lu, Faith Ka Shun Chan, Wei-Qiang Chen, Hing Kai Chan, and Xinbing Gu. An overview of flood-induced transport disruptions on urban streets and roads in chinese megacities: Lessons and future agendas. Journal of Environmental Management, 321:115991, 2022. ISSN 0301-4797. doi: https://doi.org/10.1016/j.jenvman.2022.115991. URL https://www.sciencedirect.com/science/article/pii/S030147972201564X.
- Matsuo et al. (2022) Yutaka Matsuo, Yann LeCun, Maneesh Sahani, Doina Precup, David Silver, Masashi Sugiyama, Eiji Uchibe, and Jun Morimoto. Deep learning, reinforcement learning, and world models. Neural Networks, 152:267–275, 2022. ISSN 0893-6080. doi: https://doi.org/10.1016/j.neunet.2022.03.037. URL https://www.sciencedirect.com/science/article/pii/S0893608022001150.
- Mokhtarian (2019) Patricia L. Mokhtarian. Subjective well-being and travel: Retrospect and prospect. Transportation, 46(2):493–513, April 2019. ISSN 1572-9435. doi: 10.1007/s11116-018-9935-y.
- Mollenkopf et al. (2011) Heidrun Mollenkopf, Annette Hieber, and Hans-Werner Wahl. Continuity and change in older adults’ perceptions of out-of-home mobility over ten years: A qualitative–quantitative approach. Ageing & Society, 31(5):782–802, July 2011. ISSN 1469-1779, 0144-686X. doi: 10.1017/S0144686X10000644.
- Olesen et al. (2014) Martin Olesen, Kristine Skovgaard Madsen, Carsten Ankjær Ludwigsen, Fredrik Boberg, Tina Christensen, John Cappelen, Ole Bøssing Christensen, Katrine Krogh Andersen, and Jens Hesselbjerg Christensen. Fremtidige klimaforandringer i danmark (danmarks klimacenter rapport nr. 6 2014). Technical report, Danmarks Meteorologiske Institut, 2014.
- Palacios & El-Geneidy (2022) Manuel Santana Palacios and Ahmed El-Geneidy. Cumulative versus gravity-based accessibility measures: which one to use? Findings, 2022.
- Parson & Fisher-Vanden (1997) Edward A Parson and Karen Fisher-Vanden. Integrated assessment models of global climate change. Annual Review of Energy and the Environment, 22(1):589–628, 1997.
- Prall et al. (2024) Mia Cassidy Prall, Urs Steiner Brandt, Nick Schack Halvorsen, Morten Uldal Hansen, Niklas Dahlberg, and Kaija Jumppanen Andersen. A comprehensive approach for assessing social flood vulnerability and social flood risk: The case of Denmark. International Journal of Disaster Risk Reduction, 111:104686, September 2024. ISSN 2212-4209. doi: 10.1016/j.ijdrr.2024.104686.
- Pregnolato et al. (2017) Maria Pregnolato, Alistair Ford, Sean M. Wilkinson, and Richard J. Dawson. The impact of flooding on road transport: A depth-disruption function. Transportation Research Part D: Transport and Environment, 55:67–81, 2017. ISSN 1361-9209. doi: https://doi.org/10.1016/j.trd.2017.06.020. URL https://www.sciencedirect.com/science/article/pii/S1361920916308367.
- Ryan & Deci (2001) Richard M. Ryan and Edward L. Deci. On Happiness and Human Potentials: A Review of Research on Hedonic and Eudaimonic Well-Being. Annual Review of Psychology, 52(Volume 52, 2001):141–166, February 2001. ISSN 0066-4308, 1545-2085. doi: 10.1146/annurev.psych.52.1.141.
- SCALGO (2024) SCALGO. SCALGO Live, 2024. URL https://scalgo.com/live/denmark. Accessed: 2024-06-07.
- Schulman et al. (2017) John Schulman, Filip Wolski, Prafulla Dhariwal, Alec Radford, and Oleg Klimov. Proximal policy optimization algorithms. 07 2017. doi: 10.48550/arXiv.1707.06347.
- Shahdani et al. (2022) Fereshteh Jafari Shahdani, Mónica Santamaria-Ariza, Hélder S. Sousa, Mário Coelho, and José C. Matos. Assessing Flood Indirect Impacts on Road Transport Networks Applying Mesoscopic Traffic Modelling: The Case Study of Santarém, Portugal. Applied Sciences, 12(6), 2022. ISSN 2076-3417. doi: 10.3390/app12063076. URL https://www.mdpi.com/2076-3417/12/6/3076.
- Sharifi et al. (2021) Ayyoob Sharifi, Minal Pathak, Chaitali Joshi, and Bao-Jie He. A systematic review of the health co-benefits of urban climate change adaptation. Sustainable Cities and Society, 74:103190, November 2021. ISSN 2210-6707. doi: 10.1016/j.scs.2021.103190.
- Shliselberg et al. (2020) Rebecca Shliselberg, Moshe Givoni, and Sigal Kaplan. A behavioral framework for measuring motility: Linking past mobility experiences, motility and eudemonic well-being. Transportation Research Part A: Policy and Practice, 141:69–85, November 2020. ISSN 09658564. doi: 10.1016/j.tra.2020.09.001.
- Steptoe et al. (2015) Andrew Steptoe, Angus Deaton, and Arthur A. Stone. Subjective wellbeing, health, and ageing. The Lancet, 385(9968):640–648, February 2015. ISSN 0140-6736, 1474-547X. doi: 10.1016/S0140-6736(13)61489-0.
- Styrelsen for Dataforsyning og Infrastruktur (2024) Styrelsen for Dataforsyning og Infrastruktur. Danmarks højdemodel. https://sdfi.dk/data-om-danmark/vores-data/danmarks-hoejdemodel, 2024. Accessed: 2024-06-07.
- Sutton & Barto (2018) Richard S Sutton and Andrew G Barto. Reinforcement learning: An introduction. MIT press, 2018.
- Tyler et al. (2023) Chris Tyler, KL Akerlof, Alessandro Allegra, Zachary Arnold, Henriette Canino, Marius A Doornenbal, Josh A Goldstein, David Budtz Pedersen, and William J Sutherland. Ai tools as science policy advisers? the potential and the pitfalls. Nature, 622(7981):27–30, 2023.
- Van Vuuren et al. (2011) Detlef P Van Vuuren, Jae Edmonds, Mikiko Kainuma, Keywan Riahi, Allison Thomson, Kathy Hibbard, George C Hurtt, Tom Kram, Volker Krey, Jean-Francois Lamarque, et al. The representative concentration pathways: an overview. Climatic change, 109:5–31, 2011.
- Wang et al. (2020) Tianni Wang, Zhuohua Qu, Zaili Yang, Timothy Nichol, Geoff Clarke, and Ying-En Ge. Climate change research on transportation systems: Climate risks, adaptation and planning. Transportation Research Part D: Transport and Environment, 88:102553, 2020.
- Wiśniewski et al. (2020) Szymon Wiśniewski, Marta Borowska-Stefańska, Michał Kowalski, and Paulina Sapińska. Vulnerability of the accessibility to grocery shopping in the event of flooding. Transportation Research Part D: Transport and Environment, 87:102510, 2020.
- Workman et al. (2021) Mark Workman, Geoff Darch, Kate Dooley, Guy Lomax, James Maltby, and Hector Pollitt. Climate policy decision making in contexts of deep uncertainty - from optimisation to robustness. Environmental Science & Policy, 120:127–137, June 2021. ISSN 1462-9011. doi: 10.1016/j.envsci.2021.03.002.
Appendix A Comprehensive Description of the Model Components used in Preliminary Experiments
A.1 Rainfall Projection Model
Daily rainfall projections under different climate scenarios (e.g., RCP2.6, RCP4.5, RCP8.5) can be used to model rainfall events (Van Vuuren et al., 2011). Various models exist for simulating these events, with differing levels of complexity and computational efficiency. A particularly simple and computationally efficient option is Climate Atlas, developed by the Danish Meteorological Institute, which provides stepwise projections for the periods 2011–2040, 2041–2070, and 2071–2100 (Danmarks Meteorologiske Institut, 2023). Figure 2 illustrates the average rainfall for 1,000 samples per year between 2023 and 2100, as generated from Climate Atlas.
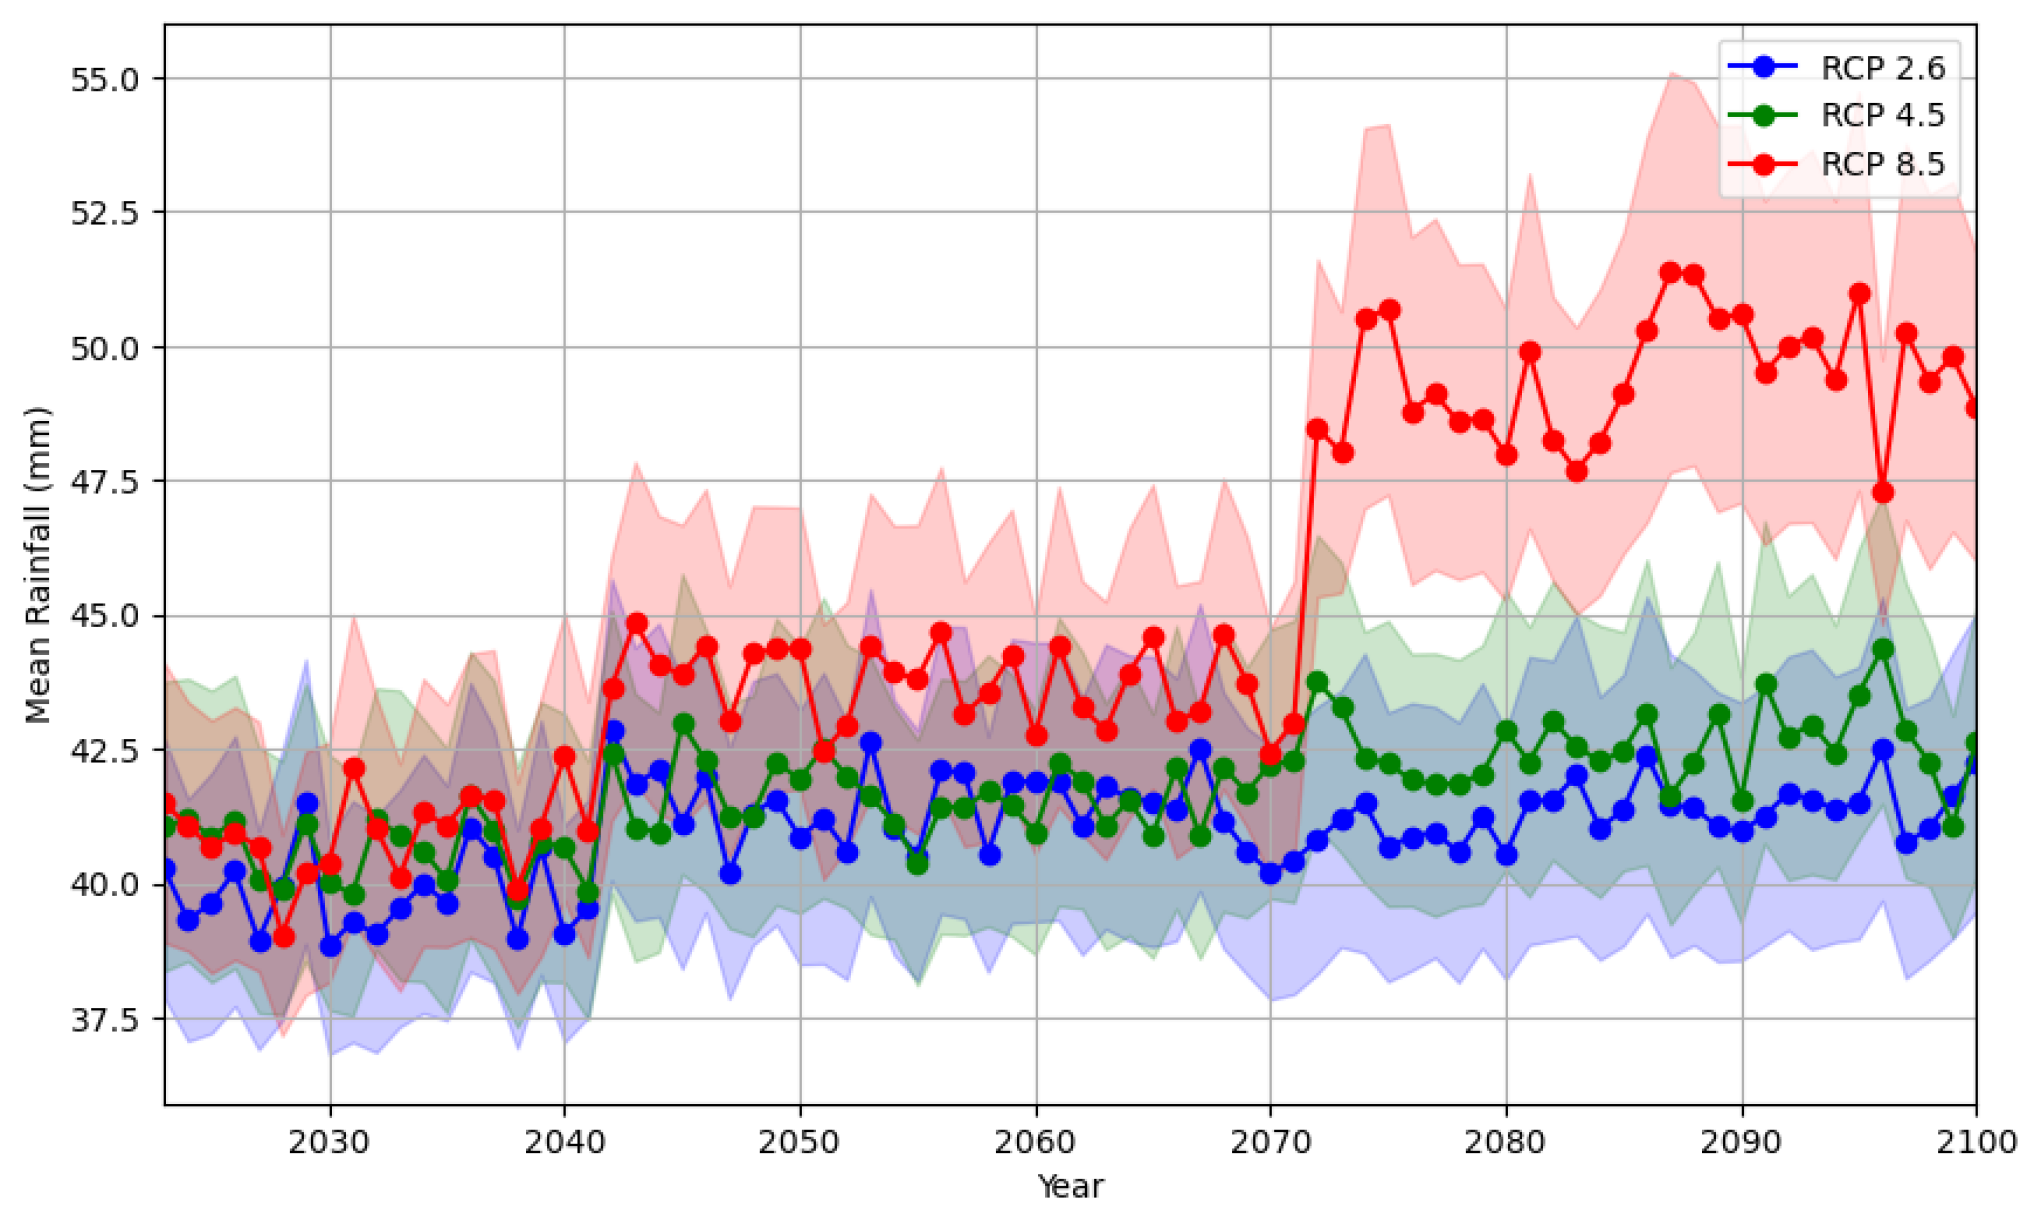
At each time step, we simulate a daily rainfall event, assuming stationarity. We construct the cumulative density function (CDF) of Climate Atlas rainfall projections for each period and sample an event based on the selected climate scenario. The scenario is chosen at the beginning of each RL episode.
While Climate Atlas provides a straightforward, stepwise representation of rainfall increases across three periods until 2100, it has several limitations. The model assumes stationarity within each period and does not account for finer temporal variations, such as seasonal fluctuations or extreme event clustering. Additionally, its coarse spatial resolution may not capture localized rainfall dynamics, which are critical for finner urban flood modeling and adaptation planning. Future work will incorporate more advanced models that offer higher temporal and spatial granularity, dynamically represent changing climate conditions, and better integrate physical and statistical downscaling techniques. These enhancements will improve the rainfall projections, enabling more robust assessments of flood risks and adaptation strategies.
A.2 Flood Model
Following the simulation of a rainfall event, we model water accumulation across Copenhagen resulting from the simulated precipitation. To achieve this, we use SCALGO Live (SCALGO, 2024), a computationally efficient, event-based tool for watershed delineation. SCALGO functions as a flood depth and water flow estimator, leveraging high-resolution digital terrain data to predict water accumulation and movement.
For Denmark, SCALGO integrates multiple datasets to function. It utilizes the Danish Elevation Model (Styrelsen for Dataforsyning og Infrastruktur, 2024) for topographical information, the soil type map from the Institute of Agroecology at Aarhus University (Adhikari et al., 2013) to account for soil properties such as evaporation, compaction, and vegetation cover, and sewer drainage data from the Kloakoplande (sewer plans) within the digital register for spatial planning in Denmark (https://www.planinfo.dk/) to model water runoff from artificial surfaces and surcharged drainage systems.
The model assumes a uniform rainfall distribution across all of Copenhagen with an unspecified duration, meaning rainfall intensity is consistent throughout the city, and water accumulates simultaneously across all locations. Water flow is determined by terrain properties, where runoff collects in natural depressions or low-lying areas. If the volume of accumulated water exceeds the volume capacity of a depression, it spills over and continues flowing downstream.
This approach enables the mapping of water accumulation and the estimation of flood depth at any given location in Copenhagen for a specified rainfall event. Figure 3 illustrates examples of simulated water accumulation for rainfall intensities of 0 mm (no rain), 10 mm, 50 mm, and 100 mm.
a) 0 mm
b) 10 mm
c) 50 mm
d) 100 mm
A.3 Transport Accessibility
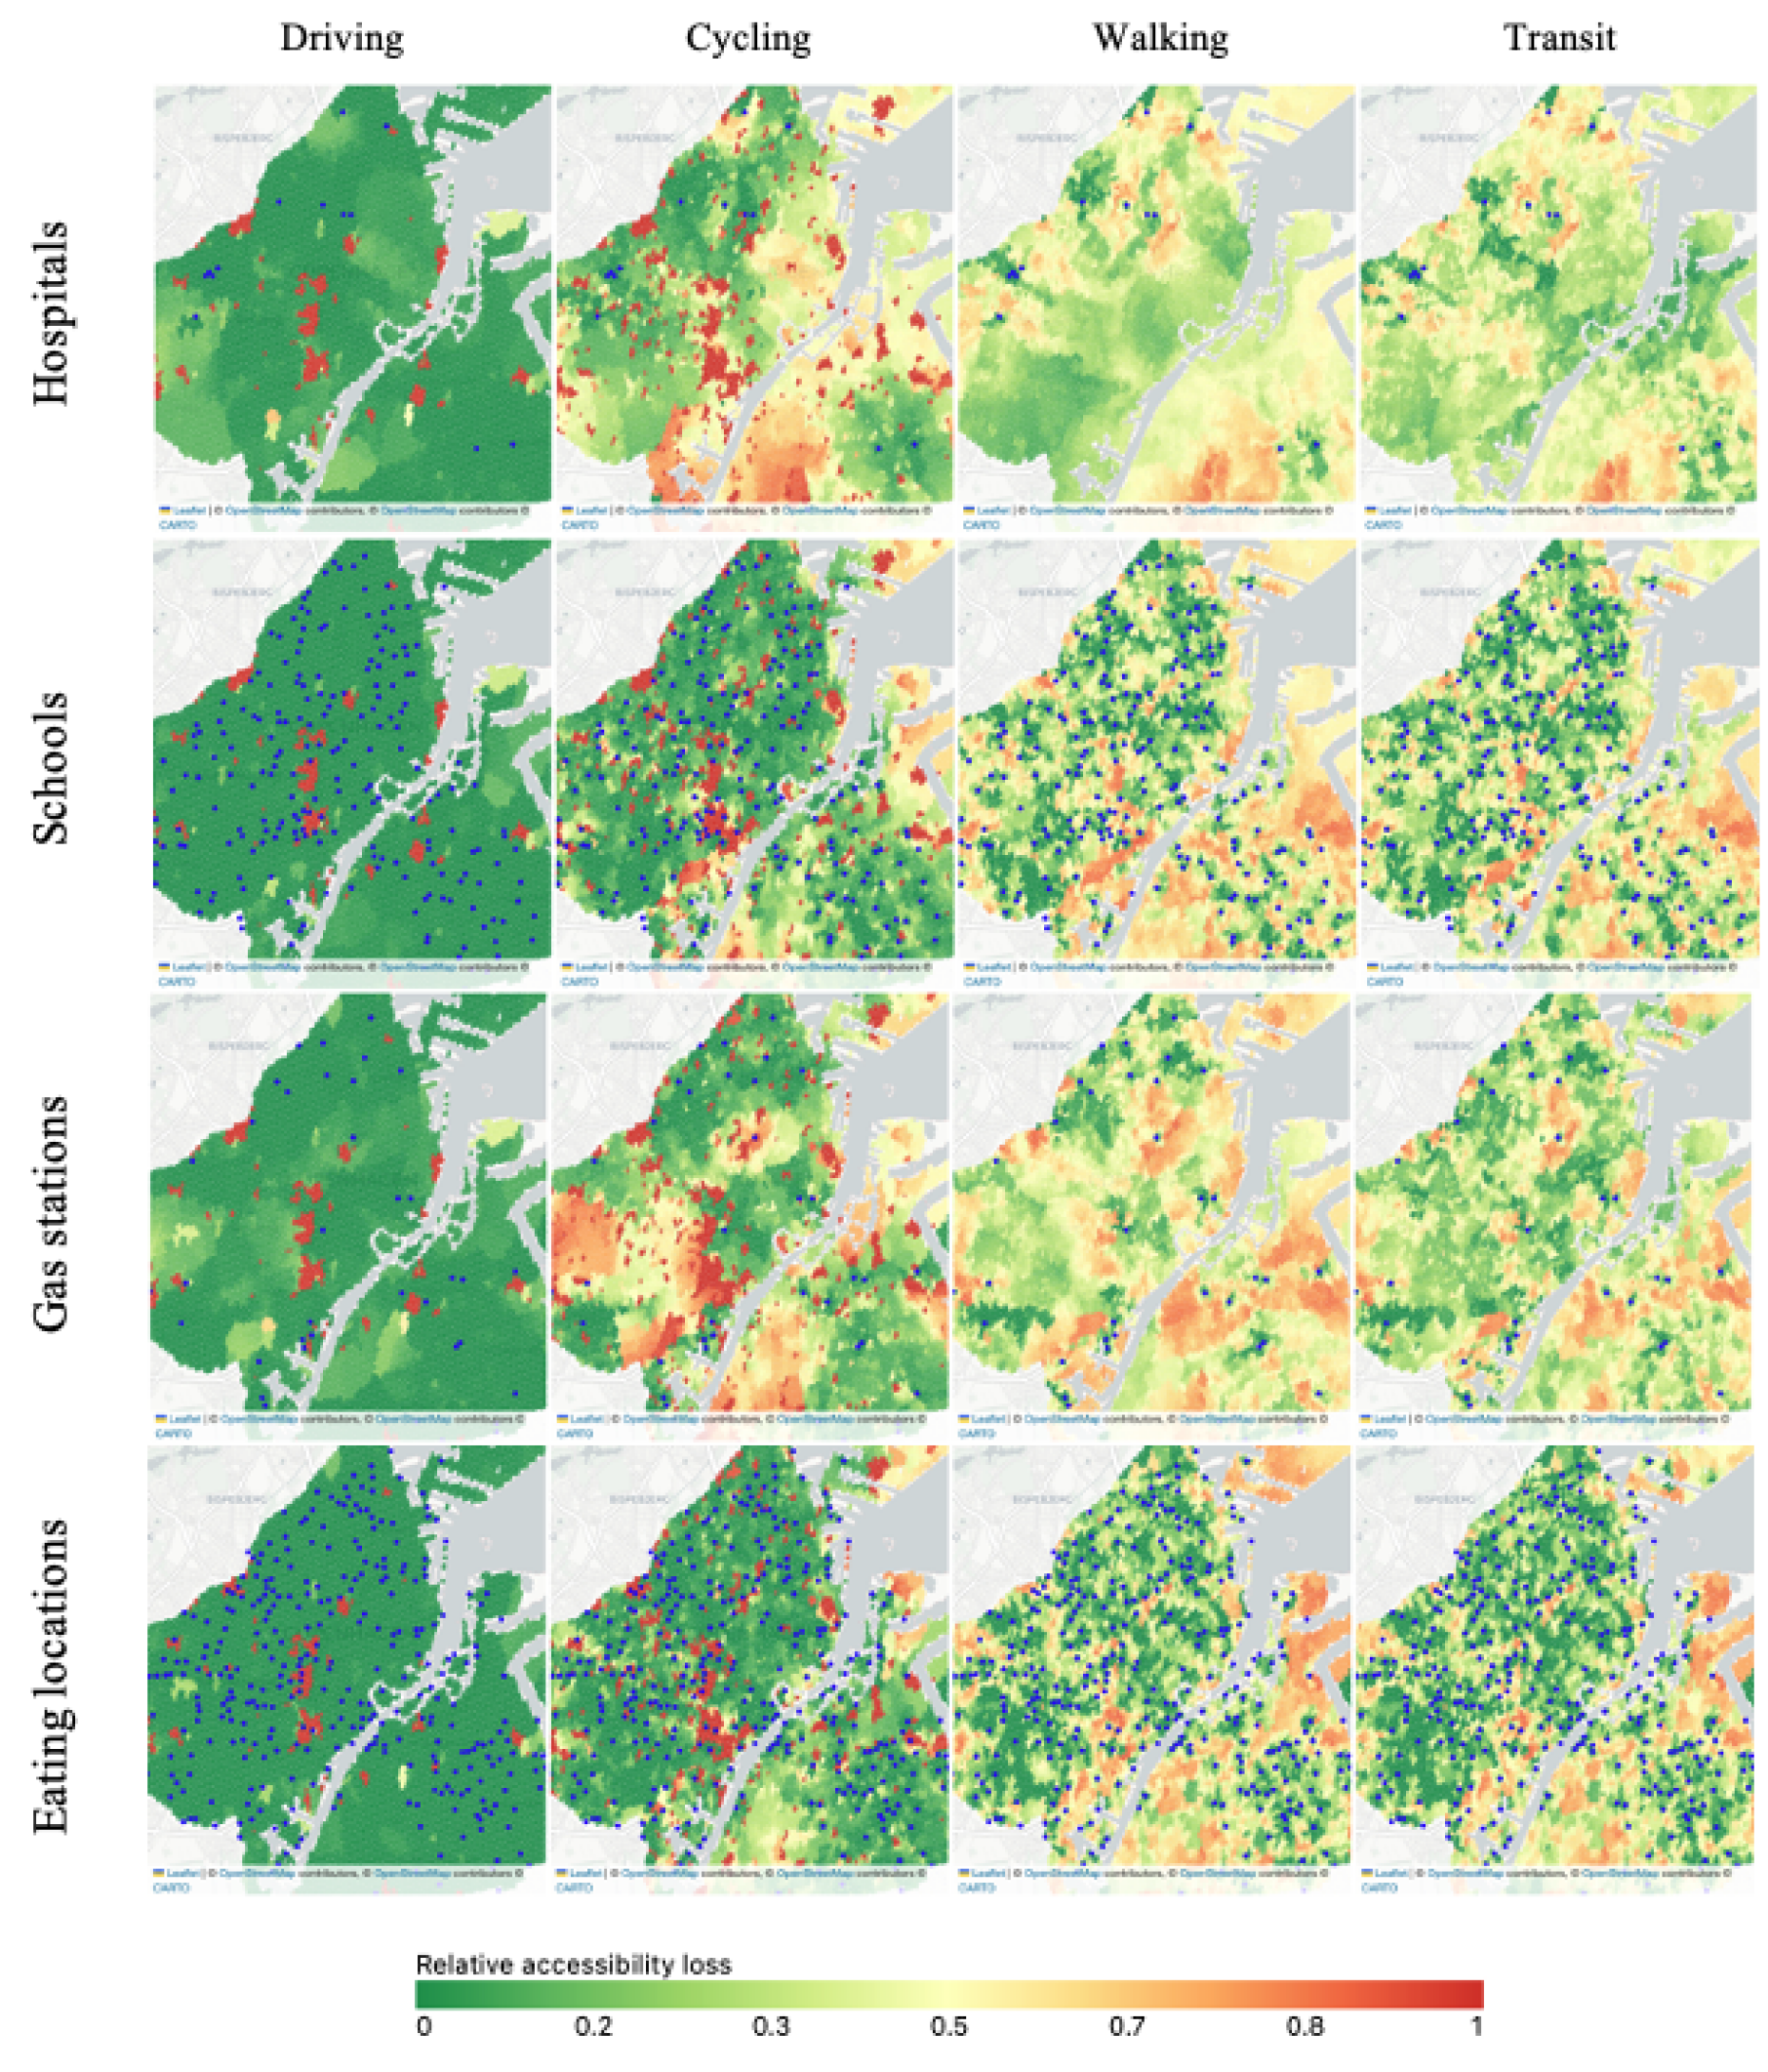
After mapping water depth through Copenhagen for a specific rainfall event, we compute transport accessibility loss to critical infrastructure, transport-related facilities, and everyday locations using gravity-based measures versus a baseline (i.e., no flood scenario). In essence, this accessbility loss accounts for changes in travel time caused by increased water levels or untraversable roads. To map indirect impacts from water depth on travel speed, we used the functions defined by Pregnolato et al. (2017); Finnis & Walton (2008). In essence, these modify travel speeds depending on water depths. For each transport mode specificially, travel speed is reduced incrementaly until a critical depth is reached, point at which a given segment (e.g., road) becomes untraversable. Gravity-based accessibility measures penalise locations that are further away (or take longer reach) while prioritizing those that are closer (Palacios & El-Geneidy, 2022).
To compute accessibility, we divided Copenhagen in small hexagons (approximate radius of 50 meters). For each one, we computed the travel time to the nearest location within three predefined categories: i) critical infrastructure, including fire departments, police stations, hospitals, and other health-related facilities such as pharmacies or clinics; ii) transport-related infrastructure, including electric vehicle charging locations, gas stations, and public transit stops; and iii) everyday locations, including venues for drinking (cafes, bars, pubs), dining (restaurants, fast food outlets, food courts), recreation (sports facilities, parks), education (schools), and shopping (supermarkets). For each area’s centroid, the shortest travel time to each of these locations was computed, forming the basis for our accessibility analysis. In parallel, we compute the same accessibility measures for the baseline case, to which we compute the associated accessibility loss.
Accessibility loss was then taken as the average loss of three widely used gravity-based accessibility functions to measure accessibility: inverse power (), negative exponential (), and modified gaussian (). These functions were applied to the estimated travel times () for a given trip with different impedance parameters () for different transport modes to accurately account for different rates of decline. For simplicity, our analysis does not differentiate by trip purpose or consider trip-specific parameters Li et al. (2018). Figure 4 showcases the relative accessibility loss for driving, cycling, walking, and transit trips in Copenhagen for a 100 mm intensity rainfall event.
A.4 Wellbeing Modelling Framework
For our wellbeing model we make use of the concept of motility to link changes in transport with individuals’ reported life satisfaction. This approach is based on previous research linking motility with various articulations of subjective wellbeing (e.g. De Vos et al. (2013); Shliselberg et al. (2020)).
Motility is distinguished from more traditional metrics used in transportation research because it incorporates an individual’s ability to be mobile as well as their attitudes towards being mobile alongside more typical metrics like accessibility. In our research, we use data gathered by the URGENT project to capture these socio-cultural and psychological dimensions of motility.
The URGENT survey is a 3-year, bi-annual panel survey (n = 12,118) that is designed to capture (among others) mobility behaviour, attitudes, norms, and constraints, alongside life and travel satisfaction in Denmark. To do this, it features a large amount of Likert-scale variables measuring respondents’ agreement with a series of statements and questions relevant to the survey’s remit.
For our preliminary motility model, we include 17 survey items related to the three dimensions of motility. These are:
- Access
-
PT access; Number of cars/household; Bike access
- Skills
-
Car license; PT smart card; Perceived ease of travel without car; Perceived ease of travel with PT; Perceived difficulties being mobile
- Attitudes
-
Self-identity as car user; PT hedonic pleasure; PT privacy needs; Self-identity as cyclist; Cycle weather sensitivity; Cycle autonomy; Cycle hedonic pleasure; Perceived mobility necessities.
An overview of the overall model structure (from PCA to cumulative link model) can be found in Figure 5.
These survey items are then scaled and centred to turn their values into z-scores. After this, they are subjected to a Principal Component Analysis with varimax rotation to support interpretability. Using Kaiser’s Criterion () we retain five rotated components for analysis, which cumulatively explain 64% of our 17 items’ variance. The PCA model fits reasonably well, with the Root Mean Square Residual (SRMR) being below 0.08 (0.07). The factor loadings for each retained component, as well as component labels can be found in Table 1.
The PCA motility components are then used as covariates in a Cumulative Link Model which estimates the relationships between the five motility components, a series of socio-demographic and economic control variables, and life satisfaction. These control variables are:
-
•
Income: an 11-point scale ranging from less than 10.000 dkk to more than 100.000 dkk net monthly household income.
-
•
Gender: a dummy variable indicating whether the respondent identifies as a woman or not.
-
•
Educational attainment: Highest level of education attained, values are ’Less than Secondary’, ’Vocational and Further Edcucation’, and ’Tertiary Education’.
-
•
Age category: Age category variable with a range from 18 to 80.
The dependent variable for the wellbeing model is a 5-point, self-reported Likert scale variable measuring a person’s satisfaction with life. Preliminary results of the cumulative link model, which describes the relationship between the motility components and life satisfaction, can be found in Table 2. Cumulative link models are a class of ordinal regression model.

| Item | Cycling Preference (20%) | Car Independence (16%) | Perceived Mobility Necessities (10%) | PT Access (10%) | PT Attitude (8%) |
| Access | |||||
| PT access | 0.11 | 0.25 | -0.05 | 0.67 | 0.21 |
| Number of cars/household | -0.17 | -0.71 | 0.11 | -0.18 | 0.00 |
| Bike access | 0.54 | -0.22 | 0.00 | 0.27 | -0.10 |
| Skills | |||||
| Car license | 0.13 | -0.71 | -0.06 | 0.13 | 0.02 |
| PT smart card | 0.04 | 0.13 | -0.03 | 0.52 | 0.12 |
| Perceived ease of travel without car | 0.34 | 0.67 | -0.22 | 0.30 | 0.05 |
| Perceived ease of travel with PT | 0.13 | 0.48 | -0.15 | 0.54 | 0.23 |
| Perceived difficulties being mobile | -0.15 | 0.18 | -0.02 | -0.60 | 0.19 |
| Attitudes | |||||
| Self-identity as car user | -0.25 | -0.69 | 0.13 | -0.14 | -0.08 |
| PT hedonic pleasure | 0.06 | 0.18 | 0.05 | 0.18 | 0.75 |
| PT privacy needs | -0.11 | 0.11 | 0.15 | -0.01 | -0.77 |
| Self-identity as cyclist | 0.92 | 0.20 | -0.02 | 0.08 | 0.10 |
| Cycle weather sensitivity | 0.84 | 0.25 | -0.01 | 0.03 | 0.05 |
| Cycle autonomy | 0.66 | 0.37 | -0.16 | 0.22 | 0.09 |
| Cycle hedonic pleasure | 0.88 | 0.03 | -0.01 | 0.04 | 0.14 |
| Life organisation requires mobility | -0.05 | -0.15 | 0.89 | -0.05 | -0.04 |
| Obligations require mobility | -0.02 | -0.07 | 0.90 | -0.04 | -0.06 |
| Variable | Estimate | Std. Error | z-value | Significance |
|---|---|---|---|---|
| Cycling Preference | 0.22 | 0.04 | 5.75 | *** |
| Car Independence | -0.34 | 0.04 | -7.87 | *** |
| Perceived Mobility Necessities | 0.09 | 0.04 | 2.46 | * |
| PT Access | 0.23 | 0.04 | 5.75 | *** |
| PT Attitude | 0.23 | 0.04 | 5.76 | *** |
| Income | 0.14 | 0.02 | 8.19 | *** |
| Gender | 0.21 | 0.08 | 2.74 | ** |
| Educational attainment: Vocational and Further Education | 0.21 | 0.13 | 1.60 | |
| Educational attainment: Tertiary Education | 0.24 | 0.13 | 1.83 | . |
| Age category: 25-29 | 0.05 | 0.22 | 0.22 | |
| Age category: 30-34 | 0.25 | 0.22 | 1.14 | |
| Age category: 35-39 | 0.04 | 0.19 | 0.21 | |
| Age category: 60-69 | 0.53 | 0.21 | 2.54 | * |
| Age category: 70-80 | 0.52 | 0.23 | 2.23 | * |
A.5 Reinforcement Learning
Given the above IAM framework, we seek to identify the best sequence of adaptation measures that maximise individuals’ wellbeing (as defined above). Reinforcement learning is a sub-field of machine learning that uses an agent-based approach learn what is the best action (adaptation measure) to take at any given time step in order to maximise a pre-defined cumulative reward function (wellbeing) (Sutton & Barto, 2018). By default, the environment is defined as a Markov Decision Process (Bellman, 1957), where each state is independent.
Albeit many adaptation measures can be devised, in this first work, we define four possible adaptation measures: increase street drainage, implement permeable pavements, implement an early warning system, and increase emergency services and critical infrastructure resources. At each time step, our RL agent takes one of these actions on a specific Copenhagen area (equivalent to the ones defined in the transport model) and and collects information about its state (e.g., precipitation event, period of time, direct and indirect impacts per zone, water depths on roads). In the end, this trial-and-error approach can effectively learn the best set of actions to take over time and space to maximise wellbeing.
Currently, early experiments are being run with our framework to identify good long term policies. Current efforts are focusing on comparing state of the art learning algorithms and comparing results to a set of baselines to determine the best framework and hyperparameters that yield the highest discounted sum of rewards. Currently, we are testing two RL learning algorithms: Proximal Policy Optimization (PPO) (Schulman et al., 2017) and Importance Weighted Actor-Learner Architectures (IMPALA) (Espeholt et al., 2018). Each one of these has its own strengths. PPO is a widely used algorithm that serves as an initial established base algorithm. The IMPALA algorithm, however, is applied to future-proof our project. As we develop the IAM to become more realistic, increase the number of actions and their complexity, and increase our case study’s area, we will use IMPALA together with distributed learning via the RLLib Python package (Liang et al., 2018) to overcome computing complexity and achieve robust results in a policy-relevant timeframe.