Physical Scales Matter: The Role of Receptive Fields and Advection in Satellite-Based Thunderstorm Nowcasting with Convolutional Neural Networks
Abstract
The focus of nowcasting development is transitioning from physically motivated advection methods to purely data-driven Machine Learning (ML) approaches. Nevertheless, recent work indicates that incorporating advection into the ML value chain has improved skill for radar-based precipitation nowcasts. However, the generality of this approach and the underlying causes remain unexplored. This study investigates the generality by probing the approach on satellite-based thunderstorm nowcasts for the first time. Resorting to a scale argument, we then put forth an explanation when and why skill improvements can be expected. In essence, advection guarantees that thunderstorm patterns relevant for nowcasting are contained in the receptive field at long lead times. To test our hypotheses, we train ResU-Nets solving segmentation tasks with lightning observations as ground truth. The input of the Baseline Neural Network (BNN) are short time series of multispectral satellite imagery and lightning observations, whereas the Advection-Informed Neural Network (AINN) additionally receives the Lagrangian persistence nowcast of all input channels at the desired lead time. Overall, we find only a minor skill improvement of the AINN over the BNN when considering fully averaged scores. However, assessing skill conditioned on lead time and wind speed, we demonstrate that our scale argument correctly predicts the onset of skill improvement of the AINN over the BNN after lead time. We confirm that generally advection becomes gradually more important with longer lead times and higher wind speeds. Our work accentuates the importance of considering and incorporating the underlying physical scales when designing ML based forecasting models.
This research tests the effectiveness of combining physically motivated algorithms with artificial intelligence for short-term thunderstorm forecasts. The neural network uses geostationary satellite imagery and lightning observations together with their advection forecasts as inputs for predicting the probability of lightning occurrence. Additionally, we propose a simple scale-based explanation for when and why incorporating physically motivated algorithms benefits convolutional neural networks, and we test this hypothesis. We find that our scale argument can roughly predict the onset of usefulness. The application of the scale argument is quite general and can aid in the development of improved forecasting models in multiple domains.
1 Introduction
Extreme weather events related to thunderstorm activity such as lightning, flash floods, hail and strong winds are responsible for severe economic loss (Hoeppe, 2016) and can be a threat to human life (Terti et al., 2017). Increases in severity and frequency of thunderstorms driven by climate change are expected (Diffenbaugh et al., 2013; Rädler et al., 2019; Raupach et al., 2021). This necessitates timely and accurate very short-term forecasts also known as nowcasts (Bojinski et al., 2023). Physically motivated nowcasting methods rely on advection and empirical handcrafted rules derived from experience (Wang et al., 2017) and are at present dominant in operational use (James et al., 2018; Pulkkinen et al., 2019, 2020; Müller et al., 2022).
The data driven nature of nowcasting implies ML methods to be a promising alternative. Indeed the main focus in the development of state of the art nowcasting techniques relies on deep learning specifically (Ravuri et al., 2021; Zhang et al., 2023). However, it is currently unsettled how to make the best use of ML in this context. Hence, prior work mainly focuses on optimizing the ML workflow as seen in the strong heterogeneity across all relevant parts of the value chain: Considered hazards include precipitation (Zhao et al., 2024), lightning (Geng et al., 2021) and hail (Leinonen et al., 2023b). Ground truth candidates are direct (Wang et al., 2023), thresholded (Ortland et al., 2023) observations or human labels (Cintineo et al., 2020). ML tasks scan classification (Vahid Yousefnia et al., 2024b), segmentation (Lagerquist et al., 2021), supervised (Guo et al., 2023) and generative regression (Leinonen et al., 2023a). Data sources encompass various combinations of radar (Trebing et al., 2021), satellite (Brodehl et al., 2022) and lightning (Zhou et al., 2020) observations as well as weather stations (Andrychowicz et al., 2023), numerical weather prediction (Vahid Yousefnia et al., 2024a) or digital elevation models (Leinonen et al., 2022a). Strategies to address rare events or class imbalances manifest either in different under-sampling strategies in the dataset composition (Ayzel et al., 2020) or in loss function adaptations (Yang and Yuan, 2023). Furthermore, model architectures leverage building blocks of feedforward (Vahid Yousefnia et al., 2025), recurrent (Shi et al., 2015), convolutional (Han et al., 2022), graph neural networks (Farahmand et al., 2023) and Transformers (Bai et al., 2022).
Recent works indicate that including physics-informed domain knowledge in the form of advection directly into the ML value chain is a promising complementary route to improve nowcasting (Zhang et al., 2023; Ritvanen et al., 2023; Ha and Lee, 2023; Pavlík et al., 2024). All prior work in that direction focuses exclusively on radar-based precipitation nowcasting, but differs in the implementation details. Zhang et al. (2023) design a separate evolution network tasked with learning the advection, which is then boosted over by a GAN. In order to obtain a fully end-to-end optimizable model, they do not utilize traditional optical flow algorithms. Ha and Lee (2023) also boost over the advection but utilize multiple traditional optical flow algorithms by combining them with a regression model, which in turn serves as an additional input for a U-Net. Ritvanen et al. (2023) pursue a separate approach of employing a traditional optical flow algorithm to detach the growth and decay of rainfall from the advection. They achieve this by training a U-Net to learn the approximated time derivative of the precipitation field in the Lagrangian coordinates. Pavlík et al. (2024) extend the approach of Ritvanen et al. (2023). They keep the U-Net for learning the growth and decay but implement the transformation to Lagrangian coordinates in an end-to-end trainable fashion similar to Zhang et al. (2023).
The first aim of this work is to test the generality of the concept of combining advection with ML by shifting the hazard type from precipitation to lightning, the ML task from regression to segmentation, and the input data from radar to satellite and lightning data. While nowcasting based on radar data generally result in higher skill (Leinonen et al., 2022b), the proposed formulation of the nowcasting problem has some advantages: Geostationary satellite data is globally available and doesn’t suffer from beam blockage in mountainous orography (McRoberts and Nielsen-Gammon, 2017). Furthermore, prior work has shown that, in ML models, satellite imagery in combination with lightning data can be a decent substitute for radar (Leinonen et al., 2022b). Learning to segment lightning occurrence probabilistically, this approach also circumvents the observed inability of precipitation based regression tasks to nowcast extreme weather due to blurring (Ayzel et al., 2020) by directly focusing on the lightning activity associated with strong convective events. One disadvantage of this formulation, however, is that the input field (satellite and lightning data) is different from the output field (pixel-wise probabilities). This impedes recursive implementations as in Ha and Lee (2023) and a decoupling of advection from the growth and decay as is implemented by Ritvanen et al. (2023) and Pavlík et al. (2024). Therefore we opt for training a ResU-Net (Zhang et al., 2018) for each lead time to solve a semantic segmentation task. Binarised lightning observations serve as ground truth. The input of the Baseline Neural Network (BNN) are the two latest observations of four bands of the Meteosat Second Generation (MSG) satellite (Schmetz et al., 2002) and aggregated lightning observations. The Advection-Informed Neural Network (AINN) additionally receives the Lagrangian persistence nowcast of all input channels at the desired lead time. We observe significant average skill improvements of the AINN over the BNN on climatologically consistent test datasets only for lead times greater than .
The second aim of this work is to propose and test a possible explanation for why and under what conditions combining advection with CNNs can lead to improvements in spatiotemporal forecasting problems. Prior work only provides heuristic reasoning pointing to the complex multi-scale nature of the problem (Zhang et al., 2023). We propose a scale argument relating the underlying physical scales to the side length of the receptive field (Araujo et al., 2019), the intrinsic scale of CNNs. Put simply, the receptive field of any given pixel in the output is the field of vision of a neural network in the input. In particular, this is the only part that can influence the output of that specific pixel. The scale argument formalizes the idea that, for sufficiently high wind speed and lead time, the part of the remote sensing observations relevant to the nowcast lies outside of the field of vision of the CNN if it does not have access to the Lagrangian persistence nowcast. We test this scale argument by analyzing the relative skill increase of the AINN over the BNN dependent on wind speed and lead time. The observed onset of significant improvement confirms our prediction derived from the basic underlying scales.
Our results underscore the significance of being aware of the underlying physical scales that govern forecasting problems in general and that even in data-driven approaches these scales need to be addressed sufficiently. Furthermore, we offer a way to gauge the adequacy of CNN architectures for forecasting problems where the underlying scales can be estimated.
The structure of this work is as follows: In Section 2, a detailed description of the satellite and the lightning observations is given. Section 3 summarizes the advection algorithm, the semantic segmentation task, our neural network model, the dataset composition strategy and the evaluation metrics. Section 4 formally introduces the concept of the receptive field and the scale argument. In Section 5, we report on averaged and wind speed conditioned skill metrics and present a case study. Section 6 summarizes our work and elaborates on its implications.
2 Data
2.1 Area of Interest
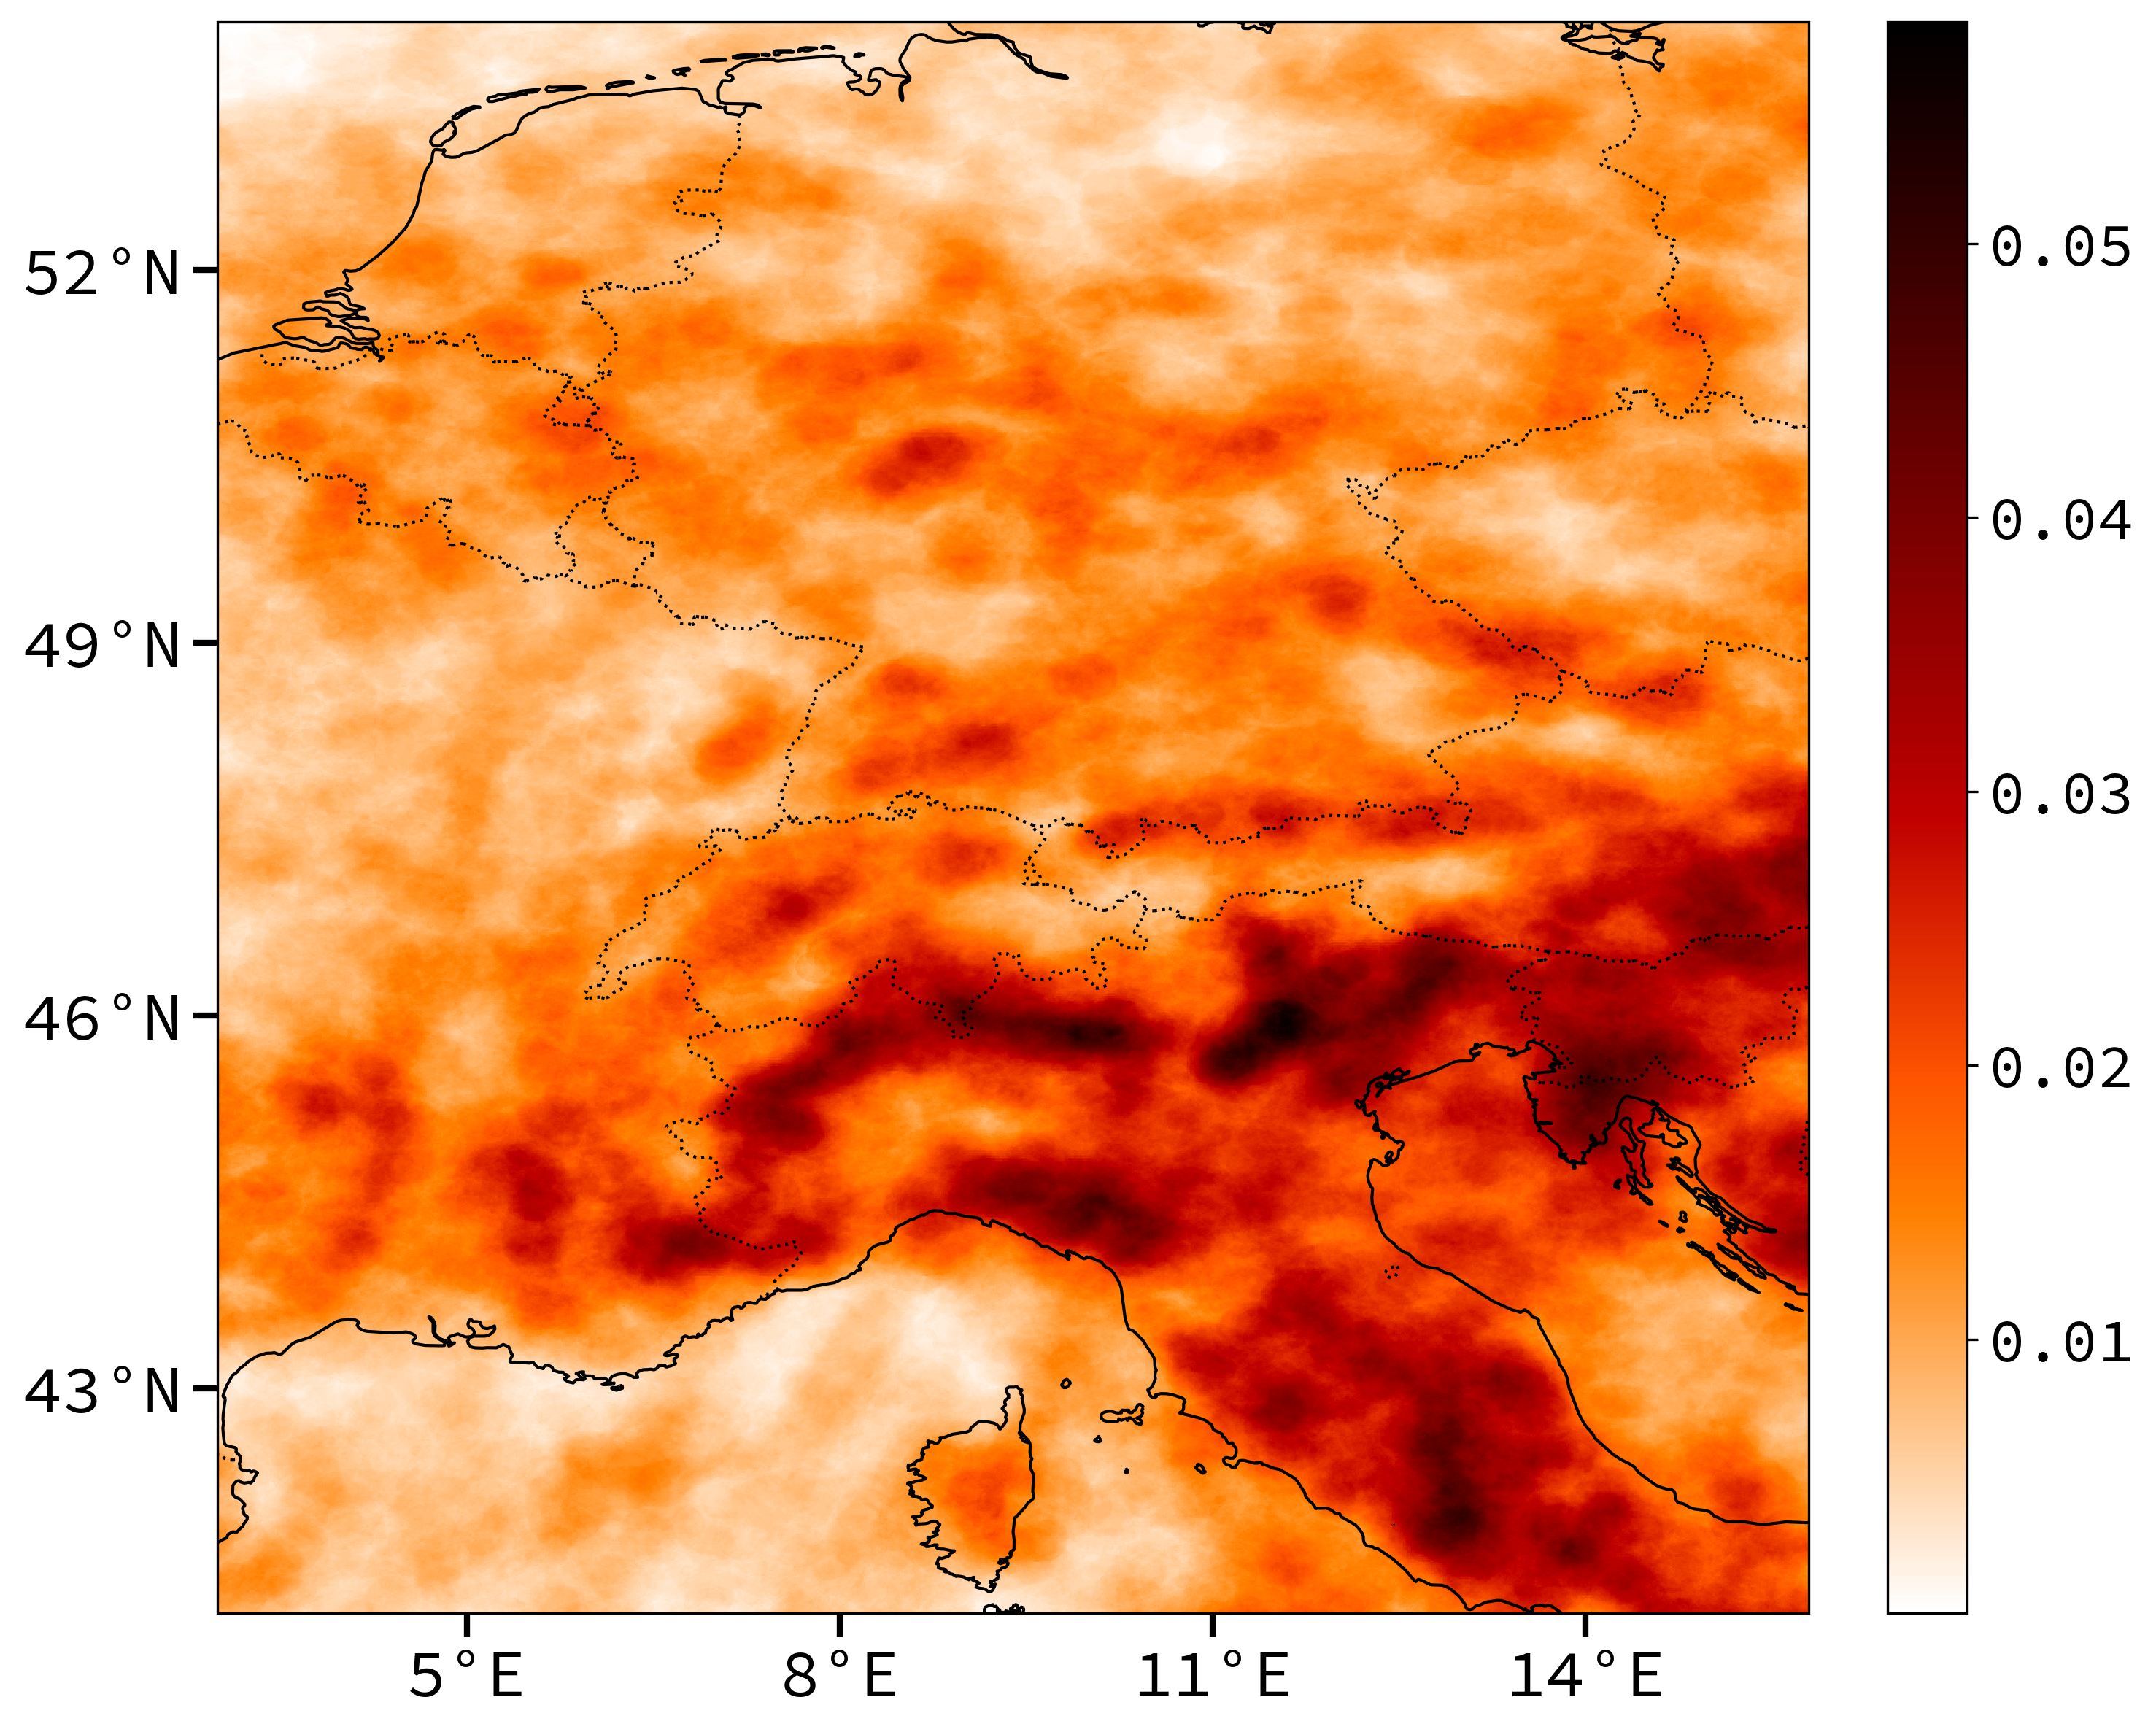
The area of interest of this study is roughly centered around the Alps containing among others parts of Germany, France, Italy, Austria and Switzerland. The reason for this choice is the strong thunderstorm activity in this region especially to the South of the Alps (Manzato et al., 2022). The region, additionally, covers various topographies such as parts of the Mediterranean Sea and the flat Netherlands that complement the mountainous terrain. Fig. 1 displays the area of interest and its lightning climatology calculated from the dataset employed in this study (Section 22.3). The geodetic coordinate reference system of choice is WGS84 (EPSG:4326). All data sources are processed on a regular grid with a spacing of () resulting in grid points. The high resolution is chosen to take full advantage of the high resolution visible (HRV) channel introduced in the following (Section 22.2).
2.2 Satellite Observations
Level 1.5 data of the SEVIRI instrument (Spinning Enhanced Visible Infra-Red Imager) onboard the Meteosat Second Generation (MSG) satellite (Schmetz et al., 2002) are used as input for the network. In full disk mode the SEVIRI instrument scans the Earth every with a spatial resolution for all channels, except for the HRV, of at sub-satellite point. This corresponds roughly to a resolution of in Central Europe. SEVIRI provides 2 visible (VIS) and 9 infrared (IR) channels for the full disk. The high-resolution visible (HRV) channel scans half of the disc with a sub-satellite resolution of . Based on previous studies (Mecikalski and Bedka, 2006; Mecikalski et al., 2010; Bedka et al., 2010; Leinonen et al., 2022b; Brodehl et al., 2022) only a subset of all channels is used for this work. It consists of the HRV, IR108, VIS008 and water vapor WV062 channels. The visible channels measure the reflectance of the Earth surface and atmosphere. Optically thick clouds are objects with high reflectance. The infrared channels measure the emission which depends on the temperature of the observed objects. High optically thick clouds are characterized by very low temperatures. The radiancies are converted to Brightness Temperatures (BT). All channels are resampled onto the grid defined in Section 22.1 using pytroll (Raspaud et al., 2018). All pixel values are individually shifted and scaled by the training set channel-wise () mean and standard deviation before entering the network:
| (1) |
2.3 Lightning Observations
Lightning observations from the LINET lightning network (Betz et al., 2009) constitute a further data source for the input of the network and they serve as the ground truth of the thunderstorm segmentation task. This is a common choice (Ukkonen and Mäkelä, 2019; Geng et al., 2021; Leinonen et al., 2022a; Vahid Yousefnia et al., 2024b) justified by a high and uniform detection efficiency ( for LINET) and spatial accuracy ( for LINET). The tabular data is translated onto the grid by the following procedure: For each lightning stroke at position and time we increment the number of strokes at grid position at time by 1 if two conditions are satisfied
| (2) |
where denotes the geodesic distance between and on a the WGS84 ellipsoid. The spatial and temporal thresholds used in this study read and . The time adopts the equivalent discrete values predetermined by the MSG satellite observations. The binary value for the ground truth of the segmentation task is then determined by the condition . Since the number of strokes vary over multiple orders of magnitude and almost of all grid points get assigned the value , the distribution of can not be naively shifted and scaled for the lighting input channel using Eq. 1. Therefore, we first scale logarithmically
| (3) |
and then shift and scale according to Eq. 1, which is the final form of the lightning input channel of the networks.
3 Methods
In this section, we introduce the three methods to nowcast thunderstorms (as defined by lightning) used in this study. We refer to the hybrid advection-ML model as Advection-Informed Neural Network (AINN). For comparison, we use the same ML model without advection, called Baseline Neural Network (BNN) and a physically motivated nowcasting, implemented as a Lagrangian Persistence Nowcast of the Lightning channel (LPNL). Both ML models yield probabilistic forecasts while LPNL makes categorical predictions.
3.1 Advection
The problem of nowcasting is commonly partitioned into an advection and a life-cycle component (Bowler et al., 2006; Pierce et al., 2012; Prudden et al., 2020). For each channel of the remote sensing observations (c.f. Section 2) and under the assumption of divergence free motion fields this notion is described by the advection equation:
| (4) |
where is a source-sink term referred to as the life-cycle. For short lead times the left hand side of the equation (the advection of thunderstorm cells along with the large scale wind) is assumed to dominate the error of the nowcast, while the right hand side (internal dynamics) is negligible, implying . This reduces the advection equation to a continuity equation. A nowcast performed on this basis is referred to as a Lagrangian persistence nowcast.
We implement all Lagrangian persistence nowcasts with the pySTEPS library (Pulkkinen et al., 2019), which has been shown to work well with satellite data before (Burton et al., 2022; Smith et al., 2024). The motion fields are estimated based on the default configuration of the dense Lucas–Kanade algorithm (Lucas and Kanade, 1981; Bouguet, 2001) using the last two observations. The advection is performed based on the backward interpolate-once semi-Lagrangian extrapolation scheme (Germann and Zawadzki, 2002). The AINN detailed in Section 33.2 utilizes the Lagrangian persistence nowcast of all input channels. The motion field is calculated for each channel individually except for the lightning channel, which is advected based on the motion field of the WV062 channel as optical flow algorithms like Lukas-Kanade struggle with very sparse fields (Müller et al., 2022). Lagrangian Persistence Nowcast of the Lightning channel (LPNL) is one of the models evaluated in the results section Section 55.2). It represents the class of physically motivated algorithms.
3.2 Neural Network
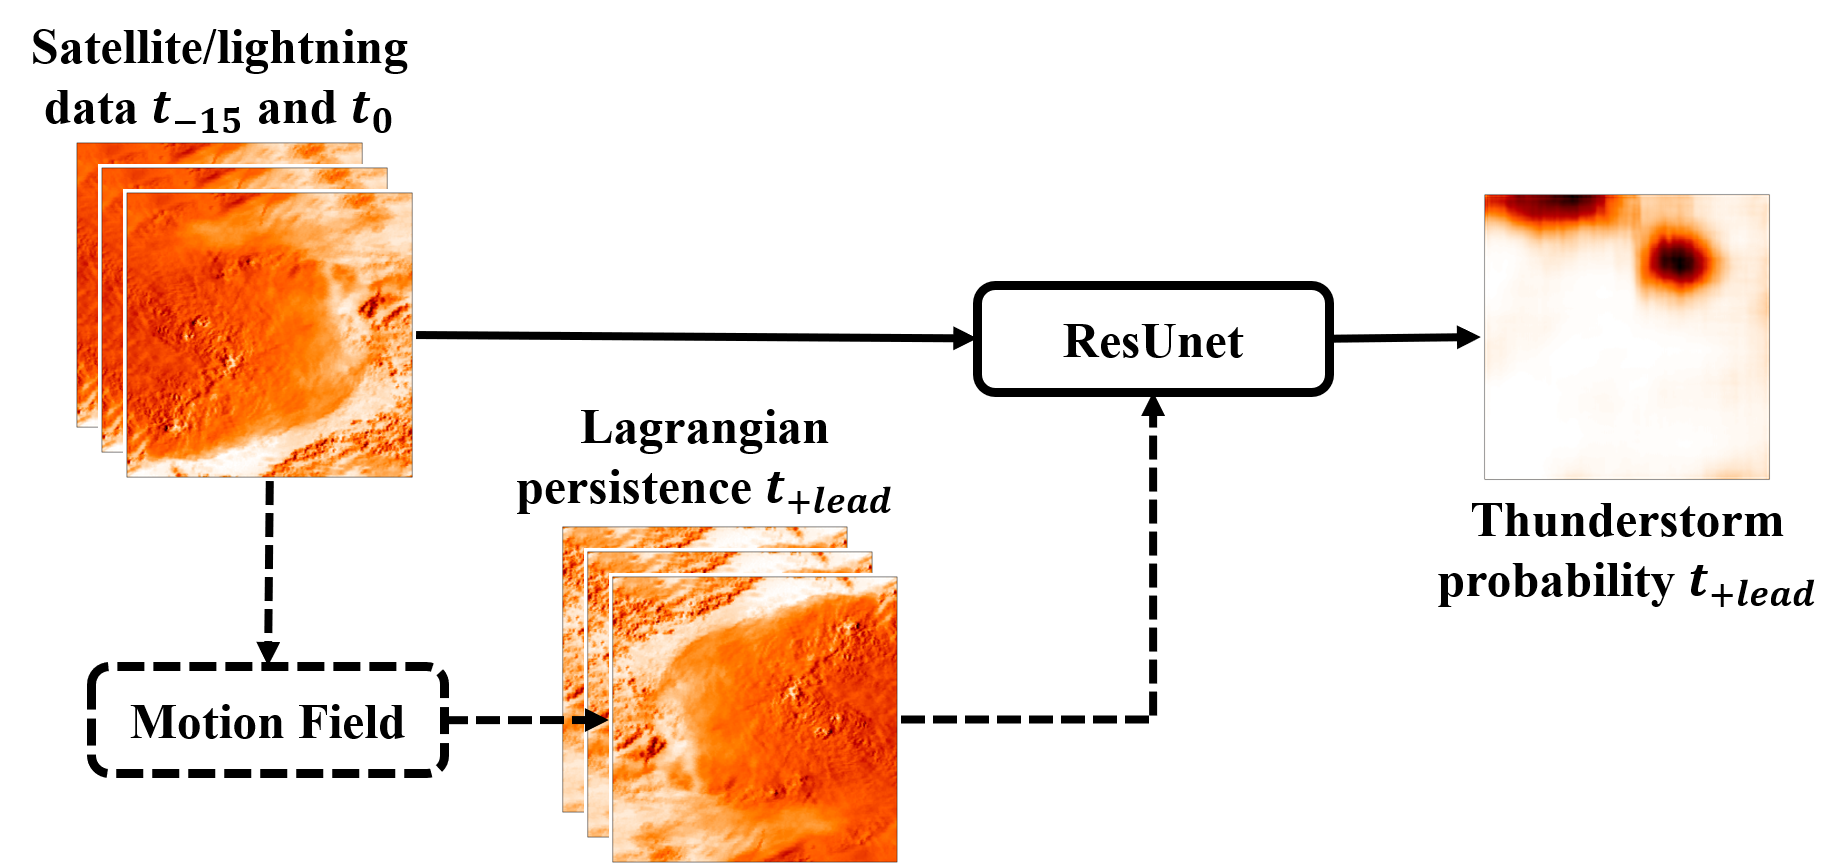
Let denote the lead time and the model class. The aim of our neural network models is to forecast the pixel-wise probability of thunderstorm occurrence at given an array of satellite and lightning observations. Here is the number of input channels (four satellite and one lightning channel). denotes the number of time-steps, which depends on the model class. The Baseline Neural Network (BNN) receives the last two observations, thus . Whereas the Advection-Informed Neural Network (AINN) additionally receives the Lagrangian persistence nowcast of each channel, thus . and represent the height and width of the input patch. Formally this constitutes a binary segmentation task:
| (5) | ||||
| (6) |
where denote the learnable parameters of the models. The number of learnable parameters is the same for all models and equal to 1,633,769. For each lead time and model class a neural network is trained with a data set consisting of tuples. is the label indicating pixel-wise thunderstorm occurrence (where 1 represents thunderstorm occurrence and 0 represents no thunderstorm occurrence). All datasets are discussed in detail in Section 33.3. A flowchart of the value chain for both model classes is illustrated in Fig. 2.
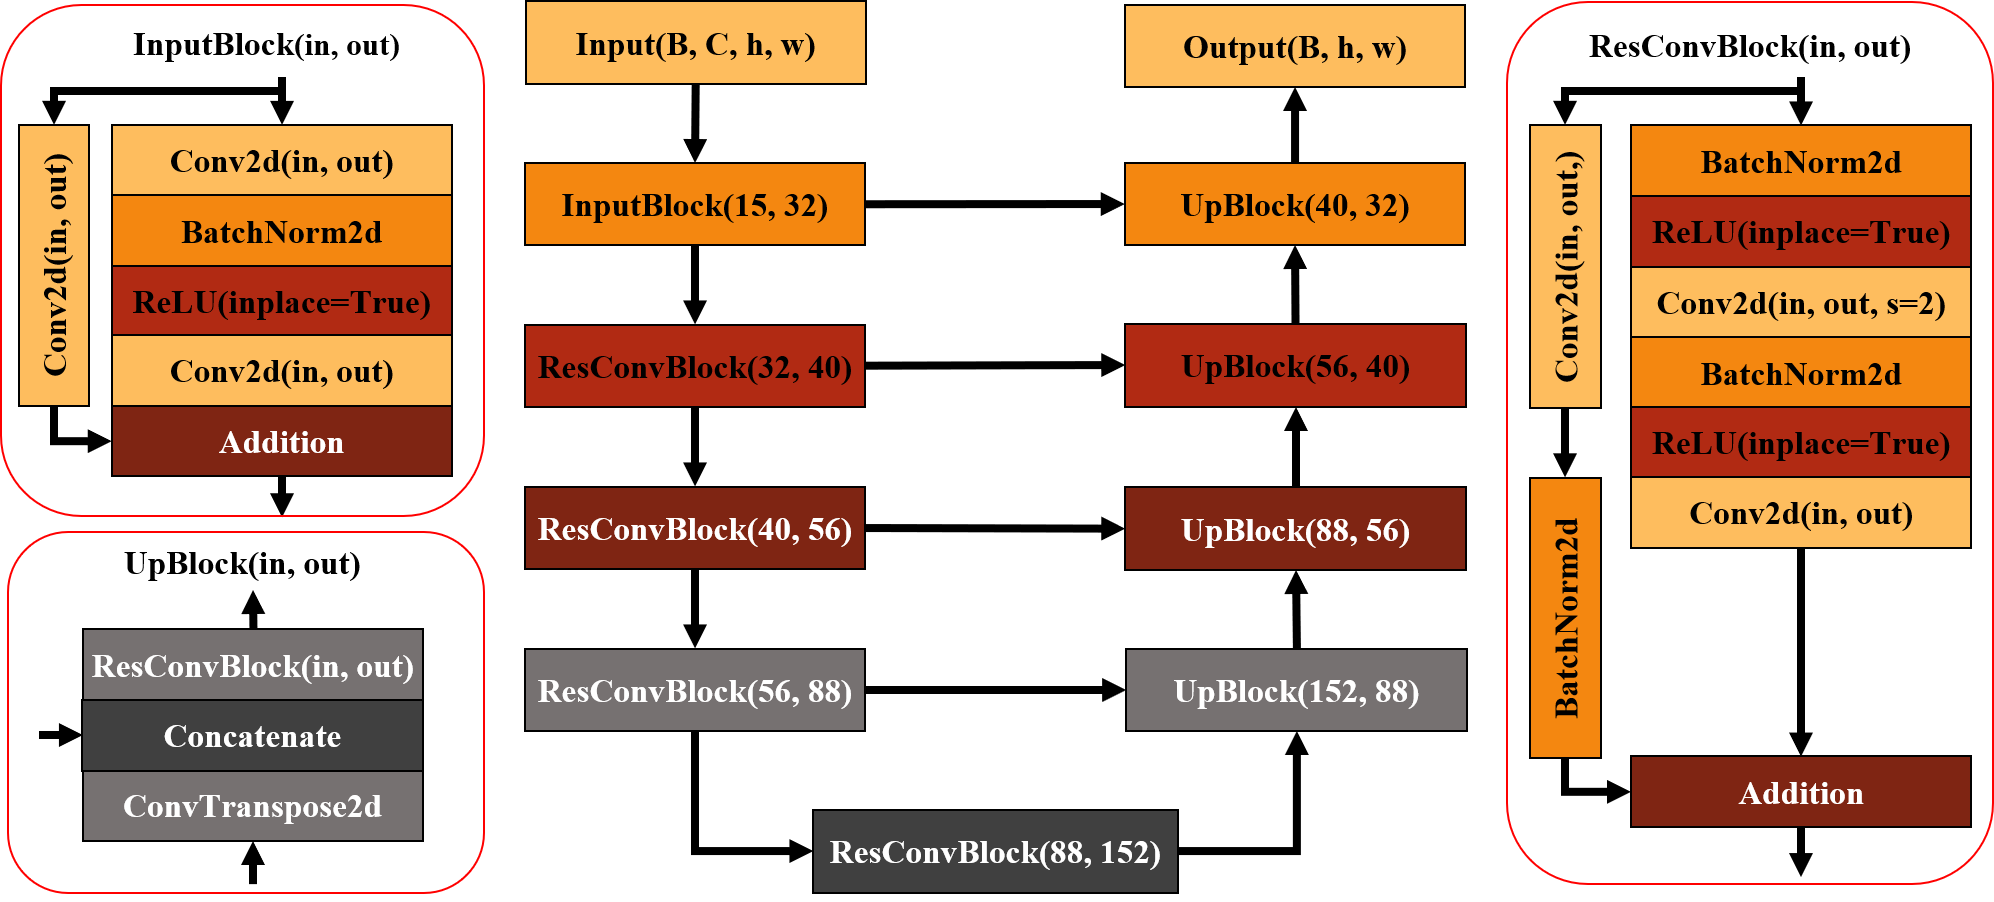
The U-Net (Ronneberger et al., 2015) and its many variants are still ipso facto the standard model of most image segmentation problems (Azad et al., 2024). It is also heavily featured in ML-based nowcasting models (Ayzel et al., 2020; Cintineo et al., 2022; Brodehl et al., 2022; Ortland et al., 2023) and the architecture chosen for most of the previous work on combining advection with ML (Ritvanen et al., 2023; Ha and Lee, 2023; Pavlík et al., 2024). Therefore, we also settle for a variant of the U-Net, specifically the ResU-Net (Zhang et al., 2018). The specific implementation and architecture hyperparameter are detailed in Fig. 3. We tested multiple versions of the vanilla U-Net and the ResU-Net including 3 dimensional convolutions and enhancements to the bottleneck with multi-head attention and ConvLSTM blocks for better utilization of the information along the time dimension. However, we found that all these modifications underperformed the simpler implementation, where only 2 dimensional convolutions are used and the time dimension is simply absorbed in the channel dimension: .
The networks are implemented and trained using pytorch (Paszke et al., 2019). We optimize the binary cross-entropy with the adam optimizer (Kingma and Ba, 2014) enforcing an L2 regularization of . All other parameters are set to their default value. The networks are trained for epochs with a batch size of . We employ the ReduceLROnPlateau learning rate scheduler with parameters factor = 0.1, patience = 5, cooldown = 3. The validation loss is monitored during training to ensure no overfitting. For each lead time and model class the epoch with the smallest validation loss is chosen. The training takes on average for the BNN and for the AINN on a single NVIDIA HGX A100 80GB 500W GPU.
3.3 Dataset Composition
This study utilizes data collected during the summer months from May to October in the years 2018 and 2019. The data is split into three disjoint sets . This is performed similarly to Vahid Yousefnia et al. (2024b): From the available daily samples, we randomly assign 256 days to the training set, while allocating 55 days each to validation and test sets. To minimize information leakage between datasets we define the start of a day to be at 0800 UTC and discard all data where the time of the nowcast (time of the ground truth lightning observations) is between 0800 UTC and 0900 UTC of each day, which we observe to be the hour of minimal lightning activity for our data set. Inspired by Brodehl et al. (2022) the area of interest defined in Section 22.1 is subdivided into 25 regular crops of size 256 256 that overlap by 64 pixels in both spatial directions. This yields three collections of ground truth crops .
For the final datasets are obtained by removing all samples that would require missing or corrupted satellite data as input. This step introduces a dependency on the lead time and impedes choosing the exact same lead time independent label set for all models. However, they differ by at most . The resulting datasets feature a climatologically consistent lightning frequency.
In the case of , all corrupted samples are removed. But, there is a strong class imbalance present in the dataset evidenced by the fact that only of all pixels are lightning pixels. This is addressed by under-sampling the majority class akin to Cintineo et al. (2022): We calculate the fraction of lightning pixels of each label crop in and then randomly disregard a portion of the crops with no lightning activity such that the fraction of lightning pixels is equal to for the training set. As a consequence only of training crops do contain no lightning pixels at all.
Exemplary for this approach results in 137,449 crops in the training set, 125,550 in the validation set and 126,125 in the test set.
3.4 Evaluation
The AINN and BNN models output probabilistic forecasts, while the LPNL yields categorical predictions. This fundamental difference necessitates separate evaluation techniques.
Forecasts like the LPNL that output binary predictions are evaluated with skill scores calculated from the 2 2 confusion matrix. It captures the counts of true positives (TP), false positives (FP), false negatives (FN), and true negatives (TN) (Wilks, 2019). The information dimensionality of the confusion matrix is three. Therefore, it is possible to in principle fully characterize the performance of a model with a well chosen triplet of scores (Stephenson, 2000). One such example is the HBF triplet: the hit rate (), the false alarm rate (), and the bias ratio (B). These metrics are defined as:
| (7) |
However, for rare events like thunderstorms it is convention to focus on skill scores specifically designed for this situation, such as the Critical Success Index (CSI):
| (8) |
As the CSI lacks equitability, which means that it does not rate random forecasts and all constant forecasts equally, we choose the Peirce Skill Score (PSS) as the primary categorical skill score for this study. It is both equitable and specifically suited for rare event verification:
| (9) |
To compare the LPNL to the neural network models, we threshold the probabilistic outputs such that at each lead time the CSI is maximized.
When comparing the BNN to the AINN we employ evaluation techniques that heed their probabilistic nature. Reliability diagrams (Bröcker and Smith, 2007; Wilks, 2019) compare predicted probabilities with observed event frequencies. To that end we partition the probability range into bins and assign each forecast pixel to its corresponding bin based on its predicted probability. For each bin , we compute the observed event frequency and the bin-averaged forecast probability . A well-calibrated model exhibits a calibration curve close to the diagonal , indicating that predicted probabilities accurately reflect observed frequencies. In addition to the calibration curve, we also examine the distribution of forecast probabilities called the refinement distribution, which provides insight into the model’s ability to distinguish between the positive and negative class. A skillful model not only produces well-calibrated probabilities but also assigns higher probabilities to events more frequently than climatology, demonstrating good resolution.
The skill score of choice for probabilistic models is the Brier Skill Score (BSS). It measures the improvement of the Brier Score (BS) relative to a reference forecast, in our case the climatology . The BS is a strictly proper scoring rule (Winkler and Murphy, 1968), meaning that it encourages honest probabilistic predictions rather than overconfident or underconfident forecasts and is essentially the mean squared error of the probability forecasts. With indicating the Frobenius norm it is defined as:
| (10) |
| (11) |
4 Receptive Field and Scale Argument
To our knowledge, there is no detailed explanation for the fact that combining advection algorithms with CNNs can be beneficial. State of the art classical nowcasting methods can determine the advection of cells adequately. They are mostly limited by their inability to model the life-cycle (Germann and Zawadzki, 2002; Pierce et al., 2012). Deep learning models, however, capture some aspects of the life-cycle (Ayzel et al., 2020). Therefore, if ML models have sufficient capacity there is no apparent reason why they should lack the ability to learn advective transport, which classical methods capture suitably.
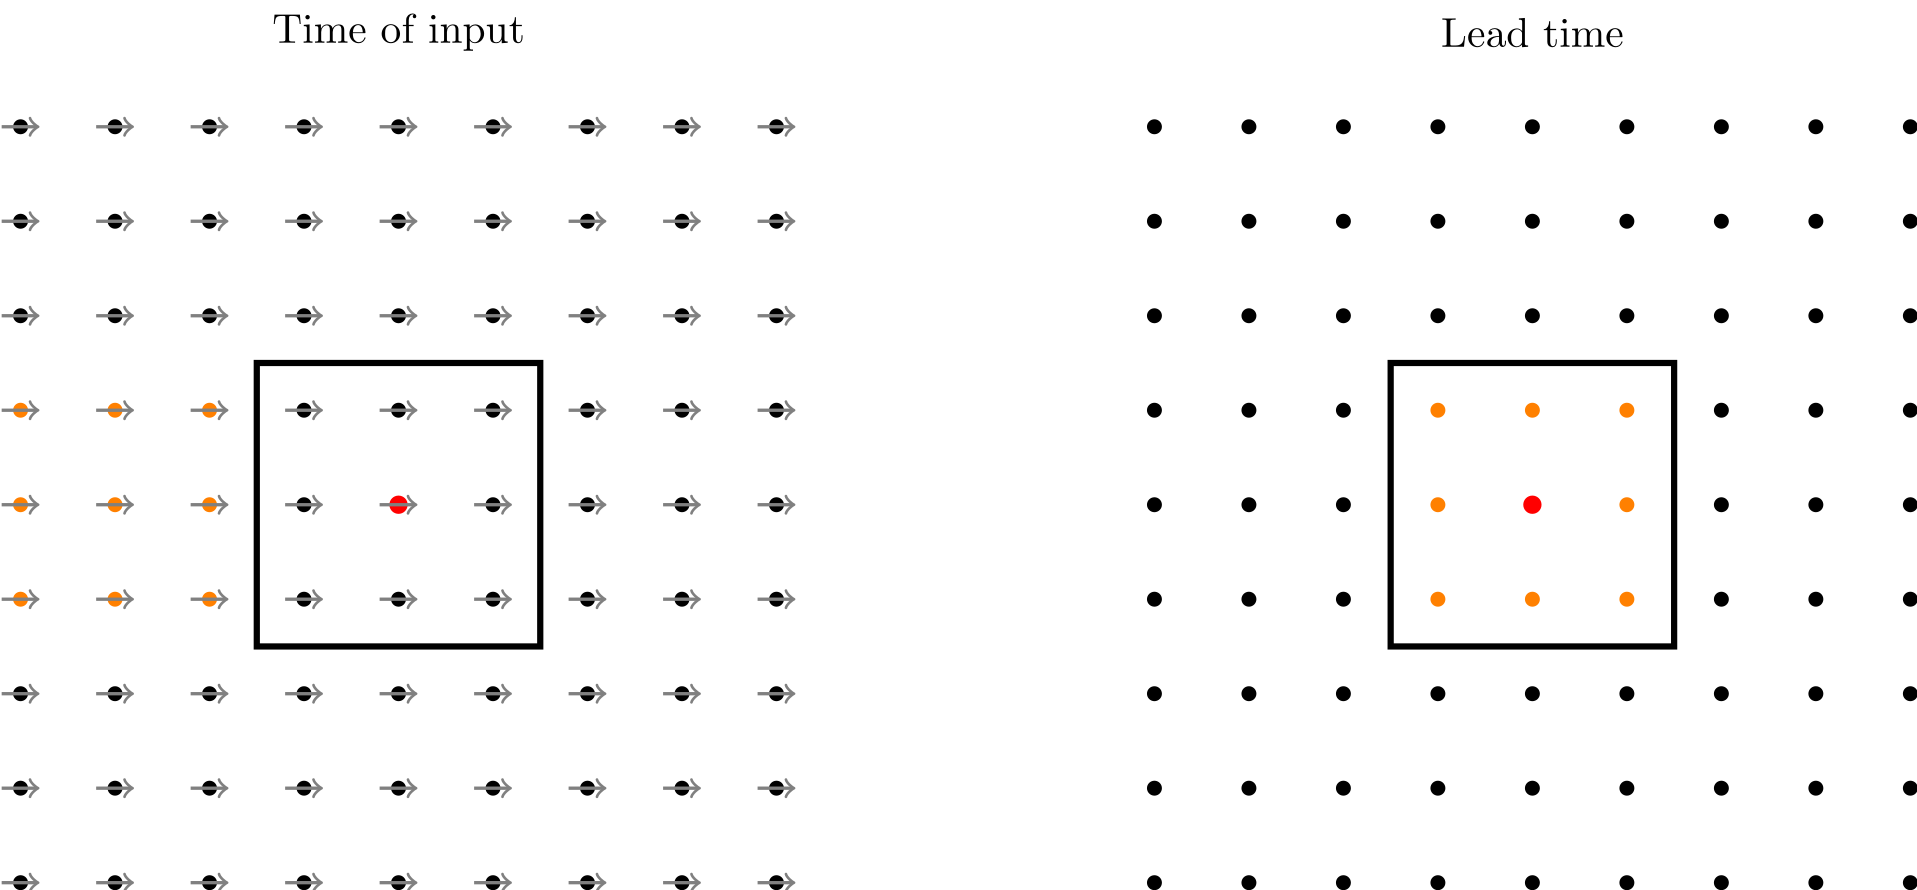
We argue that the benefit is connected to the concept of the receptive field of CNNs (Araujo et al., 2019). For each pixel in the output map the receptive field is the collection of points in the input that can influence that pixel. Therefore, the receptive field can be conceived as the field of vision of a CNN. Put differently, whatever is not in the box at the initial time cannot be utilized by the neural network to infer thunderstorm occurrence at the desired lead time. For high wind speeds and long lead times it is possible that the part of the remote sensing observations that is most relevant to the nowcast of a specific pixel is not within its receptive field as it will only be transported there through the advection at a later time. This idea is illustrated in Fig. 4 and formalized through a scale argument:
For standard CNNs the receptive field is a quadratic box with some side length . Including the Lagrangian persistence nowcast in the input as is the case for the AINN should only lead to significant improvements over the BNN when the spatial scale derived from the large scale wind speed and lead time is approximately equal to or greater than :
| (12) |
This implies that the part of the atmosphere that is relevant to forecasting a specific pixel (as this is the part of the atmosphere that will surround the location of the pixel at the desired lead time) can not influence the networks decision anymore if it does not have access to the Lagrangian persistence nowcasts obtained from the advection. It is important to stress that this scale argument only applies directly to implementations, where the ML models boost over the advection as in Zhang et al. (2023); Ha and Lee (2023) and not to implementations that disjoin the advection from the life-cycle (Ritvanen et al., 2023; Pavlík et al., 2024), as they additionally improve the model by forcing it to learn the growth and decay part so there is an additional mechanism at work.
The theoretical maximum side-length of the receptive field can be computed for CNNs from the following formula:
| (13) |
where is the number of layers, is the filter size of the th layer and is the stride of the th layer (Araujo et al., 2019). Substituting in the values for our ResU-Net we arrive at the result of . From this analysis we conclude that for a lead time of it would require a large scale wind speed of for the advection nowcast to benefit the ML model. These are wind speeds that are at the very upper end compared to radiosonde measurements in the troposphere (Krüger et al., 2024) (we want to stress here again that the scale argument presupposes to be the large scale wind). Therefore, this implies that the AINN should start to noticeably outperform the BNN on a representative sample only for lead times greater than . We test this in Section 55.2. A further implication of this scale argument is that the relative skill increase of the AINN over the BNN should increase with lead time and wind speed. This is put to the test in Section 55.3.
5 Results
In this section we present our results. First we compare the AINN to the LPNL with categorical skill scores on climatologically consistent test data sets. Then we move on to evaluations of the AINN compared to the BNN that heed their probabilistic characteristics. In the course of this we perform three types of analysis, which are presented in decreasing order of generalizability and thus importance: Fully averaged skill metrics, conditioned skill metrics and a case study.
5.1 Categorical Skill Metrics
To start things off we compare the skillfulness of the AINN to the LPNL. The values of the categorical skill scores, which are introduced in Section 33.4, are summarized in Table 1. All values are calculated on the test sets for all lead times, which are then averaged to have a single score per model.
| Skill Score | AINN | LPNL |
|---|---|---|
| PSS | ||
| H | ||
| F | ||
| B | ||
| CSI |
The AINN outperforms the LPNL on all scores considered in this work. Notably, the out-performance on all members of the HFB triplet implies that the AINN is superior to the LPNL in all aspects: The higher hit rate H signals a better ability to detect thunderstorms when they do occur, while the lower false alarm rate indicates less missed warnings. The bias B of the AINN is also closer to the perfect score of meaning the frequency of predicted thunderstorms is closer to the frequency observed in the data. However, both models over-predict the occurrence of thunderstorms. The significantly higher CSI corroborates the notion that the skill improvement is not just due to less TN. The AINN achieves an overall improvement over the LPNL in PSS. Fig. 5 displays the lead time dependence of the PSS for both models.
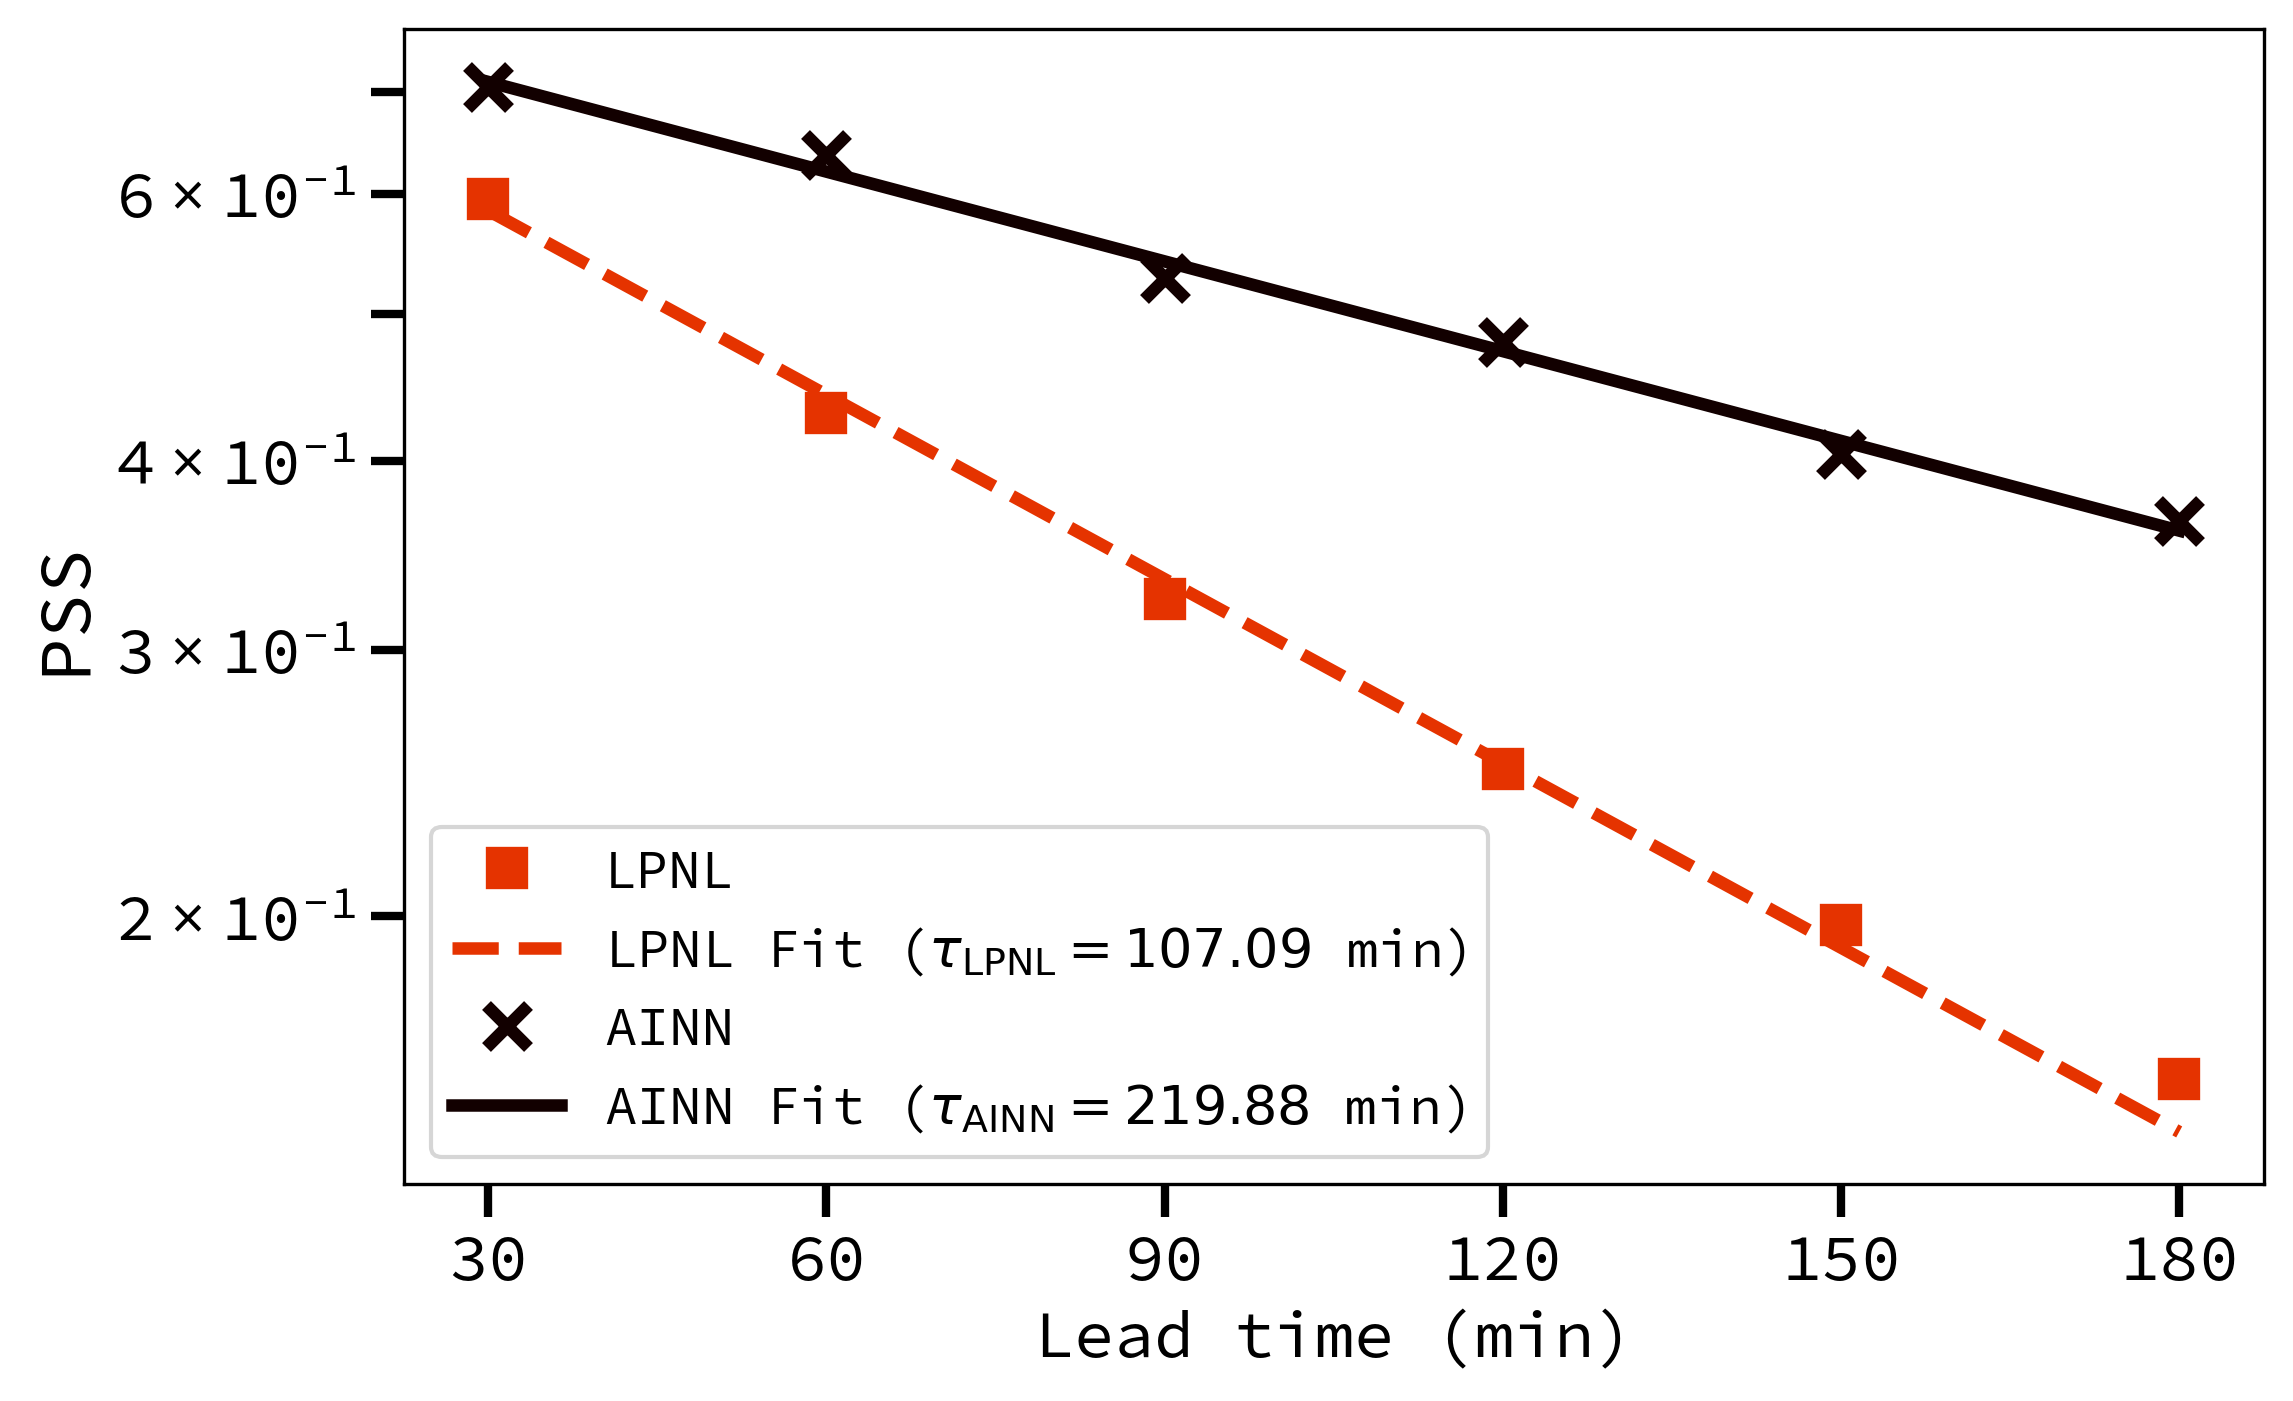
We detect an exponential decay in skill for both models, which is the typical and expected form for most forecasting skills (Selz et al., 2022; Vahid Yousefnia et al., 2024a). The time scales of the skill decay are quantified by fitting exponential functions for which one observes approximately the double value for the AINN compared to the LPNL . Moreover, the gap in skill between the AINN and the LPNL is significantly smaller for the shortest lead time of but widens with increasing lead time supporting the notion that for short lead times the advection is the leading order process but for longer lead times the life-cycle component gains importance.
5.2 Probabilistic Skill Metrics
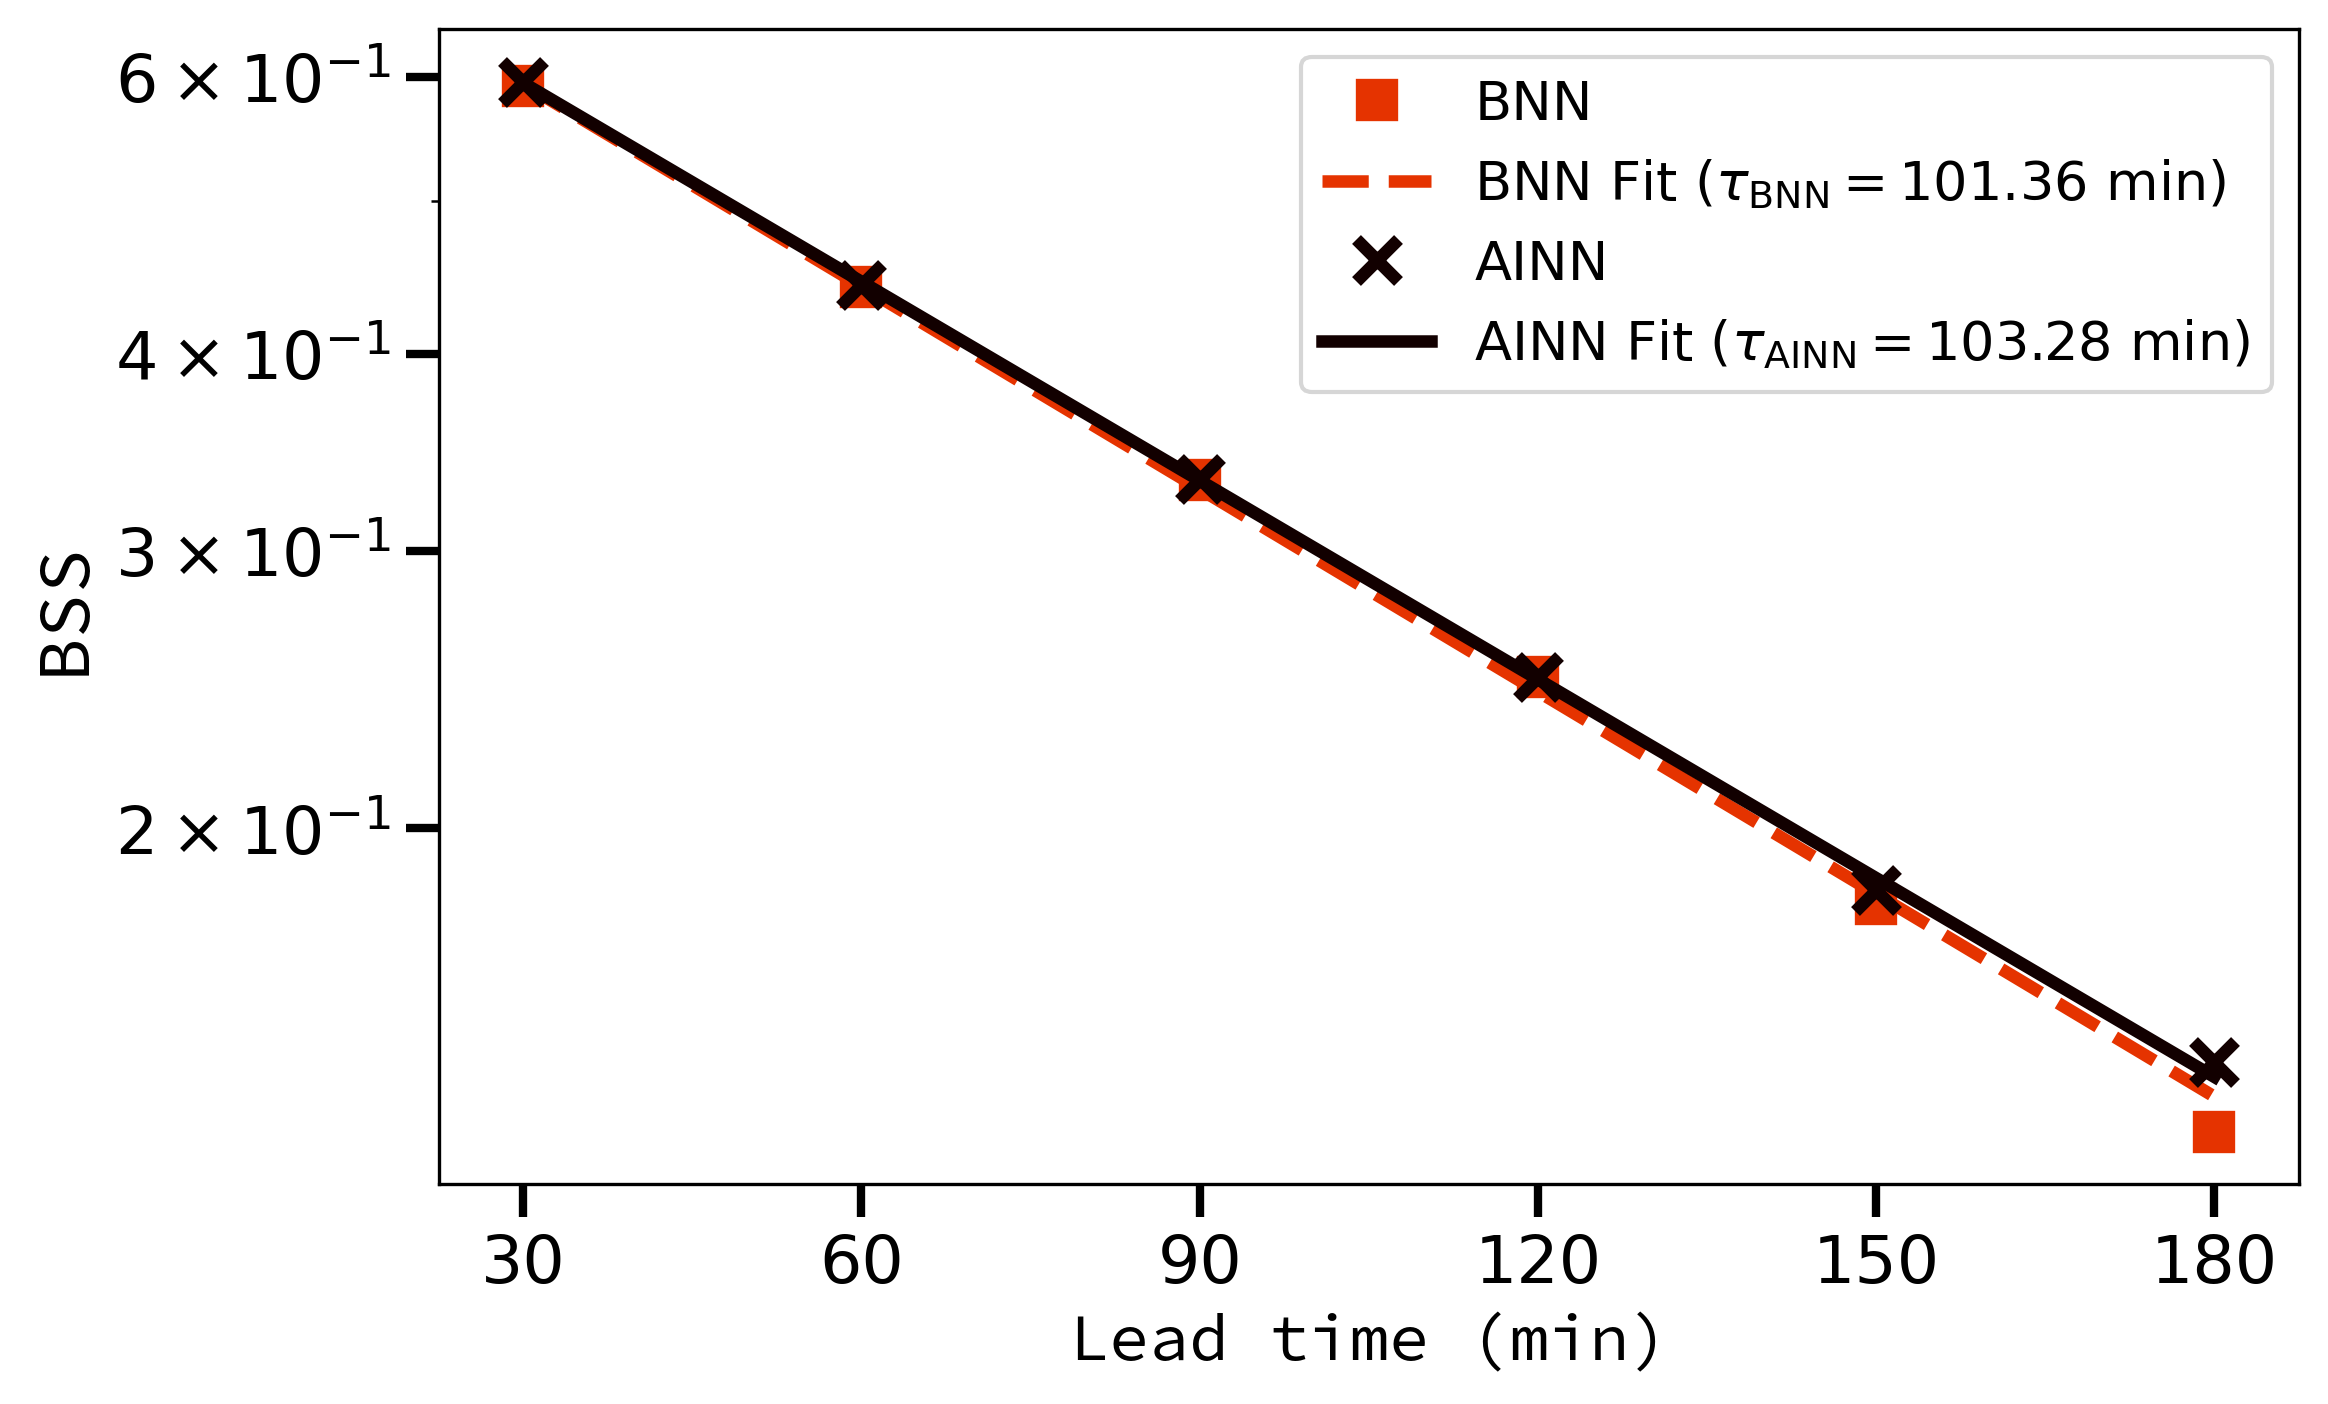
To compare the BNN to the AINN we first employ the BSS. Averaged over all lead times the BSS for the AINN is compared to . This constitutes a relative improvement of . Fig. 6 displays the BSS and the exponential fits for both models against lead time. The skill difference of the models stems entirely from the long lead times and with and relative improvement respectively. This aligns with the prediction from our scale argument made in Section 4. For a lead time of the scale argument presupposes a large scale wind speed of for the advection nowcast to matter, which is still a high value but common enough to also notice a difference for the BSS calculated on climatologically consistent test sets. Furthermore, we again detect an exponential decay in skill with lead time. The time scale of the AINN derived from the BSS is very different from the one derived from the PSS before. This is not surprising as one would expect very different time scales between skill scores in general. The time scales of the AINN and BNN do not differ substantially due to the performance difference showing up only for long lead times.
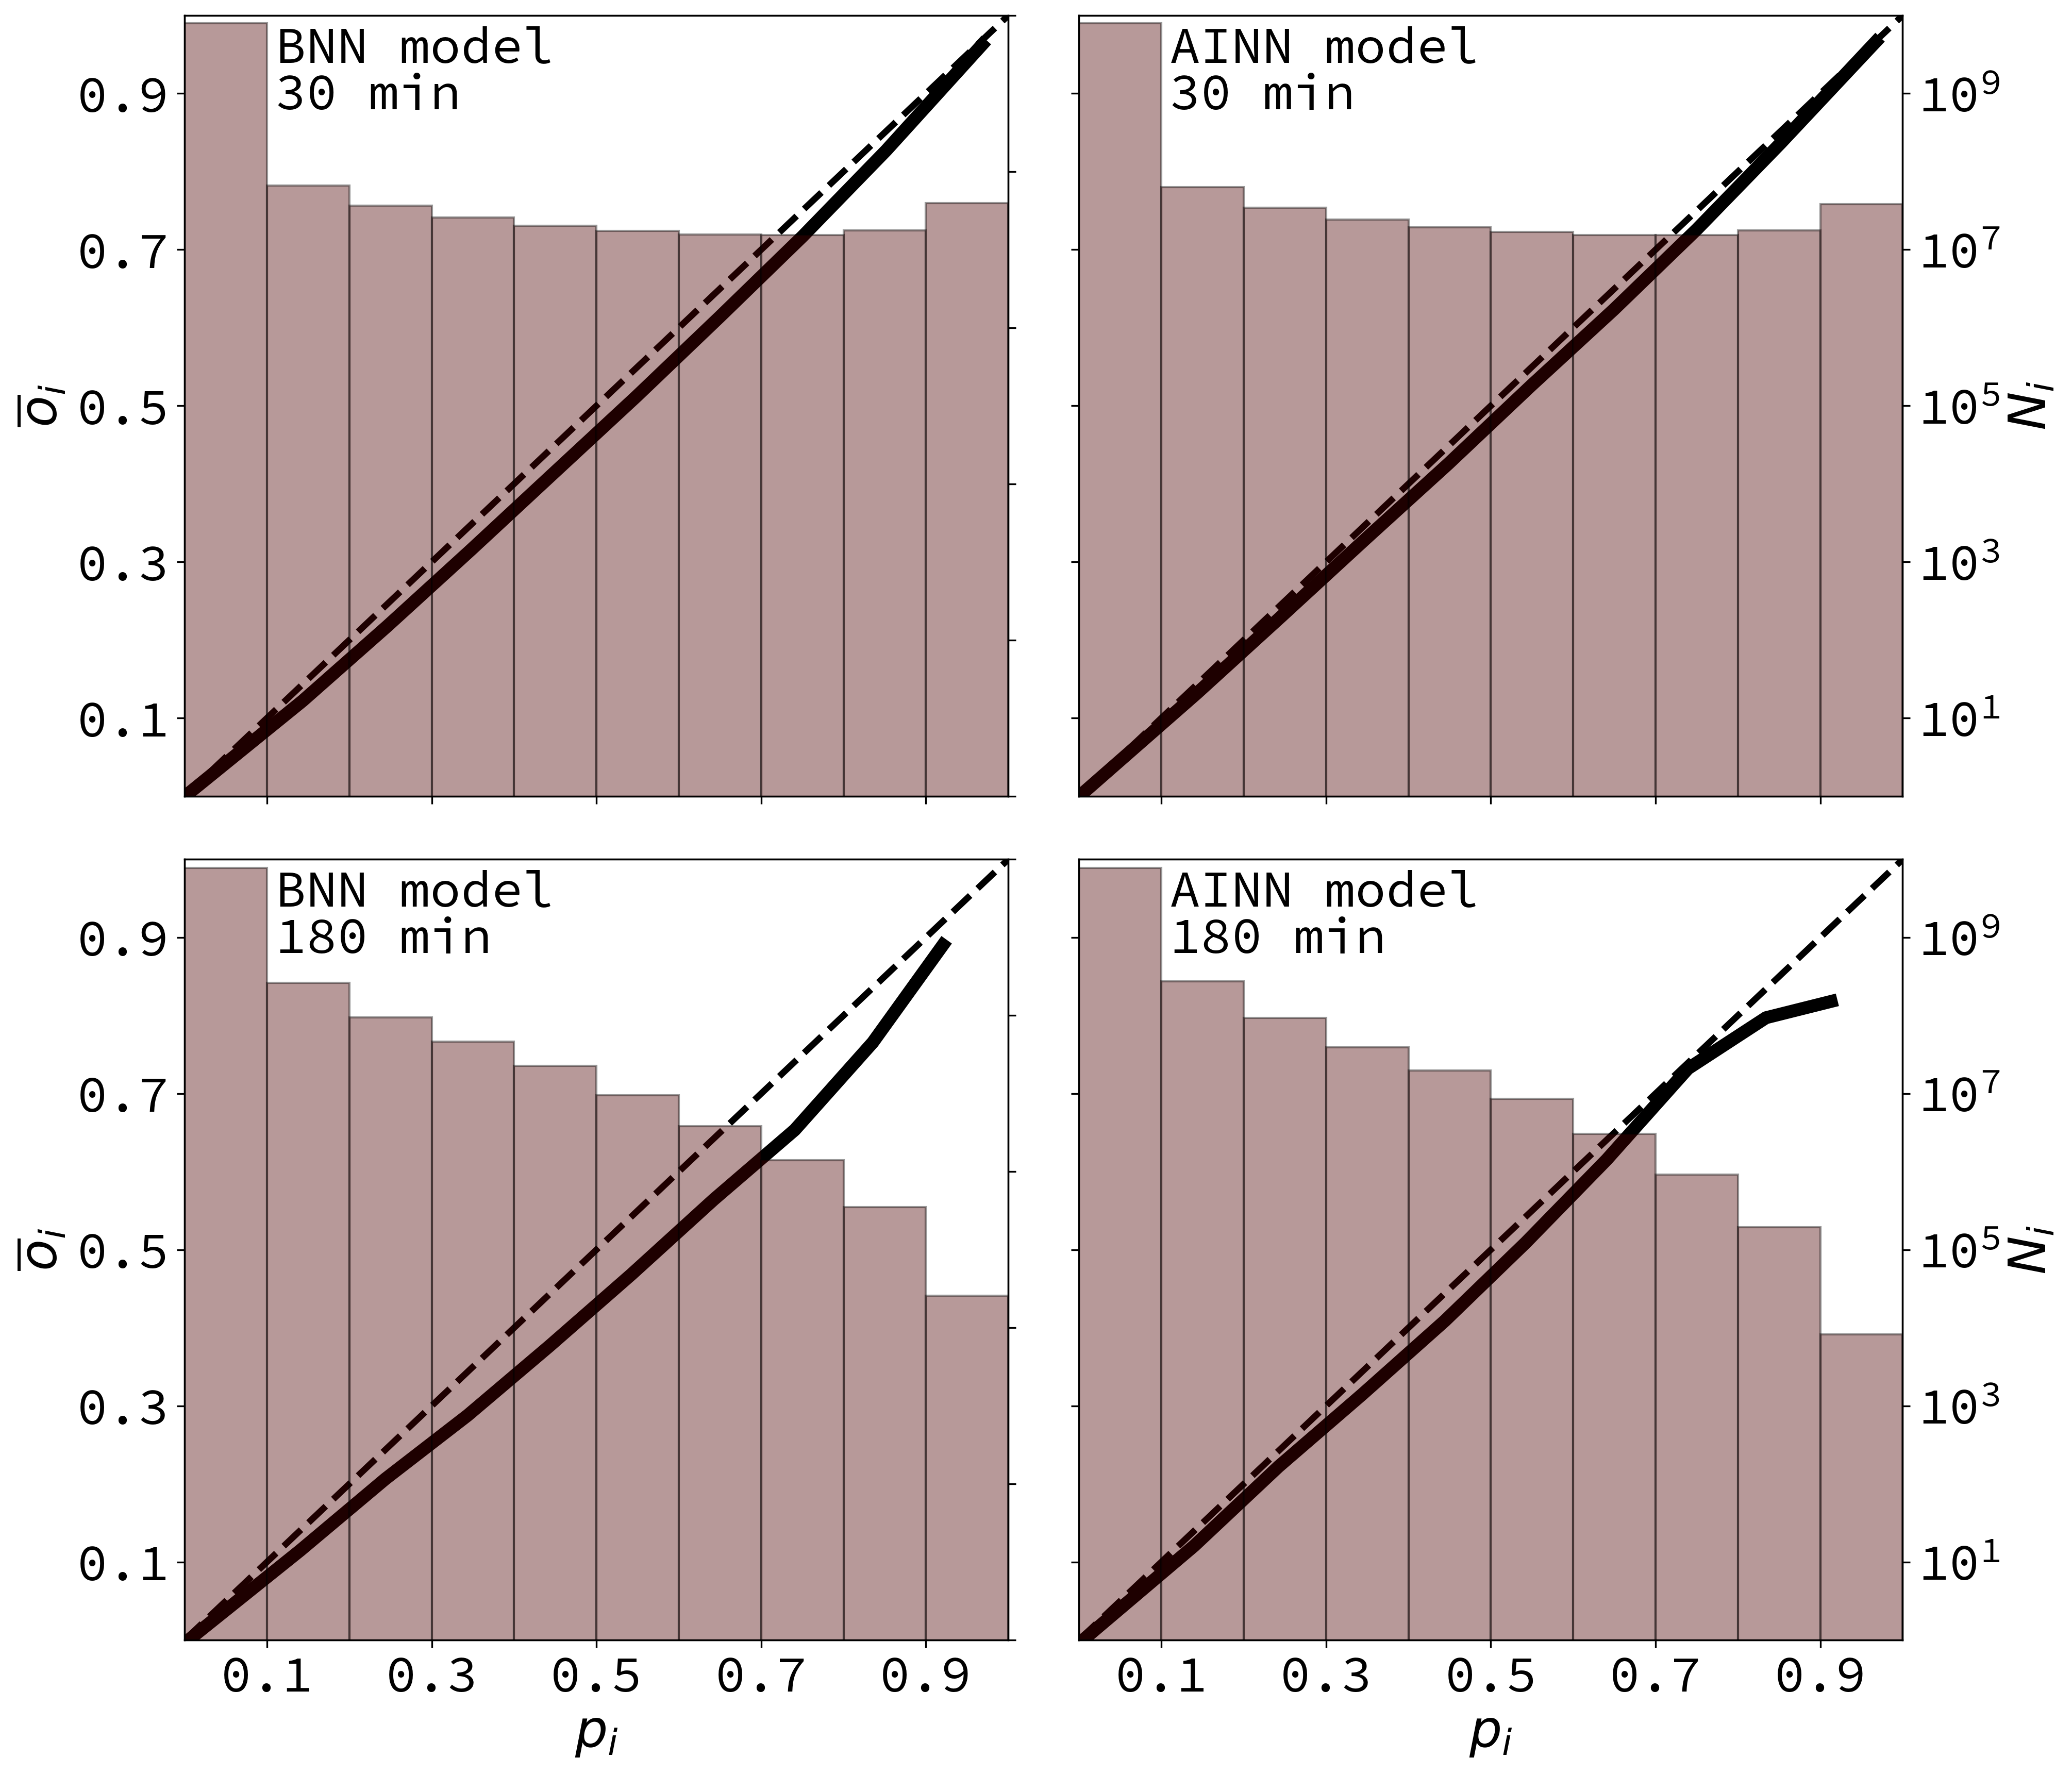
A further tool to evaluate the models with is the reliability diagram. They are compared for a short lead time of and a long lead time of in Fig. 7. One observes both the BNN and the AINN are well calibrated for a lead time of , with the AINN displaying a slight edge. The refinement distribution of both models suggests many correct high confidence predictions close to and . However, for a lead time of the calibration gets worse for both models and they display distinct phenomenology. The BNN is overconfident for probabilities between – being well calibrated otherwise. The AINN on the other hand is well calibrated for all probabilities up to around above which it becomes increasingly overconfident. The access to the Lagrangian persistence nowcasts of the input channels is able to course correct for a large probability region but also incites some over confidence for very high probabilities. The refinement distribution further underscores the difficulty of both models to produce correct high confidence predictions for long lead times.
5.3 Skill Metrics Conditioned on Wind Speed and Lead Time
To test the validity of our scale argument more precisely we focus on its implication that the relative skill increase of the AINN over the BNN should increase with lead time and wind speed. In the previous section we conditioned the skill purely on the lead time. Now we also condition the skill on the wind speed as follows: For each lead time we calculate for each data point in the test set the average of the wind speed over the wind field derived from the WV062 channel. We further partition the wind speed ranging from (, ) into bins and assign each data point to its bin accordingly. Data points with average wind speed above , which are less than of the dataset, are purposefully ignored. Then we calculate the average BSS for both the baseline and the AINN per bin. Importantly, we utilize for the calculation of the reference BS for each bin the specific climatology of that bin as thunderstorms are not uniformly distributed across the bins. In a final step the relative skill improvement of the AINN over the BNN is calculated for each bin. The final result is displayed in Fig. 8, where the bin-wise relative improvement in skill is plotted against the middle wind speed value of each bin for all lead times.
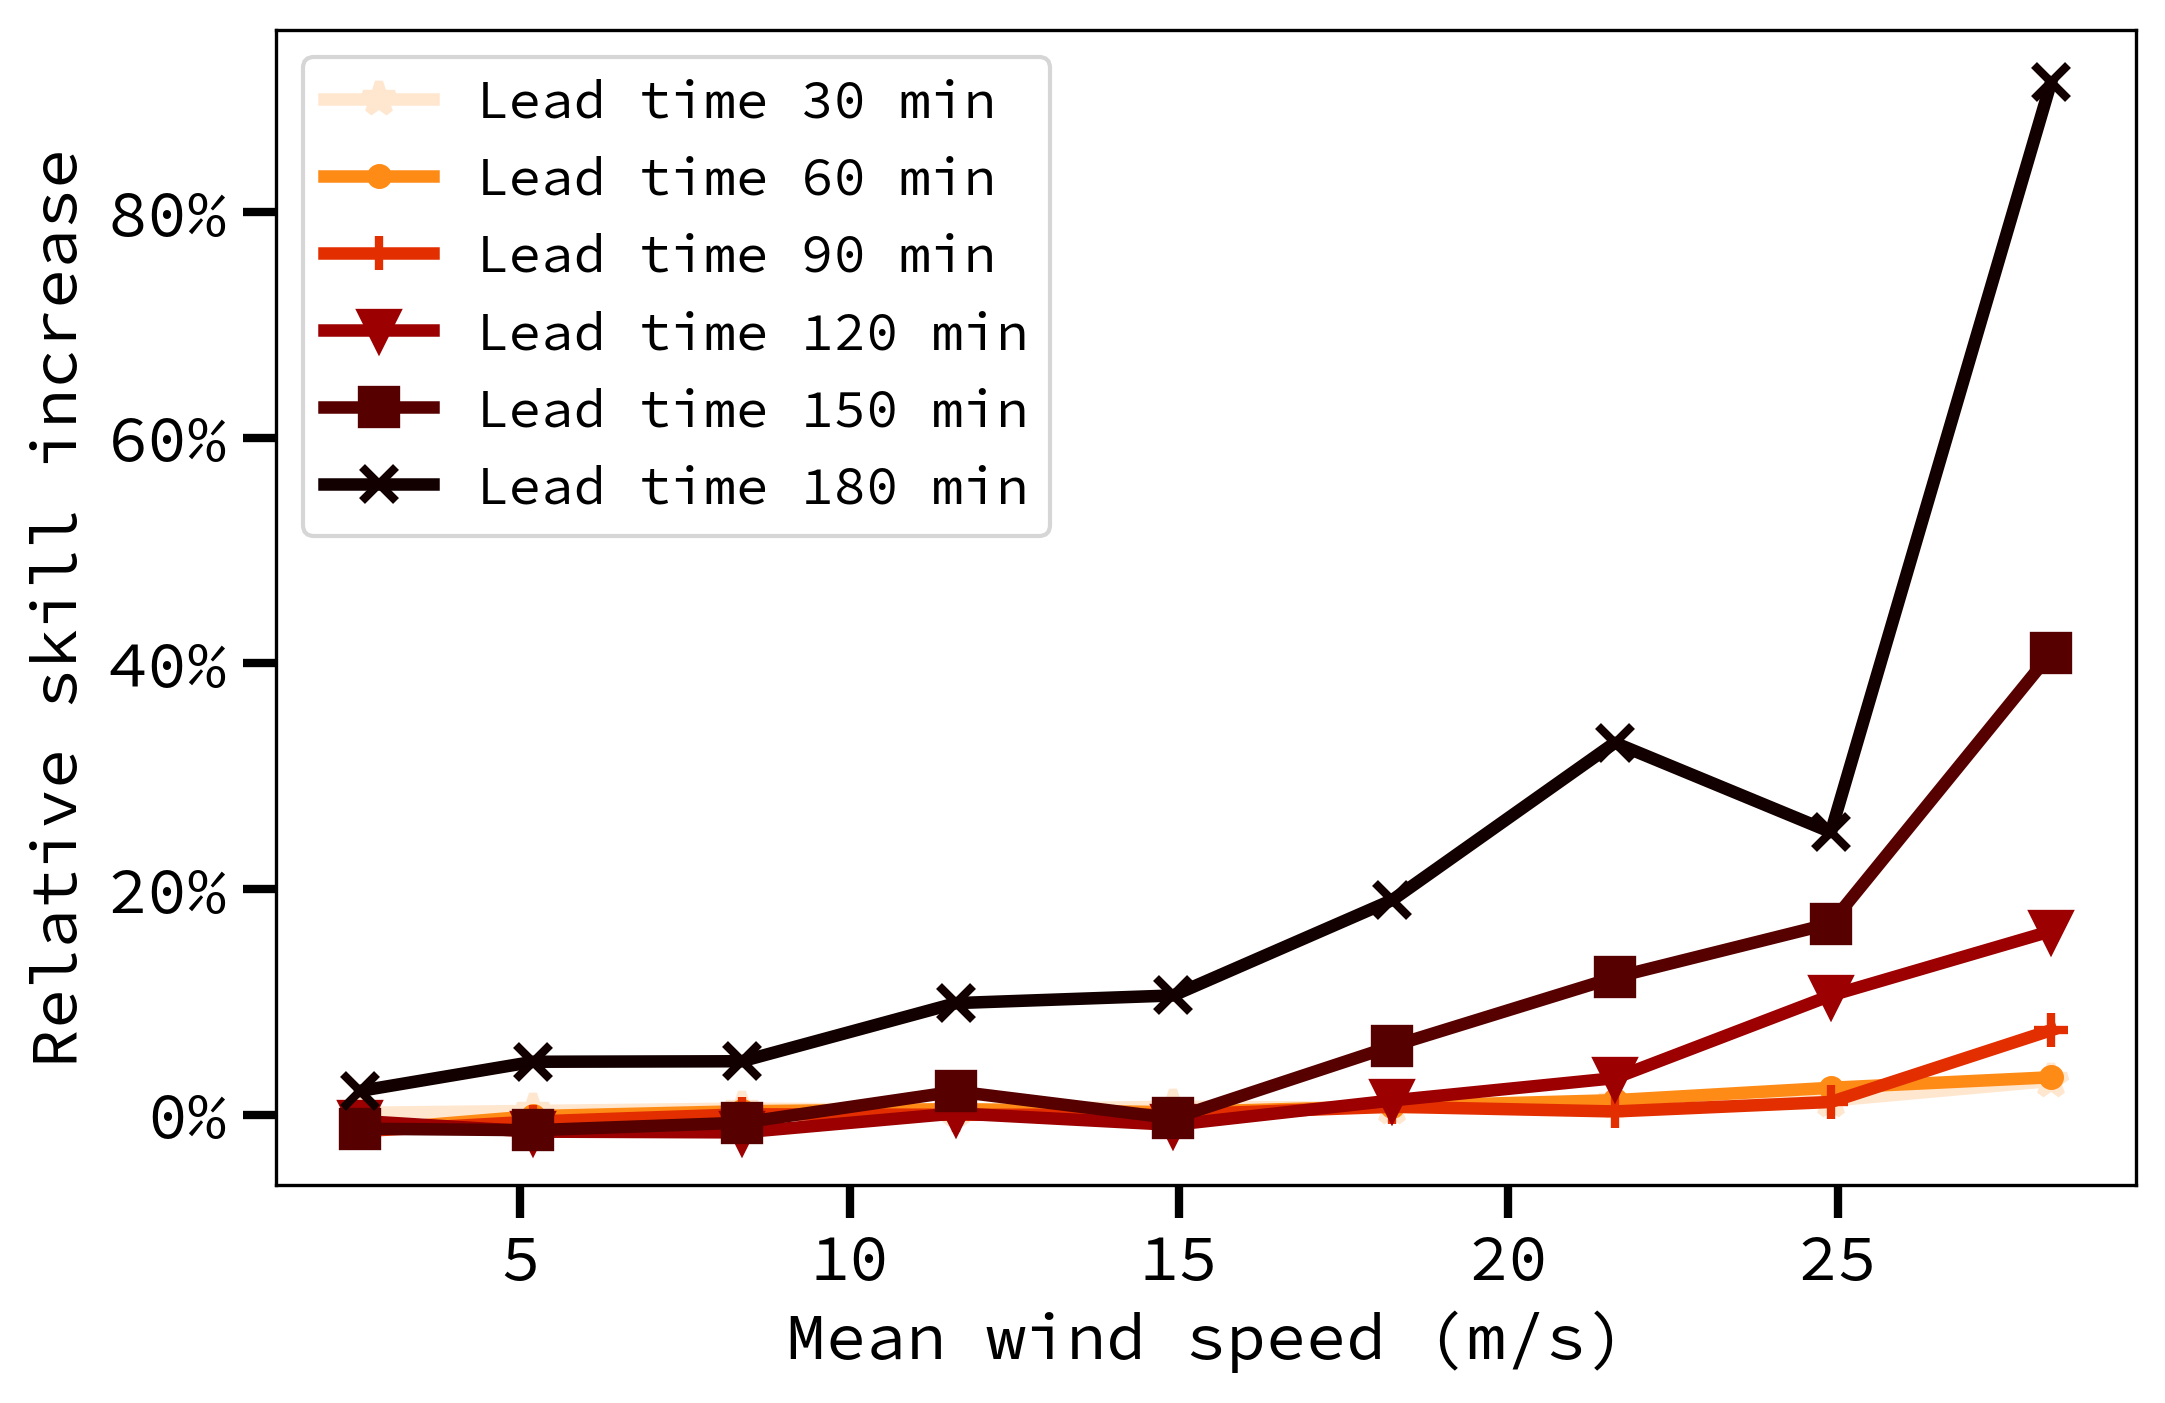
This analysis confirms the expected behavior as predicted by the scale argument: There is no relative skill improvement for short lead times, except for very high wind speeds and even then it is very minor. For longer lead times one observes a significant improvement for high wind speeds. There is a clear trend emerging where the relative improvement in skill increases with wind speed and lead time. We conclude that the AINN provides a worth while benefit over the baseline but only under specific circumstances: long lead times and high wind speeds. The explanation in terms of relating the underlying physical scales to the intrinsic scale of the neural networks is supported by this analysis.
Two limitations of the study should be mentioned here: First, this analysis and also the scale argument in general supposes that the large scale wind as estimated from only two observations with time interval is close to correct and should be approximately constant over the forecast period, of here. Moreover, the receptive field calculation is an estimate in the sense that it provides the maximum side length of the box of input pixels that the network can make use of for a prediction. But this does not mean the network has to make use of all those pixels. In many computer vision application the effective receptive field is significantly smaller than the theoretically calculated maximum (Luo et al., 2016).
5.4 Case Study
We close with a discussion of a case study from the test set, which reinforces the mechanism proposed in the scale argument. The starting point is on August 2, 2019, 1700 UTC from which a nowcast is performed for 1900 UTC. The weather situation is inferred from Fig. 9: satellite imagery clearly indicates a well-developed thunderstorm complex situated over the Adriatic sea close to the coast of Croatia. In the HRV channel, dense cloud shields and overshooting tops are apparent, reflecting strong convective updrafts. The IR108 imagery shows cloud-top temperatures dropping below in the most intense cells, highlighting very cold, high-reaching cloud tops typically associated with severe thunderstorms. Lightning stroke density is elevated, confirming vigorous electrical activity within the storm system. A strong westerly flow with an average wind direction of and wind speed of (both measured from the WV062 channel) is steering the convection eastward towards the interior of Croatia. Given the ongoing robust convection and continued forcing from the strong westerly flow, these storms are likely to persist and track further east over the next two hours.
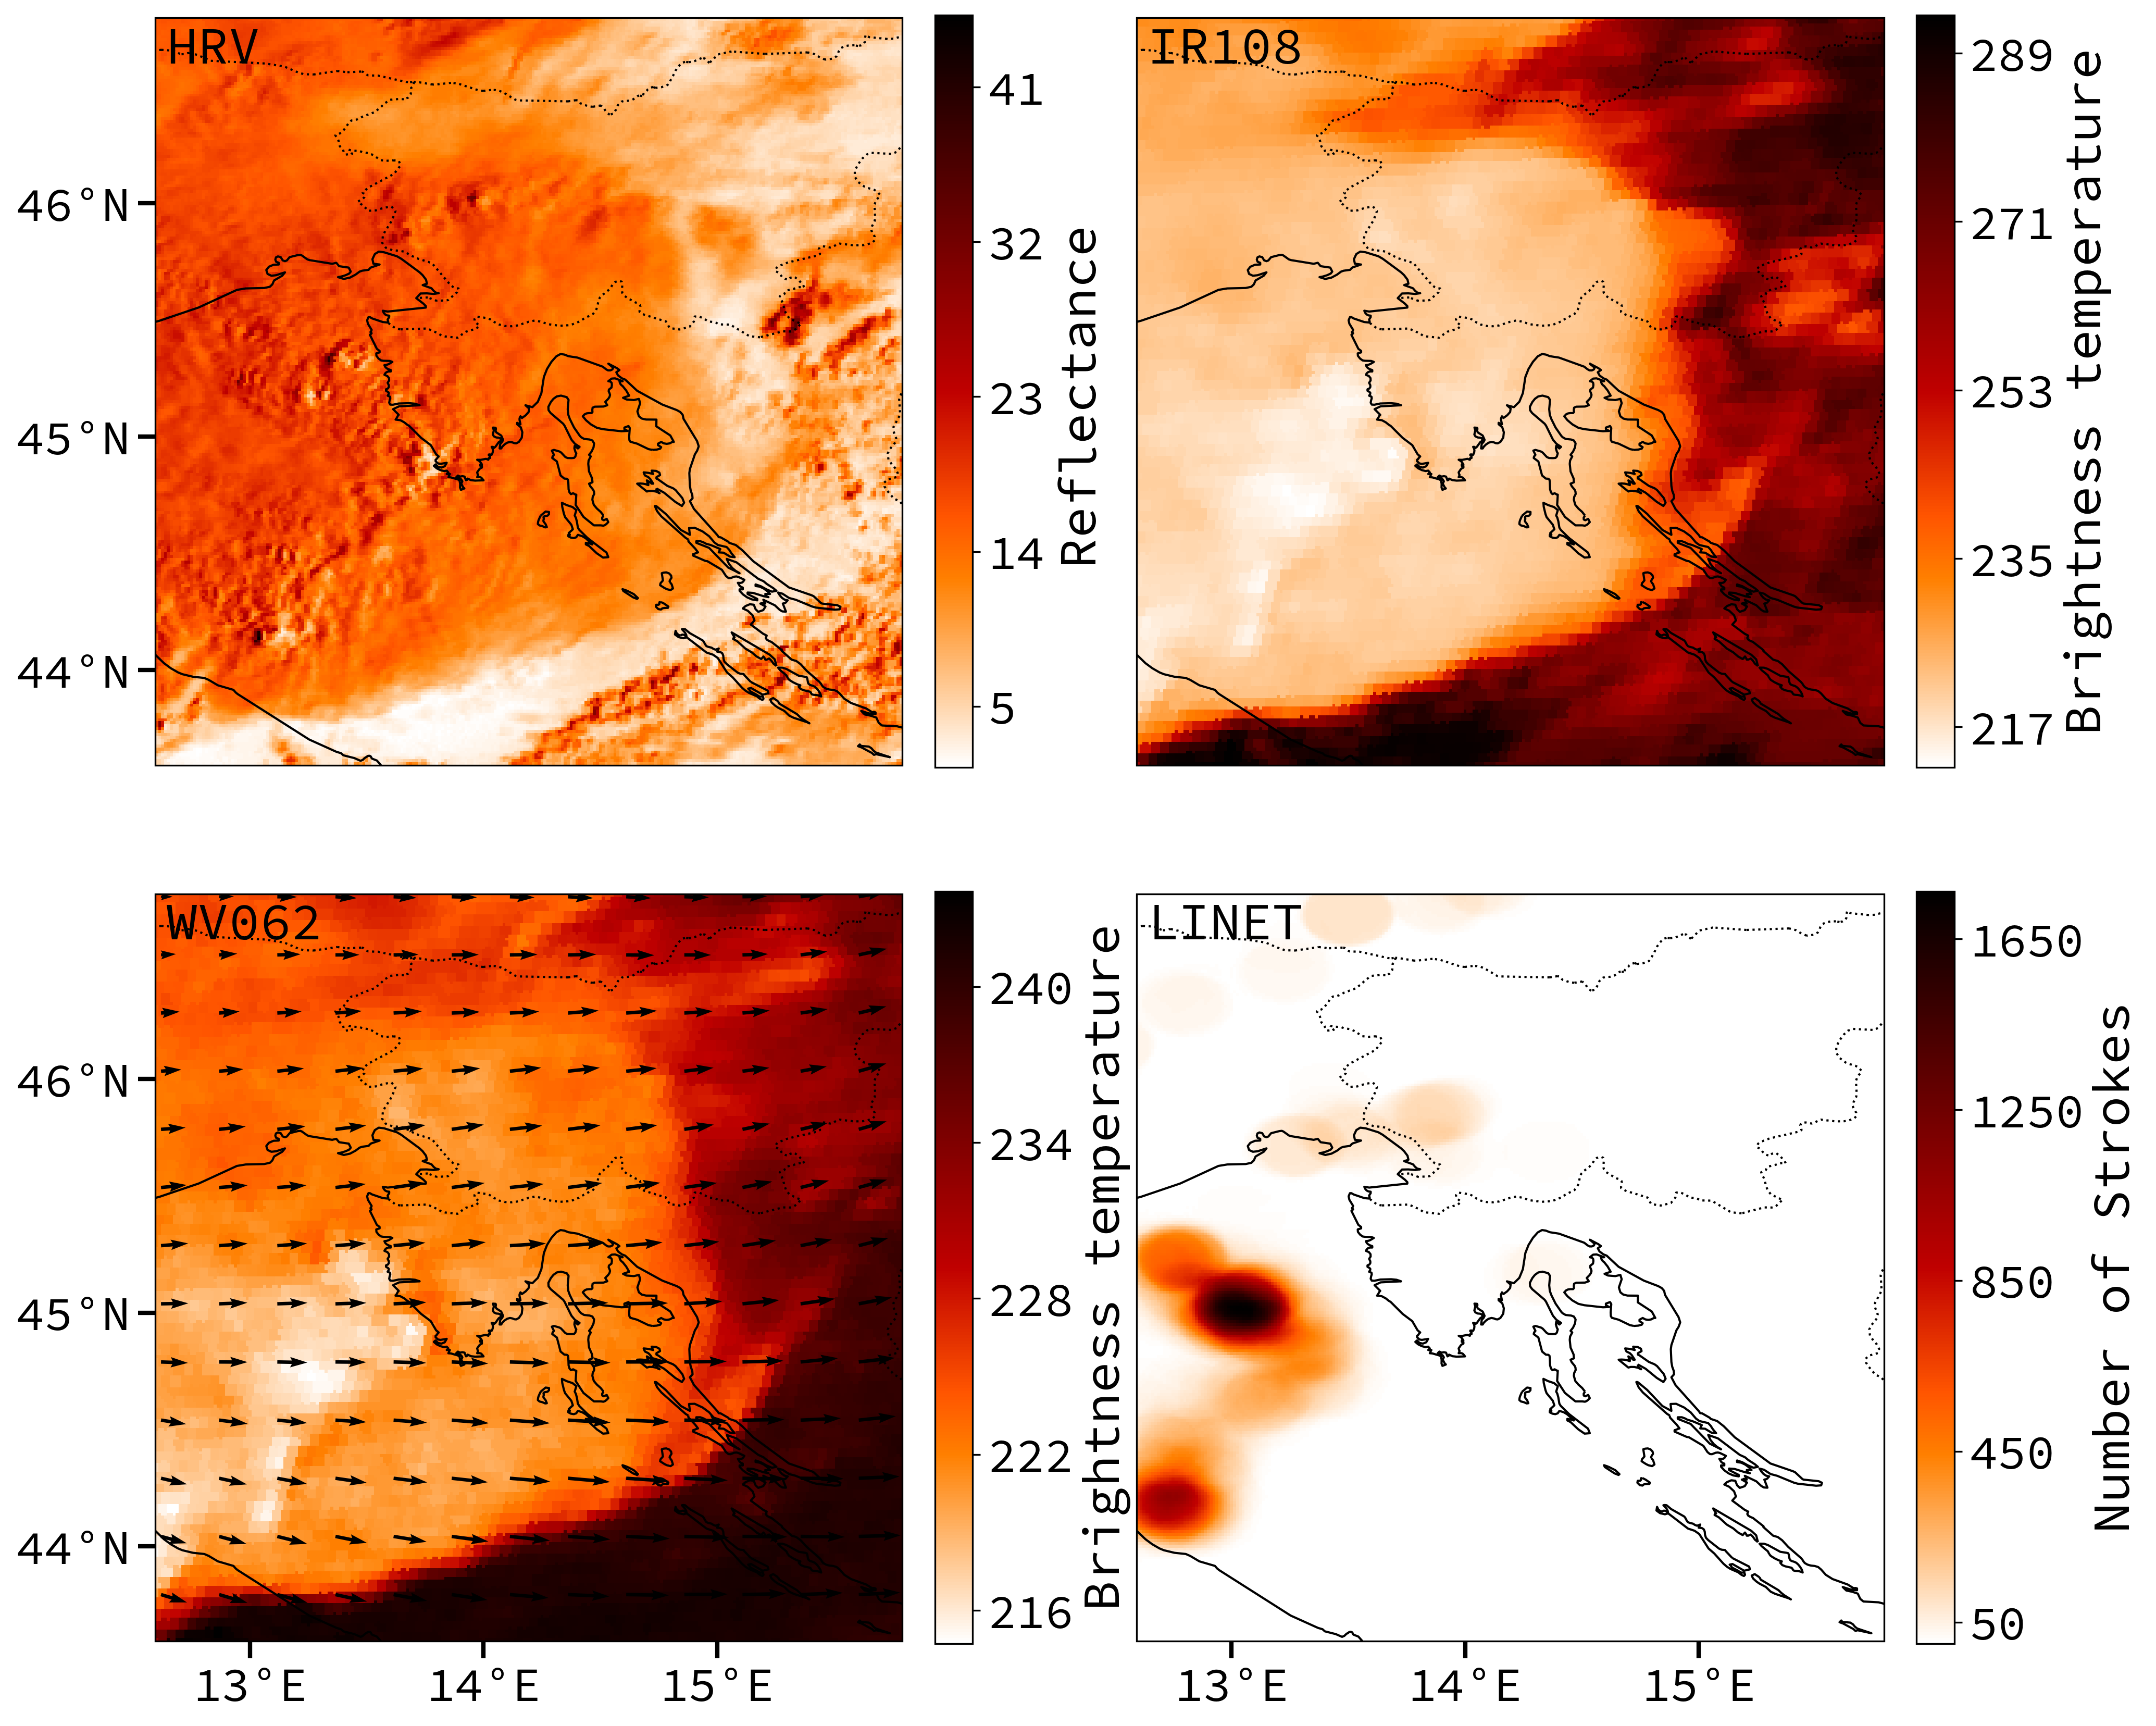
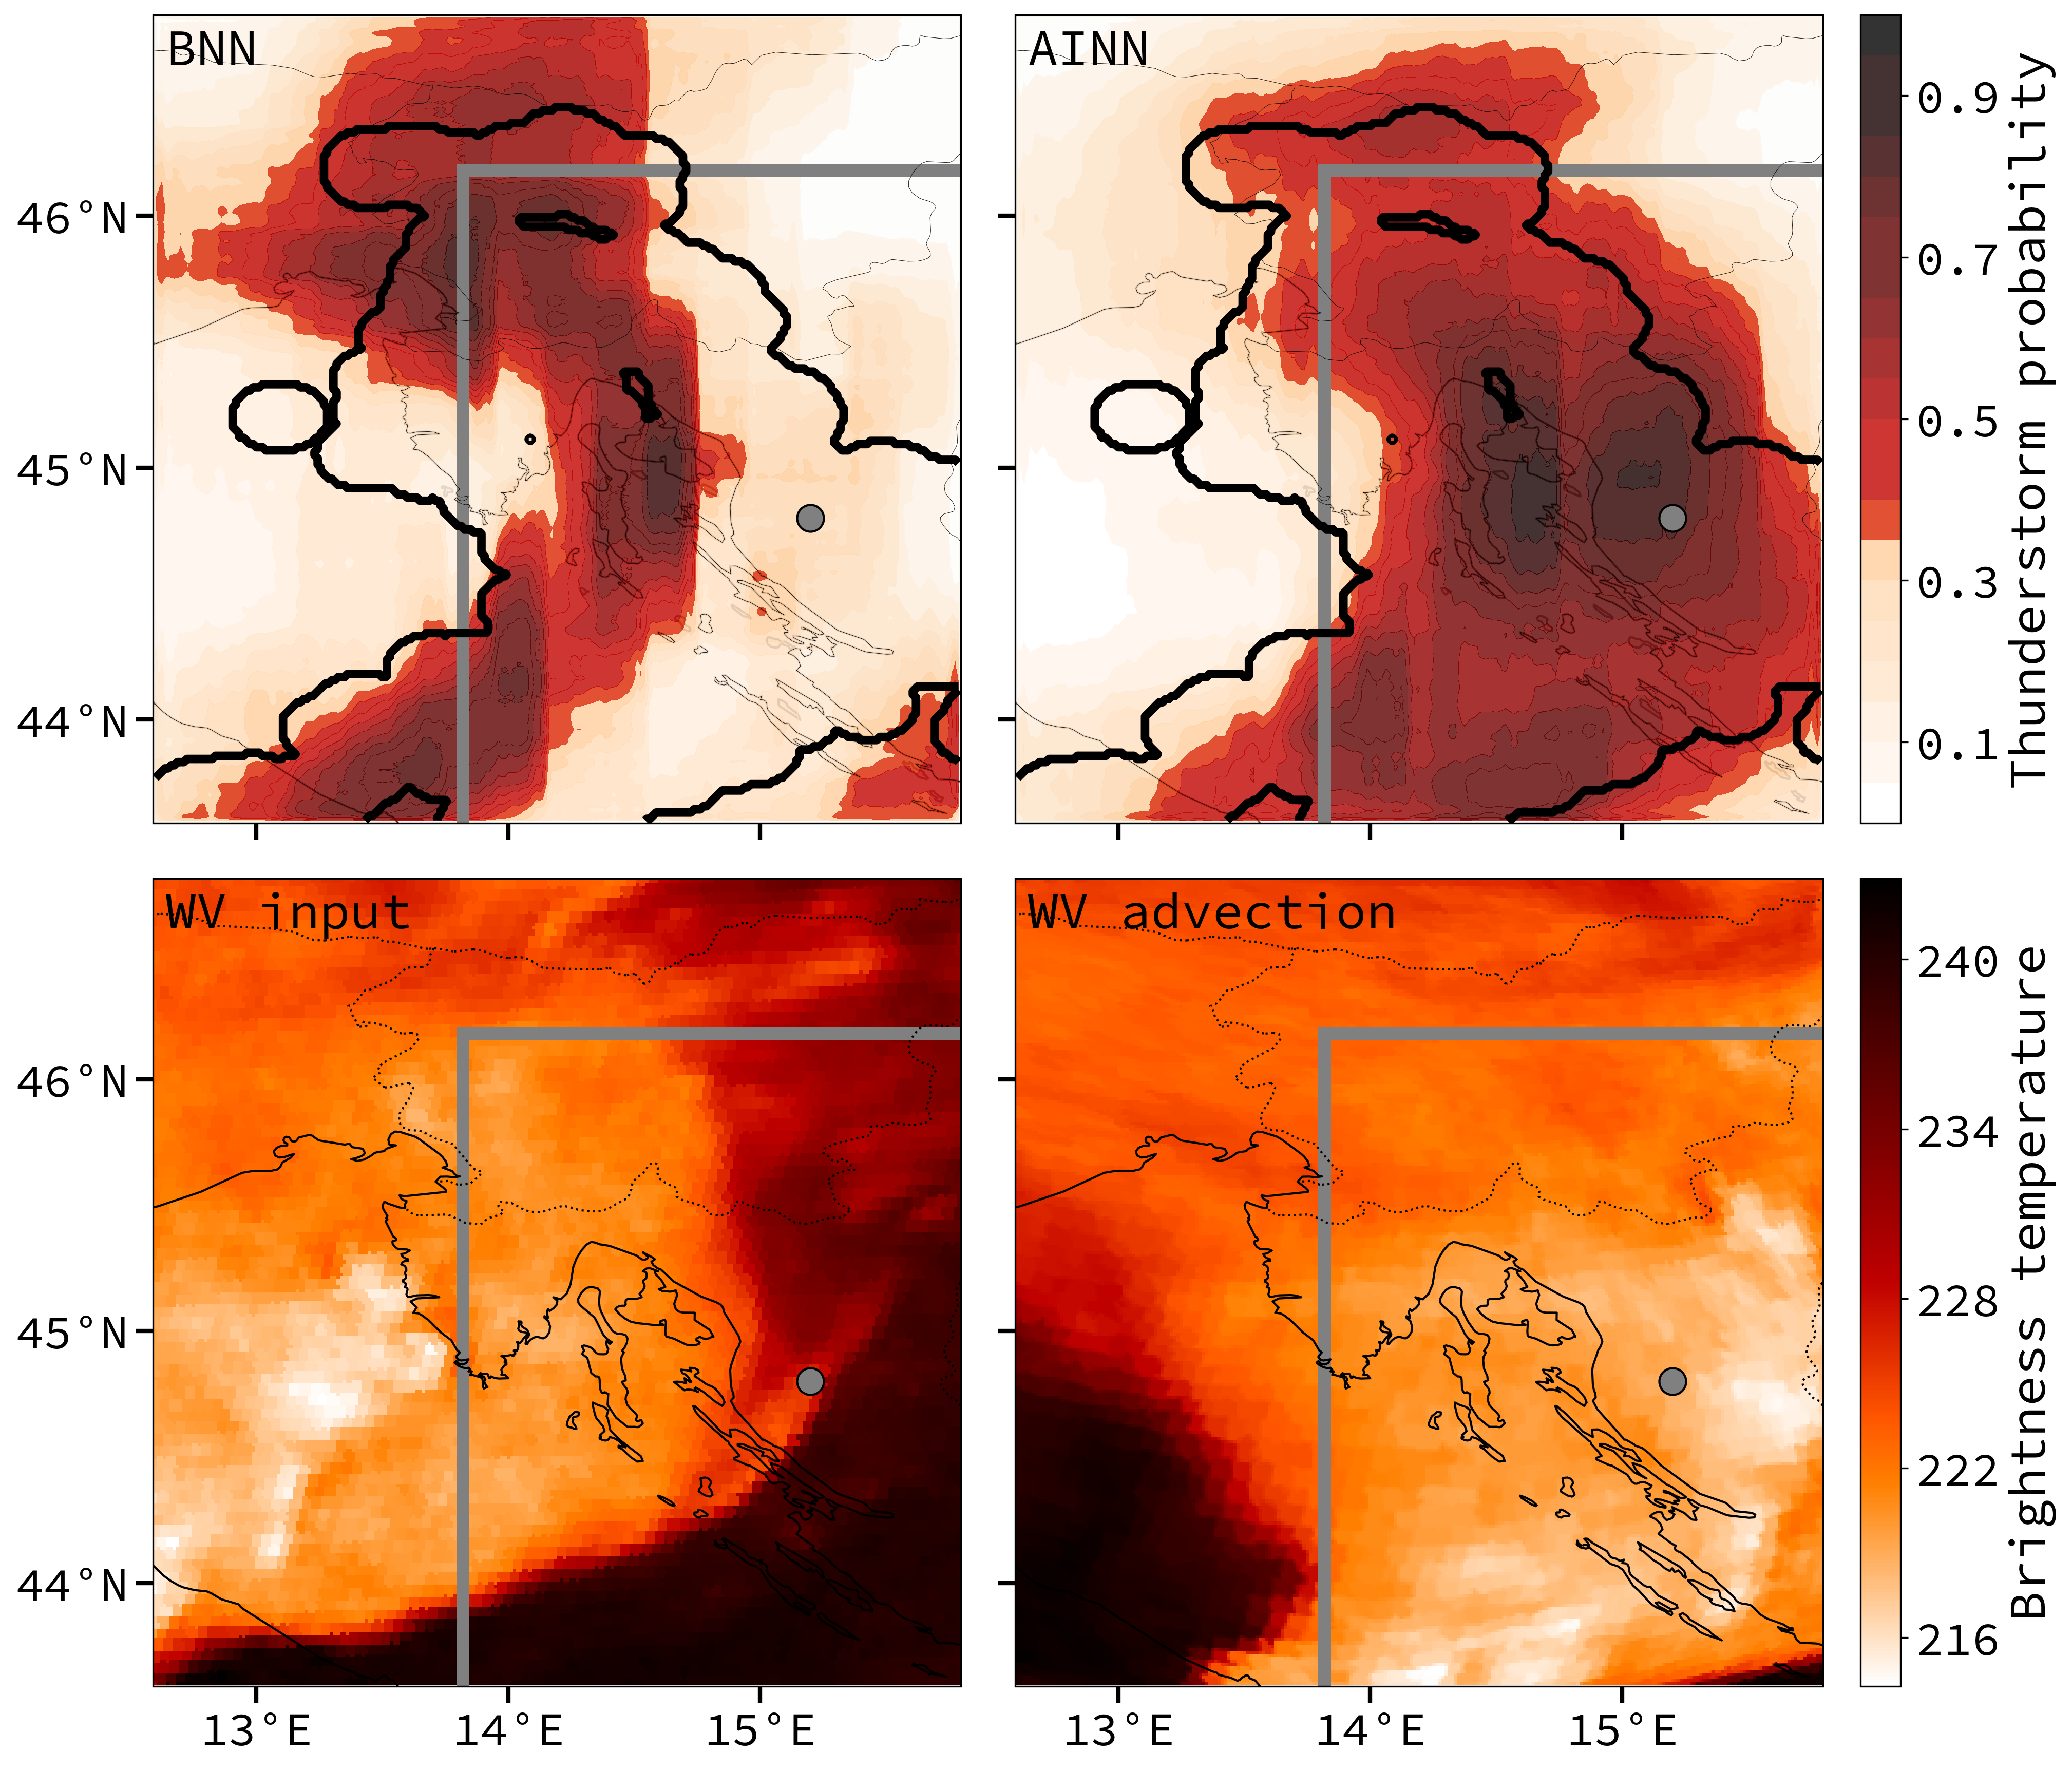
Fig. 10 displays observations, predictions and an example of a receptive field relevant to this case. We observe that the BNN does roughly capture the western part of the storm but fails to nowcast the eastern part. The AINN on the other hand is capable of correctly predicting this part as well. We argue that the reason for this lies in the receptive field and the additional Lagrangian persistence information available to the AINN. The most intense part of the storm (brightness temperature below ) lies outside of the receptive field (gray box is the boundary) of the gray point highlighted in Fig. 10. Thus, the BNN is not aware of its existence and cannot take it into account for its nowcast of the western part. This is also initially the case for the AINN. However, it also has access to the Lagrangian persistence nowcast of the input channels. Therefore, the intense part of the storm is advected into the receptive field of the western region and can be considered. We also note that there exists a small number of points for which the most intense part of the storm is at the very edge of their receptive fields yet the BNN is not capable of confidently predicting a thunderstorm. This could be a case of the effective receptive field being somewhat smaller than the theoretical maximum. We conclude this section with the insight that for such a situation as described in the case study it requires long lead times and high wind speeds as presupposed by the scale argument.
6 Discussion
This study investigated the generality of combining classical advection algorithms with CNNs for nowcasting by applying it to the novel context of satellite-based thunderstorm nowcasting. For each of the two considered model classes a separate ResU-Net was trained for each lead time to solve a binary segmentation task, where lightning observations served as ground truth. The BNN utilized the latest two time steps of four satellite channels and aggregated lightning observations to predict a pixel-wise probability of thunderstorm occurrence, while the AINN additionally received the Lagrangian persistence nowcast of each input channel.
Furthermore, we proposed an explanation of why and under what circumstances the AINN should outperform the BNN. This was posited as a scale argument relating the underlying physical scales (lead time and large scale average wind speed) to the intrinsic scale of the CNNs (the side length of the receptive field). The main implications of the scale argument were the prediction that the AINN should only outperform the BNN considerably for lead times larger than and that the relative improvement in skill should increase both with lead time and wind speed.
The AINN outperformed—as measured by the BSS—the BNN as predicted for lead times greater than . For a lead time of the skill improved by through the inclusion of the advection nowcasts. This was further supported by the analysis of reliability diagrams, where one however also observed that for long lead times the AINN becomes slightly over confident for high probability outputs.
To test the implication of the scale argument of a stronger effect with higher wind speeds and lead time we analyzed the relative improvement in skill of the AINN over the BNN conditioned both on lead time and large scale mean wind speed. We concluded that the predicted trend of an increase with lead time and wind speed was clearly present.
Finally, the scale argument was illustrated by a case study, which further underscored the usefulness of the AINN stemming from cases where the advection transports relevant information through high wind speeds and long lead times into the receptive field of the network.
This study did not explore alternative approaches to circumvent undersized receptive fields. A thorough investigation of adding more layers or incorporating diluted convolutions is left to future work.
We close by emphasizing the general usefulness of this work. CNNs are ubiquitous in spatiotemporal forecasting problems and are often applied to problems where some prior domain knowledge exists. In such cases, scale arguments relating the underlying scales of the problem to the inherent scales of the neural networks in the shape of the receptive field could be a valuable tool to reach optimal architecture and hyperparameter choices without spending a large compute budget on systematically testing a lot of reasonable combinations.
Acknowledgements.
We gratefully acknowledge the computational and data resources provided through the joint high-performance data analytics (HPDA) project ”terrabyte” of the DLR and the Leibniz Supercomputing Center (LRZ). C.M. carried out his contributions within the Italia–Deutschland Science–4–Services Network in Weather and Climate (IDEA-S4S; SESTO, 4823IDEAP4). This Italian-German research network of universities, research institutes and DWD is funded by the Federal Ministry of Digital and Transport (BMDV). The authors declare that there are no conflicts of interest to disclose. \datastatementData availability is currently checked with the data providers. A final statement will be added later.References
- Andrychowicz et al. (2023) Andrychowicz, M., L. Espeholt, D. Li, S. Merchant, A. Merose, F. Zyda, S. Agrawal, and N. Kalchbrenner, 2023: Deep Learning for Day Forecasts from Sparse Observations. arXiv, URL http://arxiv.org/abs/2306.06079, arXiv:2306.06079 [physics], 10.48550/arXiv.2306.06079.
- Araujo et al. (2019) Araujo, A., W. Norris, and J. Sim, 2019: Computing receptive fields of convolutional neural networks. URL https://distill.pub/2019/computing-receptive-fields/, accessed: 2025-01-23.
- Ayzel et al. (2020) Ayzel, G., T. Scheffer, and M. Heistermann, 2020: RainNet v1.0: a convolutional neural network for radar-based precipitation nowcasting. Geoscientific Model Development, 13 (6), 2631–2644, 10.5194/gmd-13-2631-2020.
- Azad et al. (2024) Azad, R., and Coauthors, 2024: Medical Image Segmentation Review: The Success of U-Net. IEEE Transactions on Pattern Analysis and Machine Intelligence, 46 (12), 10 076–10 095, 10.1109/TPAMI.2024.3435571.
- Bai et al. (2022) Bai, C., F. Sun, J. Zhang, Y. Song, and S. Chen, 2022: Rainformer: Features Extraction Balanced Network for Radar-Based Precipitation Nowcasting. IEEE Geoscience and Remote Sensing Letters, 19, 1–5, 10.1109/LGRS.2022.3162882.
- Bedka et al. (2010) Bedka, K., J. Brunner, R. Dworak, W. Feltz, J. Otkin, and T. Greenwald, 2010: Objective Satellite-Based Detection of Overshooting Tops Using Infrared Window Channel Brightness Temperature Gradients. Journal of Applied Meteorology and Climatology, 49 (2), 181–202, 10.1175/2009JAMC2286.1.
- Betz et al. (2009) Betz, H. D., K. Schmidt, P. Laroche, P. Blanchet, W. P. Oettinger, E. Defer, Z. Dziewit, and J. Konarski, 2009: LINET—An international lightning detection network in Europe. Atmospheric Research, 91 (2), 564–573, 10.1016/j.atmosres.2008.06.012.
- Bojinski et al. (2023) Bojinski, S., and Coauthors, 2023: Towards nowcasting in europe in 2030. Meteorological applications, 30 (4), e2124.
- Bouguet (2001) Bouguet, J.-Y., 2001: Pyramidal implementation of the affine lucas kanade feature tracker description of the algorithm. Intel Corporation, 5 (1–10), 4.
- Bowler et al. (2006) Bowler, N. E., C. E. Pierce, and A. W. Seed, 2006: STEPS: A probabilistic precipitation forecasting scheme which merges an extrapolation nowcast with downscaled NWP. Quarterly Journal of the Royal Meteorological Society, 132 (620), 2127–2155, 10.1256/qj.04.100.
- Brodehl et al. (2022) Brodehl, S., R. Müller, E. Schömer, P. Spichtinger, and M. Wand, 2022: End-to-End Prediction of Lightning Events from Geostationary Satellite Images. Remote Sensing, 14 (15), 3760, 10.3390/rs14153760.
- Bröcker and Smith (2007) Bröcker, J., and L. A. Smith, 2007: Increasing the reliability of reliability diagrams. Weather and Forecasting, 22 (3), 651 – 661, 10.1175/WAF993.1.
- Burton et al. (2022) Burton, R. R., and Coauthors, 2022: Satellite-Based Nowcasting of West African Mesoscale Storms Has Skill at up to 4-h Lead Time. Weather and Forecasting, 37 (4), 445–455, 10.1175/WAF-D-21-0051.1.
- Cintineo et al. (2022) Cintineo, J. L., M. J. Pavolonis, and J. M. Sieglaff, 2022: ProbSevere LightningCast: A Deep-Learning Model for Satellite-Based Lightning Nowcasting. Weather and Forecasting, 37 (7), 1239–1257, 10.1175/WAF-D-22-0019.1.
- Cintineo et al. (2020) Cintineo, J. L., M. J. Pavolonis, J. M. Sieglaff, A. Wimmers, J. Brunner, and W. Bellon, 2020: A Deep-Learning Model for Automated Detection of Intense Midlatitude Convection Using Geostationary Satellite Images. Weather and Forecasting, 35 (6), 2567–2588, 10.1175/WAF-D-20-0028.1.
- Diffenbaugh et al. (2013) Diffenbaugh, N. S., M. Scherer, and R. J. Trapp, 2013: Robust increases in severe thunderstorm environments in response to greenhouse forcing. Proceedings of the National Academy of Sciences, 110 (41), 16 361–16 366, 10.1073/pnas.1307758110, https://www.pnas.org/doi/pdf/10.1073/pnas.1307758110.
- Farahmand et al. (2023) Farahmand, H., Y. Xu, and A. Mostafavi, 2023: A spatial–temporal graph deep learning model for urban flood nowcasting leveraging heterogeneous community features. Scientific Reports, 13 (1), 6768, 10.1038/s41598-023-32548-x.
- Geng et al. (2021) Geng, Y.-a., and Coauthors, 2021: A deep learning framework for lightning forecasting with multi-source spatiotemporal data. Quarterly Journal of the Royal Meteorological Society, 147 (741), 4048–4062, 10.1002/qj.4167.
- Germann and Zawadzki (2002) Germann, U., and I. Zawadzki, 2002: Scale-Dependence of the Predictability of Precipitation from Continental Radar Images. Part I: Description of the Methodology. Monthly Weather Review, 130 (12), 2859–2873, 10.1175/1520-0493(2002)130¡2859:SDOTPO¿2.0.CO;2.
- Guo et al. (2023) Guo, S., N. Sun, Y. Pei, and Q. Li, 2023: 3D-UNet-LSTM: A Deep Learning-Based Radar Echo Extrapolation Model for Convective Nowcasting. Remote Sensing, 15 (6), 1529, 10.3390/rs15061529.
- Ha and Lee (2023) Ha, J.-H., and H. Lee, 2023: A Deep Learning Model for Precipitation Nowcasting Using Multiple Optical Flow Algorithms. Weather and Forecasting, 39 (1), 41–53, 10.1175/WAF-D-23-0104.1.
- Han et al. (2022) Han, L., H. Liang, H. Chen, W. Zhang, and Y. Ge, 2022: Convective Precipitation Nowcasting Using U-Net Model. IEEE Transactions on Geoscience and Remote Sensing, 60, 1–8, 10.1109/TGRS.2021.3100847.
- Hoeppe (2016) Hoeppe, P., 2016: Trends in weather related disasters – Consequences for insurers and society. Weather and Climate Extremes, 11, 70–79, 10.1016/j.wace.2015.10.002.
- James et al. (2018) James, P. M., B. K. Reichert, and D. Heizenreder, 2018: NowCastMIX: Automatic Integrated Warnings for Severe Convection on Nowcasting Time Scales at the German Weather Service. Weather and Forecasting, 33 (5), 1413–1433, 10.1175/WAF-D-18-0038.1.
- Kingma and Ba (2014) Kingma, D. P., and J. Ba, 2014: Adam: A method for stochastic optimization. arXiv, URL https://arxiv.org/abs/1412.6980, 10.48550/ARXIV.1412.6980.
- Krüger et al. (2024) Krüger, K., A. Schäfler, M. Weissmann, and G. C. Craig, 2024: Influence of radiosonde observations on the sharpness and altitude of the midlatitude tropopause in the ECMWF IFS. Weather and Climate Dynamics, 5 (2), 491–509, 10.5194/wcd-5-491-2024.
- Lagerquist et al. (2021) Lagerquist, R., J. Q. Stewart, I. Ebert-Uphoff, and C. Kumler, 2021: Using Deep Learning to Nowcast the Spatial Coverage of Convection from Himawari-8 Satellite Data. Monthly Weather Review, 149 (12), 3897–3921, 10.1175/MWR-D-21-0096.1.
- Leinonen et al. (2022a) Leinonen, J., U. Hamann, and U. Germann, 2022a: Seamless Lightning Nowcasting with Recurrent-Convolutional Deep Learning. Artificial Intelligence for the Earth Systems, 1 (4), 10.1175/AIES-D-22-0043.1.
- Leinonen et al. (2022b) Leinonen, J., U. Hamann, U. Germann, and J. R. Mecikalski, 2022b: Nowcasting thunderstorm hazards using machine learning: the impact of data sources on performance. Natural Hazards and Earth System Sciences, 22 (2), 577–597, 10.5194/nhess-22-577-2022.
- Leinonen et al. (2023a) Leinonen, J., U. Hamann, D. Nerini, U. Germann, and G. Franch, 2023a: Latent diffusion models for generative precipitation nowcasting with accurate uncertainty quantification. arXiv, URL http://arxiv.org/abs/2304.12891, arXiv:2304.12891 [physics], 10.48550/arXiv.2304.12891.
- Leinonen et al. (2023b) Leinonen, J., U. Hamann, I. V. Sideris, and U. Germann, 2023b: Thunderstorm Nowcasting With Deep Learning: A Multi-Hazard Data Fusion Model. Geophysical Research Letters, 50 (8), e2022GL101 626, 10.1029/2022GL101626.
- Lucas and Kanade (1981) Lucas, B. D., and T. Kanade, 1981: An iterative image registration technique with an application to stereo vision (darpa). 121 - 130 pp.
- Luo et al. (2016) Luo, W., Y. Li, R. Urtasun, and R. Zemel, 2016: Understanding the Effective Receptive Field in Deep Convolutional Neural Networks. Advances in Neural Information Processing Systems, Curran Associates, Inc., Vol. 29, URL https://proceedings.neurips.cc/paper/2016/hash/c8067ad1937f728f51288b3eb986afaa-Abstract.html.
- Manzato et al. (2022) Manzato, A., S. Serafin, M. M. Miglietta, D. Kirshbaum, and W. Schulz, 2022: A Pan-Alpine Climatology of Lightning and Convective Initiation. Monthly Weather Review, 150 (9), 2213–2230, 10.1175/MWR-D-21-0149.1.
- McRoberts and Nielsen-Gammon (2017) McRoberts, D. B., and J. W. Nielsen-Gammon, 2017: Detecting Beam Blockage in Radar-Based Precipitation Estimates. Journal of Atmospheric and Oceanic Technology, 34 (7), 1407–1422, 10.1175/JTECH-D-16-0174.1.
- Mecikalski and Bedka (2006) Mecikalski, J. R., and K. M. Bedka, 2006: Forecasting Convective Initiation by Monitoring the Evolution of Moving Cumulus in Daytime GOES Imagery. Monthly Weather Review, 134 (1), 49–78, 10.1175/MWR3062.1.
- Mecikalski et al. (2010) Mecikalski, J. R., W. M. MacKenzie, M. Koenig, and S. Muller, 2010: Cloud-Top Properties of Growing Cumulus prior to Convective Initiation as Measured by Meteosat Second Generation. Part I: Infrared Fields. Journal of Applied Meteorology and Climatology, 49 (3), 521–534, 10.1175/2009JAMC2344.1.
- Müller et al. (2022) Müller, R., A. Barleben, S. Haussler, and M. Jerg, 2022: A Novel Approach for the Global Detection and Nowcasting of Deep Convection and Thunderstorms. Remote Sensing, 14 (14), 3372, 10.3390/rs14143372.
- Ortland et al. (2023) Ortland, S. M., M. J. Pavolonis, and J. L. Cintineo, 2023: The Development and Initial Capabilities of ThunderCast, a Deep Learning Model for Thunderstorm Nowcasting in the United States. Artificial Intelligence for the Earth Systems, 2 (4), 10.1175/AIES-D-23-0044.1.
- Paszke et al. (2019) Paszke, A., and Coauthors, 2019: PyTorch: an imperative style, high-performance deep learning library. Proceedings of the 33rd International Conference on Neural Information Processing Systems, 721, Curran Associates Inc., Red Hook, NY, USA, 8026–8037.
- Pavlík et al. (2024) Pavlík, P., M. Výboh, A. B. Ezzeddine, and V. Rozinajová, 2024: Fully Differentiable Lagrangian Convolutional Neural Network for Continuity-Consistent Physics-Informed Precipitation Nowcasting. arXiv, URL http://arxiv.org/abs/2402.10747, arXiv:2402.10747 [cs], 10.48550/arXiv.2402.10747.
- Pierce et al. (2012) Pierce, C., and Coauthors, 2012: Nowcasting. Doppler Radar Observations - Weather Radar, Wind Profiler, Ionospheric Radar, and Other Advanced Applications, IntechOpen, 10.5772/39054, URL https://www.intechopen.com/chapters/35109.
- Prudden et al. (2020) Prudden, R., S. Adams, D. Kangin, N. Robinson, S. Ravuri, S. Mohamed, and A. Arribas, 2020: A review of radar-based nowcasting of precipitation and applicable machine learning techniques. arXiv, URL http://arxiv.org/abs/2005.04988, arXiv:2005.04988 [physics, stat], 10.48550/arXiv.2005.04988.
- Pulkkinen et al. (2020) Pulkkinen, S., V. Chandrasekar, A. von Lerber, and A.-M. Harri, 2020: Nowcasting of Convective Rainfall Using Volumetric Radar Observations. IEEE Transactions on Geoscience and Remote Sensing, 58 (11), 7845–7859, 10.1109/TGRS.2020.2984594.
- Pulkkinen et al. (2019) Pulkkinen, S., D. Nerini, A. A. Pérez Hortal, C. Velasco-Forero, A. Seed, U. Germann, and L. Foresti, 2019: Pysteps: an open-source Python library for probabilistic precipitation nowcasting (v1.0). Geoscientific Model Development, 12 (10), 4185–4219, 10.5194/gmd-12-4185-2019.
- Rädler et al. (2019) Rädler, A. T., P. H. Groenemeijer, E. Faust, R. Sausen, and T. Púčik, 2019: Frequency of severe thunderstorms across europe expected to increase in the 21st century due to rising instability. npj Climate and Atmospheric Science, 2 (1), 30.
- Raspaud et al. (2018) Raspaud, M., and Coauthors, 2018: PyTroll: An Open-Source, Community-Driven Python Framework to Process Earth Observation Satellite Data. Bulletin of the American Meteorological Society, 99 (7), 1329–1336, 10.1175/BAMS-D-17-0277.1.
- Raupach et al. (2021) Raupach, T. H., and Coauthors, 2021: The effects of climate change on hailstorms. Nature Reviews Earth & Environment, 2 (3), 213–226, 10.1038/s43017-020-00133-9.
- Ravuri et al. (2021) Ravuri, S., and Coauthors, 2021: Skilful precipitation nowcasting using deep generative models of radar. Nature, 597 (7878), 672–677, 10.1038/s41586-021-03854-z.
- Ritvanen et al. (2023) Ritvanen, J., B. Harnist, M. Aldana, T. Mäkinen, and S. Pulkkinen, 2023: Advection-Free Convolutional Neural Network for Convective Rainfall Nowcasting. IEEE Journal of Selected Topics in Applied Earth Observations and Remote Sensing, 16, 1654–1667, 10.1109/JSTARS.2023.3238016.
- Ronneberger et al. (2015) Ronneberger, O., P. Fischer, and T. Brox, 2015: U-Net: Convolutional Networks for Biomedical Image Segmentation. Medical Image Computing and Computer-Assisted Intervention – MICCAI 2015, N. Navab, J. Hornegger, W. M. Wells, and A. F. Frangi, Eds., Springer International Publishing, Cham, 234–241, 10.1007/978-3-319-24574-4_28.
- Schmetz et al. (2002) Schmetz, J., P. Pili, S. Tjemkes, D. Just, J. Kerkmann, S. Rota, and A. Ratier, 2002: AN INTRODUCTION TO METEOSAT SECOND GENERATION (MSG). Bulletin of the American Meteorological Society, 83 (7), 977–992, 10.1175/1520-0477(2002)083¡0977:AITMSG¿2.3.CO;2.
- Selz et al. (2022) Selz, T., M. Riemer, and G. C. Craig, 2022: The Transition from Practical to Intrinsic Predictability of Midlatitude Weather. Journal of the Atmospheric Sciences, 79 (8), 2013–2030, 10.1175/JAS-D-21-0271.1.
- Shi et al. (2015) Shi, X., Z. Chen, H. Wang, D.-Y. Yeung, W.-k. Wong, and W.-c. Woo, 2015: Convolutional LSTM Network: a machine learning approach for precipitation nowcasting. Proceedings of the 28th International Conference on Neural Information Processing Systems - Volume 1, MIT Press, Cambridge, MA, USA, 802–810, NIPS’15.
- Smith et al. (2024) Smith, J., C. Birch, J. Marsham, S. Peatman, M. Bollasina, and G. Pankiewicz, 2024: Evaluating pySTEPS optical flow algorithms for convection nowcasting over the Maritime Continent using satellite data. Natural Hazards and Earth System Sciences, 24 (2), 567–582, 10.5194/nhess-24-567-2024.
- Stephenson (2000) Stephenson, D. B., 2000: Use of the “Odds Ratio” for Diagnosing Forecast Skill. Weather and Forecasting, 15 (2), 221–232, 10.1175/1520-0434(2000)015¡0221:UOTORF¿2.0.CO;2.
- Terti et al. (2017) Terti, G., I. Ruin, S. Anquetin, and J. J. Gourley, 2017: A Situation-Based Analysis of Flash Flood Fatalities in the United States. Bulletin of the American Meteorological Society, 98 (2), 333–345, 10.1175/BAMS-D-15-00276.1.
- Trebing et al. (2021) Trebing, K., T. Stanczyk, and S. Mehrkanoon, 2021: SmaAt-UNet: Precipitation nowcasting using a small attention-UNet architecture. Pattern Recognition Letters, 145, 178–186, 10.1016/j.patrec.2021.01.036.
- Ukkonen and Mäkelä (2019) Ukkonen, P., and A. Mäkelä, 2019: Evaluation of machine learning classifiers for predicting deep convection. Journal of Advances in Modeling Earth Systems, 11 (6), 1784–1802, https://doi.org/10.1029/2018MS001561, https://agupubs.onlinelibrary.wiley.com/doi/pdf/10.1029/2018MS001561.
- Vahid Yousefnia et al. (2024a) Vahid Yousefnia, K., T. Bölle, and C. Metzl, 2024a: Inferring Thunderstorm Occurrence from Vertical Profiles of Convection-Permitting Simulations: Physical Insights from a Physical Deep Learning Model. arXiv, URL http://arxiv.org/abs/2409.20087, arXiv:2409.20087 [physics], 10.48550/arXiv.2409.20087.
- Vahid Yousefnia et al. (2025) Vahid Yousefnia, K., T. Bölle, and C. Metzl, 2025: Increasing NWP Thunderstorm Predictability Using Ensemble Data and Machine Learning. arXiv, URL http://arxiv.org/abs/2502.13316, arXiv:2502.13316 [physics], 10.48550/arXiv.2502.13316.
- Vahid Yousefnia et al. (2024b) Vahid Yousefnia, K., T. Bölle, I. Zöbisch, and T. Gerz, 2024b: A machine-learning approach to thunderstorm forecasting through post-processing of simulation data. Quarterly Journal of the Royal Meteorological Society, 150 (763), 3495–3510, 10.1002/qj.4777.
- Wang et al. (2023) Wang, Y., H. Wu, J. Zhang, Z. Gao, J. Wang, P. S. Yu, and M. Long, 2023: PredRNN: A Recurrent Neural Network for Spatiotemporal Predictive Learning. IEEE Transactions on Pattern Analysis and Machine Intelligence, 45 (2), 2208–2225, 10.1109/TPAMI.2022.3165153.
- Wang et al. (2017) Wang, Y., and Coauthors, 2017: Guidelines for nowcasting techniques. World Meteorological Organization.
- Wilks (2019) Wilks, D. S., Ed., 2019: Statistical Methods in the Atmospheric Sciences (Fourth Edition). Elsevier, 10.1016/B978-0-12-815823-4.09987-9, URL https://www.sciencedirect.com/science/article/pii/B9780128158234099879.
- Winkler and Murphy (1968) Winkler, R. L., and A. H. Murphy, 1968: “Good” Probability Assessors. Journal of Applied Meteorology and Climatology, 7 (5), 751–758, 10.1175/1520-0450(1968)007¡0751:PA¿2.0.CO;2.
- Yang and Yuan (2023) Yang, S., and H. Yuan, 2023: A Customized Multi-Scale Deep Learning Framework for Storm Nowcasting. Geophysical Research Letters, 50 (13), e2023GL103 979, 10.1029/2023GL103979.
- Zhang et al. (2023) Zhang, Y., M. Long, K. Chen, L. Xing, R. Jin, M. I. Jordan, and J. Wang, 2023: Skilful nowcasting of extreme precipitation with NowcastNet. Nature, 619 (7970), 526–532, 10.1038/s41586-023-06184-4.
- Zhang et al. (2018) Zhang, Z., Q. Liu, and Y. Wang, 2018: Road Extraction by Deep Residual U-Net. IEEE Geoscience and Remote Sensing Letters, 15 (5), 749–753, 10.1109/LGRS.2018.2802944.
- Zhao et al. (2024) Zhao, Z., X. Dong, Y. Wang, and C. Hu, 2024: Advancing Realistic Precipitation Nowcasting With a Spatiotemporal Transformer-Based Denoising Diffusion Model. IEEE Transactions on Geoscience and Remote Sensing, 62, 1–15, 10.1109/TGRS.2024.3355755.
- Zhou et al. (2020) Zhou, K., Y. Zheng, W. Dong, and T. Wang, 2020: A Deep Learning Network for Cloud-to-Ground Lightning Nowcasting with Multisource Data. Journal of Atmospheric and Oceanic Technology, 37 (5), 927–942, 10.1175/JTECH-D-19-0146.1.