Resampling Benchmark for Efficient Comprehensive Evaluation of
Large Vision-Language Models
Abstract
We propose an efficient evaluation protocol for large vision-language models (VLMs). Given their broad knowledge and reasoning capabilities, multiple benchmarks are needed for comprehensive assessment, making evaluation computationally expensive. To improve efficiency, we construct a subset that yields results comparable to full benchmark evaluations. Our benchmark classification experiments reveal that no single benchmark fully covers all challenges. We then introduce a subset construction method using farthest point sampling (FPS). Our experiments show that FPS-based benchmarks maintain a strong correlation (> 0.96) with full evaluations while using only 1% of the data. Additionally, applying FPS to an existing benchmark improves correlation with overall evaluation results, suggesting its potential to reduce unintended dataset biases.
Resampling Benchmark for Efficient Comprehensive Evaluation of
Large Vision-Language Models
Teppei Suzuki SB Intuitions teppei.suzuki@sbintuitions.co.jp Keisuke Ozawa SB Intuitions keisuke.ozawa@sbintuitions.co.jp
1 Introduction
Large language models (LLMs) have significantly advanced machine intelligence Touvron et al. (2023); Aizawa et al. (2024); Team et al. (2024); Jiang et al. (2023). Following this progress, large vision-language models (VLMs) have emerged Liu et al. (2024c); Dai et al. (2023); Liu et al. (2024a); Bai et al. (2023), enabling performance across a wide range of image and language tasks. The impressive capabilities and practicality of LLMs and VLMs have spurred industries and academic institutions to develop foundation models You et al. (2023); Touvron et al. (2023); Aizawa et al. (2024); Team et al. (2024); Jiang et al. (2023); Bai et al. (2023); Alayrac et al. (2022).
Model evaluation is a critical step in the development of VLMs. Especially, since foundation models including VLMs are designed to support a large variety of tasks, diverse datasets and tasks are required to thoroughly assess their capabilities. Numerous benchmarks have been developed to evaluate different aspects of these models’ performance Zhang et al. (2024d, c); Wang et al. (2024b); Gu et al. (2024). Additionally, benchmarks covering comprehensive domains and tasks have been proposed to assess broader general knowledge and advanced reasoning abilities of VLMs Yue et al. (2024); Li et al. (2023b, a, 2024a); Liu et al. (2023a); Wang et al. (2024a).
However, there is currently no standardized policy for the collection and evaluation of these benchmarks. In fact, VLMs are ranked differently depending on the benchmark used, indicating that model performance is biased towards specific data types and tasks. This observation suggests that even the large benchmarks do not provide a comprehensive evaluation each alone. To address this, an averaged ranking across multiple benchmarks is often employed to evaluate VLMs more comprehensively Duan et al. (2024). Averaging per-benchmark rankings is expected to give a more balanced assessment of models across various tasks and domains, beyond what any single benchmark can cover. However, this approach requires costly evaluations using data from all benchmarks, which is resource-intensive.
Given the recent increase in the number of benchmarks and the data therein, it is advantageous for both developers and users to speed up the comprehensive evaluation of VLMs. Preparing a shortcut protocol that requires much less data but still allows us to approximate the performance trends of models as accurately as a full evaluation over the entire dataset would further benefit the community.
For the aforementioned reasons, in this work, we focus on improving the efficiency of evaluation. We first conduct a dataset classification experiment Torralba and Efros (2011) using 16 multiple choice question benchmarks Liu et al. (2023a); Li et al. (2023b, a, 2024a); Lu et al. (2022); Wu et al. (2023); Zhang et al. (2024d); Kembhavi et al. (2016); Chen et al. (2024a); XAI (2024); Zhang et al. (2024a); Schwenk et al. (2022); Yue et al. (2024); Chen et al. (2024b); Wang et al. (2024e); Huang et al. (2024b) and 11 visual question answering benchmarks Mishra et al. (2019); Singh et al. (2019); Mathew et al. (2021, 2022); Masry et al. (2022); Hudson and Manning (2019); Liu et al. (2023b); Wang et al. (2024b); Kim et al. (2024); Wang et al. (2024d); Yu et al. (2023). Through this experiment, we find that there is no single benchmark capable of enabling comprehensive evaluation, and also suggests that some overlap among specific benchmarks. Based on these findings, we propose a protocol that constructs subsets from existing benchmarks using farthest point sampling (FPS) in the feature space, and then performs evaluations using these subsets.
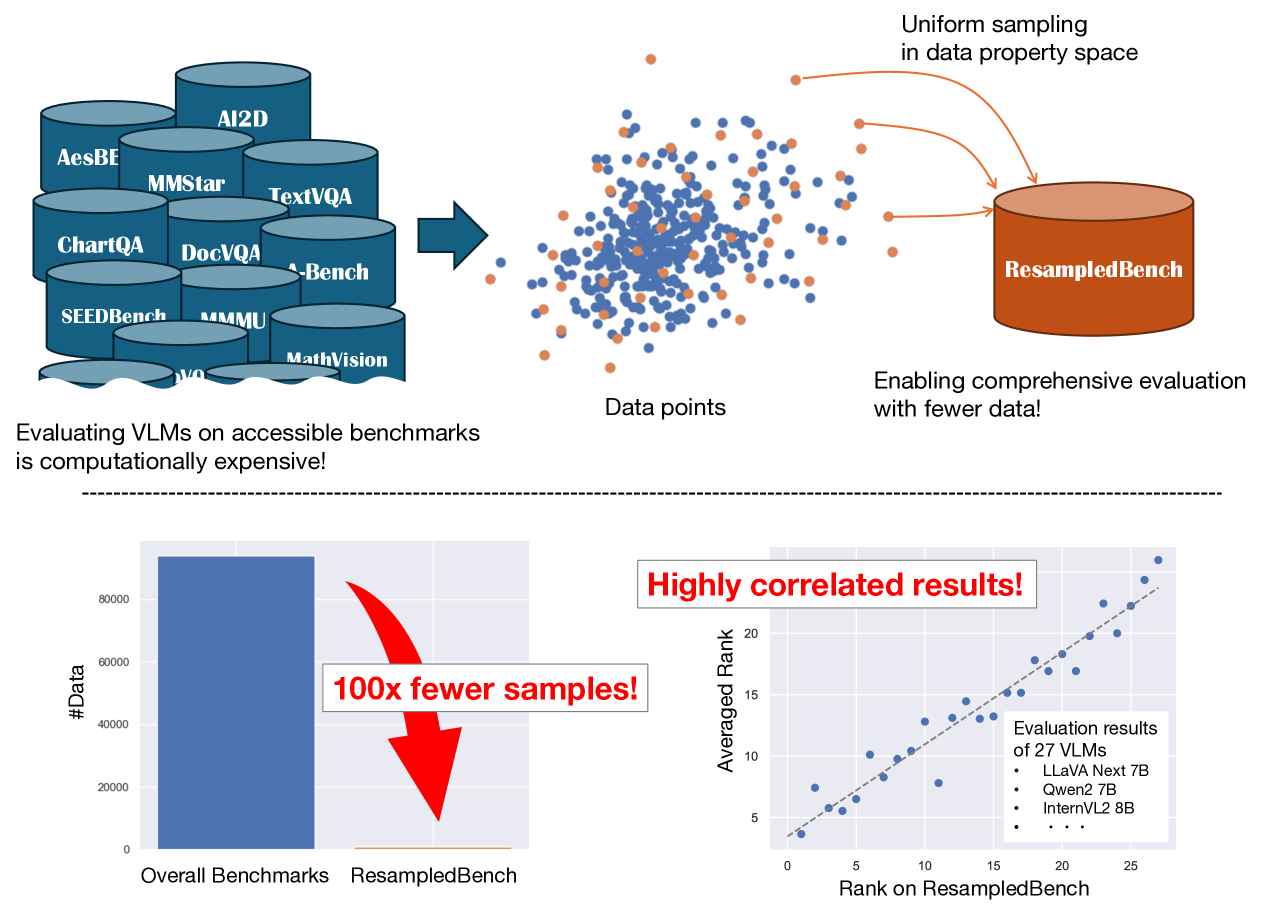
We refer to the benchmark constructed through this sampling method as ResampledBench. It is significantly smaller in scale compared to the original benchmarks, thereby enabling more efficient evaluations. In addition, we demonstrate that applying the proposed sampling strategy to MMStar Chen et al. (2024a), which is carefully curated and balanced by human experts, improves its correlation with the average rank. This result highlights its potential as a filtering technique in benchmark construction. An overview of this study is presented in Fig. 1.
2 Related Work
Evaluation is particularly important for continuous improvement and setting policies in machine learning community. Especially, LLM-based models, including LLMs Touvron et al. (2023); Aizawa et al. (2024); Team et al. (2024); Jiang et al. (2023), VLMs Liu et al. (2024c); Dai et al. (2023); Liu et al. (2024a); Bai et al. (2023), have broader knowledge and advanced reasoning capabilities, and they should be evaluated on multiple benchmarks for assessing their capabilities from diverse viewpoints Kwiatkowski et al. (2019); Liu et al. (2024c); Li et al. (2023c); Hendrycks et al. (2020); Clark et al. (2019); Lin et al. (2021); Wang et al. (2024a); Tanaka et al. (2023); Luo et al. (2024). To make evaluation of VLMs feasible comprehensively on multiple benchmarks, some platforms have been developed evaluation toolkits on multiple benchmarks with the same manner Zhang et al. (2024b); Duan et al. (2024).
| Input | I | Q | A | I + Q | I + A | Q + A | I + Q + A |
|---|---|---|---|---|---|---|---|
| Acc. | 0.7520.007 | 0.5400.013 | 0.1050.018 | 0.7930.010 | 0.7620.005 | 0.5400.014 | 0.7910.014 |
| Input | I | Q | A | I + Q | I + A | Q + A | I + Q + A |
|---|---|---|---|---|---|---|---|
| Acc. | 0.7570.012 | 0.9000.005 | 0.8930.003 | 0.9830.003 | 0.9930.003 | 0.9580.005 | 0.9930.002 |
A wide range of benchmarks are currently used for VLM evaluation. Most of these benchmarks focus on assessing certain capabilities, such as text-rich images (e.g., documents, charts, diagrams, and infographics Mishra et al. (2019); Liu et al. (2023b); Li et al. (2024a); Mathew et al. (2022)), low-level vision tasks Rahmanzadehgervi et al. (2024); Wu et al. (2023), and subject knowledge at high school and college levels Yue et al. (2024); Lu et al. (2022).
While there are benchmarks aimed at comprehensive evaluation Zhang et al. (2024b); Chen et al. (2024a); Li et al. (2023b); Liu et al. (2023a); Ying et al. (2024), achieving a truly exhaustive assessment of VLMs still requires the use of multiple benchmarks. This is because new challenges and evaluation perspectives continually emerge, necessitating a broader set of evaluation criteria. For example, HallusionBench Guan et al. (2023) was introduced to address hallucination issues, and BlindTest Rahmanzadehgervi et al. (2024) was proposed in response to findings that VLMs struggle with low-level vision tasks, such as counting line intersections or identifying rows and columns in grids. These benchmarks were developed from newly emerging perspectives as VLM evaluation techniques advanced, making it challenging to anticipate such specific evaluation needs from the outset.
Evaluating a model based on its aggregated performance across multiple benchmarks provides a more reliable measure of its overall capabilities compared to using a single benchmark. However, performing evaluations on multiple benchmarks is computationally expensive and resource-intensive. There are some studies for making LLM evaluation on multiple benchmarks more efficient Polo et al. (2024); Perlitz et al. (2023), but their procedure cannot be directly applied to multimodal data. Thus, we analyze data for VLM evaluation from the dataset classification perspective, and propose a simple procedure for efficient evaluation.
 |
 |
| (a) MCQ | (b) VQA |
3 Dataset Classification for Assessing Comprehensiveness
In this section, we conduct the dataset classification experiment Torralba and Efros (2011) to verify how much overlap exists in the tasks and domain data in each benchmark. Intuitively, data in a benchmark collected comprehensively over diverse domains and tasks should be misclassified as belonging to the other benchmarks, because similar data would be found in the other benchmarks. Such a benchmark can therefore serve as a comprehensive evaluator.
We randomly sample 1,000 data points as training data from each benchmark or 80% samples of the available data if the benchmark contains fewer than 1,000 samples, with remaining 20% samples used as the test data. We train a dataset classifier consisting of a linear classifier on top of a pretrained encoder using the linear probing protocol, meaning that only the linear classifier is trained.
We focus on two major task formats for VLM evaluation: multiple choice questions (MCQ), where an answer is selected from a set of options, and visual question answering (VQA), which requires generating open-ended answers. We select 16 Liu et al. (2023a); Li et al. (2023b, a, 2024a); Lu et al. (2022); Wu et al. (2023); Zhang et al. (2024d); Kembhavi et al. (2016); Chen et al. (2024a); XAI (2024); Zhang et al. (2024a); Schwenk et al. (2022); Yue et al. (2024); Chen et al. (2024b); Wang et al. (2024e); Huang et al. (2024b) for MCQ and 11 benchmarks Mishra et al. (2019); Singh et al. (2019); Mathew et al. (2021, 2022); Masry et al. (2022); Hudson and Manning (2019); Liu et al. (2023b); Wang et al. (2024b); Kim et al. (2024); Wang et al. (2024d); Yu et al. (2023) for VQA. Note that we do not use data from original sources but instead rely on VLMEvalKit Duan et al. (2024), as it provides standardized data formats across benchmarks, and the categorization of benchmarks (i.e., MCQ or VQA) follows the VLMEvalKit guidelines.
Since VLM benchmarks commonly consist of three data types (i.e., images, questions, and answers), we conduct the dataset classification using various input combinations, such as images only, answer only, and a combination of images and questions. For text embedding, we use pretrained DeBERTa-v3-base He et al. (2021), and for image embedding, we use CLIP ViT-L/14 Radford et al. (2021); Dosovitskiy et al. (2021). After independently encoding the texts and images, we concatenate the resulting text and image embeddings and input them into the linear classifier.
We train the linear classifier for 10 epochs with a batch size of 64. The parameters are updated using the Adam optimizer with the default hyperparameters Kingma and Ba (2015).
The classification accuracy for each input is shown in Tabs. 1 and 2. We report averaged accuracy and standard deviation over 5 trials. Except for the MCQ task using answer inputs, the model performs well across all conditions. We attribute that these results are mainly due to the selection biases. Most benchmarks are intentionally collected from specific domains and tasks, such as scientific domains Yue et al. (2024); Kembhavi et al. (2016); Lu et al. (2022), OCR tasks Mathew et al. (2021); Liu et al. (2023b); Kim et al. (2024); Mishra et al. (2019), and mathematics Wang et al. (2024b). In addition, benchmarks focusing on the similar domains and tasks, such as OCRVQA Mishra et al. (2019) and OCRBench Liu et al. (2023b)), are highly discriminative, which may be due to unintended selection bias. These results suggest that each benchmark evaluates specific domains and tasks, and there is no benchmark that can comprehensively assess the full capabilities of VLMs.
The lower accuracy observed for MCQ using answer inputs is due to the fact that the answers are typically symbolic and lack meaningful content. As a result, the inclusion of answers does not improve accuracy when comparing the results of using only images and questions versus using images, questions, and answers together. In contrast, for VQA, the answers are more informative than the questions, as they describe the content of the input image, and the questions are somewhat uninformative. Therefore, adding questions does not enhance accuracy when combined with image and answer inputs.
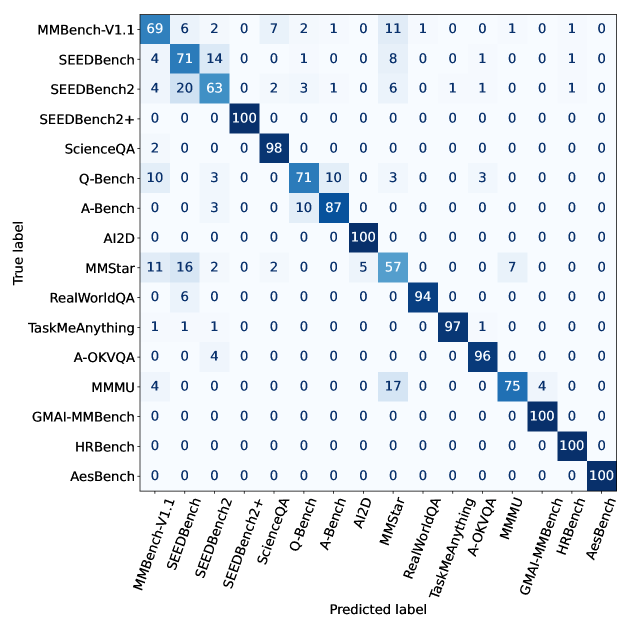
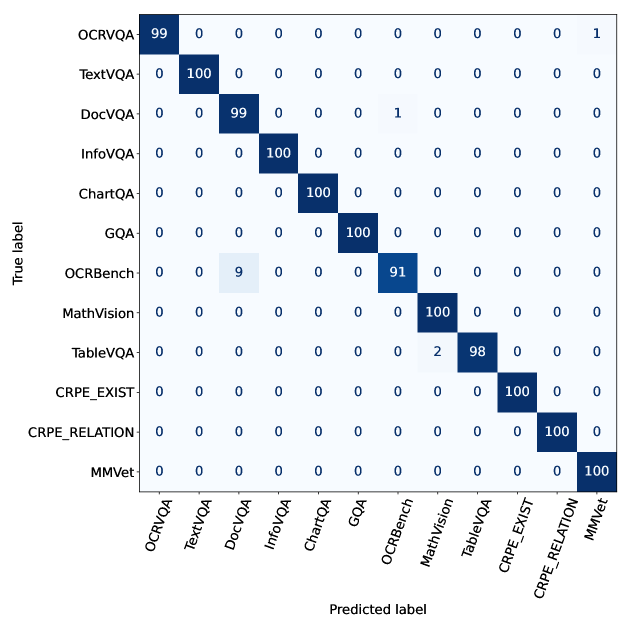
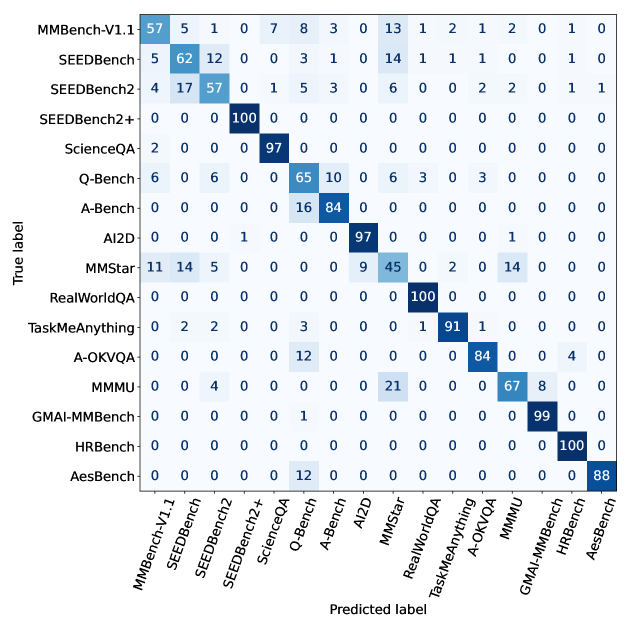
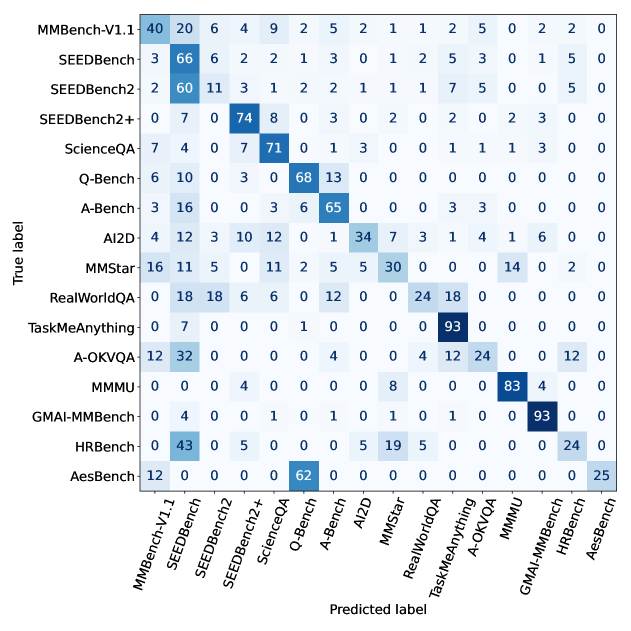
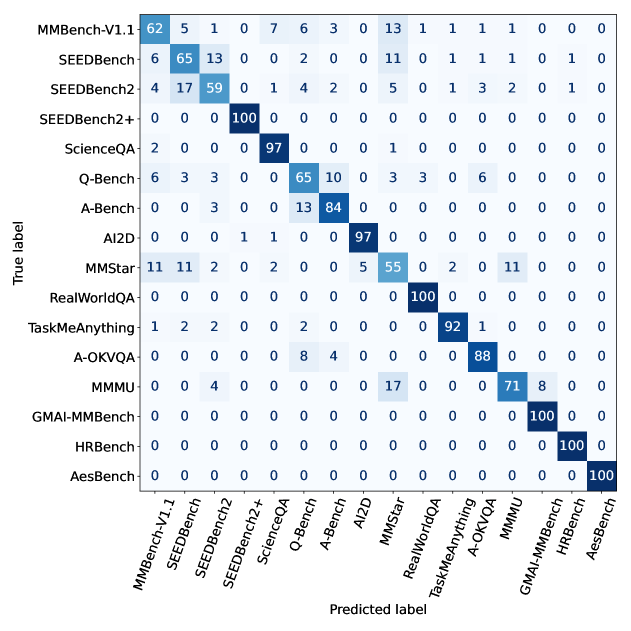
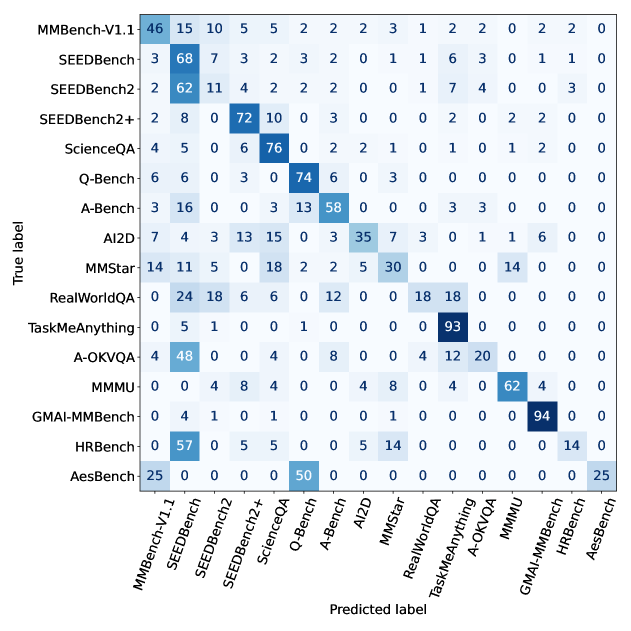
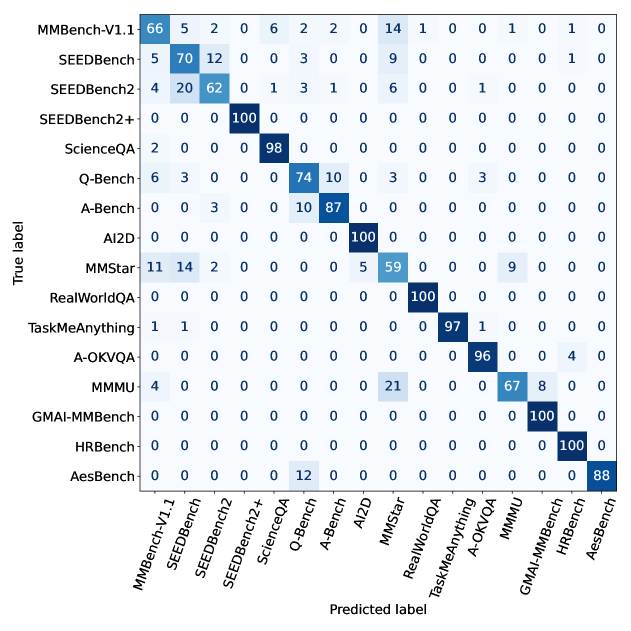
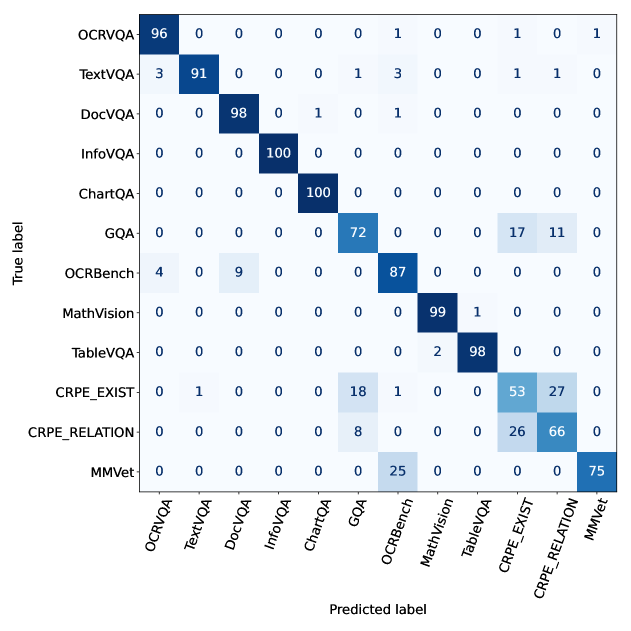
We also present confusion matrices for the MCQ task using image and question inputs, and for the VQA task using image, question, and answer inputs in Fig. 2. The confusion matrices for the other configurations are available in the appendix.
As shown in Tab. 2, VQA benchmarks are classified almost perfectly. That is because most VQA benchmarks focus on specific tasks or domains, such as an OCR task and document understanding, which simplifies the classification of VQA benchmarks. Some data from OCRBench Liu et al. (2023b) is misclassified as DocVQA Mathew et al. (2021), which can be attributed to the fact that 50 out of the 1,000 samples in OCRBench are derived from DocVQA and some of these samples are included in the randomly split test data.
MMStar Chen et al. (2024a) is the most challenging benchmark to classify. It is composed of carefully balanced and purified samples, and contains various domain images, encompassing a wide range of domains such as illustrations, natural images, charts, and art. Additionally, each selected sample is verified by human reviewers to ensure visual dependency, minimal data leakage, and the need for advanced multimodal capabilities for problem-solving These aspects contribute to MMStar’s comprehensive. Nevertheless, more than half of the data could be classified correctly, which is above the chance rate. This suggests that over half of MMStar’s data is distinct when compared to other benchmarks.
Other hard-to-classify benchmarks, such as MMBench Liu et al. (2023a) and SEEDBench Li et al. (2023b), are also designed to be comprehensive. Conversely, the benchmarks that are easier to classify, such as SEEDBench2+ Li et al. (2024a) and AI2D Kembhavi et al. (2016), are biased toward specific fields and domains, such as scientific fields and chart images.
From another perspective, some data remains misclassified, indicating that there is overlap in the types of data included across benchmarks. In other words, evaluating multiple benchmarks may involve some degree of redundant assessment. Therefore, in the next section, we explore ways to optimize the evaluation process by reducing this redundancy.
In summary of the insights from the experiments in this section, there are no benchmarks capable of comprehensively assessing VLM capabilities. To evaluate VLMs from diverse perspectives, multiple benchmarks are necessary. However, evaluating dozens of benchmarks is time-consuming and somewhat redundant, as evidenced in Fig. 2, where some benchmarks cannot be classified with 100% accuracy, suggesting that some data overlaps.
4 Ranking Benchmarks and Resampling as Comprehensive evaluators
4.1 Ranking Benchmarks
The fact that the benchmarks can be classified with high accuracy rates suggests that certain biases are present in these benchmarks. Additionally, each model’s rank on individual benchmarks may be affected by benchmark-specific biases, such as data collection policies and human preferences. To address this issue, we use averaged ranks to mitigate such biased evaluations by averaging all ranks measured across all accessible benchmarks.
Given a set of models to be evaluated and a set of benchmarks , where consists of triplets of an image , a question , and an answer , the averaged rank of model is defined as follows:
| (1) |
where is the total number of the benchmarks, and the ranks of model on each benchmark is determined by its score relative to the other models . In the experiments, we compute the averaged ranks of 27 models using 26 benchmarks, which are listed in Appendix.
We consider to represent a comprehensive evaluation of a model’s capabilities. Based on this assumption, we evaluate the comprehensiveness of each benchmark by measuring the correlation between the ranks on individual benchmarks and . For the correlation between ranks, we evaluate using Spearman’s rank correlation coefficient in our experiments.
4.2 Resampling Benchmarks for efficient and comprehensive evaluation
is the result of evaluating the models in a comprehensive manner, as opposed to evaluating them on individual benchmarks. Unfortunately, the total number of samples in the benchmarks can often be quite large, which incurs significant costs in terms of both time and computational resources. To reduce the evaluation cost while maintaining the comprehensiveness of models assessments, we resample data from the accessible benchmarks. The goal is to use as few samples as possible to make the evaluation more efficient, yet still achieve a level of comprehensiveness comparable to using the full set of data.
To achieve this, we consider sampling data from the existing datasets such that the sampling is uniformly distributed across a space where data properties, such as tasks and domains, are well-described. Based on the results of the benchmark classification experiments conducted in the previous section, we found that the benchmarks can be effectively classified within the feature space spanned by the pretained encoders. This suggests that the feature space constructed by pretrained models captures the differences between tasks and domains. Thus, we assume that this feature space can serve for these properties and proceed with evaluations within this space.
The sampling strategy is crucial for ensuring that the sampled data comprehensively covers the entire dataset. To enhance comprehensiveness of the benchmark, data should be sampled uniformly in the data property space. For this purpose, we use farthest point sampling (FPS) Eldar et al. (1997). It is widely used for point cloud sampling in 3D computer vision Qi et al. (2017, 2019); Yan et al. (2020), and we adopt it to sample points uniformly across the spatial dimensions of the feature space.
Let be a set of data points and be an image-text encoder consisting of DeBERTa-v3-base He et al. (2021) and CLIP ViT-14/L Radford et al. (2021); Ilharco et al. (2021). Define as a set consisting of a query data point randomly selected from . Then, an -th sampled point by FPS is defined as follows:
| (2) |
where is an arbitrary distance function, and we use the Euclidean distance in our experiments.
We believe this approach not only samples diverse data, but is also expected to reduce biases within the dataset because of the uniformity induced by FPS. Furthermore, our experiments suggest that applying FPS in the feature space can sever as a filtering process to mitigate the dataset biases.
5 Experimental Results
We evaluate the comprehensiveness of our resampled benchmarks, ResampledBench, by examining whether the ranks measured on them show high correlations with the averaged ranking (). To assess how effectively existing benchmarks serve as comprehensive evaluators and whether our resampled benchmarks can provide a better evaluation, we compare the Spearman correlations of the existing benchmarks and our resampled ones with .
In all the experiments, we evaluate 27 VLMs with roughly 1B to 10B parameters Chen et al. (2023, 2024c); Bai et al. (2023); Wang et al. (2024c); Liu et al. (2024b); Laurençon et al. (2024); Li et al. (2024b); Huang et al. (2024a); Yao et al. (2024); Lu et al. (2024); Abdin et al. (2024); WeChat (2023); Dong et al. (2024); Zhipu AI (2024); H2O.ai (2024); Xue et al. (2024) on these benchmarks for computing the ranks because most publicly available VLMs have fewer than 15 billion parameters as shown in Fig. 7 in the appendix. The models are listed in the appendix. We select 26 benchmarks Liu et al. (2023a); Li et al. (2023b, 2024a); Lu et al. (2022); Wu et al. (2023); Zhang et al. (2024d); Kembhavi et al. (2016); Chen et al. (2024a); XAI (2024); Zhang et al. (2024a); Schwenk et al. (2022); Yue et al. (2024); Chen et al. (2024b); Huang et al. (2024b); Mishra et al. (2019); Singh et al. (2019); Mathew et al. (2021, 2022); Masry et al. (2022); Hudson and Manning (2019); Liu et al. (2023b); Wang et al. (2024b, d); Yu et al. (2023) from Fig. 2, each data of which consists of a single image with a question written in English, and the answers are provided in text. Benchmarks requiring multiple inputs are omitted in our evaluation as there are relatively few models that support multiple languages, multiple image inputs, or image outputs. For example, SEEDBench2 Li et al. (2023a) requires image generation skills to answer the questions. The total number of data points across all the benchmarks is 93,996. We follow the VLMEvalKit evaluation protocol Duan et al. (2024).
5.1 How Comprehensive Existing Benchmarks Are
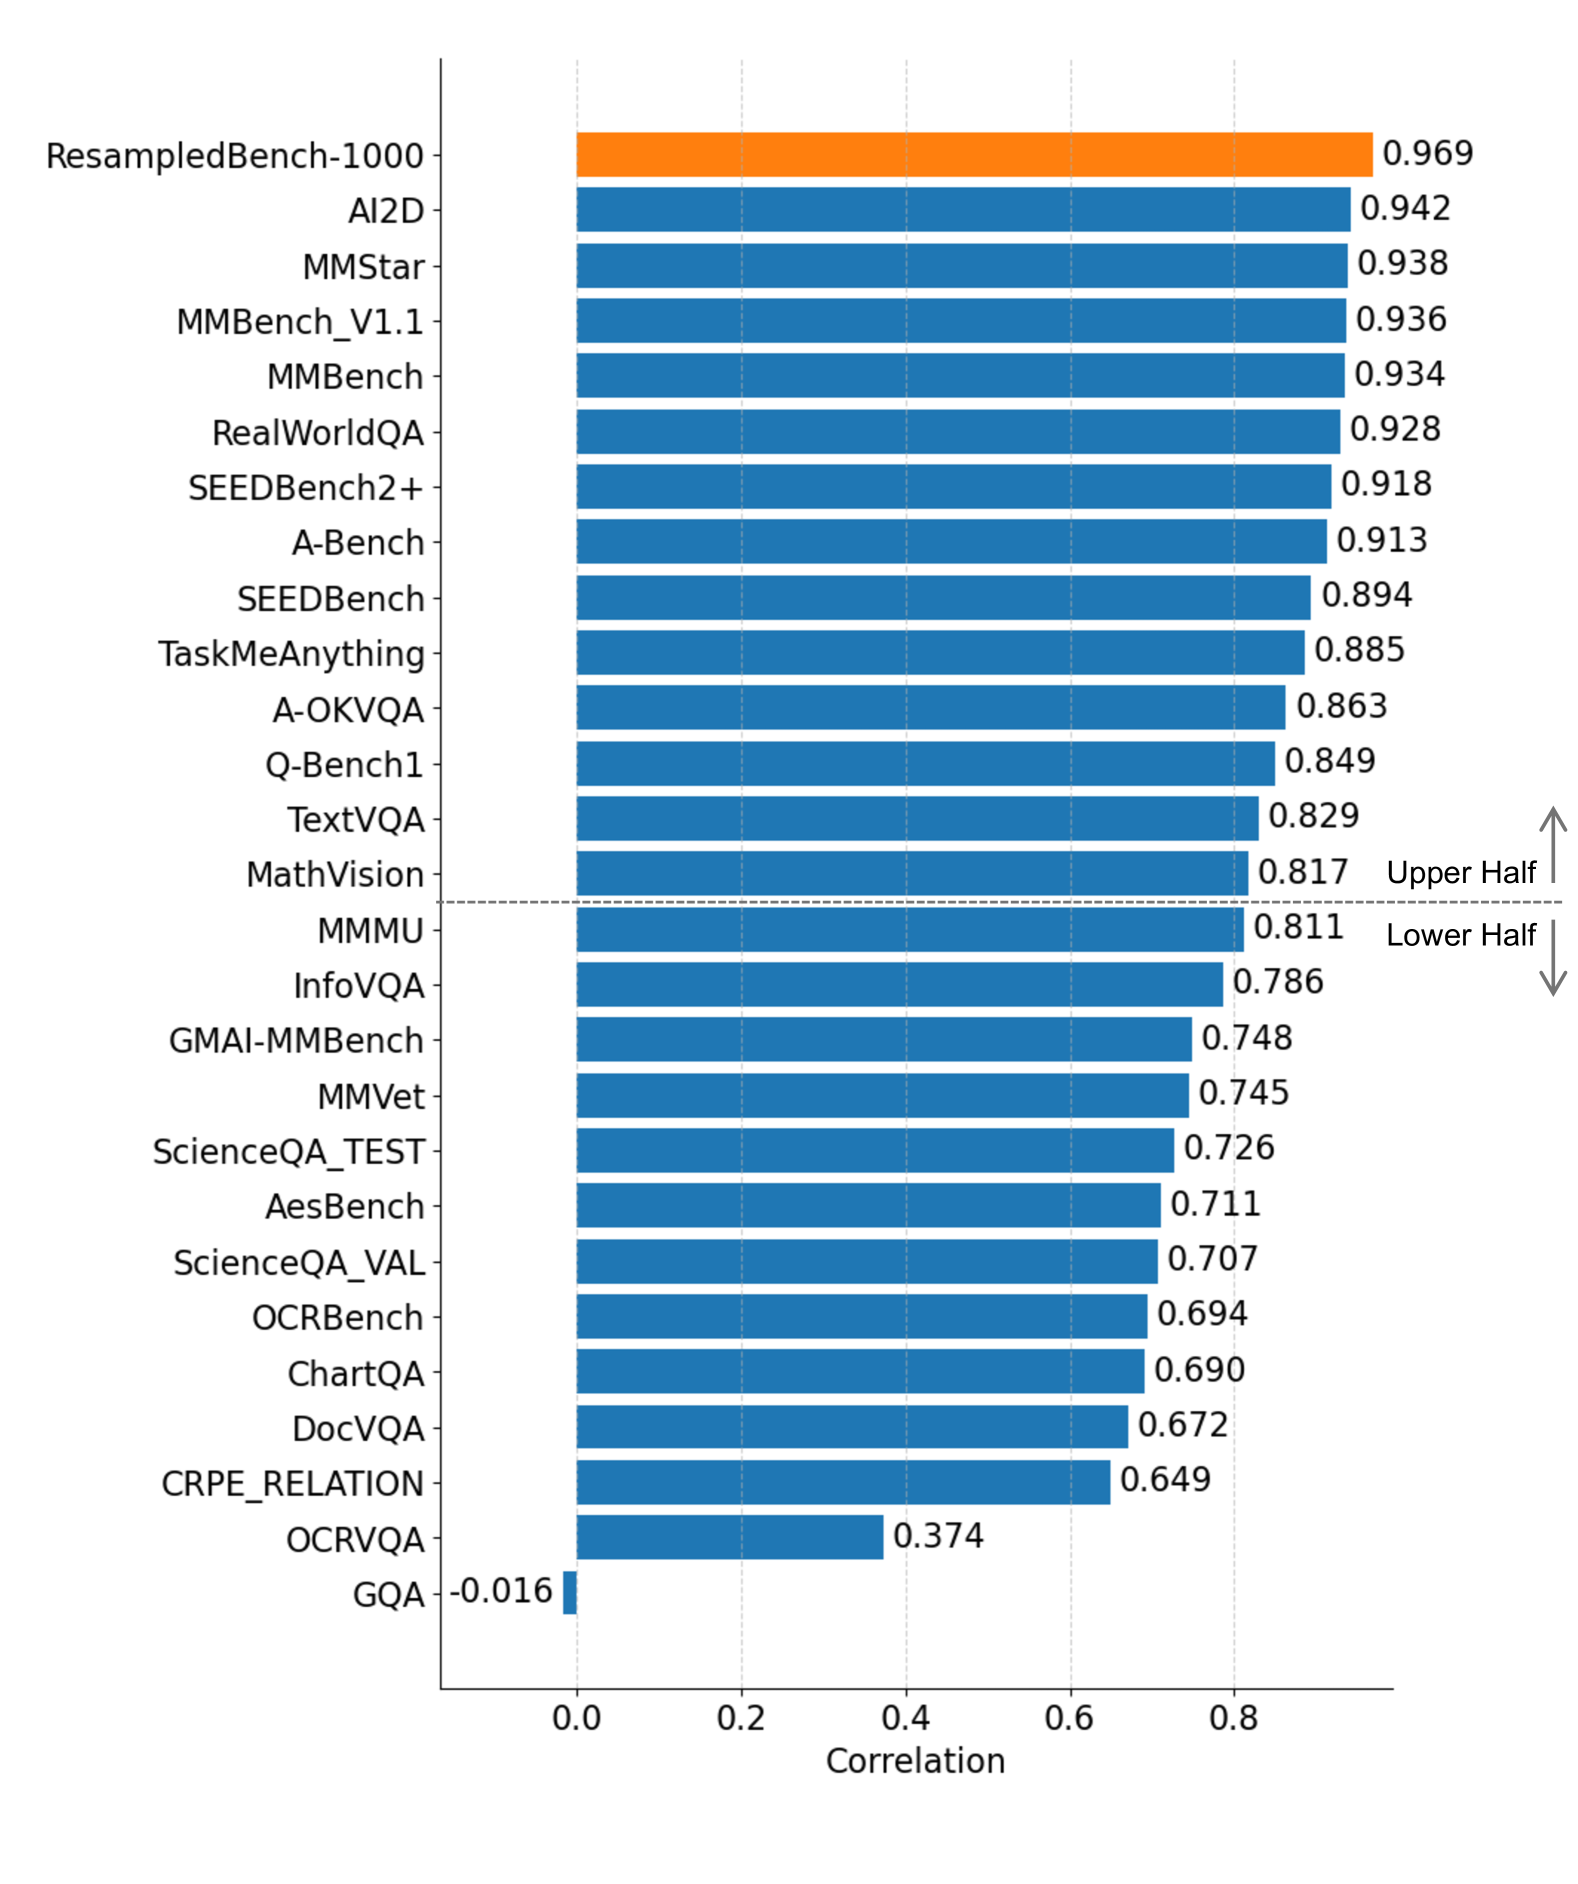
We evaluate the correlations between and the ranks on individual benchmarks. Fig. 3 shows the ordering of the correlations. Benchmarks such as MMStar Chen et al. (2024a), MMBench series Liu et al. (2023a), SeedBench series Li et al. (2023b, 2024a) show relatively high correlations with . These benchmarks include data from various categories and cover diverse tasks to measure reasoning capabilities of VLMs. In contrast, ChartQA Masry et al. (2022), DocVQA Mathew et al. (2021), CRPE_RELATION Wang et al. (2024d), and OCRVQA Mishra et al. (2019) show lower correlations, which aligns with the fact that these benchmarks are designed to evaluate specific skills. Among those with lower correlations, GQA Hudson and Manning (2019) shows particulary low correlation. This is considerably because this benchmark focuses on assessing compositionality understanding and has inherent biases when compred to the others. We also see that MMStar Chen et al. (2024a), which ranks second in correlation, focuses on a comprehensive evaluation and indeed shows a strong correlation with . This result supports our hypothesis that using for comprehensive evaluation aligns with the tendencies observed in the existing benchmarks. Notably, AI2D Kembhavi et al. (2016) has the highest correlation despite its focus on scientific diagrams. This is likely because AI2D Kembhavi et al. (2016) compensates for the bias toward the image domain by requiring diverse capability, such as OCR skills, complex reasoning, and general knowledge in addition to the scientific knowledge.
5.2 Evaluating the Comprehensiveness of ResampledBench
In this section, we verify that our resampled benchmarks enable comprehensive evaluation. As a baseline approach, we evaluate a random sampling strategy from benchmarks. In the random sampling, the probability of sampling data from a specific benchmark is proportional to the number of data points within that dataset. This sampling strategy is reasonable because it aligns with the benchmark composition ratios in calculating .
| Benchmark | Upper Half | Lower Half | All |
|---|---|---|---|
| Random | 0.9640.009 | 0.7010.015 | 0.8360.026 |
| FPS | 0.9690.002 | 0.7260.019 | 0.9690.006 |
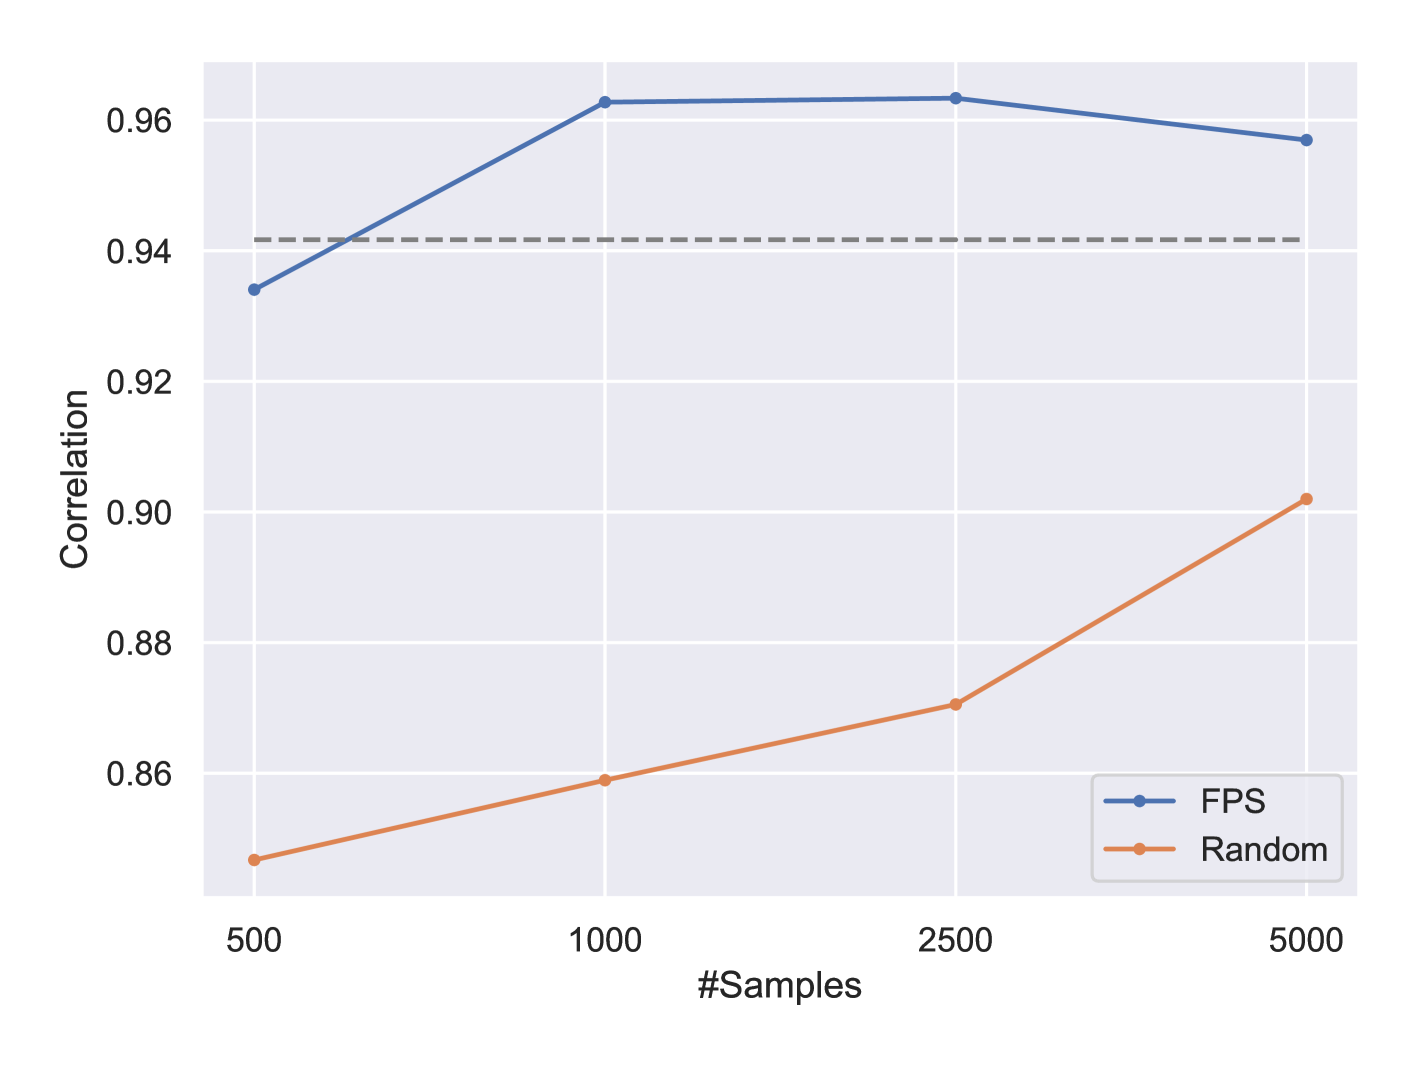
Fig. 4 compares the ranking correlations of FPS- and Random-resampled benchmarks with different number of samples. FPS exhibits higher correlations to than Random for all the four numbers of sampling. This result indicates that using FPS provides more comprehensive benchmarks than random sampling from the whole datasets. Also, on top of Fig. 3, we place our ResampledBench-1000 sampled 1000 points using FPS, and we have the higher correlation than all the other benchmarks. AI2D, which shows the second highest correlation in Fig. 3, contains 3,088 data points, which is three times the amount used by our proposed method. The 1,000 samples are roughly 100 fewer than the total number of data points across all benchmarks. The computational speed cannot be definitively stated, as it depends on the parallelism of the hardware and the model itself. However, ResampleBench-1000 can, in simple terms, evaluate models with 100 greater efficiency.
We observe that the accuracy plateaued at around 1,000 samples. This suggests that approximately 1,000 samples are sufficient to comprehensively evaluate the tasks covered by the benchmarks used in this experiment. Note that, as shown in eq. (1), is a continuous value, whereas the rank calculated on a single benchmark is an integer. Therefore, the correlation coefficient between them will not be exactly 1. When sampling 5,000 data by FPS, the correlation is a little lower than that with 1,000 and 2,500 data. This is most likely caused by a distortion in the feature space. In Sec. 3, we confirmed that the feature space of the pretrained model can separate differences between benchmarks; however, this does not guarantee that the feature space captures the finer characteristics of the data. We believe that with a small number of samples, it is possible to achieve uniform sampling by FPS that follows the major differences in tasks and domains. However, as the number of samples increases, the sampling process starts to pick up distortions in the feature space, leading to biases in the data. As a result, this may have caused the drop in correlation observed with 5,000 samples.
We also evaluate FPS and random sampling with different data sources to see their tendencies under various scenarios given more or less diverse benchmarks. Based on Fig. 3, we divide the existing benchmarks into two groups based on the level of correlation. We then sample from the high-correlation group (upper half) and the low-correlation group (lower half) separately.
As shown in Tab. 3, FPS shows higher correlation than random sampling across all settings. In addition, FPS achieves the same correlation under sampling from the upper half and from all benchmarks, which implies that FPS can stably sample diverse data even as the number of benchmarks increases. For the sampling from the lower half set, FPS cannot achieve higher correlation than the highest correlation among the benchmarks in the lower half set. The benchmarks in the lower half set have relatively more bias. We believe that such a biased data distribution amplifies the impact of distortions in the feature space during sampling.
5.3 Toward Automated Filtering of Benchmarks with Unintended Bias
The results so far suggest that FPS can uniformly sample a diverse range of data, and to further confirm this, we will investigate whether sampling a subset of data from the existing benchmark, MMStar Chen et al. (2024a), can mitigate unintended biases. MMStar is carefully balanced and purified by human experts and is designed to benchmark 6 core capabilities and 18 detailed axes. Since, as discussed in Torralba and Efros (2011), it is difficult to completely eliminate selection bias, there may be unintended biases. Thus, by sampling data from MMStar with FPS as filtering and evaluate correlation to , we confirm FPS on the feature space uniformly samples diverse data.
MMStar contained 1,500 samples and we sample 1,000 samples by FPS. We perform this sampling three times with different random seeds and evaluate the mean and standard deviation of the correlation with .
The correlation between and the sampled benchmark is , which is higher than the correlation between MMStar and as shown in Fig. 3 (0.938). This indicates FPS on the feature space can mitigate the unintended biases contained in the benchmark, and highlights its potential for use as a filtering technique in benchmark construction.
6 Conclusion
We addressed the challenge of efficiently evaluating large vision-language models (VLMs), which are increasingly important in industry and academia. Our dataset classification experiments revealed overlaps among benchmarks, highlighting the lack of a single comprehensive evaluation benchmark. To address this, we proposed a protocol using farthest point sampling (FPS) in feature space to construct subsets from existing benchmarks. This method enables efficient evaluation using a fraction of the data while maintaining a strong correlation (> 0.96) with full benchmark assessments.
Experiments using FPS on MMStar demonstrate its potential for reducing bias in benchmark construction. As future work, we aim to extend this approach to create new, more diverse, and unbiased benchmarks, enhancing VLM evaluation.
Limitation. As seen in Fig. 4, our sampling strategy slightly degraded correlation when the number of samples increased. This indicates that the feature space is somewhat distorted, causing biases to emerge as the sample size increases, even if the sampling is spatially uniform. The distortion in the feature space is likely due to the fact that the text and image encoders were trained independently. Therefore, as a future direction, we aim to work on learning a multimodal embedding space that integrates both text and image information.
References
- Abdin et al. (2024) Marah Abdin, Jyoti Aneja, Hany Awadalla, Ahmed Awadallah, Ammar Ahmad Awan, Nguyen Bach, Amit Bahree, Arash Bakhtiari, Jianmin Bao, Harkirat Behl, et al. 2024. Phi-3 technical report: A highly capable language model locally on your phone. arXiv preprint arXiv:2404.14219.
- Aizawa et al. (2024) Akiko Aizawa, Eiji Aramaki, Bowen Chen, Fei Cheng, Hiroyuki Deguchi, Rintaro Enomoto, Kazuki Fujii, Kensuke Fukumoto, Takuya Fukushima, Namgi Han, et al. 2024. Llm-jp: A cross-organizational project for the research and development of fully open japanese llms. arXiv preprint arXiv:2407.03963.
- Alayrac et al. (2022) Jean-Baptiste Alayrac, Jeff Donahue, Pauline Luc, Antoine Miech, Iain Barr, Yana Hasson, Karel Lenc, Arthur Mensch, Katherine Millican, Malcolm Reynolds, et al. 2022. Flamingo: a visual language model for few-shot learning. Advances in neural information processing systems, 35:23716–23736.
- Bai et al. (2023) Jinze Bai, Shuai Bai, Shusheng Yang, Shijie Wang, Sinan Tan, Peng Wang, Junyang Lin, Chang Zhou, and Jingren Zhou. 2023. Qwen-vl: A frontier large vision-language model with versatile abilities. arXiv preprint arXiv:2308.12966.
- Chen et al. (2024a) Lin Chen, Jinsong Li, Xiaoyi Dong, Pan Zhang, Yuhang Zang, Zehui Chen, Haodong Duan, Jiaqi Wang, Yu Qiao, Dahua Lin, et al. 2024a. Are we on the right way for evaluating large vision-language models? arXiv preprint arXiv:2403.20330.
- Chen et al. (2024b) Pengcheng Chen, Jin Ye, Guoan Wang, Yanjun Li, Zhongying Deng, Wei Li, Tianbin Li, Haodong Duan, Ziyan Huang, Yanzhou Su, et al. 2024b. Gmai-mmbench: A comprehensive multimodal evaluation benchmark towards general medical ai. arXiv preprint arXiv:2408.03361.
- Chen et al. (2024c) Zhe Chen, Weiyun Wang, Hao Tian, Shenglong Ye, Zhangwei Gao, Erfei Cui, Wenwen Tong, Kongzhi Hu, Jiapeng Luo, Zheng Ma, et al. 2024c. How far are we to gpt-4v? closing the gap to commercial multimodal models with open-source suites. arXiv preprint arXiv:2404.16821.
- Chen et al. (2023) Zhe Chen, Jiannan Wu, Wenhai Wang, Weijie Su, Guo Chen, Sen Xing, Muyan Zhong, Qinglong Zhang, Xizhou Zhu, Lewei Lu, Bin Li, Ping Luo, Tong Lu, Yu Qiao, and Jifeng Dai. 2023. Internvl: Scaling up vision foundation models and aligning for generic visual-linguistic tasks. arXiv preprint arXiv:2312.14238.
- Clark et al. (2019) Christopher Clark, Kenton Lee, Ming-Wei Chang, Tom Kwiatkowski, Michael Collins, and Kristina Toutanova. 2019. Boolq: Exploring the surprising difficulty of natural yes/no questions. arXiv preprint arXiv:1905.10044.
- Dai et al. (2023) Wenliang Dai, Junnan Li, Dongxu Li, Anthony Meng Huat Tiong, Junqi Zhao, Weisheng Wang, Boyang Li, Pascale Fung, and Steven Hoi. 2023. Instructblip: Towards general-purpose vision-language models with instruction tuning. Preprint, arXiv:2305.06500.
- Dong et al. (2024) Xiaoyi Dong, Pan Zhang, Yuhang Zang, Yuhang Cao, Bin Wang, Linke Ouyang, Xilin Wei, Songyang Zhang, Haodong Duan, Maosong Cao, Wenwei Zhang, Yining Li, Hang Yan, Yang Gao, Xinyue Zhang, Wei Li, Jingwen Li, Kai Chen, Conghui He, Xingcheng Zhang, Yu Qiao, Dahua Lin, and Jiaqi Wang. 2024. Internlm-xcomposer2: Mastering free-form text-image composition and comprehension in vision-language large model. arXiv preprint arXiv:2401.16420.
- Dosovitskiy et al. (2021) Alexey Dosovitskiy, Lucas Beyer, Alexander Kolesnikov, Dirk Weissenborn, Xiaohua Zhai, Thomas Unterthiner, Mostafa Dehghani, Matthias Minderer, Georg Heigold, Sylvain Gelly, Jakob Uszkoreit, and Neil Houlsby. 2021. An image is worth 16x16 words: Transformers for image recognition at scale. ICLR.
- Duan et al. (2024) Haodong Duan, Junming Yang, Yuxuan Qiao, Xinyu Fang, Lin Chen, Yuan Liu, Xiaoyi Dong, Yuhang Zang, Pan Zhang, Jiaqi Wang, Dahua Lin, and Kai Chen. 2024. Vlmevalkit: An open-source toolkit for evaluating large multi-modality models. Preprint, arXiv:2407.11691.
- Eldar et al. (1997) Yuval Eldar, Michael Lindenbaum, Moshe Porat, and Yehoshua Y Zeevi. 1997. The farthest point strategy for progressive image sampling. IEEE transactions on image processing, 6(9):1305–1315.
- (15) Cylingo Group. Cylingo/Xinyuan-VL-2B. https://huggingface.co/Cylingo/Xinyuan-VL-2B.
- Gu et al. (2024) Tianle Gu, Zeyang Zhou, Kexin Huang, Dandan Liang, Yixu Wang, Haiquan Zhao, Yuanqi Yao, Xingge Qiao, Keqing Wang, Yujiu Yang, Yan Teng, Yu Qiao, and Yingchun Wang. 2024. Mllmguard: A multi-dimensional safety evaluation suite for multimodal large language models. Preprint, arXiv:2406.07594.
- Guan et al. (2023) Tianrui Guan, Fuxiao Liu, Xiyang Wu, Ruiqi Xian, Zongxia Li, Xiaoyu Liu, Xijun Wang, Lichang Chen, Furong Huang, Yaser Yacoob, et al. 2023. Hallusionbench: An advanced diagnostic suite for entangled language hallucination and visual illusion in large vision-language models. arXiv preprint arXiv:2310.14566.
- H2O.ai (2024) H2O.ai. 2024. https://huggingface.co/h2oai/h2ovl-mississippi-2b.
- He et al. (2021) Pengcheng He, Jianfeng Gao, and Weizhu Chen. 2021. Debertav3: Improving deberta using electra-style pre-training with gradient-disentangled embedding sharing. arXiv preprint arXiv:2111.09543.
- Hendrycks et al. (2020) Dan Hendrycks, Collin Burns, Steven Basart, Andy Zou, Mantas Mazeika, Dawn Song, and Jacob Steinhardt. 2020. Measuring massive multitask language understanding. arXiv preprint arXiv:2009.03300.
- Huang et al. (2024a) Mingxin Huang, Yuliang Liu, Dingkang Liang, Lianwen Jin, and Xiang Bai. 2024a. Mini-monkey: Multi-scale adaptive cropping for multimodal large language models. arXiv preprint arXiv:2408.02034.
- Huang et al. (2024b) Yipo Huang, Quan Yuan, Xiangfei Sheng, Zhichao Yang, Haoning Wu, Pengfei Chen, Yuzhe Yang, Leida Li, and Weisi Lin. 2024b. Aesbench: An expert benchmark for multimodal large language models on image aesthetics perception. arXiv preprint arXiv:2401.08276.
- Hudson and Manning (2019) Drew A Hudson and Christopher D Manning. 2019. Gqa: A new dataset for real-world visual reasoning and compositional question answering. In Proceedings of the IEEE/CVF conference on computer vision and pattern recognition, pages 6700–6709.
- Ilharco et al. (2021) Gabriel Ilharco, Mitchell Wortsman, Ross Wightman, Cade Gordon, Nicholas Carlini, Rohan Taori, Achal Dave, Vaishaal Shankar, Hongseok Namkoong, John Miller, Hannaneh Hajishirzi, Ali Farhadi, and Ludwig Schmidt. 2021. Openclip. If you use this software, please cite it as below.
- Jiang et al. (2023) Albert Q Jiang, Alexandre Sablayrolles, Arthur Mensch, Chris Bamford, Devendra Singh Chaplot, Diego de las Casas, Florian Bressand, Gianna Lengyel, Guillaume Lample, Lucile Saulnier, et al. 2023. Mistral 7b. arXiv preprint arXiv:2310.06825.
- Kembhavi et al. (2016) Aniruddha Kembhavi, Michael Salvato, Eric Kolve, Minjoon Seo, Hannaneh Hajishirzi, and Ali Farhadi. 2016. A diagram is worth a dozen images. ArXiv, abs/1603.07396.
- Kim et al. (2024) Yoonsik Kim, Moonbin Yim, and Ka Yeon Song. 2024. Tablevqa-bench: A visual question answering benchmark on multiple table domains. arXiv preprint arXiv:2404.19205.
- Kingma and Ba (2015) Diederik Kingma and Jimmy Ba. 2015. Adam: A method for stochastic optimization. In International Conference on Learning Representations (ICLR), San Diega, CA, USA.
- Kwiatkowski et al. (2019) Tom Kwiatkowski, Jennimaria Palomaki, Olivia Redfield, Michael Collins, Ankur Parikh, Chris Alberti, Danielle Epstein, Illia Polosukhin, Jacob Devlin, Kenton Lee, et al. 2019. Natural questions: a benchmark for question answering research. Transactions of the Association for Computational Linguistics, 7:453–466.
- Laurençon et al. (2024) Hugo Laurençon, Lucile Saulnier, Léo Tronchon, Stas Bekman, Amanpreet Singh, Anton Lozhkov, Thomas Wang, Siddharth Karamcheti, Alexander Rush, Douwe Kiela, et al. 2024. Obelics: An open web-scale filtered dataset of interleaved image-text documents. Advances in Neural Information Processing Systems, 36.
- Li et al. (2024a) Bohao Li, Yuying Ge, Yi Chen, Yixiao Ge, Ruimao Zhang, and Ying Shan. 2024a. Seed-bench-2-plus: Benchmarking multimodal large language models with text-rich visual comprehension. arXiv preprint arXiv:2404.16790.
- Li et al. (2023a) Bohao Li, Yuying Ge, Yixiao Ge, Guangzhi Wang, Rui Wang, Ruimao Zhang, and Ying Shan. 2023a. Seed-bench-2: Benchmarking multimodal large language models. arXiv preprint arXiv:2311.17092.
- Li et al. (2023b) Bohao Li, Rui Wang, Guangzhi Wang, Yuying Ge, Yixiao Ge, and Ying Shan. 2023b. Seed-bench: Benchmarking multimodal llms with generative comprehension. arXiv preprint arXiv:2307.16125.
- Li et al. (2023c) Yifan Li, Yifan Du, Kun Zhou, Jinpeng Wang, Wayne Xin Zhao, and Ji-Rong Wen. 2023c. Evaluating object hallucination in large vision-language models. In The 2023 Conference on Empirical Methods in Natural Language Processing.
- Li et al. (2024b) Zhang Li, Biao Yang, Qiang Liu, Zhiyin Ma, Shuo Zhang, Jingxu Yang, Yabo Sun, Yuliang Liu, and Xiang Bai. 2024b. Monkey: Image resolution and text label are important things for large multi-modal models. In proceedings of the IEEE/CVF conference on computer vision and pattern recognition.
- Lin et al. (2021) Stephanie Lin, Jacob Hilton, and Owain Evans. 2021. Truthfulqa: Measuring how models mimic human falsehoods. arXiv preprint arXiv:2109.07958.
- Liu et al. (2024a) Haotian Liu, Chunyuan Li, Yuheng Li, and Yong Jae Lee. 2024a. Improved baselines with visual instruction tuning. In Proceedings of the IEEE/CVF Conference on Computer Vision and Pattern Recognition, pages 26296–26306.
- Liu et al. (2024b) Haotian Liu, Chunyuan Li, Yuheng Li, Bo Li, Yuanhan Zhang, Sheng Shen, and Yong Jae Lee. 2024b. Llava-next: Improved reasoning, ocr, and world knowledge. https://llava-vl.github.io/blog/2024-01-30-llava-next/.
- Liu et al. (2024c) Haotian Liu, Chunyuan Li, Qingyang Wu, and Yong Jae Lee. 2024c. Visual instruction tuning. Advances in neural information processing systems, 36.
- Liu et al. (2023a) Yuan Liu, Haodong Duan, Yuanhan Zhang, Bo Li, Songyang Zhang, Wangbo Zhao, Yike Yuan, Jiaqi Wang, Conghui He, Ziwei Liu, Kai Chen, and Dahua Lin. 2023a. Mmbench: Is your multi-modal model an all-around player? arXiv:2307.06281.
- Liu et al. (2023b) Yuliang Liu, Zhang Li, Biao Yang, Chunyuan Li, Xucheng Yin, Cheng-lin Liu, Lianwen Jin, and Xiang Bai. 2023b. On the hidden mystery of ocr in large multimodal models. arXiv preprint arXiv:2305.07895.
- Lu et al. (2022) Pan Lu, Swaroop Mishra, Tanglin Xia, Liang Qiu, Kai-Wei Chang, Song-Chun Zhu, Oyvind Tafjord, Peter Clark, and Ashwin Kalyan. 2022. Learn to explain: Multimodal reasoning via thought chains for science question answering. Advances in Neural Information Processing Systems, 35:2507–2521.
- Lu et al. (2024) Shiyin Lu, Yang Li, Qing-Guo Chen, Zhao Xu, Weihua Luo, Kaifu Zhang, and Han-Jia Ye. 2024. Ovis: Structural embedding alignment for multimodal large language model. arXiv:2405.20797.
- Luo et al. (2024) Weidi Luo, Siyuan Ma, Xiaogeng Liu, Xiaoyu Guo, and Chaowei Xiao. 2024. Jailbreakv-28k: A benchmark for assessing the robustness of multimodal large language models against jailbreak attacks. arXiv preprint arXiv:2404.03027.
- Masry et al. (2022) Ahmed Masry, Do Xuan Long, Jia Qing Tan, Shafiq Joty, and Enamul Hoque. 2022. Chartqa: A benchmark for question answering about charts with visual and logical reasoning. arXiv preprint arXiv:2203.10244.
- Mathew et al. (2022) Minesh Mathew, Viraj Bagal, Rubèn Tito, Dimosthenis Karatzas, Ernest Valveny, and CV Jawahar. 2022. Infographicvqa. In Proceedings of the IEEE/CVF Winter Conference on Applications of Computer Vision, pages 1697–1706.
- Mathew et al. (2021) Minesh Mathew, Dimosthenis Karatzas, and CV Jawahar. 2021. Docvqa: A dataset for vqa on document images. In Proceedings of the IEEE/CVF winter conference on applications of computer vision, pages 2200–2209.
- Mishra et al. (2019) Anand Mishra, Shashank Shekhar, Ajeet Kumar Singh, and Anirban Chakraborty. 2019. Ocr-vqa: Visual question answering by reading text in images. In 2019 international conference on document analysis and recognition (ICDAR), pages 947–952. IEEE.
- (49) OpenCompass. Open vlm leaderboard. https://huggingface.co/spaces/opencompass/open_vlm_leaderboard.
- Perlitz et al. (2023) Yotam Perlitz, Elron Bandel, Ariel Gera, Ofir Arviv, Liat Ein-Dor, Eyal Shnarch, Noam Slonim, Michal Shmueli-Scheuer, and Leshem Choshen. 2023. Efficient benchmarking (of language models). arXiv preprint arXiv:2308.11696.
- Polo et al. (2024) Felipe Maia Polo, Lucas Weber, Leshem Choshen, Yuekai Sun, Gongjun Xu, and Mikhail Yurochkin. 2024. tinybenchmarks: evaluating llms with fewer examples. arXiv preprint arXiv:2402.14992.
- Qi et al. (2019) Charles R Qi, Or Litany, Kaiming He, and Leonidas J Guibas. 2019. Deep hough voting for 3d object detection in point clouds. In proceedings of the IEEE/CVF International Conference on Computer Vision, pages 9277–9286.
- Qi et al. (2017) Charles Ruizhongtai Qi, Li Yi, Hao Su, and Leonidas J Guibas. 2017. Pointnet++: Deep hierarchical feature learning on point sets in a metric space. Advances in neural information processing systems, 30.
- Radford et al. (2021) Alec Radford, Jong Wook Kim, Chris Hallacy, A. Ramesh, Gabriel Goh, Sandhini Agarwal, Girish Sastry, Amanda Askell, Pamela Mishkin, Jack Clark, Gretchen Krueger, and Ilya Sutskever. 2021. Learning transferable visual models from natural language supervision. In ICML.
- Rahmanzadehgervi et al. (2024) Pooyan Rahmanzadehgervi, Logan Bolton, Mohammad Reza Taesiri, and Anh Totti Nguyen. 2024. Vision language models are blind. arXiv preprint arXiv:2407.06581.
- Schwenk et al. (2022) Dustin Schwenk, Apoorv Khandelwal, Christopher Clark, Kenneth Marino, and Roozbeh Mottaghi. 2022. A-okvqa: A benchmark for visual question answering using world knowledge. In European conference on computer vision, pages 146–162. Springer.
- Singh et al. (2019) Amanpreet Singh, Vivek Natarajan, Meet Shah, Yu Jiang, Xinlei Chen, Dhruv Batra, Devi Parikh, and Marcus Rohrbach. 2019. Towards vqa models that can read. In Proceedings of the IEEE/CVF conference on computer vision and pattern recognition, pages 8317–8326.
- Tanaka et al. (2023) Ryota Tanaka, Kyosuke Nishida, Kosuke Nishida, Taku Hasegawa, Itsumi Saito, and Kuniko Saito. 2023. Slidevqa: A dataset for document visual question answering on multiple images. In Proceedings of the AAAI Conference on Artificial Intelligence, volume 37, pages 13636–13645.
- Team et al. (2024) Gemma Team, Thomas Mesnard, Cassidy Hardin, Robert Dadashi, Surya Bhupatiraju, Shreya Pathak, Laurent Sifre, Morgane Rivière, Mihir Sanjay Kale, Juliette Love, et al. 2024. Gemma: Open models based on gemini research and technology. arXiv preprint arXiv:2403.08295.
- Torralba and Efros (2011) Antonio Torralba and Alexei A Efros. 2011. Unbiased look at dataset bias. In CVPR 2011, pages 1521–1528. IEEE.
- Touvron et al. (2023) Hugo Touvron, Thibaut Lavril, Gautier Izacard, Xavier Martinet, Marie-Anne Lachaux, Timothée Lacroix, Baptiste Rozière, Naman Goyal, Eric Hambro, Faisal Azhar, et al. 2023. Llama: Open and efficient foundation language models. arXiv preprint arXiv:2302.13971.
- Wang et al. (2024a) Fei Wang, Xingyu Fu, James Y Huang, Zekun Li, Qin Liu, Xiaogeng Liu, Mingyu Derek Ma, Nan Xu, Wenxuan Zhou, Kai Zhang, et al. 2024a. Muirbench: A comprehensive benchmark for robust multi-image understanding. arXiv preprint arXiv:2406.09411.
- Wang et al. (2024b) Ke Wang, Junting Pan, Weikang Shi, Zimu Lu, Mingjie Zhan, and Hongsheng Li. 2024b. Measuring multimodal mathematical reasoning with math-vision dataset. Preprint, arXiv:2402.14804.
- Wang et al. (2024c) Peng Wang, Shuai Bai, Sinan Tan, Shijie Wang, Zhihao Fan, Jinze Bai, Keqin Chen, Xuejing Liu, Jialin Wang, Wenbin Ge, et al. 2024c. Qwen2-vl: Enhancing vision-language model’s perception of the world at any resolution. arXiv preprint arXiv:2409.12191.
- Wang et al. (2024d) Weiyun Wang, Yiming Ren, Haowen Luo, Tiantong Li, Chenxiang Yan, Zhe Chen, Wenhai Wang, Qingyun Li, Lewei Lu, Xizhou Zhu, et al. 2024d. The all-seeing project v2: Towards general relation comprehension of the open world. arXiv preprint arXiv:2402.19474.
- Wang et al. (2024e) Wenbin Wang, Liang Ding, Minyan Zeng, Xiabin Zhou, Li Shen, Yong Luo, and Dacheng Tao. 2024e. Divide, conquer and combine: A training-free framework for high-resolution image perception in multimodal large language models. arXiv preprint arXiv:2408.15556.
- WeChat (2023) WeChat. 2023. WeMM. https://github.com/scenarios/WeMM.
- Wu et al. (2023) Haoning Wu, Zicheng Zhang, Erli Zhang, Chaofeng Chen, Liang Liao, Annan Wang, Chunyi Li, Wenxiu Sun, Qiong Yan, Guangtao Zhai, et al. 2023. Q-bench: A benchmark for general-purpose foundation models on low-level vision. arXiv preprint arXiv:2309.14181.
- XAI (2024) XAI. 2024. Grok-1.5 vision preview.
- Xue et al. (2024) Le Xue, Manli Shu, Anas Awadalla, Jun Wang, An Yan, Senthil Purushwalkam, Honglu Zhou, Viraj Prabhu, Yutong Dai, Michael S Ryoo, Shrikant Kendre, Jieyu Zhang, Can Qin, Shu Zhang, Chia-Chih Chen, Ning Yu, Juntao Tan, Tulika Manoj Awalgaonkar, Shelby Heinecke, Huan Wang, Yejin Choi, Ludwig Schmidt, Zeyuan Chen, Silvio Savarese, Juan Carlos Niebles, Caiming Xiong, and Ran Xu. 2024. xgen-mm (blip-3): A family of open large multimodal models. Preprint, arXiv:2408.08872.
- Yan et al. (2020) Xu Yan, Chaoda Zheng, Zhen Li, Sheng Wang, and Shuguang Cui. 2020. Pointasnl: Robust point clouds processing using nonlocal neural networks with adaptive sampling. In Proceedings of the IEEE/CVF conference on computer vision and pattern recognition, pages 5589–5598.
- Yao et al. (2024) Yuan Yao, Tianyu Yu, Ao Zhang, Chongyi Wang, Junbo Cui, Hongji Zhu, Tianchi Cai, Haoyu Li, Weilin Zhao, Zhihui He, et al. 2024. Minicpm-v: A gpt-4v level mllm on your phone. arXiv preprint arXiv:2408.01800.
- Ying et al. (2024) Kaining Ying, Fanqing Meng, Jin Wang, Zhiqian Li, Han Lin, Yue Yang, Hao Zhang, Wenbo Zhang, Yuqi Lin, Shuo Liu, et al. 2024. Mmt-bench: A comprehensive multimodal benchmark for evaluating large vision-language models towards multitask agi. arXiv preprint arXiv:2404.16006.
- You et al. (2023) Haoxuan You, Haotian Zhang, Zhe Gan, Xianzhi Du, Bowen Zhang, Zirui Wang, Liangliang Cao, Shih-Fu Chang, and Yinfei Yang. 2023. Ferret: Refer and ground anything anywhere at any granularity. arXiv preprint arXiv:2310.07704.
- Yu et al. (2023) Weihao Yu, Zhengyuan Yang, Linjie Li, Jianfeng Wang, Kevin Lin, Zicheng Liu, Xinchao Wang, and Lijuan Wang. 2023. Mm-vet: Evaluating large multimodal models for integrated capabilities. arXiv preprint arXiv:2308.02490.
- Yue et al. (2024) Xiang Yue, Yuansheng Ni, Kai Zhang, Tianyu Zheng, Ruoqi Liu, Ge Zhang, Samuel Stevens, Dongfu Jiang, Weiming Ren, Yuxuan Sun, Cong Wei, Botao Yu, Ruibin Yuan, Renliang Sun, Ming Yin, Boyuan Zheng, Zhenzhu Yang, Yibo Liu, Wenhao Huang, Huan Sun, Yu Su, and Wenhu Chen. 2024. Mmmu: A massive multi-discipline multimodal understanding and reasoning benchmark for expert agi. In Proceedings of CVPR.
- Zhang et al. (2024a) Jieyu Zhang, Weikai Huang, Zixian Ma, Oscar Michel, Dong He, Tanmay Gupta, Wei-Chiu Ma, Ali Farhadi, Aniruddha Kembhavi, and Ranjay Krishna. 2024a. Task me anything. arXiv preprint arXiv:2406.11775.
- Zhang et al. (2024b) Kaichen Zhang, Bo Li, Peiyuan Zhang, Fanyi Pu, Joshua Adrian Cahyono, Kairui Hu, Shuai Liu, Yuanhan Zhang, Jingkang Yang, Chunyuan Li, et al. 2024b. Lmms-eval: Reality check on the evaluation of large multimodal models. arXiv preprint arXiv:2407.12772.
- Zhang et al. (2024c) Renrui Zhang, Dongzhi Jiang, Yichi Zhang, Haokun Lin, Ziyu Guo, Pengshuo Qiu, Aojun Zhou, Pan Lu, Kai-Wei Chang, Peng Gao, et al. 2024c. Mathverse: Does your multi-modal llm truly see the diagrams in visual math problems? arXiv preprint arXiv:2403.14624.
- Zhang et al. (2024d) Zicheng Zhang, Haoning Wu, Chunyi Li, Yingjie Zhou, Wei Sun, Xiongkuo Min, Zijian Chen, Xiaohong Liu, Weisi Lin, and Guangtao Zhai. 2024d. A-bench: Are lmms masters at evaluating ai-generated images? Preprint, arXiv:2406.03070.
- Zhipu AI (2024) Zhipu AI. 2024. Glm-4v. https://open.bigmodel.cn/dev/howuse/glm-4v.
Appendix A Additional Results of Benchmark Classification
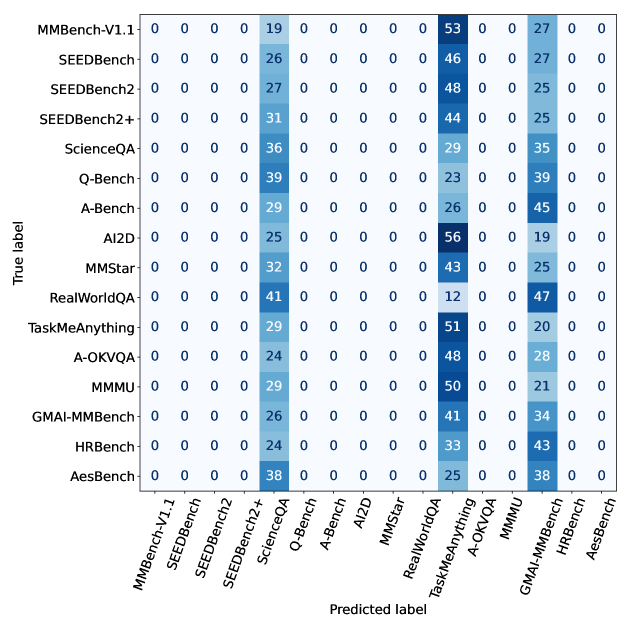
We show the confusion matrices of MCQ and VQA tasks with various inputs in Figs. 5 and 6. Since the answers in MCQ tasks lack meaningful content, predictions based solely on answers are essentially random. In contrast, the other settings yield more meaningful results.
 |
 |
| (a) Image | (b) Question |
 |
 |
| (c) Answer | (d) Image + Answer |
 |
 |
| (e) Question + Answer | (f) Image + Question + Answer |
 |
 |
| (a) Image | (b) Question |
 |
|
| (c) Answer | (d) Image + Question |
 |
 |
| (e) Image + Answer | (f) Question + Answer |
Appendix B Averaged Ranks of VLMs
We show the of VLMs, where the ranks of each model are averaged over the benchmarks. We use following benchmarks for computing the : MMBench Liu et al. (2023a), SEEDBench Li et al. (2023b), SEEDBench2+ Li et al. (2024a), ScienceQA Lu et al. (2022), Q-Bench Wu et al. (2023), A-Bench Zhang et al. (2024d), AI2D Kembhavi et al. (2016), MMStar Chen et al. (2024a), RealWorldQA XAI (2024), TaskMeAnything Zhang et al. (2024a), A-OKVQA Schwenk et al. (2022), MMMU Yue et al. (2024), GMAI-MMBench Chen et al. (2024b), AesBench Huang et al. (2024b), OCRVQA Mishra et al. (2019), TextVQA Singh et al. (2019), DocVQA Mathew et al. (2021), InfographicVQA Mathew et al. (2022), ChartQA Masry et al. (2022), GQA Hudson and Manning (2019), OCRBench Liu et al. (2023b), MATH-Vision Wang et al. (2024b), CRPE_RELATION Wang et al. (2024d), and MM-Vet Yu et al. (2023)
| Model | Rank |
|---|---|
| Qwen2-VL-7B-Instruct Wang et al. (2024c) | 3.615 |
| InternVL2-8B Chen et al. (2024c) | 5.538 |
| InternVL-Chat-V1-5 Chen et al. (2023) | 5.846 |
| glm-4v-9b Zhipu AI (2024) | 6.462 |
| Ovis1.6-Llama3.2-3B Lu et al. (2024) | 7.385 |
| InternVL-Chat-V1-2-Plus Chen et al. (2023) | 7.846 |
| WeMM WeChat (2023) | 8.269 |
| MiniCPM-Llama3-V-2.5 Yao et al. (2024) | 9.730 |
| Qwen2-VL-2B-Instruct Wang et al. (2024c) | 10.12 |
| XComposer2 Dong et al. (2024) | 10.62 |
| XinYuan-VL-2B-Instruct Group | 12.42 |
| h2ovl-mississippi-2b H2O.ai (2024) | 13.08 |
| xgen-mm-phi3-dpo-r-v1.5 Xue et al. (2024) | 13.15 |
| Phi-3.5-Vision Abdin et al. (2024) | 13.19 |
| llava-next-llama3 Liu et al. (2024b) | 14.42 |
| minimonkey Huang et al. (2024a) | 15.12 |
| InternVL2-2B Chen et al. (2024c) | 15.23 |
| llava-next-vicuna-13b Liu et al. (2024b) | 16.92 |
| llava-next-interleave-7b Liu et al. (2024b) | 17.00 |
| llava-next-mistral-7b Liu et al. (2024b) | 18.00 |
| monkey-chat Li et al. (2024b) | 18.31 |
| llava-next-vicuna-7b Liu et al. (2024b) | 19.81 |
| InternVL2-1B Chen et al. (2024c) | 19.85 |
| monkey Li et al. (2024b) | 22.23 |
| qwen-chat Bai et al. (2023) | 22.46 |
| qwen-base Bai et al. (2023) | 24.42 |
| idefics-9b-instruct Laurençon et al. (2024) | 25.96 |
Appendix C Statistics of the Number of Parameters
We show the histogram of the number of parameters of publicly available VLMs in Fig. 7. The figure shows that models with less than 15B parameters occupy 76.29%.
Appendix D Component of ResampledBench-1000
We show the ratio of sampled data for 1,000 samples to the original dataset size of the benchmarks in Fig. 8. A relatively large proportion of data has been sampled from MMVet and TextVQA, which implies that they are relatively comprehensive compered to the other benchmarks. Interestingly, the correlation with the average rank shown in Fig. 3 does not necessarily indicate how likely a dataset is to be sampled. This is because a low correlation only suggests a lack of comprehensiveness in the data, but it does not imply that the dataset contains fewer samples useful for evaluation.