Fast response of deep ocean circulation to mid-latitude winds in the Atlantic
Abstract
In situ observations of transbasin deep ocean transports at N show variability on monthly to decadal timescales (2004–2015). Satellite-based estimates of ocean bottom pressure from the Gravity Recovery and Climate Experiment (GRACE) satellites were previously used to estimate interannual variability of deep ocean transports at N. Here, we use GRACE ocean bottom pressure, reanalysis winds and in situ transport estimates at N to diagnose the large-scale response of the deep ocean circulation to wind-forcing. We find that deep ocean transports—including those associated with a reversal of the Atlantic meridional overturning circulation in 2009/10 and 2010/11—are part of a large-scale response to wind stress curl over the intergyre-gyre region. Wind-forcing dominates deep ocean circulation variability on monthly timescales, but interannual fluctuations in the residual in situ transports (after removing the wind-effect) are also captured by GRACE bottom pressure measurements. On decadal timescales, uncertainty in regional trends in GRACE ocean bottom pressure preclude investigation of decadal-timescale transport trends.
Geophysical Research Letters
University of Southampton, National Oceanography Centre Southampton, Empress Dock, SO14 3ZH, United Kingdom NASA Jet Propulsion Laboratory, Pasadena, CA, USA
E. Frajka-Williamse.frajka-williams@soton.ac.uk
Covariance between GRACE and winds in the Atlantic identifies wind-driven changes of basinwide deep ocean circulation.
Atlantic MOC reversals in 2009/10 and 2010/11 resulted from the strongly negative NAO and mid-latitude wind stress curl.
Residual interannual fluctuations in deep ocean transports are captured by GRACE satellite estimates of ocean bottom pressure.
1 Introduction
Ocean circulation responds to forcing on a wide range of timescales. Century and longer duration simulations and paleoclimate records anticipate variations of the Atlantic meridional overturning circulation (AMOC) forcing or responding to climate changes (Zhang, 2008; Lynch-Stieglitz, 2017). Observations of monthly-to-interannual fluctuations in transbasin transports in the subtropical North Atlantic are largely goverend by wind-forcing (Zhao and Johns, 2014). While shorter timescale fluctuations may have less influence on climate timescales, they occur within the recent satellite observational period, enabling diagnosis of the basinscale response of ocean circulation to external forcing.
Since 2004, the AMOC has been measured at N using a combination of moored and cable measurements by the RAPID Climate Change/Meridional Ocean Circulation and Heat flux Array (RAPID/MOCHA, hereafter RAPID) experiment (McCarthy et al., 2015). These transport measurements show variability on monthly to interannual timescales (Chidichimo et al., 2009; Kanzow et al., 2010; McCarthy et al., 2012; Smeed et al., 2014) including strong correlations between deep transports (3000–5000 m) and surface Ekman transport (Frajka-Williams et al., 2016). Over the past two decades, the North Atlantic Oscillation (NAO) index has shown strongly anomalous values. In the 2009/10 and 2010/11 winters, the NAO index was sharply negative. The reorganisation of atmospheric winds during these periods (a southward shift of the position of the zero wind stress curl line) forced a reversal of surface meridional Ekman transport at N and through it, a temporary reversal in the sign of the AMOC (McCarthy et al., 2012) which repeated again in March 2013. All three events are characterised by a temporarily northward flowing North Atlantic Deep Water (NADW) layer (Frajka-Williams et al., 2016), a watermass that is traditionally expected to flow southward in the deep western boundary current (DWBC) as the lower limb of the AMOC.
Concurrent with the RAPID observations, the GRACE (Gravity Recovery and Climate Experiment) satellites recorded spatial and temporal variations in the Earth’s distribution of mass. Mass redistribution in the ocean drives circulation changes through geostrophy–whereby horizontal gradients in mass (or pressure) drive ocean transports normal to the gradient. GRACE observations identified a large-scale gain and loss of mass in the intergyre-gyre region under the effect of negative or clockwise wind stress curl (WSC) (Piecuch and Ponte, 2014). The patterns of WSC are closely governed by sea level pressure anomalies and large-scale patterns are well-described by the NAO index. In Piecuch and Ponte (2014), they attributed 46% of the nonseasonal ocean mass variations to a response to the WSC anomalies.
Changes in the strength of the southward transport of NADW are associated with a reduction of the overturning circulation. The declining tendency of the N AMOC is primarily contained in the reduction of the lower layer transports including the NADW (Smeed et al., 2014). While transport variability in the deepest transport laters is derived primarily from a residual in the RAPID method (McCarthy et al., 2012; Frajka-Williams et al., 2016), independent in situ measurements of bottom pressure gradients confirm the RAPID estimates of deep transport variability on sub-annual (Kanzow et al., 2007; McCarthy et al., 2012). In situ bottom pressure sensors are unable to measure decadal-scale changes due to intrinsic drift (Watts and Kontoyiannis, 1990). Landerer et al. (2015) used the GRACE estimates of ocean bottom pressure to independently determine the strength of the deep ocean transports from zonal gradients in bottom pressure, but due to uncertainties in separating long timescale GRACE bottom pressure signals from other gravity signals (e.g., glacial isostatic adjustment or GIA) did not evaluate trends in the deep ocean transports. As regional bottom pressure trends from GRACE are still uncertain, we will focus on the detrended GRACE values only.
Here we use GRACE bottom pressure to diagnose the basinscale spatial fluctuations in the Atlantic on timescales less than a decade, and relate them to changes in the deep ocean circulation. While Frajka-Williams et al. (2016) associated the deep transport variations at N with a local reversal of the zonally-averaged wind stress, these satellite observations show instead that most of the transport variability in the lower NADW layer (3000–5000 m) at N can be traced to a large-scale response of the ocean to anomalies in the WSC centered over the intergyre-gyre region, mediated by bottom topography.
2 Data and Methods
We use monthly bottom pressure anomalies () grids over the period April 2002–June 2016 derived from GRACE time-variable gravity observations (Tapley et al., 2004). Specifically, we use the mascon solution from NASA’s Jet Propulsion Laboratory (RL05M_1.MSCNv02CRIv02; (Watkins et al., 2015; Wiese et al., 2016)). The values are provided on a degree grid, with an effective spatial resolution of approximately 300 km. Throughout the paper, we refer to values of in units of equivalent seawater thickness. Maps of monthly 10-m wind fields defined on a regular 2∘ grid are obtained from the NCEP Reanalysis fields over the same period as the GRACE data (April 2002–June 2016). We use the reanalysis winds to compute wind stress with a variable drag coefficient updated for low wind speeds (Large and Pond, 1981; Trenberth et al., 1990). The monthly principal component-based index for the NAO was downloaded from https://climatedataguide.ucar.edu/climate-data/hurrell-north-atlantic-oscillation-nao-index-pc-based.
RAPID transport time series are used for the period April 2004–October 2015 (Smeed et al., 2016). These are provided as 12-hourly transbasin (zonally-integrated) meridional transports which were estimated from submarine cable measurements of the Florida Current transport, Ekman transport from reanalysis winds, and in situ geostrophic transports from a mooring array across N (McCarthy et al., 2015). The deep ocean transports between the Bahamas and Canary Islands are separated into two layers: the upper North Atlantic Deep Water (NADW) transport from 1100–3000 m, and lower NADW transport from 3000–5000 m.
Seasonal cycles were removed from all time series, calculated as the monthly climatology over the period April 2004–October 2015 (and, for spatial fields, at each pixel). GRACE data were further processed by masking out the Hudson Bay, Gulf of Mexico and Caribbean, and filling gaps in time using linear interpolation. These gaps resulted from power-management on the satellites and are more common in the latter half of the record. For clearer comparisons between GRACE and RAPID transports, gaps were created in the lower NADW transport and linearly interpolated. To compare GRACE , in units of centimeters liquid water equivalent, with transports measured at N, bottom pressure fields are scaled to create a geostrophic streamfunction as
| (1) |
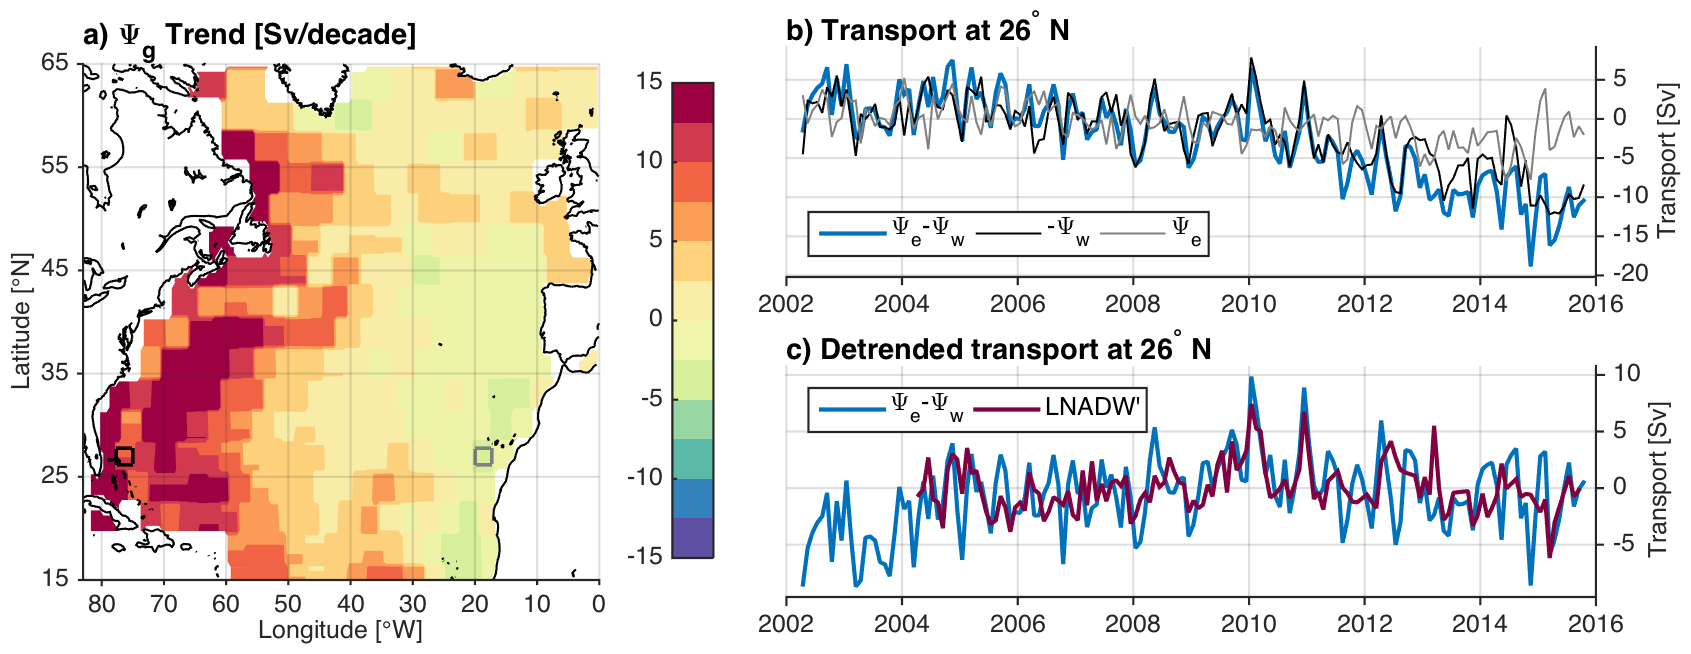
where is the gravitational acceleration, the layer thickness, the bottom pressure in units of meters liquid water equivalent, and the Coriolis frequency. Here, since GRACE bottom pressure is in units of height, the equation includes in place of . For comparison with the lower NADW transport from RAPID, we use a layer thickness of 2000 m, and east minus west differences in pressure, where mascon 1271 (centered at N, W) and 1288 (centered at N, W) are used to represent the west and east side of the basin, respectively (Fig. S1).
The GRACE bottom pressure has a long term background trend (Fig. 1a). Due to a strong trend towards more negative bottom pressure anomalies in the east, a southward trend in transbasin ocean transports is implied where at N, the trend in the east-west pressure gradient implies a transport trend exceeding 10 Sv/decade. Due to uncertainties in separating long timescale GRACE bottom pressure signals from other gravity signals (e.g., GIA) (Landerer et al., 2015) did not evaluate trends in the deep ocean transports from GRACE. As regional OBP trends from GRACE are still uncertain, we focus here on the detrended values only where a linear trend over April 2004–2015 was removed at each pixel.
3 Results
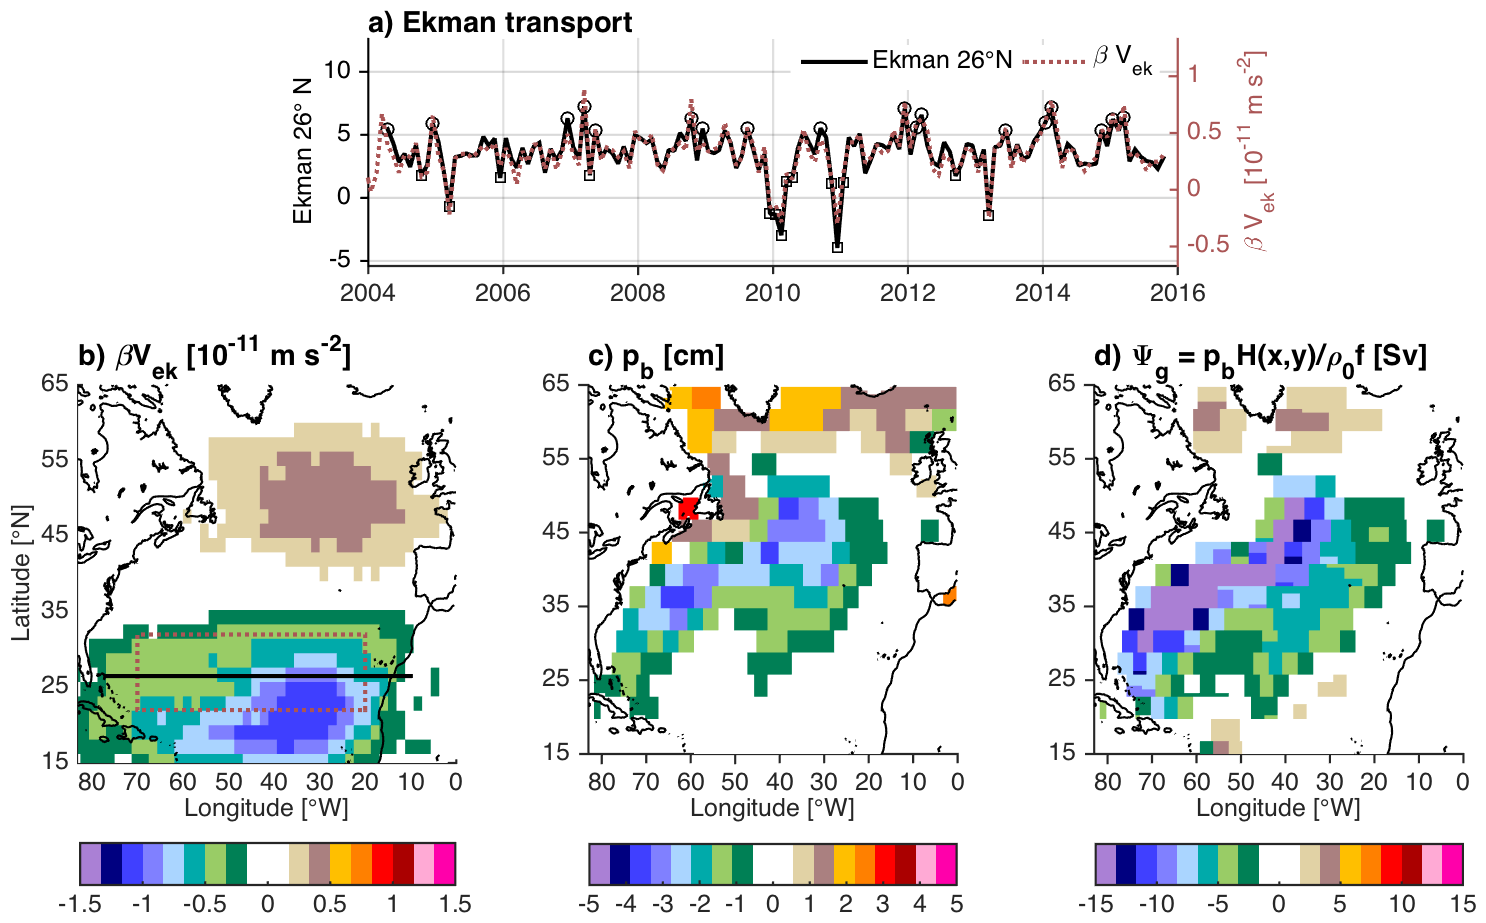
Previous investigations identified a strong correlation between detrended and lowpass-filtered RAPID lower NADW transports and GRACE-derived bottom pressure gradients at N in the Atlantic over the period April 2004–April 2014 (Landerer et al., 2015). Here we show that this correlation holds on monthly timescales (Fig. 1c). At N, there is a strong anti-correlation between lower NADW transports and meridional Ekman transport (Frajka-Williams et al., 2016). Yeager (2015) uses annual N Ekman transports to define positive and negative composites of circulation changes in a numerical model (their Fig. 13). They associate deep circulation anomalies with Ekman reversals, but more generally identify that local reversals at N are associated with larger-scale changes in wind stress curl (WSC). Here we repeat the composite analysis, using Ekman transport at N to identify months when Ekman transports are anomalous by greater than 1 standard deviation (Fig. 2a). Using these time periods, we calculate the difference between the mean of anomalies during negative months minus anomalies during positive months to identify basin-scale changes in wind-forcing, bottom pressure and ocean circulation (Fig. 2b–d).
As in Yeager (2015), reversals in local N Ekman transport coincide with a large-scale changes in curl. Here the southward anomaly in the subtropics coincides with a weaker positive anomaly in the subpolar gyre, resulting in a divergence over the mid-latitudes (35–45∘N, Fig. 2b). This divergence results in a reduction in ocean bottom pressure (Fig. 2c) but not confined to the mid-latitudes. Rather, the anomaly extends to the south and west along the western side of the Atlantic basin (20–50∘N). Scaling the bottom pressure anomalies through geostrophy, we find a barotropic streamfunction composite with an implied cyclonic circulation (Fig. 2d). (Note that the composites are derived here from monthly values, yielding larger magnitude anomalies than Yeager (2015).) At N, these large-scale changes manifest as a northward anomaly in deep ocean transports, which is the signal captured in the RAPID array.
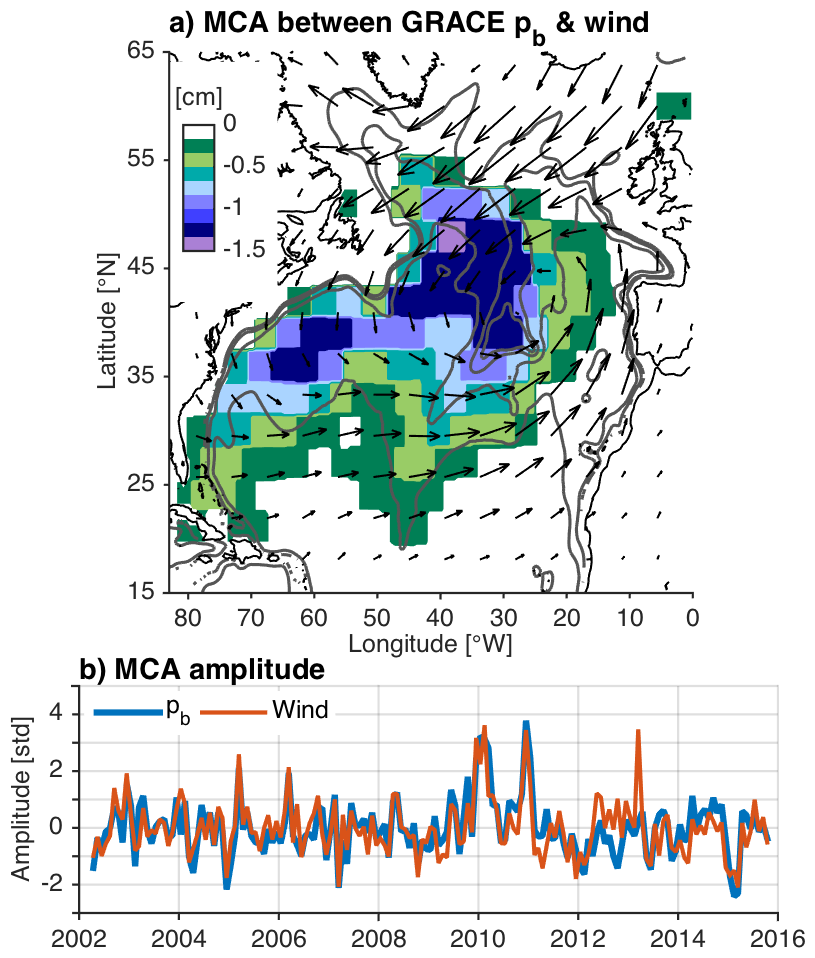
While the composite analysis identifies coincident anomalies, it can be dominated by large amplitude anomalies with specific characteristic patterns. Maximum covariance analysis (MCA) identifies patterns which covary in time, without setting a region of interest a priori. It has the potential to identify zero-lag relationships between wind-forcing and ocean response. It has been used previously in the Atlantic by Piecuch and Ponte (2014) who identified nonseasonal fluctuations in wind stress curl and ocean mass changes. We update it here with a higher-resolution GRACE product (the mascons version) and using a larger domain (15–65∘N, 83–0∘W) which includes the RAPID latitude (Fig. 3a). The MCA identifies a center of wind action over W, 40∘N with a strong resemblance to the North Atlantic Oscillation (NAO) pattern. The MCA for bottom pressure shows that anomalies follow contours of planetary vorticity (, where is the local Coriolis frequency and the local water depth, computed after smoothing bathymetry with a 300 km spatial filter) rather than contours of bathymetry (Fig. S2). The time series of variations, determined by projecting the spatial pattern onto the original space-time datasets, shows a high degree of correlation (by construction), but for smaller amplitude fluctuations as well as the big events in 2009/10 and 2010/11.
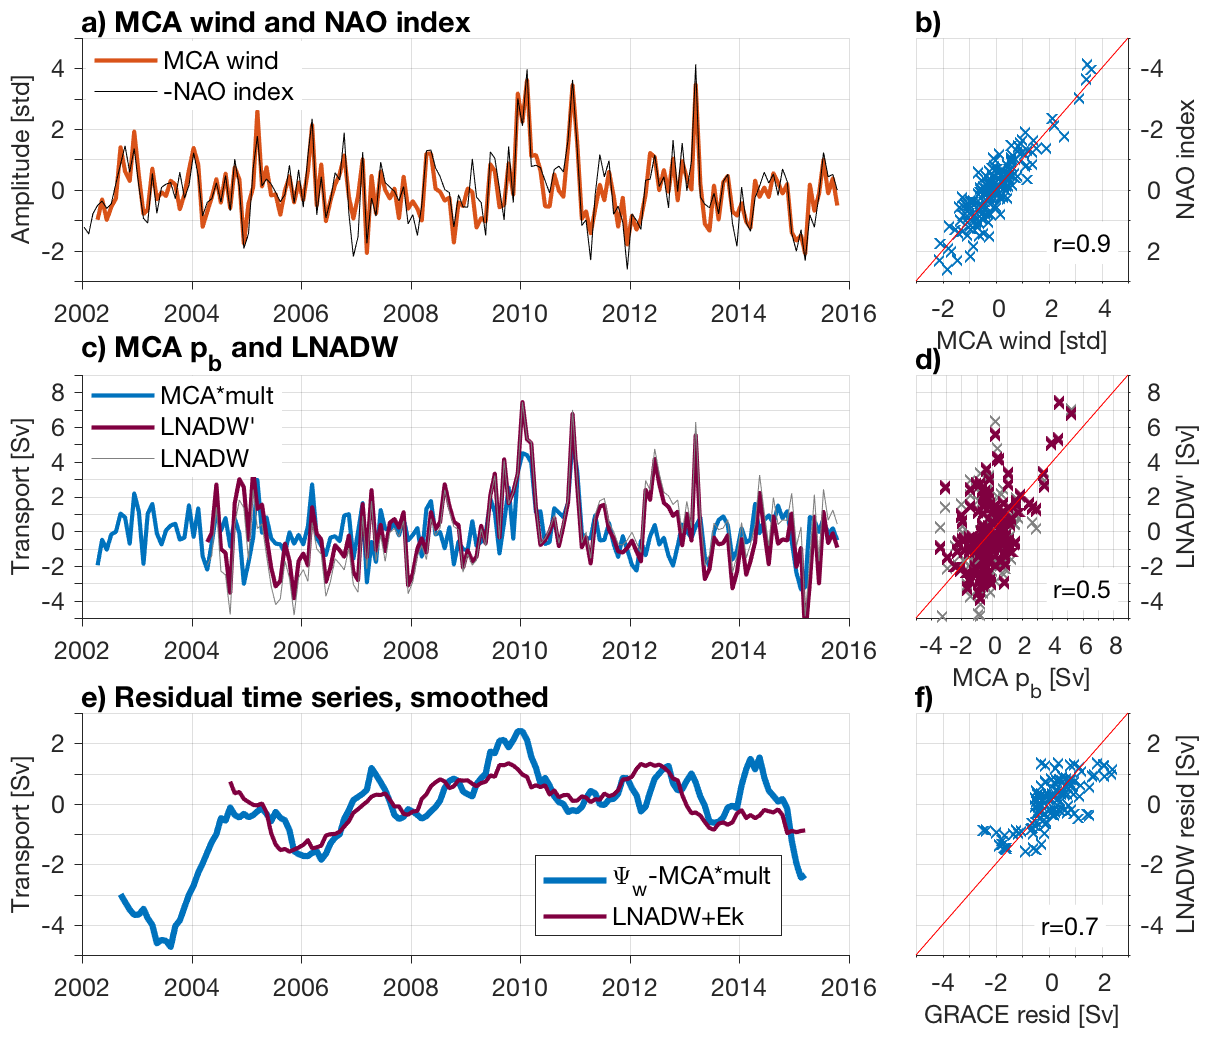
The time variations in the MCA amplitudes are highly correlated with the monthly NAO index (, Fig. 4a); the bottom pressure amplitudes are less highly correlated with the RAPID transports () but still significant. Scaling the amplitude time series by Sv/std (determined as , where is the value at the 1271 mascons) we find that the magnitude of transports implied from the MCA for ocean bottom pressure is somewhat smaller than those from the in situ transports. Removing the wind effect, do residual fluctuations in GRACE capture deep transport variability at RAPID?
Frajka-Williams et al. (2016) identified that the surface Ekman transport at N is not only anti-correlated with the lower NADW transports (3000–5000 m) but also of the same magnitude. Summing the lower NADW transports and meridional Ekman transport thus removes the wind influence. Similarly, subtracting the transport implied by the MCA from the full GRACE data at mascon 1271 gives an estimate of the residual GRACE transports. Filtering with a 1-year moving average, we find that the residuals are correlated (Fig. 4e, f). While the lower NADW transport at N is dominated by a monthly-timescale response to large-scale wind stress curl forcing, but that the residual interannual variability is also captured by the GRACE satellite data.
4 Summary and Discussion
Release-05 GRACE monthly mascons grids were used to investigate the relationship between the wind forcing and deep circulation in the Atlantic. Using GRACE, we find that the intra-annual variability in deep transports at N are part of a basin-scale response to wind stress curl over the intergyre-gyre region (W, N). From in situ measurements, the deep ocean response occurs quickly (within 1 day) (Frajka-Williams et al., 2016), and primarily in the 3000–5000m layer. Numerical investigations of the anomalous transports in the 2009/10 and 2010/11 winters anticipated the deep ocean response found here from observations, which further identify that the ocean response is focused along contours of planetary vorticity (). This paper brings together ocean mass anomalies previously identified using GRACE and wind datasets (Piecuch and Ponte, 2014) with the links between GRACE and deep ocean transports at N (Landerer et al., 2015). Taken together, we show that the short-timescale reversals in the AMOC at N are part of a basinscale response to non-local winds.
The reduction of the AMOC strength over the past decade is due in part to longer timescale changes in the lower NADW transports (Smeed et al., 2014), but these are derived in RAPID as a residual through hypsometric compensation (McCarthy et al., 2012; Frajka-Williams et al., 2016). While these fluctuations have been shown to correlate with bottom pressure gradients on sub-annual timescales (Kanzow et al., 2007; McCarthy et al., 2012), in situ bottom pressure sensors are unable to measure decadal-scale changes due to intrinsic drift (Watts and Kontoyiannis, 1990). Landerer et al. (2015) previously used the GRACE estimates of ocean bottom pressure to independently determine the strength of the deep ocean transports from zonal gradients in bottom pressure, but the interannual variations in their time series were dominated by the monthly-timescale wind-fluctuations found here. We now show that removing the wind effect, the residual interannual variations in GRACE also capture the interannual variations in residual lower NADW transports. Uncertainty in regional bottom pressure trends from GRACE precludes investigating transport trends further.
This work demonstrates the power of GRACE observations at capturing deep ocean circulation, but must be accompanied by a caveat. At N, the western boundary mascons 1271 covaries strongly with the in situ bottom pressure sensors (not shown), but this may be due to fortuitous mascons placement at N or an effect of the steep sidewall of the western boundary bathymetry. Zonal placement of mascons are adjusted to optimize ocean bottom pressure from GRACE, but each mascon still represents an area of the ocean which is km. Within the 1271 mascons, there is substantial variability in bottom pressure records from in situ recorders. Had the variability in this mascons not matched that governing the RAPID transports, the transport relationships found here might have been less favorable. While the boundary measurements should not affect estimates of large-scale gyre spinup (Fig. 3a), for transbasin transports, the measurements at the boundary are crucial.
Appendix A Supplementary information
Acknowledgements.
EFW was funded by a Leverhulme Trust Research Fellowship. The JPL-RL05M GRACE solutions are available via the Physical Oceanography Distributed Active Archive Center (PODAAC) as well as the GRACE Tellus websites (www. grace.jpl.nasa.gov). Data from the RAPID Climate Change (RAPID)/Meridional Overturning Circulation and Heat flux Array (MOCHA) projects are funded by the Natural Environment Research Council (NERC) and National 601 Science Foundation (NSF, OCE1332978), respectively. Data from the RAPID-WATCH MOC monitoring project are funded by the Natural Environment Research Council and are available fromwww.rapid.ac.uk/rapidmoc.
References
- Chidichimo et al. (2009) Chidichimo, M. P., T. Kanzow, S. A. Cunningham, and J. Marotzke (2009), The contribution of eastern-boundary density variations to the Atlantic meridional overturning circulation at N, Ocean Sci. Disc., 6, 2507–2553.
- Frajka-Williams et al. (2016) Frajka-Williams, E., C. S. Meinen, W. E. Johns, D. A. Smeed, A. D. Duchez, A. J. Lawrence, D. A. Cuthbertson, H. L. Bryden, G. D. McCarthy, M. O. Baringer, D. Rayner, and B. I. Moat (2016), Compensation between meridional flow components of the Atlantic MOC at N, Ocean Sci., 12, 481–493, 10.5194/os-12-481-2016.
- Kanzow et al. (2007) Kanzow, T., S. A. Cunningham, D. Rayner, J. J.-M. Hirschi, W. E. Johns, M. O. Baringer, H. L. Bryden, L. M. Beal, C. S. Meinen, and J. Marotzke (2007), Observed flow compensation associated with the MOC at N in the Atlantic, Science, 317, 938–941, 10.1126/science.1141293.
- Kanzow et al. (2010) Kanzow, T., S. A. Cunningham, W. E. Johns, J. J.-M. Hirschi, J. Marotzke, M. O. Baringer, C. S. Meinen, M. P. Chidichimo, C. Atkinson, L. M. Beal, H. L. Bryden, and J. Collins (2010), Seasonal variability of the Atlantic meridional overturning circulation at N, J. Climate, 23, 5678–5698, 10.1175/2010JCLI3389.1.
- Landerer et al. (2015) Landerer, F. W., D. N. Wiese, K. Bentel, C. Boening, and M. M. Watkins (2015), North Atlantic meridional overturning circulation variations from GRACE ocean bottom pressure anomalies, Geophys. Res. Lett., 42, 8114–8121, 10.1002/2015GL065730.
- Large and Pond (1981) Large, W. G., and S. Pond (1981), Open ocean momentum flux measurements in moderate to strong winds, J. Phys. Oceanogr., 11, 324–336, 10.1175/1520-0485(1981)011¡0324:OOMFMI¿2.0.CO;2.
- Lynch-Stieglitz (2017) Lynch-Stieglitz, J. (2017), The Atlantic meridional overturning circulation and abrupt climate change, Ann. Rev. Mar. Sci., 9, 83–104, 10.1146/annurev-marine-010816-060415.
- McCarthy et al. (2012) McCarthy, G., E. Frajka-Williams, W. E. Johns, M. O. Baringer, C. S. Meinen, H. L. Bryden, D. Rayner, A. Duchez, C. D. Roberts, and S. A. Cunningham (2012), Observed interannual variability of the Atlantic MOC at N, Geophys. Res. Lett., 39, L19,609, 10.1029/2012GL052933.
- McCarthy et al. (2015) McCarthy, G. D., D. A. Smeed, W. E. Johns, E. Frajka-Williams, B. I. Moat, D. Rayner, M. O. Baringer, C. S. Meinen, and H. L. Bryden (2015), Measuring the Atlantic meridional overturning circulation at N, Prog. Oceanogr., 130, 91–111, 10.1016/j.pocean.2014.10.006.
- Piecuch and Ponte (2014) Piecuch, C. G., and R. M. Ponte (2014), Nonseasonal mass fluctuations in the midlatitude North Atlantic ocean, Geophys. Res. Lett., 41, 4261–4269, 10.1002/2014GL060248.
- Smeed et al. (2014) Smeed, D. A., G. McCarthy, S. A. Cunningham, E. Frajka-Williams, D. Rayner, W. E. Johns, C. S. Meinen, M. O. Baringer, B. I. Moat, A. Duchez, and H. L. Bryden (2014), Observed decline of the Atlantic meridional overturning circulation 2004 to 2012, Ocean Sci., 10, 29–38, 10.5194/os-10-29-2014.
- Smeed et al. (2016) Smeed, D. A., G. D. McCarthy, D. Rayner, B. I. Moat, W. E. Johns, M. O. Baringer, and C. S. Meinen (2016), Atlantic meridional overturning circulation observed by the RAPID-MOCHA-WBTS (RAPID-Meridional Overturning Circulation and Heatflux Array-Western Boundary Time Series) array at 26∘N from 2004 to 2015., 10.5285/35784047-9b82-2160-e053-6c86abc0c91b.
- Tapley et al. (2004) Tapley, B. D., S. Bettadpur, M. Watkins, and C. Reigber (2004), The gravity recovery and climate experiment: Mission overview and early results, Geophysical Research Letters, 31(9), L09,607, 10.1029/2004GL019920.
- Trenberth et al. (1990) Trenberth, K. E., W. G. Large, and J. G. Olson (1990), The mean annual cycle in global ocean wind stress, J. Phys. Oceanogr., 20, 1742–1760, 10.1175/1520-0485(1990)020¡1742:TMACIG¿2.0.CO;2.
- Watkins et al. (2015) Watkins, M. M., D. N. Wiese, D.-N. Yuan, C. Boening, and F. W. Landerer (2015), Improved methods for observing earth’s time variable mass distribution with GRACE using spherical cap mascons, Journal of Geophysical Research: Solid Earth, 120(4), 2648–2671, 10.1002/2014JB011547, 2014JB011547.
- Watts and Kontoyiannis (1990) Watts, D. R., and H. Kontoyiannis (1990), Deep-ocean bottom pressure measurement: Drift removal and performance, J. Atmos. Ocean. Tech., 7, 296–306, 10.1175/1520-0426(1990)007¡0296:DOBPMD¿2.0.CO;2.
- Wiese et al. (2016) Wiese, D. N., F. W. Landerer, and M. M. Watkins (2016), Quantifying and reducing leakage errors in the JPL RL05M GRACE mascon solution, Water Resources Research, 52(9), 7490–7502, 10.1002/2016WR019344.
- Yeager (2015) Yeager, S. (2015), Topographic coupling of the Atlantic overturning and gyre circulations, Journal of Physical Oceanography, 45, 1258–1284, 10.1175/JPO-D-14-0100.1.
- Zhang (2008) Zhang, R. (2008), Coherent surface-subsurface fingerprint of the Atlantic meridional overturning circulation, Geophys. Res. Lett., 35, L20,705, 10.1029/2008GL035463.
- Zhao and Johns (2014) Zhao, J., and W. Johns (2014), Wind-forced interannual variability of the Atlantic meridional overturning circulation at N, J. Geophys. Res.-Oceans, pp. 1–17.