Magnetization process in epitaxial Fe85Co15 thin films
via anisotropic magnetoresistance
Abstract
The effects of the crystalline symmetry on the magnetotransport properties in ferromagnetic alloys are being reexamined in recent years particularly due to the role of the anisotropic magnetoresistance on the electrical detection of magnetization dynamics, which is relevant to estimate spin transport parameters such as the spin Hall angle or the damping constant. In this work we investigated the crystalline dependent anisotropic magnetoresistance in epitaxial Fe85Co15 films and discuss the magnetization process through the magnetotransport properties by varying the relative orientations between the electric current, the external magnetic field and the Fe85Co15 crystallographic directions. We have found that the anisotropic magnetoresistance ratio depends on the current direction with respect to the crystal axes of Fe85Co15 and determine a ratio of 0.20 % and 0.17 % when the current is applied along the [110] hard and [100] easy axes, respectively. We fit our experimental data using the Stoner-Wohlfarth model to describe the path followed by the magnetization during the magnetization process and to extract the anisotropy constants. The fitted cubic and uniaxial anisotropy constants are = 21 kJ/m3 and = 11 kJ/m3, which are comparable with reported values from the angular variation of ferromagnetic resonance experiments. Our results contribute to the understanding of the interplay between the crystalline structure and the magnetotransport properties of FeCo alloys.
I Introduction
In the last years, Fe100-xCox alloys with bcc crystalline structure have regained significant attention as potential candidates for the development of spintronics devices. While the presence of both Fe and Co offers an ideal combination of high magnetic saturation and tunable magnetic anisotropy, it is their ultra low damping values which are key for applications in magnetic random-access memories and spin transfer torque-based devices. Fe-rich Fe100-xCox is the metallic ferromagnet with one of the lowest reported damping values. Since its prediction by Mankovsky et al. [1] and its experimental verification by Schoen et al. [2] , several works on the spin transport and magnetotransport properties of polycrystalline and epitaxial Fe100-xCox thin films have been reexamined extensively [3, 4, 5, 6, 7]. Some recent works have highlighted the observation of an anisotropic damping in epitaxial Fe100-xCox films [8, 9, 10]. The origin of this anisotropic damping has been attributed to the variation of the spin-orbit coupling (SOC) along different directions of the cubic lattice [8]. At this point, it is also important to recall that the SOC induces a mixing of spin-up and spin-down states which depends on the magnetization direction. Therefore, the magnetization direction determines the density of unoccupied states at the Fermi level [11]. This difference in the - electron scattering cross-section is the responsible for the anisotropic magnetoresistance (AMR) in ferromagnetic metals [12]. Experimentally, the AMR manifests as the dependence of electrical resistance on the relative angle between the direction of the applied current and the magnetization. Understanding AMR is crucial for quantifying damping, as it plays a key role in experimental techniques used to investigate magnetization dynamics. For instance, electrical detection of magnetization dynamics via rectification effects is employed to determine the spin torque efficiency of ferromagnetic/non-magnetic bilayers, such as in spin-torque ferromagnetic resonance experiments [13, 9, 14]. A clear separation of the AMR contribution can provide insights into how to disentangle the contributions of the crystalline structure from the angular dependence of in-plane spin rectification signals, thereby allowing for a more accurate quantification of the spin transport parameters.
The angular dependence of the AMR in polycrystalline magnetic materials can be deduced from the generalized Ohm’s law [15, 13]. Considering a magnetic layer with in-plane magnetization and that the AMR dominates the magnetoresistance effects in ferromagnets, we can express the induced electric field in the layer as:
| (1) |
where is the current density, is the unit vector in the direction of magnetization, and and are the resistivities when the current is parallel and perpendicular to the magnetization direction, respectively. Generally, AMR is defined as
| (2) |
On the other hand, in ferromagnetic single crystals or in epitaxial films the electron scattering strongly depends on the current orientation with respect to the crystallographic directions, resulting in a distinct behavior of the AMR. Since both damping and anisotropic magnetoresistance depend on the SOC, a crystalline-dependent AMR is expected in this alloy. The experimental evidence of this crystalline dependent AMR produced by the anisotropy in the spin-orbit coupling has been reported by Y. Li et al in Fe50Co50. [8]
In this paper, we study the effect of crystal symmetry on the magnetotransport properties of epitaxial Fe85Co15 films, focusing on the anisotropic magnetoresistance and its dependence with the electric current and external magnetic field directions. Epitaxial growth of FeCo films on MgO substrates provides precise control over the crystal structure, enabling us to explore the role of crystalline structure and anisotropic spin-orbit coupling in magnetotransport. We investigate the correlation between the magnetization process and the crystalline structure by varying the directions of current and magnetization with respect to different crystallographic axes. By analyzing the angular dependence of magnetoresistance and fitting the data using the generalized Ohm’s law and free energy minimization, we estimated the uniaxial and cubic anisotropy constants and determine the longitudinal and transverse voltage dependence on the current and field orientations.
II Experimental Details
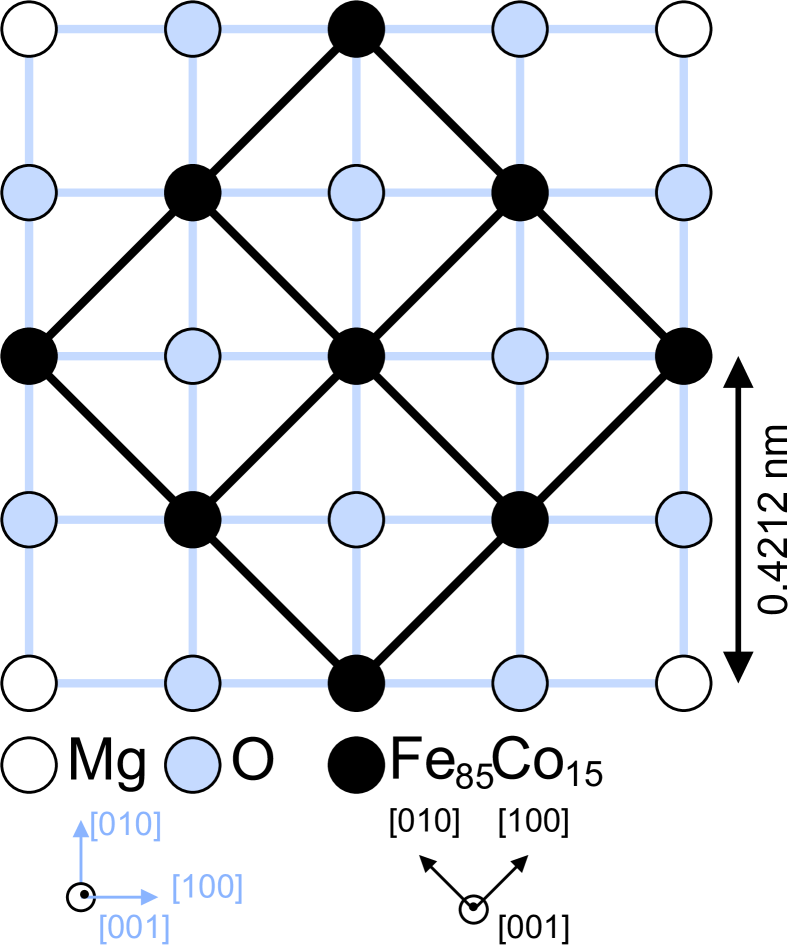
An Fe85Co15/Pt bilayer was deposited by magnetron sputtering on MgO [001] single crystal substrates. The Fe85Co15 layer was deposited from an alloyed target with a substrate-to-target distance of 7.5 cm. The base pressure before depositing the samples was 10-6 Torr and the deposition was performed under an Ar pressure of 1.8 mTorr, at a fixed power density of 1.32 W/cm2. To improve the epitaxial growth of the FeCo the substrate was kept at a fixed temperature of 423 K during deposition. The Pt layer, on the other hand, was deposited at room temperature, under an Ar pressure of 2.6 mTorr and a power density of 1.76 W/cm2. The nominal layer thickness was fixed to 15 nm for Fe85Co15 and 10 nm for Pt. The structural and compositional characterization via X-ray diffraction and X-ray reflectivity measurements, Scanning Transmission Electron Microscopy with High Angular Annular Dark Field (STEM-HAADF) and Electron energy-loss spectroscopy (EELS) can be found in our previous works [16, 17, 10]. The magnetotransport measurements were performed in a setup consisting on a Keithley 6221 current source and two HP34401A multimeters. Samples were mounted inside a Janis SVT-300 cryostat to control the temperature of the sample at 150 K. The external magnetic field was applied using a Danfysik System 8000 power supply connected to a GMW electromagnet mounted on a goniometer that can rotate 360 degrees. The sample holder was oriented such that the magnetic field can rotate within the plane of the film. The axes corresponding to the crystalline directions of the Fe85Co15 layer are schematically shown in Fig. 1. The longitudinal and transverse voltages were measured simultaneously in Fe85Co15/Pt micro-sized Hall bars made using standard optical lithographic techniques. The details of the Hall bars, such as the separation between the contacts and dimensions of the bar, can be found in Fig. S1 of the Supplementary Data file. Two Hall bars were used for the characterization of the magnetotransport properties, one oriented along the direction of the Fe85Co15 magnetization easy axis [100] and the other bar oriented along the magnetization hard axis [110]. To determine the anisotropic magnetoresistance ratio, the longitudinal and transverse voltages were measured by varying the field direction (), while controlling the sample temperature and the external field amplitude at 150 mT. Finally, the measurements of and were performed by varying the field amplitude at different angles of the external magnetic field.
III Results
Our Fe85Co15 films grown on single-crystalline MgO (001) substrates exhibit cubic crystal symmetry with a bcc structure. By heating the MgO substrate during the growth of the Fe85Co15 film we achieve layers with the [100] axis rotated by 45∘ with respect to the MgO [100] substrate direction, as schematically shown in Fig. 1. High-resolution transmission electron microscopy and scan X-ray diffraction measurements, which verify the epitaxial growth of the FeCo film, are reported elsewhere [10]. It is important to notice that the Fe85Co15 hard axes [110] and [10] correspond to the [010] and [100] directions of the MgO substrate, respectively. The average value of the saturation magnetization of the Fe85Co15 layers grown using the conditions mentioned above is = 1700 kA/m [16, 10]. Kerr hysteresis loops with the external magnetic field applied along different crystallographic directions of the Fe85Co15 layer ([10],[00],[110] and [100]) confirmed that the sample presents a fourfold symmetry with the presence of a relatively weak uniaxial anisotropy and that the saturation field is around 25 mT when the external magnetic field is applied close to the magnetization hard axes. These hysteresis loops are shown in Fig S2 of the Supplementary Data file.
III.1 Anisotropic magnetoresistance
Two Hall bars, one bar oriented along the direction of the Fe85Co15 magnetization easy axis ([100] direction in Fig. 1) and the other bar aligned with the magnetization hard axis ([110] direction in Fig. 1) were used for the characterization of the magnetotransport properties. From Eq. 1 we can express the longitudinal and transverse resistivities as
| (3) | |||
| (4) |
where is the angle between the magnetization and the electric current. At this point it is important to define the angles and directions involved in the expression for and . These parameters will help to understand the experimental results and will be used in the proposed model to determine the reorientation of the magnetization during the magnetization process. In Fig. 2a we show a schematics of the Hall bar in which we indicate the magnetization, external magnetic field and current density vectors in the plane formed by the [100] and [010] directions of the Fe85Co15 layer.
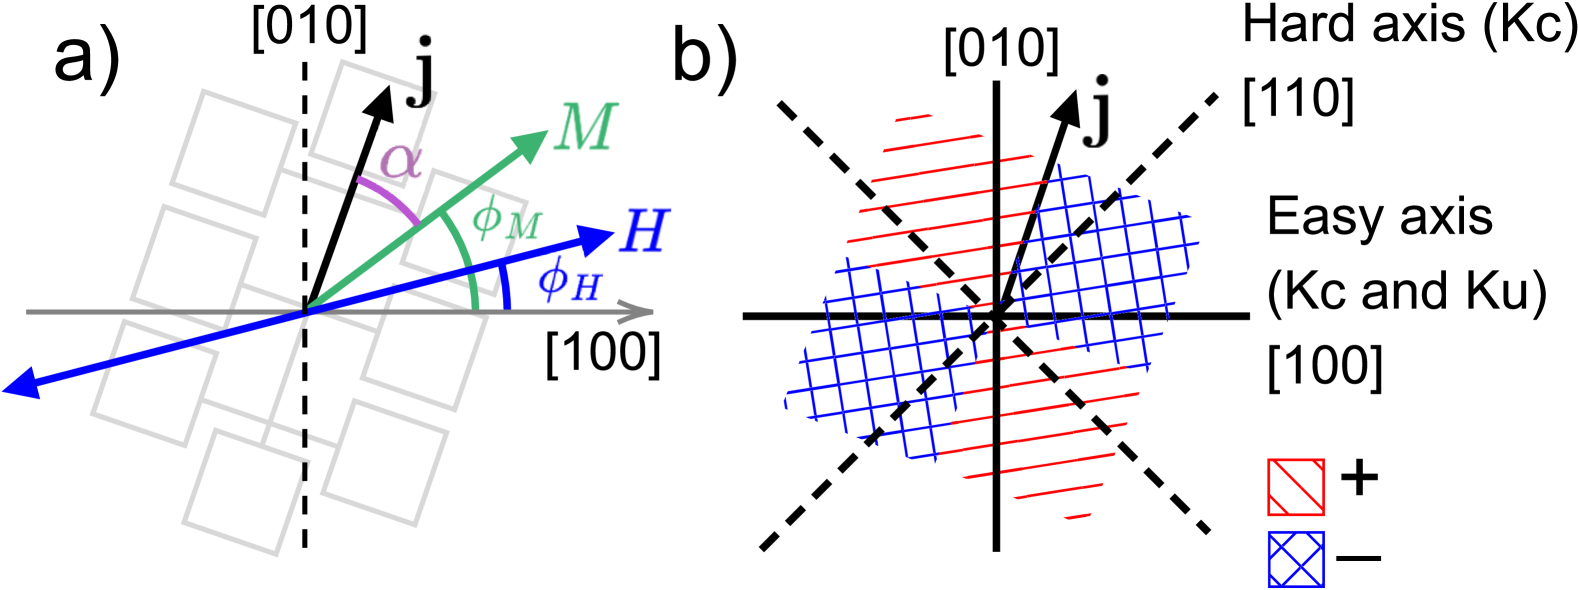
The angles and are the angles of the magnetization and magnetic field vectors measured from the Fe85Co15 [100] direction, as indicated in Fig. 2a. In Fig. 2b we also show a representation of the quadrants in which takes positive or negative values, considering an arbitrary direction of the current density vector j and its transverse direction. From Eq. 4 we can deduce that , where and are the components of the magnetization parallel and perpendicular to the current direction. We highlight these regions to identify the sign change of during the magnetization process, which will be discussed in the forthcoming sections. The directions of the magnetization easy [100] and hard [110] axes of the Fe85Co15 film resulting from the cubic magnetocrystalline anisotropy and the easy axis associated to the uniaxial anisotropy are also indicated in Fig. 2b, where and are the anisotropy constants associated to the cubic and uniaxial anisotropies, respectively.
To determine the AMR ratio, measurements of the longitudinal () and transverse () voltages relative to the current direction were performed by varying the field direction in the plane of the sample. Fig. 3 shows and as a function of measured at 150 K. A current density j = 106 mA/cm2 was applied along the [110] direction, and the applied field was 150 mT. This value of magnetic field is high enough to saturate the Fe85Co15 magnetization () for all in-plane orientations.
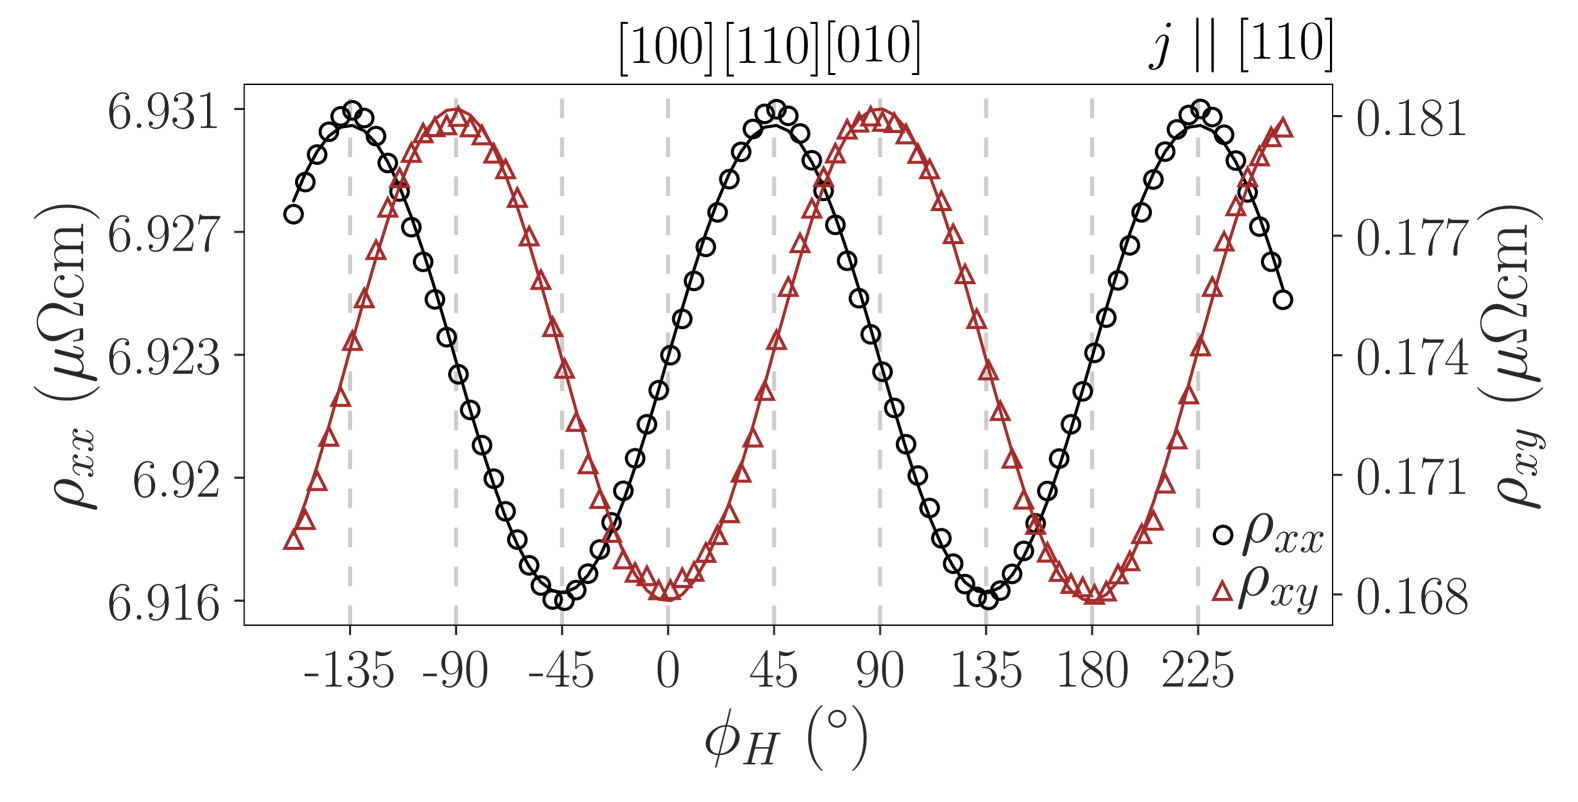
As expected, is maximum due to j[110], and decreases as we rotate the external magnetic field towards the directions transverse to the current. On the other hand, the transverse resistivity curve () is shifted by 45∘ as expected from the term of Eq. 4. To estimate the AMR ratio the data were fitted using the expressions for and shown in Eqs. 3 and 4. To obtain the AMR ratio from the curve we corrected the respective offset in Fig. 3. From the fitting we obtained an anisotropic magnetoresistance ratio AMR = 0.20 0.01 %. The angular dependence of the resistivity with the applied current along the FeCo [100] direction (easy axis) was also measured. In this case, we obtained AMR = 0.17 0.01 %. These values are of the same order as those found in the literature. R. P. van Gorkom et al. [18] reported a value close to 0.5 % for epitaxial Fe films at 150 K, while a more recent work by Zeng et al. [9] reported a strong AMR variation in epitaxial Fe50Co50 films (20 nm) of 0.2 % and 2.1 % when the current is applied along the [110] and [010] directions, respectively, which is also correlated to a strong anisotropic damping (up to 520 %). In our case, we have reported that although the damping along easy and hard magnetization axes is the same, = 2.6 10-3 [10], but we can not rule out that the epitaxial Fe85Co15 presents some degree of anisotropic damping associated to the AMR ratio variations. Following this reasoning we would expect a larger variation of the AMR in FeCo alloys with more Co content. Our measurements of AMR ratio along [100] and [110] confirm that the AMR depends on the crystallographic direction in which the current is injected. The crystalline-dependent AMR can be explained by the different electronic structures along the different crystallographic directions. This phenomenon has been studied over the last years and some of the AMR ratios measured in epitaxial FeCo alloys presented variations of 100 %. Some of these values are listed in Table 1.
| Alloy | AMR | Fabrication | Reference |
|---|---|---|---|
| Fea | 0.14 % | MBE | Tondra et al. [19] |
| Feb | 0.07 % | MBE | Tondra et al. [19] |
| Fec | 0.22 % | MBE | Tondra et al. [19] |
| Fe100-xCox, x=0-65d | 2.4 % | MBE | Zeng et al. [7] |
| Fe85Co15e | 0.20 % | Sputtering | This work |
| Fe85Co15f | 0.17 % | Sputtering | This work |
| Fe50Co50 | 0.18 % | Sputtering | Haidar et al. [5] |
| Fe50Co50g | 0.2 % | MBE | Zeng et al. [9] |
| Fe50Co50h | 2.1 % | MBE | Zeng et al. [9] |
| Fe25Co75 | 0.07 % | Sputtering | Haidar et al. [5] |
aj[001] bj[110] cj[111] dMaximum value obtained for Fe62Co38 e150 K, j parallel to hard axis f150 K, j parallel to easy axis gj parallel to Fe50Co50 easy axis hj parallel to Fe50Co50 hard axis .
III.2 Magnetization process from the magnetotransport measurements
From the longitudinal and transverse voltages, we studied the magnetization process when applying the external magnetic field along different in-plane directions (). Figs. 4a and 4b show the normalized longitudinal and transverse voltages as a function of the external magnetic field along different directions, with angles measured from the [100] direction (Fig. 2).
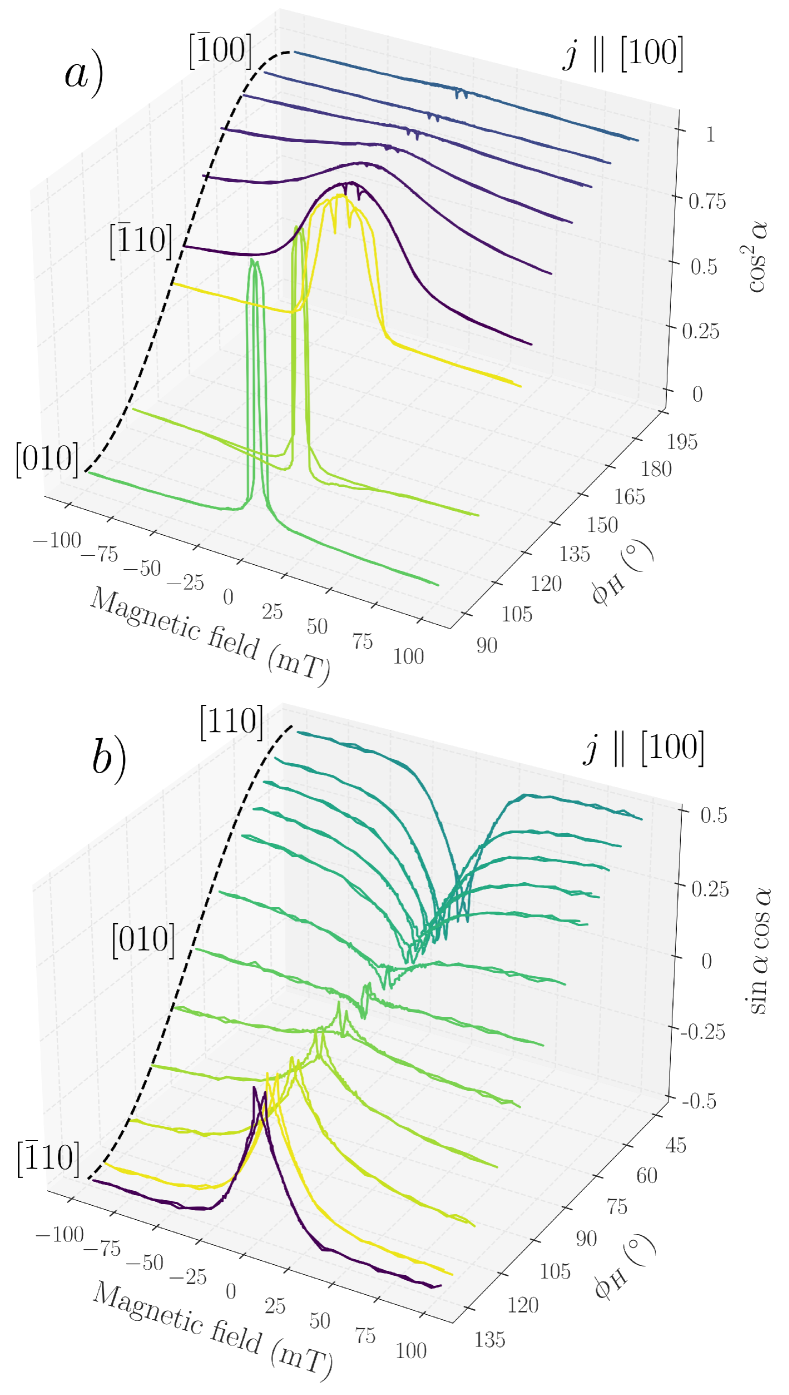
The dotted line in Fig. 4a allows us to identify the evolution of the longitudinal resistance when the external magnetic field is applied from [00] to [010] (Fig. 3). When the external field is applied along [00] ( = 180∘) or along its equivalent direction [100] ( = 0∘), is almost constant and independent of the magnetic field value since [00] corresponds to the Fe85Co15 easy axis and the magnetization remains along [00] even at = 0. In contrast, when the external magnetic field is applied along [10] ( = 135∘), the longitudinal resistance increases as we decrease the magnetic field. This is because [10] corresponds to a hard axis and thus the magnetization moves away from that direction towards the easy axis as the magnetic field decreases, giving a greater resistance. For the range , a sharp maximum appears in the normalized curve close to the coercive field value and the transition between low and high resistance states becomes abrupt as we approach = 90∘. The high resistance state observed at = 0 corresponds to the reorientation of the magnetization from [010] to [100] at low magnetic field values originated by the presence of the uniaxial anisotropy parallel to [100]. In Fig. 4b the normalized transverse voltage is also plotted as a function of the external magnetic field along different directions. In this figure we plotted the curves from = 45∘ to = 135∘. Unlike the longitudinal voltage , which is proportional to the square of the component of the magnetization along the current direction, the transverse voltage contains information of the product of the components parallel and perpendicular to the current direction. Thus, when the external magnetic field is applied along [010] ( = 90∘) the transverse signal remains nearly constant for both positive and negative values of the external magnetic field. This is because = 90∘ corresponds to an easy axis associated to the cubic anisotropy and the small signal observed close to = 0 is the immediate reorientation of the magnetization. As expected, the transverse voltages measured at = 45∘ and = 135∘ are opposite in sign since in both cases we start with the magnetization oriented along a different hard axis. When the external field is applied along [10], the increase of the transverse voltage for low magnetic field values is associated to the rotation towards the [010] direction and can be explained by a decrease of the components along the current direction and an increase of the component transverse to the current direction. The magnetization process and the model proposed to track the direction of the magnetization with respect to the crystalline axes and to the Hall bar orientation will be discussed in detail in the following subsection.
III.3 Model
The magnetization process of the Fe85Co15 film was studied considering a macroscopic single domain approximation as in the Stoner-Wohlfarth model. Within this approach, we can consider that the magnetization rotates coherently for high magnetic field values although the existence of magnetic domains below the coercive field could not be neglected. To propose an expression of the free energy density we consider the shape anisotropy, an in-plane uniaxial easy axis and a cubic magnetocrystalline energy. We express this energy density using spherical coordinates (, ) for the representation of the magnetization M and external magnetic field H vectors as shown in Fig. 2. The magnetic free energy of the system is then described as follows:
| (5) | |||
where the first term corresponds to the Zeeman energy, the second term corresponds to the shape anisotropy, the third term to the cubic anisotropy and the last term to the uniaxial anisotropy. and are the anisotropy constants associated to the cubic and uniaxial anisotropies and are defined as and . In the expressions for and , and are defined as the cubic and uniaxial anisotropy fields. In the model, it is also assumed that the uniaxial axis is in the plane of the sample in a direction given by the angle . By differentiating with respect to and making , we obtain the equilibrium angle . This results in a simplified free energy expression containing only terms in :
| (6) | |||
By minimizing the free energy proposed in Eq. 6, we found the equilibrium angles of the magnetization () for each value of the external magnetic field and for the different directions . We have considered the anisotropy constants and as fitting parameters of the normalized longitudinal and transverse voltages shown in Fig. 4a and 4b. Although the Kerr loops and our previous work on Fe100-xCox alloys [10] confirmed that the uniaxial anisotropy is weak compared to the cubic anisotropy, we need to consider it in the energy expression for the determination of the magnetization equilibrium angles, since the presence of the uniaxial anisotropy plays an important role to fit the experimental curves. This is clearly seen in Fig. 5 where we show the fitting of the longitudinal voltage measured with the external magnetic field at = 135∘ and the current applied along the magnetization easy axis [100]. We compare the fitting of the experimental data with 0 (Fig. 5a) and = 0 at = 0 (Fig. 5b). The uniaxial anisotropy breaks the symmetry of the magnetization process during the application of the external magnetic field and is critical to determine the magnetization orientation, especially at low values of .
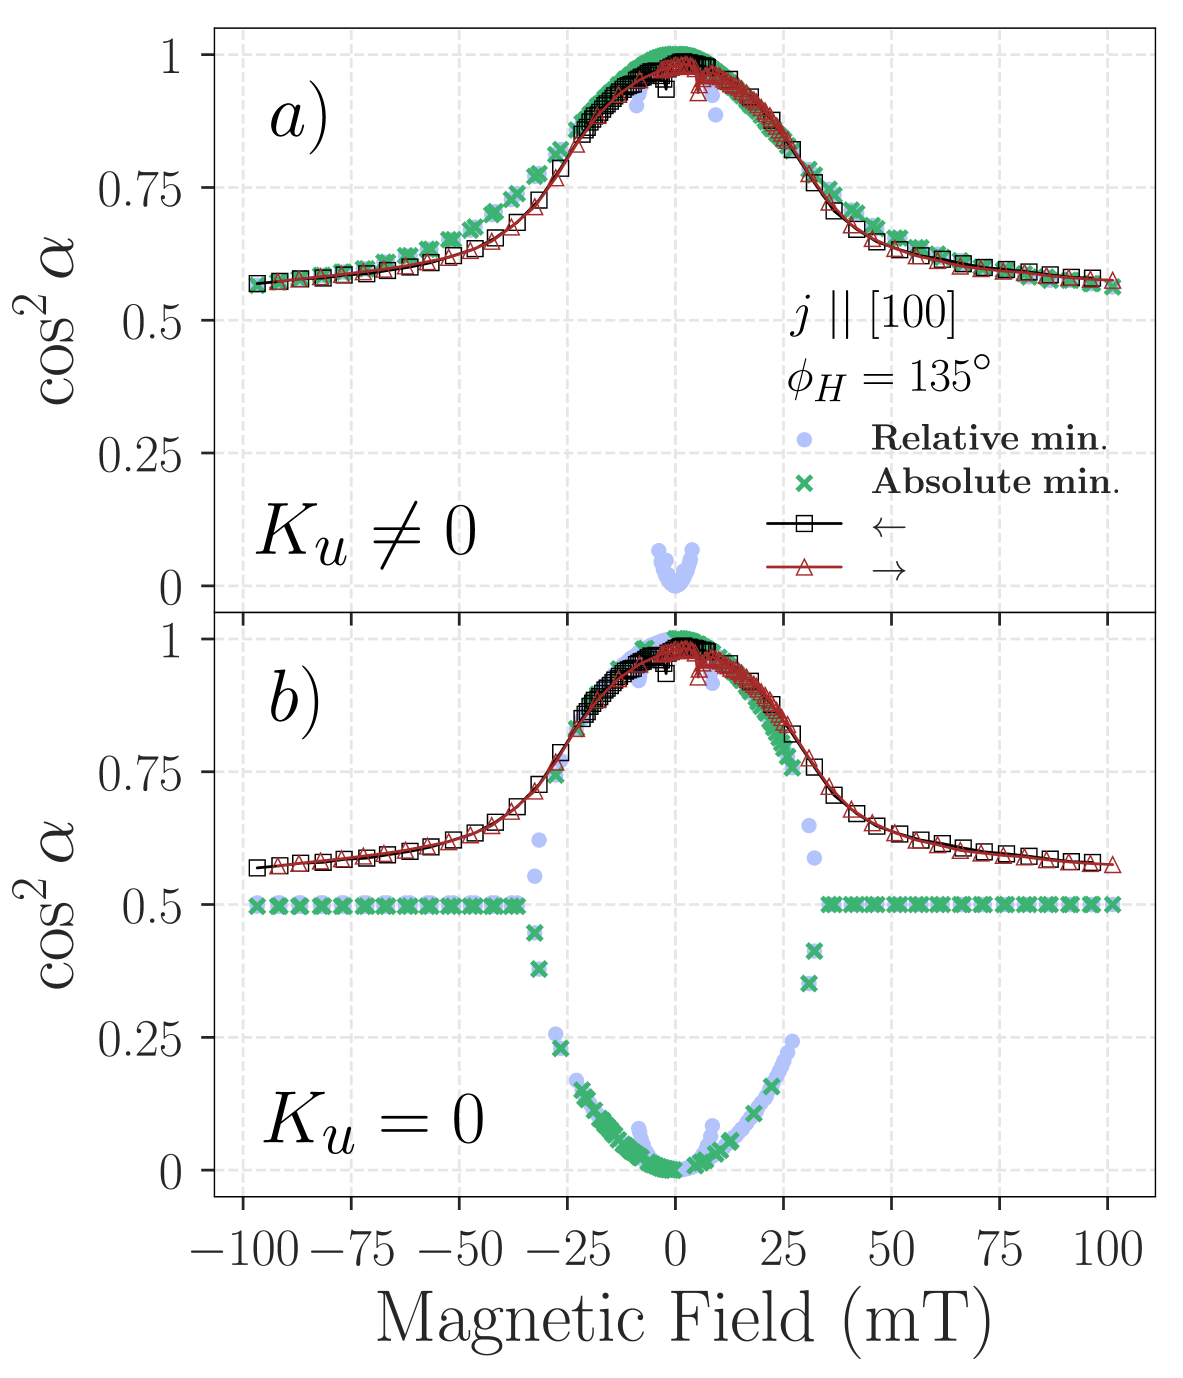
As can be seen in Fig. 5 the absolute minimum of the calculated can take values below 0.5. Although all angles of magnetization corresponding to a relative minimum of the free energy are plotted (light blue points in Fig. 5), the points corresponding to absolute minima are distinguished. The consistency between the model and the experiment is maintained with a remarkable level of similarity in all measurements. The obtained anisotropy constants are kJ/m3 and kJ/m3. These values are comparable with the ones obtained from the angular variation of the ferromagnetic resonance experiments in our previous work [10]: 366 Oe or 29.1 kA/m, which correspond to a cubic anisotropy constant 31.1 kJ/m3, considering a saturation magnetization = 1700 kA/m.
Additionally, longitudinal and transverse voltage measurements allow us to predict the directions taken by the magnetization when the external field is applied. Fig. 6a shows the normalized longitudinal voltage when the current is applied along the easy magnetization axis. In the inset we schematically represented the magnetization direction when we decrease the external magnetic field from 100 mT to -100 mT.
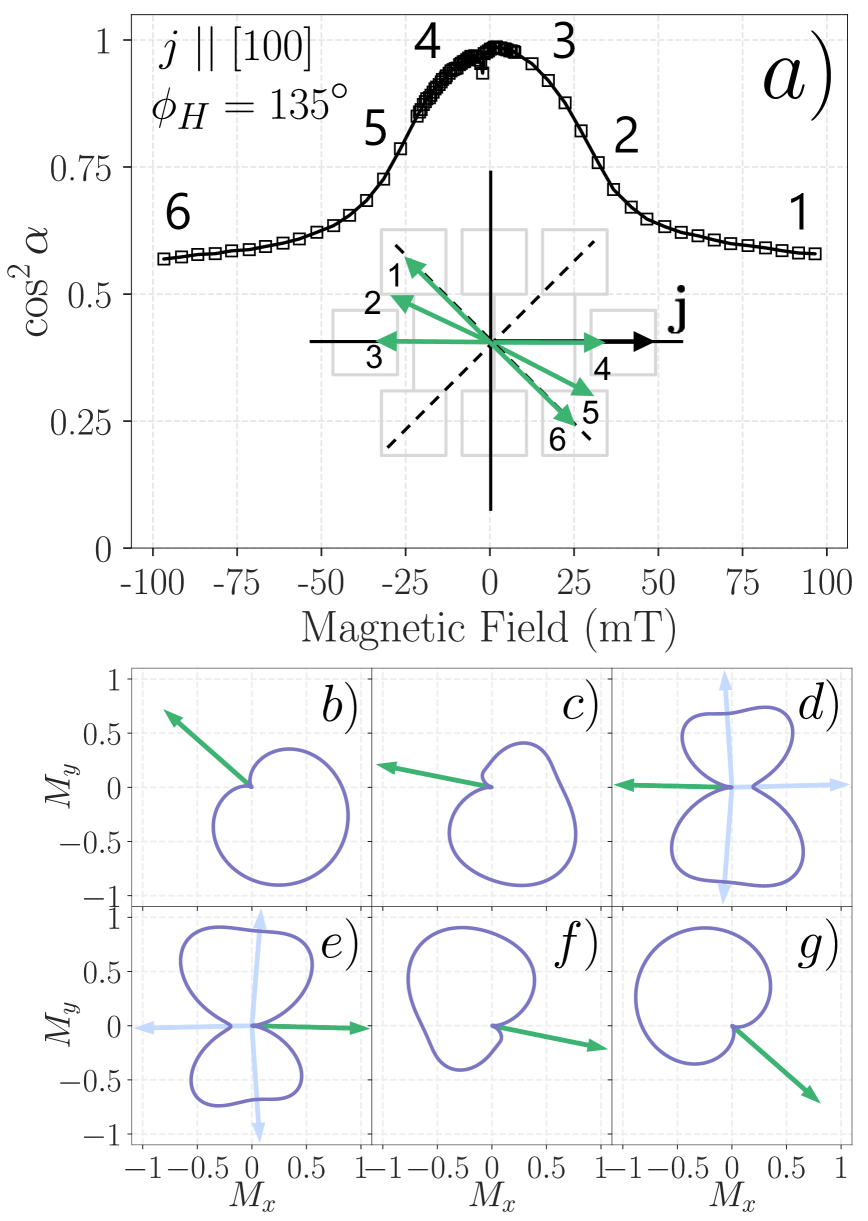
In Fig 6a when the magnetization is close to the saturated state at = 100 mT (green arrow 1 in the inset of Fig 6a), the normalized longitudinal voltage starts around = 0.5 suggesting that the magnetization is not fully aligned with the magnetic field direction. When we decrease the external field to H = 0, the magnetization aligns with the cubic easy axis, which is parallel to the current direction (arrow 3), then the longitudinal voltage increases to = 1. As we start to increase the magnetic field in the opposite direction the magnetization abruptly rotates towards the opposite direction along the easy axis (arrows 3 and 4 in the inset). This is observed in the normalized longitudinal voltage as a small peak close to the coercive field value (around 2 mT). As we approach to saturation for negative values of the external magnetic field the magnetization smoothly rotates following the trajectories indicated by the green arrows 5 and 6 in the inset. It is important to notice that never vanishes. This indicates that the magnetization never aligns with the easy axis [010] which is perpendicular to the current direction. This is due to the presence of the uniaxial anisotropy that favors the orientations of along the [100] direction.
The description of the path followed by the magnetization during the magnetization process was verified through the determination of the magnetization equilibrium angles obtained by minimizing the free energy expression proposed in Eq. 6. From Eqs. 3 and 4 we were able to simulate all the longitudinal and transverse signals as a function of the external magnetic field. In Figs. 6b - 6f we schematically show the normalized and components obtained from the minimization of Eq. 6 for = 135∘. To find relative minima, the energy was evaluated at 1000 equally spaced values of , comparing each result with its consecutive values. This procedure was performed while keeping the anisotropy constants, as well as the magnitude and direction of the applied field, fixed. Additionally, by setting the current direction, each value of yields a corresponding , which is then used to compute and . The squared distances between the experimental points and the model can be easily computed in the graphs of and . To fit the anisotropy constants, we employed the Powell method to adjust these constants and minimize the residuals. In the plot we show the magnetization direction (green arrow) for the following values of the external magnetic field: b) 0.1 T, c) 0.01 T, d) 0 T, e) -0.001 T, f) -0.01 T and g) -0.1 T for .
In a similar way we can correlate the magnetization process with the transverse voltage when the current is applied along the hard axis. Fig. 7a shows the normalized transverse voltage as a function of the external magnetic field applied along the hard axis. However, in this case the current is also applied close to the magnetization hard axis.
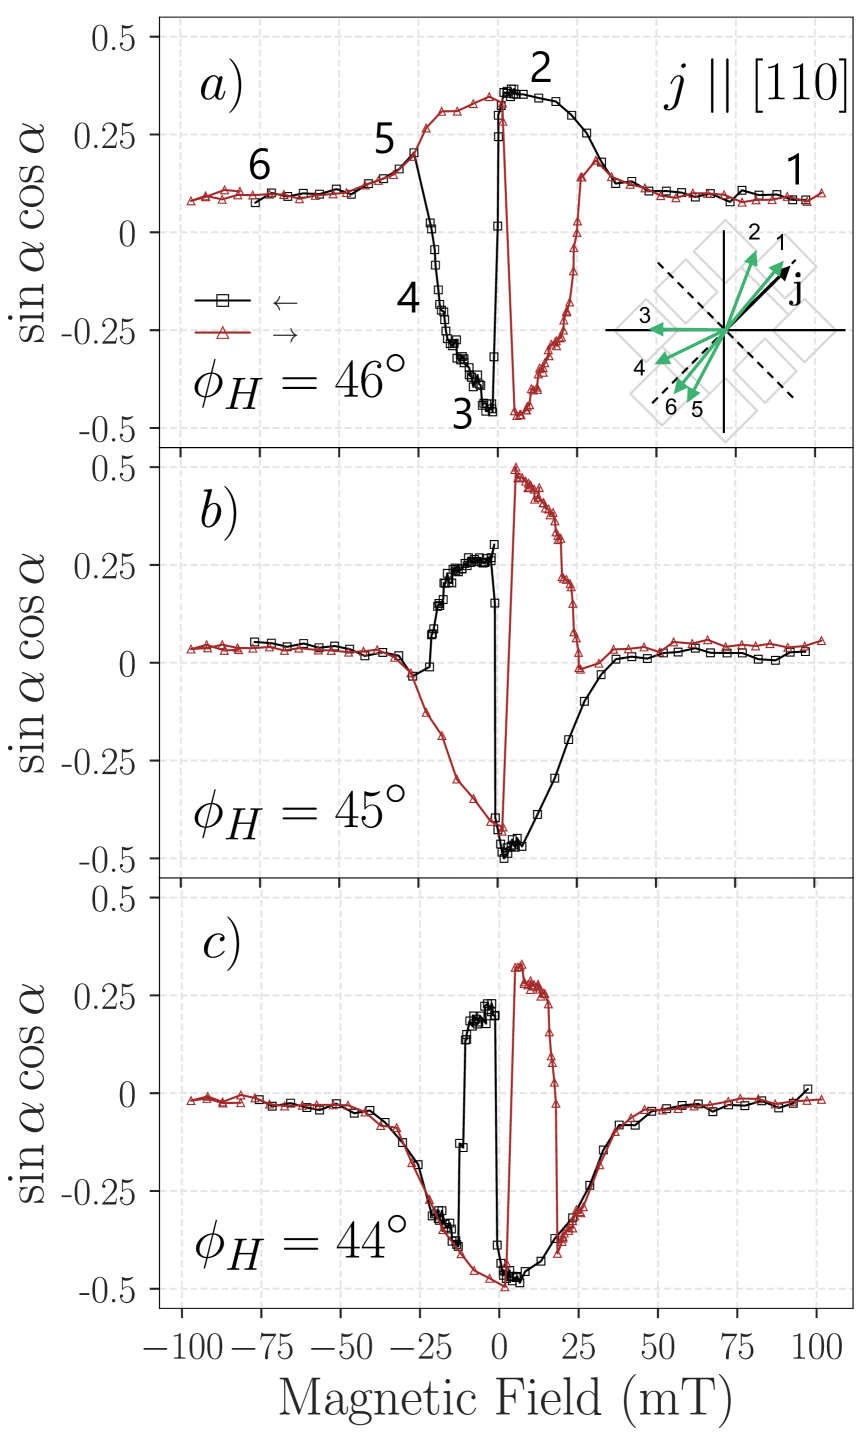
In the saturation state the magnetization is aligned with both the current and the magnetic field (arrow 1 in the inset of Fig. 7a), then the transverse voltage is close to zero. This is attributed to a misalignment between the magnetization and the external magnetic field before saturation, as can be seen in the Kerr hysteresis loops in Fig. S1. As we decrease the magnetic field to zero, the magnetization rotates to the easy axis ([010] direction of the Fe85Co15) and the normalized transverse voltage approaches to = 0.5 (region 2 of the plot). This is because the transverse component of the magnetization with respect to the current direction increases and the longitudinal component decreases as we decrease the external magnetic field. For negative values of the magnetic field the transverse signal switches to take negative values at the coercive field. Then as we increase the external field the transverse voltage increases from -0.5 to 0.25 until 25 mT and then decreases again until the magnetization reaches the saturation for negative values of the magnetic field. The increase followed by a subsequent decrease of the transverse voltage close to 25 mT represents a rotation of the magnetization from the cubic easy axis indicated by arrow 3 in the inset of Fig. 7a towards an intermediate direction between the closer cubic easy axis and the direction of the external magnetic field. From this point the magnetization will coherently rotate to align with the external field in saturation. Although this magnetization process is consistent with the principle that less energy is required when the magnetization is oriented along or near the cubic easy axis in a four-fold magnetocrystalline anisotropy system, it is important to notice that the coherent rotation of the magnetization assumed in the Stoner-Wohlfarth is no longer valid. From the magnetization process described in the inset of Fig. 7a we would expect that, when the field is brought to zero, the magnetization would rotate towards the [100] direction (easy-easy) instead of the [010] (easy-hard) direction, however the measured transverse voltage does not reflect that. This is due to the appearance of domain walls in the Fe85Co15 film as the external magnetic field approaches zero and the displacement of these domain walls when we decrease the external magnetic field at a given [20, 21]. Zhang et al. [20] demonstrated through the detection of the longitudinal and transverse signal of Kerr magnetometry in an Fe/MgO(001) single crystal, that the domain wall displacement strongly depends on the direction of the magnetic field.
Zhang et al. also highlighted that the magnetization reversal process is very sensitive to small deviations of the external magnetic field with respect to the hard axis of Fe(001). Kerr loops shown in Ref. [20] measured at deviations of = -1∘ and = 1∘ from the cubic hard axis are determinant for the magnetization process, causing the magnetization to rotate towards [100] or [010], respectively. From our experiments and simulations we were also able to verify the major role of the relative orientation between the external magnetic field and the electric current and how this impacts on the rotation of the magnetization, similar to the analysis reported in Zhang et al. [20] We demonstrated that a small field deviation with respect to the current direction and the cubic easy and hard axes strongly influences on the longitudinal and transverse voltages. The path taken by the magnetization is strictly related to the quadrant in which was applied when it was reversed. Fig. 7 presents the transverse signal as a function of the external field applied along a) , b) and c) . These plots evidence that the magnetization process is mediated by the direction of the external field. This can be seen in the experimental data measured when we sweep the magnetic field from +100 mT to -100 mT. On the one hand, in Fig. 7c we can observe that the transverse voltage, which depends on the product of the and components of the magnetization, obtained for decreases as we decrease the external field. However, in Fig. 7a the transverse voltage measured when increases as we approach to zero field. The magnetization process follows a path similar to the one described in Fig. 6b however the forward and return paths take different routes. In both paths, two discontinuous jumps occur, corresponding to abrupt changes in the magnetization direction that aligns near different cubic easy axes.
It is important to notice that the experimental data for magnetic field values between -50 mT 50 mT shown in Fig. 7 deviate from the model used for fitting. This is commonly observed in systems in which the formation of the magnetic domains is not considered. Despite this, the magnetization process and, more important, the paths taken by the magnetization fit adequately for all the presented measurements.
IV Conclusions
In summary, we have performed a detailed magnetotransport characterization in epitaxial Fe85Co15 films to discuss the influence of the crystal symmetry on the anisotropic magnetoresistance. The crystalline structure produces a crystalline-dependent AMR ratio of 0.20 % and 0.17 % when the current is applied in the directions of a hard and easy magnetization axis respectively. These values are consistent and of the same order of magnitude than those reported in the literature and confirm that the AMR exhibits anisotropy with respect to the crystallographic direction in which the current is injected. For the FeCo studied concentration the anisotropy ratio is relatively small, which is in accordance with the reported almost isotropic values of the damping constant from FMR studies. On the other hand, the transverse and longitudinal voltages combined with a model based on the Stoner-Wohlfarth formalism allowed us to determine the magnetization direction as a function of the external magnetic field and also the identification of the paths taken when the magnetic field was reduced and then reversed. The cubic and uniaxial anisotropy constants that better fit our experiments are = 21 kJ/m3 and = 11 kJ/m3. Our results suggest that the FeCo-based system opens the possibility to develop magnetoresistive sensors with tuned AMR only by designing the magnetic device oriented along a specific crystal axis.
Acknowledgements.
Technical support from Rubén E. Benavides, César Pérez and Matías Guillén is greatly acknowledged. This work was partially supported by Conicet under Grant PIBAA 2022-2023 (project MAGNETS) Grant ID. 28720210100099CO; ANPCyT Grant PICT-2018-01138, ANPCyT Grant PICT 2021-00113 (project DISCO) and U.N. Cuyo Grant 06/C556 from Argentina. We acknowledge the financial support of European Commission by the H2020-MSCA RISE project ULTIMATE-I (Grant No. 101007825). L. Avilés-Félix thanks E. De Biasi for fruitful discussions and Claudio Ferrari from the Departamento de Micro y Nanotecnología (CNEA - INN) for the preparation of the lithography masks.References
- Mankovsky et al. [2013] S. Mankovsky, D. Ködderitzsch, G. Woltersdorf, and H. Ebert, Phys. Rev. B 87, 014430 (2013).
- Schoen et al. [2016] M. A. W. Schoen, D. Thonig, M. L. Schneider, T. J. Silva, H. T. Nembach, O. Eriksson, O. Karis, and J. M. Shaw, Nature Physics 12, 839 (2016).
- Berger et al. [1988] L. Berger, P. P. Freitas, J. D. Warner, and J. E. Schmidt, Journal of Applied Physics 64, 5459 (1988).
- Ganguly et al. [2014] A. Ganguly, K. Kondou, H. Sukegawa, S. Mitani, S. Kasai, Y. Niimi, Y. Otani, and A. Barman, Applied Physics Letters 104, 072405 (2014).
- Haidar et al. [2015] S. M. Haidar, R. Iguchi, A. Yagmur, J. Lustikova, Y. Shiomi, and E. Saitoh, Journal of Applied Physics 117, 183906 (2015).
- Weber et al. [2019] R. Weber, D.-S. Han, I. Boventer, S. Jaiswal, R. Lebrun, G. Jakob, and M. Kläui, Journal of Physics D: Applied Physics 52, 325001 (2019).
- Zeng et al. [2020a] F. L. Zeng, Z. Y. Ren, Y. Li, J. Y. Zeng, M. W. Jia, J. Miao, A. Hoffmann, W. Zhang, Y. Z. Wu, and Z. Yuan, Phys. Rev. Lett. 125, 097201 (2020a).
- Li et al. [2019] Y. Li, F. Zeng, S. S.-L. Zhang, H. Shin, H. Saglam, V. Karakas, O. Ozatay, J. E. Pearson, O. G. Heinonen, Y. Wu, A. Hoffmann, and W. Zhang, Phys. Rev. Lett. 122, 117203 (2019).
- Zeng et al. [2020b] F. Zeng, X. Shen, Y. Li, Z. Yuan, W. Zhang, and Y. Wu, New Journal of Physics 22, 093047 (2020b).
- Velázquez Rodriguez et al. [2024] D. Velázquez Rodriguez, J. E. Gómez, L. Avilés-Félix, J. L. Ampuero Torres, T. E. Torres, A. Pérez Martínez, L. Morbidel, D. Y. Goijman, J.-C. Rojas-Sanchez, M. Aguirre, J. Milano, and A. Butera, Journal of Physics D: Applied Physics 57, 395003 (2024).
- Kokado et al. [2012] S. Kokado, M. Tsunoda, K. Harigaya, and A. Sakuma, Journal of the Physical Society of Japan 81, 024705 (2012).
- Thomson [1857] W. Thomson, Proceedings of the Royal Society of London 8, 546 (1857).
- Harder et al. [2016] M. Harder, Y. Gui, and C.-M. Hu, Physics Reports 661, 1 (2016).
- Gonzalez-Chavez et al. [2022] D. Gonzalez-Chavez, M. A. Pervez, L. Avilés-Félix, J. Gómez, A. Butera, and R. Sommer, Journal of Magnetism and Magnetic Materials 560, 169614 (2022).
- Juretschke [1960] H. J. Juretschke, Journal of Applied Physics 31, 1401 (1960).
- Velázquez-Rodriguez et al. [2020] D. Velázquez-Rodriguez, J. E. Gómez, G. Alejandro, L. Avilés-Félix, M. van Landeghem, E. Goovaerts, and A. Butera, Journal of Magnetism and Magnetic Materials 504, 166692 (2020).
- Velázquez Rodriguez et al. [2021] D. Velázquez Rodriguez, J. E. Gómez, L. Morbidel, P. A. Costanzo Caso, J. Milano, and A. Butera, Journal of Physics D: Applied Physics 54, 325002 (2021).
- van Gorkom et al. [2001] R. P. van Gorkom, J. Caro, T. M. Klapwijk, and S. Radelaar, Phys. Rev. B 63, 134432 (2001).
- Tondra et al. [1993] M. Tondra, D. K. Lottis, K. T. Riggs, Y. Chen, E. D. Dahlberg, and G. A. Prinz, Journal of Applied Physics 73, 6393 (1993).
- Zhang et al. [2016] M.-L. Zhang, J. Ye, R. Liu, S. Mi, Y. Xie, H.-L. Liu, C. V. Haesendonck, and Z.-Y. Chen, Chinese Physics B 25, 047503 (2016).
- Buchmeier et al. [2009] M. Buchmeier, R. Schreiber, D. E. Bürgler, and C. M. Schneider, Phys. Rev. B 79, 064402 (2009).