TDBench: Benchmarking Vision-Language Models in Understanding Top-Down Images
Abstract
The rapid emergence of Vision-Language Models (VLMs) has significantly advanced multimodal understanding, enabling applications in scene comprehension and visual reasoning. While these models have been primarily evaluated and developed for front-view image understanding, their capabilities in interpreting top-down images have received limited attention, partly due to the scarcity of diverse top-down datasets and the challenges in collecting such data. In contrast, top-down vision provides explicit spatial overviews and improved contextual understanding of scenes, making it particularly valuable for tasks like autonomous navigation, aerial imaging, and spatial planning. In this work, we address this gap by introducing TDBench, a comprehensive benchmark for VLMs in top-down image understanding. TDBench is constructed from public top-down view datasets and high-quality simulated images, including diverse real-world and synthetic scenarios. TDBench consists of visual question-answer pairs across ten evaluation dimensions of image understanding. Moreover, we conduct four case studies that commonly happen in real-world scenarios but are less explored. By revealing the strengths and limitations of existing VLM through evaluation results, we hope TDBench to provide insights for motivating future research. 111Project website: https://github.com/Columbia-ICSL/TDBench
1 Introduction
In recent years, Large Language Models (LLMs) (Achiam et al., 2023; Touvron et al., 2023; Guo et al., 2025) have been used as a powerful tool in numerous domains (Xu et al., 2024; Yang et al., 2025; Lan & Chen, 2024) for their remarkable reasoning capabilities that are comparable to, and in some cases, even surpass human capabilities. Building upon the success of LLMs, cross-modality models have also been largely explored. Vision-language models (VLMs), which align visual features with text embeddings, such as LLaVA (Liu et al., 2023) and InternVL2.5 (Chen et al., 2024a), have overcome the limitations of single-modality (text analysis) to enable image understanding. These models demonstrate impressive capabilities in comprehending visual-linguistic information, reasoning, and responding to human queries about images. The advances in VLMs have led to rapid development in vision-language-action (VLA) applications (Kim et al., 2024). Prior to the emergence of VLMs, robots required various specialized models for proper operation. VLMs can now be utilized for both high-level decisions (task planning, execution plan generation, and navigation) and low-level control (motion and system control) due to their broad knowledge base. Researchers are actively extending this to aerial surveillance and aerial robots (drones) as they provide more information due to the large field of view and less occlusions for objects on the ground.
The aerial images taken from the air are usually top-down views. Such images are less common in the datasets typically used for training, such as COCO dataset (Lin et al., 2015) and ImageNet (Russakovsky et al., 2015). During our data cleaning process, we identified only 595 images out of 8,629 can be considered as top-down images in the dataset created by Zhu et al. (2021). Top-down images offer particular advantages over front-view images, including broader spatial coverage, reduced occlusion between objects, more consistent scale representation across the image plane, and the ability to capture complete structural layouts that would be impossible to observe from ground level. These advantages make aerial images particularly valuable for applications such as urban planning, environmental monitoring, agricultural assessment, and disaster response, where comprehensive spatial information and the ability to analyze large areas efficiently are critical for effective decision-making.
Existing Vision-Language Model (VLM) benchmarks such as MMBench (Liu et al., 2024), MMMU (Yue et al., 2024), MM-Vet (Yu et al., 2024), and MathVista (Lu et al., 2024) focus primarily on conventional perspective images and lack substantial assessments for top-down views. This creates a significant performance gap when models are applied to aerial contexts, as they struggle with the inherent differences in scale, perspective, object appearance, and spatial relationships unique to top-down images. Existing models, trained predominantly on front-view images, often exhibit performance degradation when applied to aerial perspectives due to several key challenges: (i) the scale variation in top-down images differs substantially from conventional images, with objects appearing much smaller relative to the overall scene; (ii) the appearance of objects from a top-down perspective presents different visual features that are poorly represented in standard training datasets; (iii) spatial relationships between objects follow distinct patterns in aerial views compared to front-view images, requiring different interpretative approaches; and (iv) contextual cues that aid object recognition in conventional images may be absent or transformed in top-down perspectives. The absence of specialized benchmarks addressing these aerial-specific challenges hinders the systematic evaluation and improvement of VLMs for important applications including environmental monitoring, urban planning, aerial surveillance, and disaster response.
To fill this gap, we propose TDBench, a benchmark specifically designed to comprehensively and objectively assess VLMs on top-down images. TDBench addresses the limitations of existing benchmarks by providing a diverse collection of aerial images captured from varying altitudes (5-150m), angles, and urban contexts.
Unlike conventional benchmarks, TDBench emphasizes real-world applications by including scenarios relevant to urban planning, emergency response and traffic monitoring. Furthermore, we introduce novel evaluation strategy tailored to aerial images that account for rotation symmetry. By revealing the strengths and limitations of existing VLMs through evaluation results, we hope TDBench will provide insights for motivating future research. In summary, our main contributions are:
-
•
Practical-oriented Dataset Design. As most use cases of top-down images originate from real scenarios is aerial operation or drone applications, We carefully curated a dataset comprising a total of 2000 questions.
-
•
Robust Evaluation. We introduce an evaluation strategy (RotationalEval) specifically designed for top-down images. Due to the nature of top-down images, rotations do not affect the semantic meaning, whereas this is not true and does not physically make sense naturally for front-view images.
-
•
In-depth Case Studies. We performed 4 case studies that frequently occur in the real world.These studies evaluate specific capabilities of VLMs under controlled conditions, providing actionable insights for practical deployment while identifying critical challenges that must be addressed for reliable aerial image understanding.
2 Related Works
2.1 Large Vision-Language Models
Vision Language Models (VLMs) have become increasingly prevalent (Radford et al., 2021), demonstrating impressive capabilities in applications such as visual question answering (Agrawal et al., 2016), image captioning (Li et al., 2022), and text-to-image search (Jia et al., 2021). Similar to how humans associate words with visual concepts, VLMs process both textual and visual inputs by aligning them in a shared semantic space (Alayrac et al., 2022). The architecture typically consists of two main components: a language model pre-trained on extensive text data that provides general knowledge (Touvron et al., 2023), and a visual feature extractor (commonly CNNs (O’Shea & Nash, 2015) or ViT (Dosovitskiy et al., 2021)) that processes images or videos. These components work together through joint embedding spaces and attention mechanisms (Li et al., 2021; Liu et al., 2023), enabling the model to connect visual content with corresponding textual descriptions. The training process for VLMs relies heavily on large-scale datasets like LAION-5B (Schuhmann et al., 2022) and MS COCO (Lin et al., 2015), which contain diverse image-text pairs. However, these datasets may include a limited number of top-down images compared to other perspectives. This potential imbalance becomes significant when evaluating VLMs on top-down images, as the performance depends largely on the visual feature extraction component’s exposure to this specific viewpoint during training.
2.2 Benchmarks for Multimodal Models
General VLM Benchmarks
General benchmarks do include tasks relevant to top-down images but very limited questions. MMBench (Liu et al., 2024) assesses fine-grained abilities like spatial reasoning, while MMMU (Yue et al., 2024) tests college-level multimodal understanding, including maps and diagrams. MME (Fu et al., 2024) evaluates perception and cognition, and MMT-Bench (Ying et al., 2024) covers diverse multimodal tasks, including driving scenarios. Although not explicitly focused on top-down views, these benchmarks provide valuable insights into general VLM capabilities.
Several comprehensive benchmarks have been developed to evaluate VLMs across various domains. MMBench (Liu et al., 2024) assesses fine-grained abilities including spatial reasoning, while MMMU (Yue et al., 2024) evaluates college-level multimodal understanding through maps and diagrams. Similarly, MME (Fu et al., 2024) focuses on perception and cognition aspects, and MMT-Bench (Ying et al., 2024) encompasses diverse multimodal tasks such as driving scenarios. However, these benchmarks exhibit significant limitations regarding top-down images. Despite their broad coverage, they contain very few questions specifically targeting top-down visual understanding, and lack systematic evaluation of spatial relationships from aerial perspectives. This gap is particularly problematic as top-down views present unique challenges in object recognition, spatial-temporal analysis, and scene understanding that remain inadequately assessed in these benchmarks.
Remote Sensing Benchmarks
Remote sensing images are usually top-down view of large geographical areas, typically captured by satellites or aircraft. These images are used to observe and analyze spatial distributions, relationships between entities, and changes over time across various scales, aiding in understanding and managing our planet. While benchmarks on remote sensing images (Hu et al., 2023; Lobry et al., 2020; Muhtar et al., 2024; Kuckreja et al., 2023) evaluate VLM performance on aerial images, they are fundamentally different from drone-based applications. Remote sensing benchmarks primarily address satellite images with relatively low spatial resolution (typically several meters per pixel or up to 30 meters/pixel), with even the highest resolution commercial satellites limited to 0.3 meters/pixel222https://www.studycountry.com/wiki/what-is-the-resolution-of-the-corona-satellite. These resolutions focus on macro-scale features across vast geographic regions and fail to capture fine-grained information. This fundamental resolution barrier makes satellite images inadequate for evaluating fine-grained perception tasks like identifying small objects, assessing structural details, or interpreting human-scale environments. Additionally, satellite images typically features consistent nadir angles and fixed altitudes, lacking the perspective variations encountered in dynamic drone operations. Remote sensing images can be considered as top-down images, but in this work, we primarily focus on city-scale images that are usually captured at near-surface altitudes (below 120 meters) where a drone can typically hover.
3 Design of TDBench
In this section, we provide a detailed definition of TDBench along with illustrative examples. We also describe our dataset quality control procedures and present statistical distributions of the data.
3.1 The Hierarchical Ability Taxonomy of TDBench
We have structured the evaluation hierarchy of TDBench into two levels as shown in Figure 1, which illustrates necessary benchmarking categories. We identified three L-1 capabilities as the fundamental aspects: image perception, single-instance identification, and multi-instance discernment. Next, we divided these L-1 capabilities into 10 fine-grained L-2 dimensions informed by typical aerial tasks encountered in real-world applications. We have excluded evaluation dimensions that are either common across existing benchmarks or relatively unaffected by image perspective, such as text recognition and general knowledge assessment.
Following we will define and justify the need for each L-2 category, and we show some examples in for each category in Figure 2.

Image Perception
encompasses the broad-scale interpretation of top-down aerial imagery, focusing on extracting holistic semantic content rather than fine-grained details. This capability is particularly valuable during wide-area reconnaissance missions where drones survey extensive geographic regions to identify critical features such as wildfire outbreaks, traffic congestion patterns, or emergency response scenarios—applications that fundamentally rely on open-vocabulary understanding of diverse scenes. Image Perception comprises two complementary L-2 categories: Scene Understanding (scene undst.), which evaluates a model’s ability to comprehend overall contextual meaning, and Hallucination Detection (halluc. detect), which assesses a model’s capacity to distinguish between actual image content and fabricated choices. Both categories are highlighted in blue in Figure 2 and represent foundational capabilities for reliable aerial image interpretation.
Single Instance
includes a wide range aspects for emphasizing detailed object recognition and localization based as colored in green in Figure 2. This category examines on a single image input at any given timestamp. this dimension evaluates increasingly detailed object interaction skills across multiple L-2 categories. For object recognition, we include Object Presence (Obj. Pres.), which assesses basic detection capabilities typically yielding higher accuracy rates, and Attribute Recognition (Attr. Recog.), which evaluates more challenging identification of specific properties such as color, shape, material composition, and species classification. For object localization, we implement a three-tiered assessment approach: coarse-grained presence detection (Obj. Pres.), intermediate 3×3 grid-based object localization (Obj. Local.) requiring quadrant-level precision, and Visual Grounding (Visual Gnd.) for exact bounding box coordinates of target objects. Additionally, we include Object Counting (Obj. Cnt.) to evaluate quantification abilities—a particularly challenging task in aerial contexts where many similar objects often appear at varying scales and densities across large geographic areas.
Multi Instance
evaluates compositional reasoning capabilities requiring analysis of cross-instance, temporal, and spatial relationships, useful for applications such as trajectory prediction, anomaly detection, and human intention prediction. As highlighted in yellow in Figure 2, we include three specialized L-2 categories that assess different aspects of relational understanding. Spatial Relationship (Spatial Rel.) challenges models to localize multiple objects and accurately determine their relative positions, a fundamental capability for navigation and path planning in autonomous aerial systems. Attribute Comparison (Attr. Comp.) requires models to compare properties or states across multiple entities, essential for detecting anomalies or identifying significant features among similar objects. Dynamic Temporal (Dyn. Temp.) presents pairs of images, evaluating models’ ability to detect changes, reason about the temporal sequence, and infer causal relationships.
3.2 Data Collection
To maximize data diversity, we incorporated multiple open-source datasets (Shaha, 2025; Zhu et al., 2021; Gasienica-Jozkowy et al., 2021; ICG, 2019; Varga et al., 2022; Mou et al., in press) spanning various environmental contexts, including urban scenes (traffic infrastructure, residential neighborhoods), remote locations (beaches, oceans, wilderness areas), and disaster zones. All images from these public datasets underwent comprehensive manual annotation according to our evaluation taxonomy. Beyond real-world images, we generated synthetic data using the CARLA simulation (Dosovitskiy et al., 2017) environment with custom scripting to produce scenes with precisely controlled parameters. For specialized case studies requiring exact ground truth information—such as camera altitude, precise object counts, and accurate height measurements—we utilized both CARLA simulation environments and Grand Theft Auto V (GTA V).
CARLA
is an open-source autonomous driving simulator that provides realistic urban environments with high-fidelity graphics and physics. We utilize its configurable sensor suite to generate synthetic data for our benchmark by deploying paired RGB and segmentation cameras at varying altitudes. This approach enables precise control over object instances (e.g., vehicles) within captured images, facilitating rigorous evaluation of VLMs’ object counting capabilities (Section 3) and systematic analysis of altitude-dependent detection performance (Section 5).
The benchmark is organized into two task types: Multiple Choice Questions (MCQs) for most tasks, and Visual Grounding (VG). Each MCQ problem is structured as a quadruple , where denotes the textual question, is the associated image, represents the set of possible answers with () choices (randomly shuffled during evaluation), and is the correct label. For VG problems, we evaluate models’ ability to precisely localize objects by comparing their predicted bounding box coordinates against , which contains human-annotated ground truth coordinates. To ensure comprehensiveness and quality, we first created a set of 20 questions for each L-2 category to define the scope. Then we expanded the problem set by assigning each team member to a set of L-2 questions.
| Image Source | Problem Formulation | Number | Ratio |
| Aerial Traffic Images (Shaha, 2025) | Human Annotation | 457 | 20.8% |
| Semantic Drone (ICG, 2019) | Human Annotation | 653 | 29.7% |
| AFO (Gasienica-Jozkowy et al., 2021) | Human Annotation | 18 | 0.8% |
| Visdrone (Zhu et al., 2021) | Human Annotation | 416 | 18.9% |
| Seadronesee (Varga et al., 2022) | Human Annotation | 3 | 0.1% |
| ERA (Mou et al., in press) | Human Annotation | 363 | 16.5% |
| CARLA (Dosovitskiy et al., 2017) | Simulation Script | 290 | 13.2% |
| Additional New Data Used In Case Study | |||
| CARLA (Dosovitskiy et al., 2017) | Simulation Script | 1500 | - |
| GTA V | Human Annotation | 400 | - |
3.3 Quality Control
We used a multi-stage quality control process involving both human verification and model-based filtering. We assume that humans can achieve near 100% accuracy on all questions given sufficient time. In the first stage, six independent people reviewed all questions, identifying two primary categories of problematic ones: (i) cases where it is impossible for humans to infer the correct answer due to information or context loss during image cropping from original resolution to standard input image shape, and ii) instances containing fundamental errors or unclear statement in question formulation, answer choices, or ground truth labels. All problematic samples were either carefully edited or removed from the dataset. In the second stage, we used several open-source models for an initial benchmark assessment, specifically analyzing questions where all models either uniformly failed or uniformly succeeded. For consistently incorrect responses, we conducted additional human verification to confirm the questions were properly formulated and retained those determined to be valid. Conversely, we excluded questions that all models answered correctly, as these items provided minimal discriminative value for model comparison and benchmark usefulness.
3.4 TDBench Statistics
We constructed 2000 problems in total across 10 L-2 tasks, with a total of 4100 problems including four case studies as enumerated in Table 1. To ensure a balanced and comprehensive evaluation for each ability, we try to maintain an even distribution among problems associated with different abilities during data collection, with exactly 200 samples for each L-2 category. We have 1910 questions (including case studies) from dataset collected in real world, and 2190 samples from simulation environment, with 290 problems used in questions for L-2 tasks. Note, all of the questions in ‘Object Counting’, we used the simulation data from CARLA Simulator as we can control and know the ground truth from the generation process.
4 Evaluation
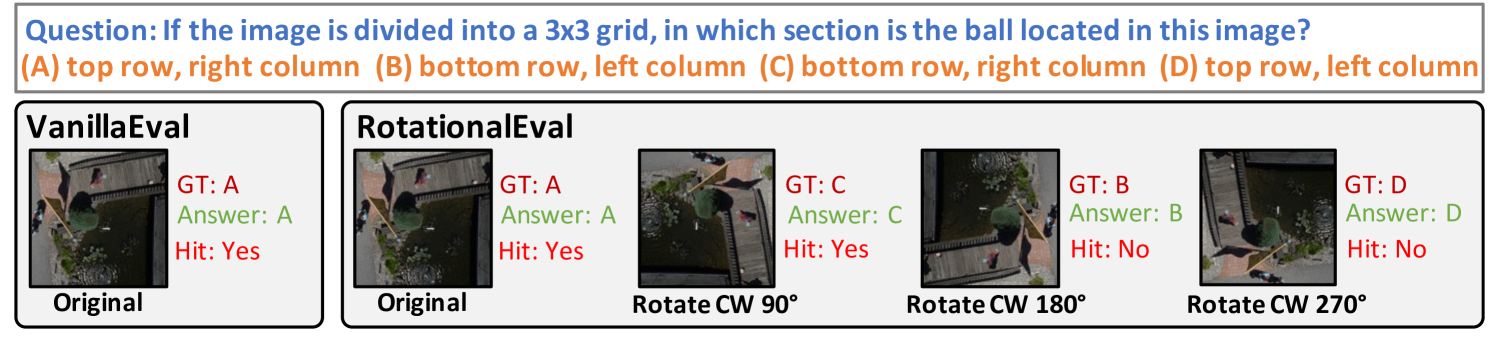
In TDBench, we introduce a novel evaluation strategy —RotationalEval (RE)—specifically designed to address the unique properties of top-down images, as illustrated in Figure 3 with an example of object localization. This approach systematically evaluates model performance on four orientations of each image: the original orientation plus , , and rotations, with the requirement that all questions must be answered correctly for the overall result to be considered correct. RE is based on on the fundamental property of aerial perspectives: their rotational invariance. Unlike conventional front-view images where orientation carries important semantic information, aerial images preserve their semantic meaning across different rotational angles—these rotations merely simulate different yaw angles during image capture without altering the underlying scene content or spatial relationships. This invariance property creates a more rigorous evaluation that would be inappropriate for front-view images, where such rotations would produce physically implausible scenes contradicting real-world visual expectations. In this work, we future investigate model performances via 4 case studies.
4.1 Integration with VLMEvalKit
TDBench is fully compatible with the VLMEvalKit (Duan et al., 2024) evaluation framework, enabling straightforward benchmark reproduction and extension. To implement our RotationalEval (RE) strategy, we generated three additional evaluation datasets from the original dataset—each corresponding to a specific rotation angle (90∘, 180∘, and 270∘). For all Multiple Choice Questions (MCQs), we utilized the default VLMEvalKit configuration settings to ensure consistency with established evaluation practices. For visual grounding tasks, we implemented a custom script using the Visual Question Answering (VQA) task type within VLMEvalKit, applying our centroid containment criterion for performance judge.
4.2 Setup
All evaluations in TDBench are conducted using the VLMEvalKit (Duan et al., 2024) framework to ensure reproducibility and facilitate fair comparison across models. In addition, we set the temperature of models to 0 for obtaining consistent and deterministic outputs during evaluations. We evaluate various models proprietary and open-source models. For a fair comparison, we adopt the zero-shot setting (without telling the context or background of the image, i.e., it is an top-down image). For all VLMs, we use GPT-4-0125 as the answer extractor. On the image side, we standardized all inputs to a fixed square shape (512512 pixels) to eliminate variance from model-specific preprocessing techniques that might affect results, such as object localization within a 33 grid partition.
To support RotationalEval (RE), we categorized questions based on their rotational properties to ensure consistent evaluation across orientations. Questions fall into two distinct categories: rotation-invariant and rotation-sensitive. Rotation-invariant questions (e.g., object presence, attribute recognition) remain semantically unchanged regardless of image orientation, requiring only image rotation while preserving identical question text and answer choices. Rotation-sensitive questions (involving directionality, spatial relationships, or localization) require both image rotation and systematic transformation of question elements to maintain semantic consistency. For example, following a 90∘ clockwise rotation, spatial references such as ”top-left” are systematically mapped to ”top-right,” with similar transformations applied to all directional descriptors.
As mentioned we standardized input images to 512512 pixels to ensure consistent evaluation conditions. For dynamic temporal tasks specifically, we maintained this standard resolution while accommodating paired images—each image pair consists of two component images with dimensions of either 256512 (for horizontal arrangement) or 512256 (for vertical arrangement), ensuring the composite image preserves the 512512 standard. To handle rotational transformations systematically, we used placeholder tokens ”img1” and ”img2” within both question text and answer choices. In the non-rotated baseline dataset, these tokens are automatically replaced with appropriate directional references—”left”/”right” for horizontally arranged image pairs and ”top”/”bottom” for vertically stacked pairs. When generating the rotated variants at 90∘, 180∘, and 270∘ orientations, these placeholder tokens undergo corresponding transformations according to rotation angle. This token replacement ensures that question semantics remain consistent with the visual orientation across all rotation conditions, maintaining evaluation correctness throughout the RotationalEval process.
| Open VLMs | VE(%) | RE(%) | (%) | Prop VLMs | VE(%) | RE(%) | (%) |
|---|---|---|---|---|---|---|---|
| InternVL2-8B | 59.3 | 41.9 | -17.4 | GPT 4o | 63.9 | 44.7 | -19.2 |
| InternVL2-4B | 56.9 | 36.2 | -20.7 | GPT 4o mini | 54.2 | 34.2 | -20.0 |
| Qwen2.5-VL-7B | 64.3 | 48.4 | -15.9 | Claude 3.5 sonnet | 61.7 | 40.8 | -20.9 |
| Qwen2.5-VL-3B | 58.0 | 37.6 | -20.4 | Claude 3.5 haiku | 54.3 | 36.3 | -18.0 |
| LIQ-7B | 55.1 | 35.6 | -19.5 | Gemini 1.5 pro | 75.5 | 57.3 | -18.2 |
| LIQ-0.5B | 40.9 | 26.7 | -14.2 | Gemini 1.5 flash | 70.5 | 53.4 | -17.1 |
4.3 Results
RotationalEval vs. VanillaEval
We first compare our RotationalEval (RE) with VanillaEval (VE) (one-pass evaluation). In Table 2, we present the results of two evaluation strategies on TDBench, showing the overall performance across all dimensions. From the table, we can see that switching from VE to RE leads to a significant drop (nearly 20% decrease) in performance for all VLMs. This is because RE reduces the chances of obtaining correct answers from random guessing. In the following evaluations, all results represent accuracy under RE unless explicitly stated otherwise.
Models
We evaluated ten open-source VLMs including LLaVA-1.5 7B (Liu et al., 2023), Llava Interleave Qwen (0.5B & 7B) (Li et al., 2024)(we will use LIQ for these models hereafter), InternVL2.5-MPO (4B & 8B) (Chen et al., 2024b), Qwen2.5-VL (3B & 7B) (Bai et al., 2025), Phi-4-multimodal (Microsoft, 2025), and DeepSeek-VL2(tiny & small) (Zhiyu Wu, 2024). And six proprietary VLMs inlcuding GPT-4o (OpenAI, 2024) & GPT-4o mini, Claude 3.5 Sonnet (Anthropic, 2024) & Haiku and Gemini 1.5 Pro % Flash (Team, 2024).
Main Results
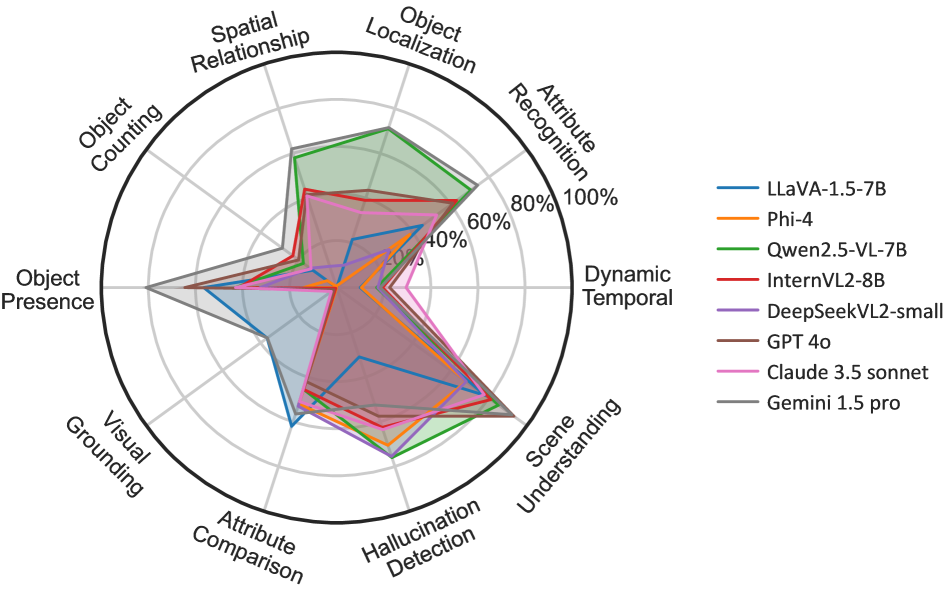
We exhaustively evaluate all VLMs on all dimension of TDBench consists of 2000 questions. In Table 3, we list all models’ L-2 performance, namely we list all models’ L-2 performance, namely Scene Understanding, Hallucination Detection, Object Presence, Object Localization, Attribute Recognition, Object Counting, Object Comparison, Spatial Relationship, Attribute Comparison, and Dynamic Temporal reasoning.
We organize models from the same family in descending order of size. Results generally follow the expected correlation between model scale and performance, with larger models consistently outperforming their smaller counterparts across most evaluation categories. However, we observe several notable exceptions to this. Most remarkably, LIQ-0.5B, despite its relatively compact size, demonstrates exceptional performance in the Attribute Comparison category, surpassing not only larger open-source alternatives but also proprietary models. Another notable finding is in the Visual Grounding task, where model performance exhibits a clear bifurcation—only LLaVA and Gemini model families demonstrate the ability to generate accurate bounding box coordinates, while all other evaluated models consistently fail to produce acceptable spatial localizations regardless of their scale or performance in other categories. This suggests that visual grounding capabilities may depend more on architectural design choices and training objectives than on model scale alone.
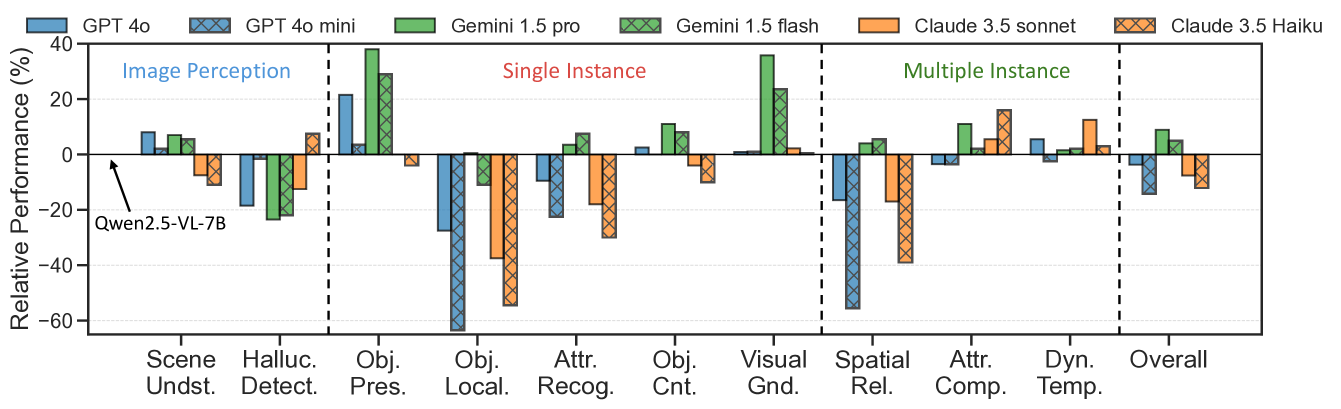
To better illustrate the difference between open-source models and proprietary models, we compared their varied performance. Using the overall best open-source model shown in Table 3, Qwen2.5-VL-7B as the reference, we calculated the performance difference between it and other proprietary VLMs as shown in Figure 4.
| Model | Image Perception | Single Instance | Multi Instance | |||||||
|---|---|---|---|---|---|---|---|---|---|---|
| Scene | Halluc. | Obj. | Obj. | Attr. | Obj. | Visual. | Spatial | Attr. | Dyn. | |
| Undst. | Detect. | Pres. | Local. | Recog. | Cnt. | Gnd. | Rel. | Comp. | Temp. | |
| Open-Source VLMs | ||||||||||
| DeepSeekVL2-small | 68.0 | 75.5 | 32.5 | 10.0 | 27.5 | 14.0 | 1.8 | 9.5 | 53.0 | 17.5 |
| DeepSeekVL2-tiny | 87.0 | 24.5 | 34.5 | 13.0 | 61.5 | 16.0 | 2.6 | 8.5 | 32.5 | 13.5 |
| InternVL2-8B | 81.0 | 62.5 | 41.5 | 39.0 | 63.0 | 23.0 | 0.5 | 44.0 | 45.5 | 19.5 |
| InternVL2-4B | 81.5 | 61.0 | 48.5 | 18.0 | 57.0 | 26.0 | 0.0 | 14.0 | 41.0 | 14.5 |
| Qwen2.5-VL-7B | 85.0 | 76.0 | 43.0 | 71.0 | 70.5 | 17.5 | 0.6 | 58.0 | 45.5 | 17.0 |
| Qwen2.5-VL-3B | 73.5 | 56.5 | 50.5 | 40.5 | 55.5 | 19.0 | 0.0 | 26.5 | 38.5 | 15.5 |
| LIQ-7B | 89.5 | 42.0 | 57.0 | 17.0 | 66.0 | 17.5 | 0.6 | 2.0 | 49.0 | 15.5 |
| LIQ-0.5B | 71.0 | 20.5 | 46.0 | 1.5 | 42.0 | 6.0 | 0.5 | 0.5 | 66.0 | 13.5 |
| LLaVA-1.5-7B | 78.0 | 31.0 | 56.5 | 21.5 | 45.0 | 12.5 | 36.5 | 0.0 | 62.0 | 10.0 |
| Phi-4 | 68.0 | 70.5 | 14.0 | 1.0 | 38.5 | 5.0 | 0.0 | 0.5 | 52.0 | 10.5 |
| Proprietary VLMs | ||||||||||
| GPT 4o | 93.0 | 57.5 | 64.5 | 43.5 | 61.0 | 20.0 | 1.5 | 41.5 | 42.0 | 22.5 |
| GPT 4o mini | 87.0 | 74.5 | 46.5 | 7.5 | 48.0 | 17.5 | 1.6 | 2.5 | 42.0 | 14.5 |
| Claude 3.5 sonnet | 51.0 | 52.5 | 29.5 | 63.5 | 13.5 | 33.5 | 2.8 | 77.5 | 41.0 | 45.0 |
| Claude 3.5 haiku | 74.0 | 83.5 | 39.0 | 16.5 | 40.5 | 7.5 | 1.1 | 19.0 | 61.5 | 20.0 |
| Gemini 1.5 pro | 92.0 | 52.5 | 81.0 | 71.5 | 74.0 | 28.5 | 36.4 | 62.0 | 56.5 | 18.5 |
| Gemini 1.5 flash | 90.5 | 54.0 | 72.0 | 60.0 | 78.0 | 25.5 | 24.1 | 63.5 | 47.5 | 19.0 |
RE vs. VE on Fine Grained Categories
In Section 2, we show the overall performance degradation under RotationalEval (RE) from VanillaEval(VE). Table 4 and Table 5 report the relative performance between RE and VE (subtracting VE from RE) in all L-2 level categories.
| Model | Image Perception | Multi Instance | |||||||||||||
|---|---|---|---|---|---|---|---|---|---|---|---|---|---|---|---|
| Scene Undst. | Halluc. Detect. | Spatial Rel. | Attr. Comp. | Dyn. Temp. | |||||||||||
| VE(%) | RE(%) | (%) | VE(%) | RE(%) | (%) | VE(%) | RE(%) | (%) | VE(%) | RE(%) | (%) | VE(%) | RE(%) | (%) | |
| Open-Source VLMs | |||||||||||||||
| DeepSeek VL2 Small | 86.5 | 68 | -18.5 | 84.5 | 75.5 | -9 | 54.5 | 9.5 | -45 | 63 | 53 | -10 | 44.5 | 17.5 | -27 |
| DeepSeek VL2 Tiny | 94 | 87 | -7 | 37.5 | 24.5 | -13 | 42 | 8.5 | -33.5 | 59 | 32.5 | -26.5 | 36 | 9 | -27 |
| InternVL 8B | 87 | 81 | -6 | 77 | 62.5 | -14.5 | 75 | 44 | -31 | 57.5 | 45.5 | -12 | 51.5 | 19.5 | -32 |
| InternVL 4B | 90 | 81.5 | -8.5 | 79 | 61 | -18 | 57 | 14 | -43 | 66.5 | 41.5 | -25 | 42.5 | 14.5 | -28 |
| Qwen 7B | 93 | 85 | -8 | 85.5 | 76 | -9.5 | 80.5 | 58 | -22.5 | 64 | 45.5 | -18.5 | 43 | 17 | -26 |
| Qwen 3B | 85 | 73.5 | -11.5 | 74 | 56.5 | -17.5 | 60.5 | 26.5 | -34 | 57 | 38.5 | -18.5 | 44.5 | 15.5 | -29 |
| LIQ 7B | 95.5 | 89.5 | -6 | 61.5 | 42 | -19.5 | 38.5 | 2 | -36.5 | 63 | 49 | -14 | 40.5 | 15.5 | -25 |
| LIQ 0.5B | 79.5 | 71 | -8.5 | 33.5 | 20.5 | -13 | 20.5 | 0.5 | -20 | 67.5 | 66 | -1.5 | 32.5 | 13.5 | -19 |
| LLaVA 7B | 89 | 78 | -11 | 49 | 31 | -18 | 34.5 | 0 | -34.5 | 67 | 62 | -5 | 37.5 | 10 | -27.5 |
| Phi4 | 82.5 | 68 | -14.5 | 80.5 | 70.5 | -10 | 23 | 0.5 | -22.5 | 61 | 52 | -9 | 38.5 | 10.5 | -28 |
| Proprietary VLMs | |||||||||||||||
| GPT-4o | 97 | 93 | -4 | 73.5 | 57.5 | -16 | 66.5 | 41.5 | -25 | 65 | 42 | -23 | 52.5 | 22.5 | -30 |
| GPT-4o Mini | 95 | 87 | -8 | 88 | 74.5 | -13.5 | 37 | 2.5 | -34.5 | 66.5 | 42 | -24.5 | 42.5 | 14.5 | -28 |
| Claude 3.5 Sonnet | 92.5 | 77.5 | -15 | 81.5 | 63.5 | -18 | 68.5 | 41 | -27.5 | 64.5 | 51 | -13.5 | 60 | 29.5 | -30.5 |
| Claude 3.5 Haiku | 89 | 74 | -15 | 91.5 | 83.5 | -8 | 49.5 | 19 | -30.5 | 67 | 61.5 | -5.5 | 39 | 20 | -19 |
| Gemini 1.5 Pro | 94.5 | 92 | -2.5 | 73 | 52.5 | -20.5 | 82.5 | 62 | -20.5 | 71 | 56.5 | -14.5 | 47 | 18.5 | -28.5 |
| Gemini 1.5 Flash | 96 | 90.5 | -5.5 | 70.5 | 54 | -16.5 | 82 | 63.5 | -18.5 | 62.5 | 47.5 | -15 | 47.5 | 19 | -28.5 |
| Model | Single Instance | ||||||||||||||
|---|---|---|---|---|---|---|---|---|---|---|---|---|---|---|---|
| Obj. Pres. | Obj. Local. | Attr. Recog. | Obj. Cnt. | Visual. Gnd. | |||||||||||
| VE(%) | RE(%) | (%) | VE(%) | RE(%) | (%) | VE(%) | RE(%) | (%) | VE(%) | RE(%) | (%) | VE(%) | RE(%) | (%) | |
| Open-Source VLMs | |||||||||||||||
| DeepseekVl2Small | 60 | 32.5 | -27.5 | 54 | 10 | -44 | 69 | 27.5 | -41.5 | 31.5 | 14 | -17.5 | 15.1 | 1.8 | -13.3 |
| DeepseekVl2Tiny | 56 | 34.5 | -21.5 | 39.5 | 13 | -26.5 | 79.5 | 61.5 | -18 | 37 | 16 | -21 | 11 | 2.6 | -8.4 |
| Internvl8B | 59.5 | 41.5 | -18 | 60.5 | 39 | -21.5 | 75 | 63 | -12 | 42 | 23 | -19 | 8 | 0.5 | -7.5 |
| Internvl4B | 62 | 48.5 | -13.5 | 48.5 | 18 | -30.5 | 74 | 57 | -17 | 42.5 | 26 | -16.5 | 7.5 | 0 | -7.5 |
| Qwen7B | 60.5 | 43 | -17.5 | 87.5 | 71 | -16.5 | 83 | 70.5 | -12.5 | 33 | 17.5 | -15.5 | 13 | 0.6 | -12.4 |
| Qwen3B | 71 | 50.5 | -20.5 | 71.5 | 40.5 | -31 | 73 | 55.5 | -17.5 | 42.5 | 19 | -23.5 | 1.5 | 0 | -1.5 |
| Liq7B | 70.5 | 57 | -13.5 | 53.5 | 17 | -36.5 | 83 | 66 | -17 | 35.5 | 17.5 | -18 | 9.5 | 0.6 | -8.9 |
| Liq0.5B | 60.5 | 46 | -14.5 | 26.5 | 1.5 | -25 | 61.5 | 42 | -19.5 | 22.5 | 6 | -16.5 | 5 | 0.5 | -4.5 |
| Llava7B | 73 | 56.5 | -16.5 | 51.5 | 21.5 | -30 | 68 | 45 | -23 | 33.5 | 12.5 | -21 | 67.5 | 36.5 | -31 |
| Phi4 | 28 | 14 | -14 | 19.5 | 1 | -18.5 | 55.5 | 38.5 | -17 | 17.5 | 5 | -12.5 | 2 | 0 | -2 |
| Proprietary VLMs | |||||||||||||||
| Gpt4O | 80.5 | 64.5 | -16 | 70 | 43.5 | -26.5 | 80 | 61 | -19 | 38.5 | 20 | -18.5 | 15.5 | 1.5 | -14 |
| Gpt4OMini | 62.5 | 46.5 | -16 | 39.5 | 7.5 | -32 | 69 | 48 | -21 | 34.5 | 17.5 | -17 | 7.5 | 1.6 | -5.9 |
| Claude3.5Sonnet | 65 | 43 | -22 | 62 | 33.5 | -28.5 | 69.5 | 52.5 | -17 | 36.5 | 13.5 | -23 | 16.5 | 2.8 | -13.7 |
| Claude3.5Haiku | 60 | 39 | -21 | 45 | 16.5 | -28.5 | 58 | 40.5 | -17.5 | 34.5 | 7.5 | -27 | 9.5 | 1.1 | -8.4 |
| Gemini1.5Pro | 89.5 | 81 | -8.5 | 88.5 | 71.5 | -17 | 88 | 74 | -14 | 52.5 | 28.5 | -24 | 69 | 36.4 | -32.6 |
| Gemini1.5Flash | 83.5 | 72 | -11.5 | 84.5 | 60 | -24.5 | 88.5 | 78 | -10.5 | 50 | 25.5 | -24.5 | 40 | 24.1 | -15.9 |

Visual Grounding
In TDBench, we employ a lenient criteria, centroid containment criterion, for visual grounding evaluation rather than the conventional Intersection over Union (IoU) metric typically used in object detection tasks. The reason is that aerial applications, such as drone navigation scenarios where precise object boundaries are less critical than accurate central positioning as waypoint. Specifically, a prediction is considered successful if the predicted object’s centroid falls within the ground truth bounding box, enabling effective target localization for hovering operations. While boundary precision is less relevant in many aerial contexts, we nevertheless present comparative performance analysis using both centroid containment and IoU thresholds in Table 6. Note that value of IoU here is obtained by the calculating the mean in 4 rotations dataset, whereas centroid performance is obtained under RE. We also show some examples of grounding results from some models in Figure 5 as reference.
| Metric |
|
|
|
|
|
|
||||||||||||
|---|---|---|---|---|---|---|---|---|---|---|---|---|---|---|---|---|---|---|
| Average IoU | 0.05 | 0.03 | 0.40 | 0.25 | 0.07 | 0.06 | ||||||||||||
| Centroid Performance (%) | 1.50 | 1.60 | 36.40 | 24.10 | 2.80 | 1.10 |
| Metric |
|
|
|
|
|
|
|
|
|
Phi4 | ||||||||||||||||||
|---|---|---|---|---|---|---|---|---|---|---|---|---|---|---|---|---|---|---|---|---|---|---|---|---|---|---|---|---|
| Average IoU | 0.09 | 0.08 | 0.06 | 0.05 | 0.35 | 0.07 | 0.02 | 0.04 | 0.02 | 0.01 | ||||||||||||||||||
| Centroid Performance (%) | 1.80 | 2.60 | 0.60 | 0.50 | 36.50 | 0.60 | 0.00 | 0.50 | 0.00 | 0.00 |
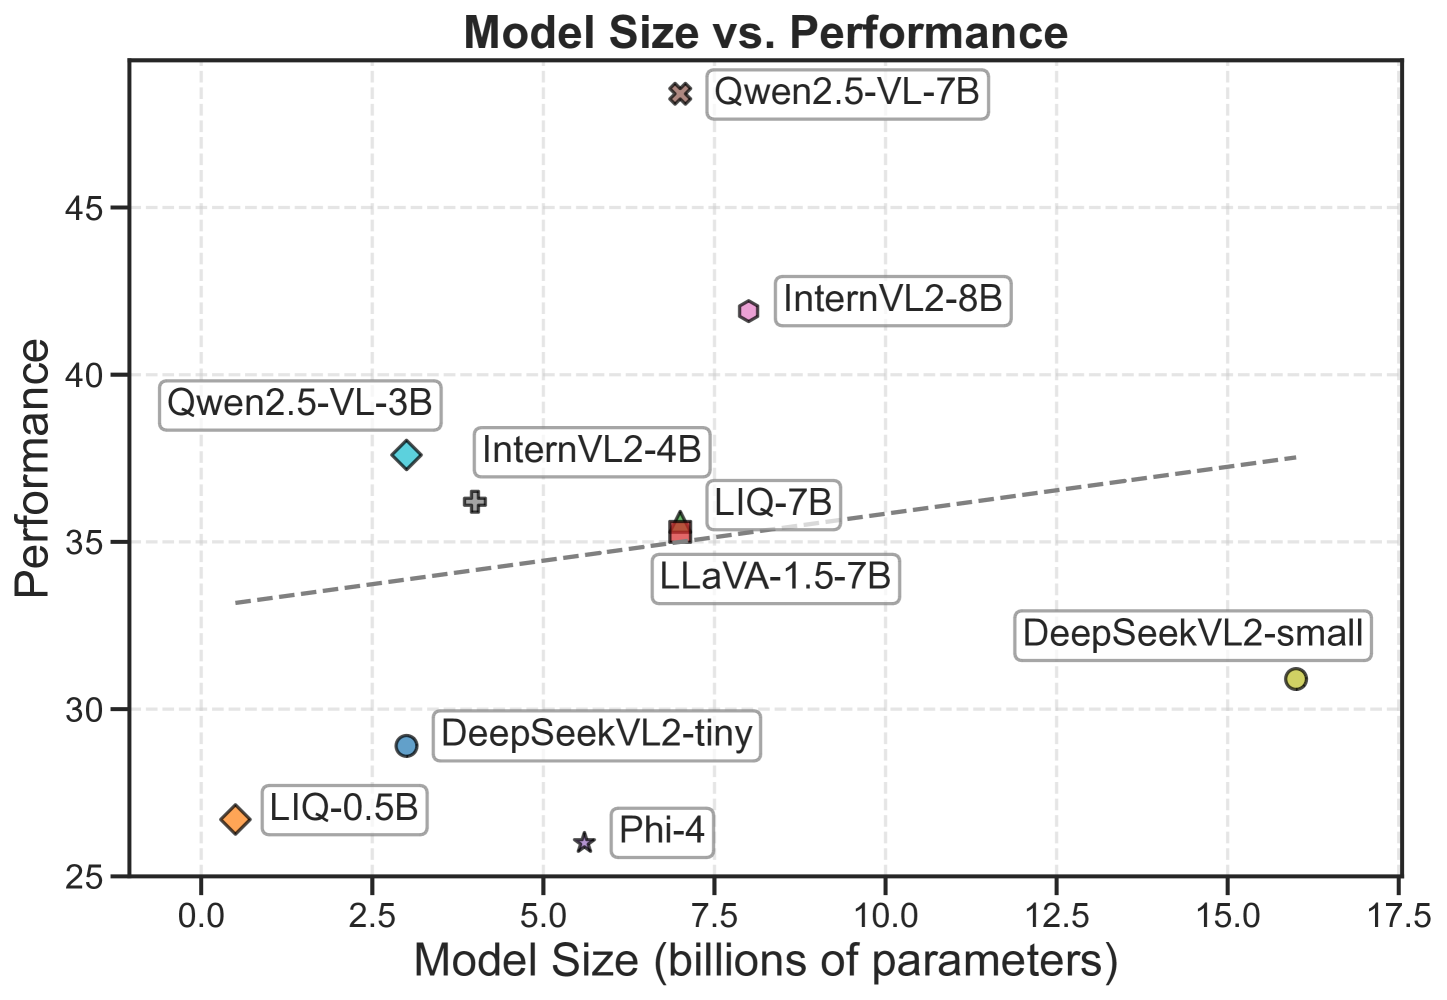
Model Scaling Trends
Figure 6 illustrates the relationship between model size, release date, and performance on TDBench. Our analysis reveals a consistent positive correlation between parameter count and performance on TDBench, with larger models generally achieving better results. Notably, release timing does not show clear performance pattern—newer models don’t consistently outperform older ones. This is likely due to limited aerial images in training datasets, or insufficient pretraining on aerial understanding tasks. While our analysis currently includes models predominantly below 16B parameters, these observations establish important baselines for future research on scaling behaviors in aerial image understanding.

5 Case Studies
Top-down images are usually captured from a relatively high altitude, which may introduce several challenges such as small object, different perspective. Furthermore, top-down images do not contain depth information in most cases, yet depth is essential for many real-world applications such as building height estimation and autonomous drone navigation and obstacle avoidance. Based on these considerations, we conduct four case studies below.
5.1 Case Study 1: Digital Magnification for Small Object Detection
Detecting small objects is challenging due to their minimal pixel coverage, which often falls below the detection capabilities of VLMs, resulting in diminished performance on fine-grained recognition tasks. To address this, we investigate a ‘digital magnification’ technique that crops images into smaller ones, which can potentially improve VLMs’ attention mechanisms by increasing the relative pixel coverage of target objects.
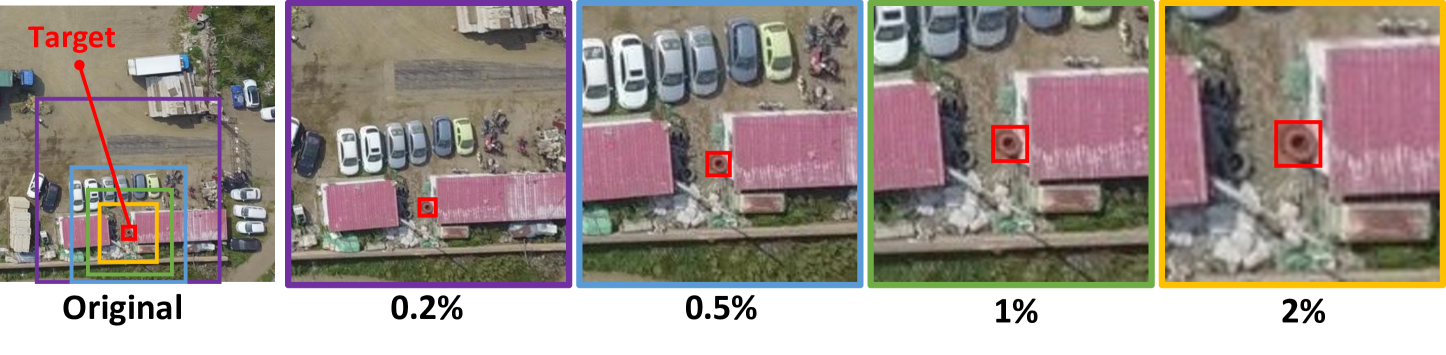
This magnification is shown in Figure 7(a) with an example of tire. We crop the image based on area ratio, the percentage of pixels the target object occupies in the resulting frame. For instance, an area ratio of 0.2% indicates that the object’s bounding box takes only 0.2% of the total pixels in the cropped image (as shown in the second panel). Higher area ratios represent greater magnification of the target object. However, we maintain the original pixel resolution without applying any super-resolution. For this case study, we selected images from questions in the object presence and object localization categories where all models demonstrated poor performance. We then create the questions for this study using the object presence template.
Figure 7(b) shows the relationship between detection accuracy and object occupancy ratio across four VLMs. All models exhibit a consistent pattern: detection accuracy rises with increased object occupancy ratio, and then decreases. GPT-4o reaches maximum performance at just 0.8% occupancy, while open-source models require higher ratios (2-4%). Performance universally degrades beyond 6% occupancy due to resolution loss and diminished contextual information. This findings provides some practical guidelines for optimal magnification levels in aerial imaging and could motivate future research for allowing VLMs to detect small objects.

5.2 Case Study 2: Altitude Effects on Object Detection
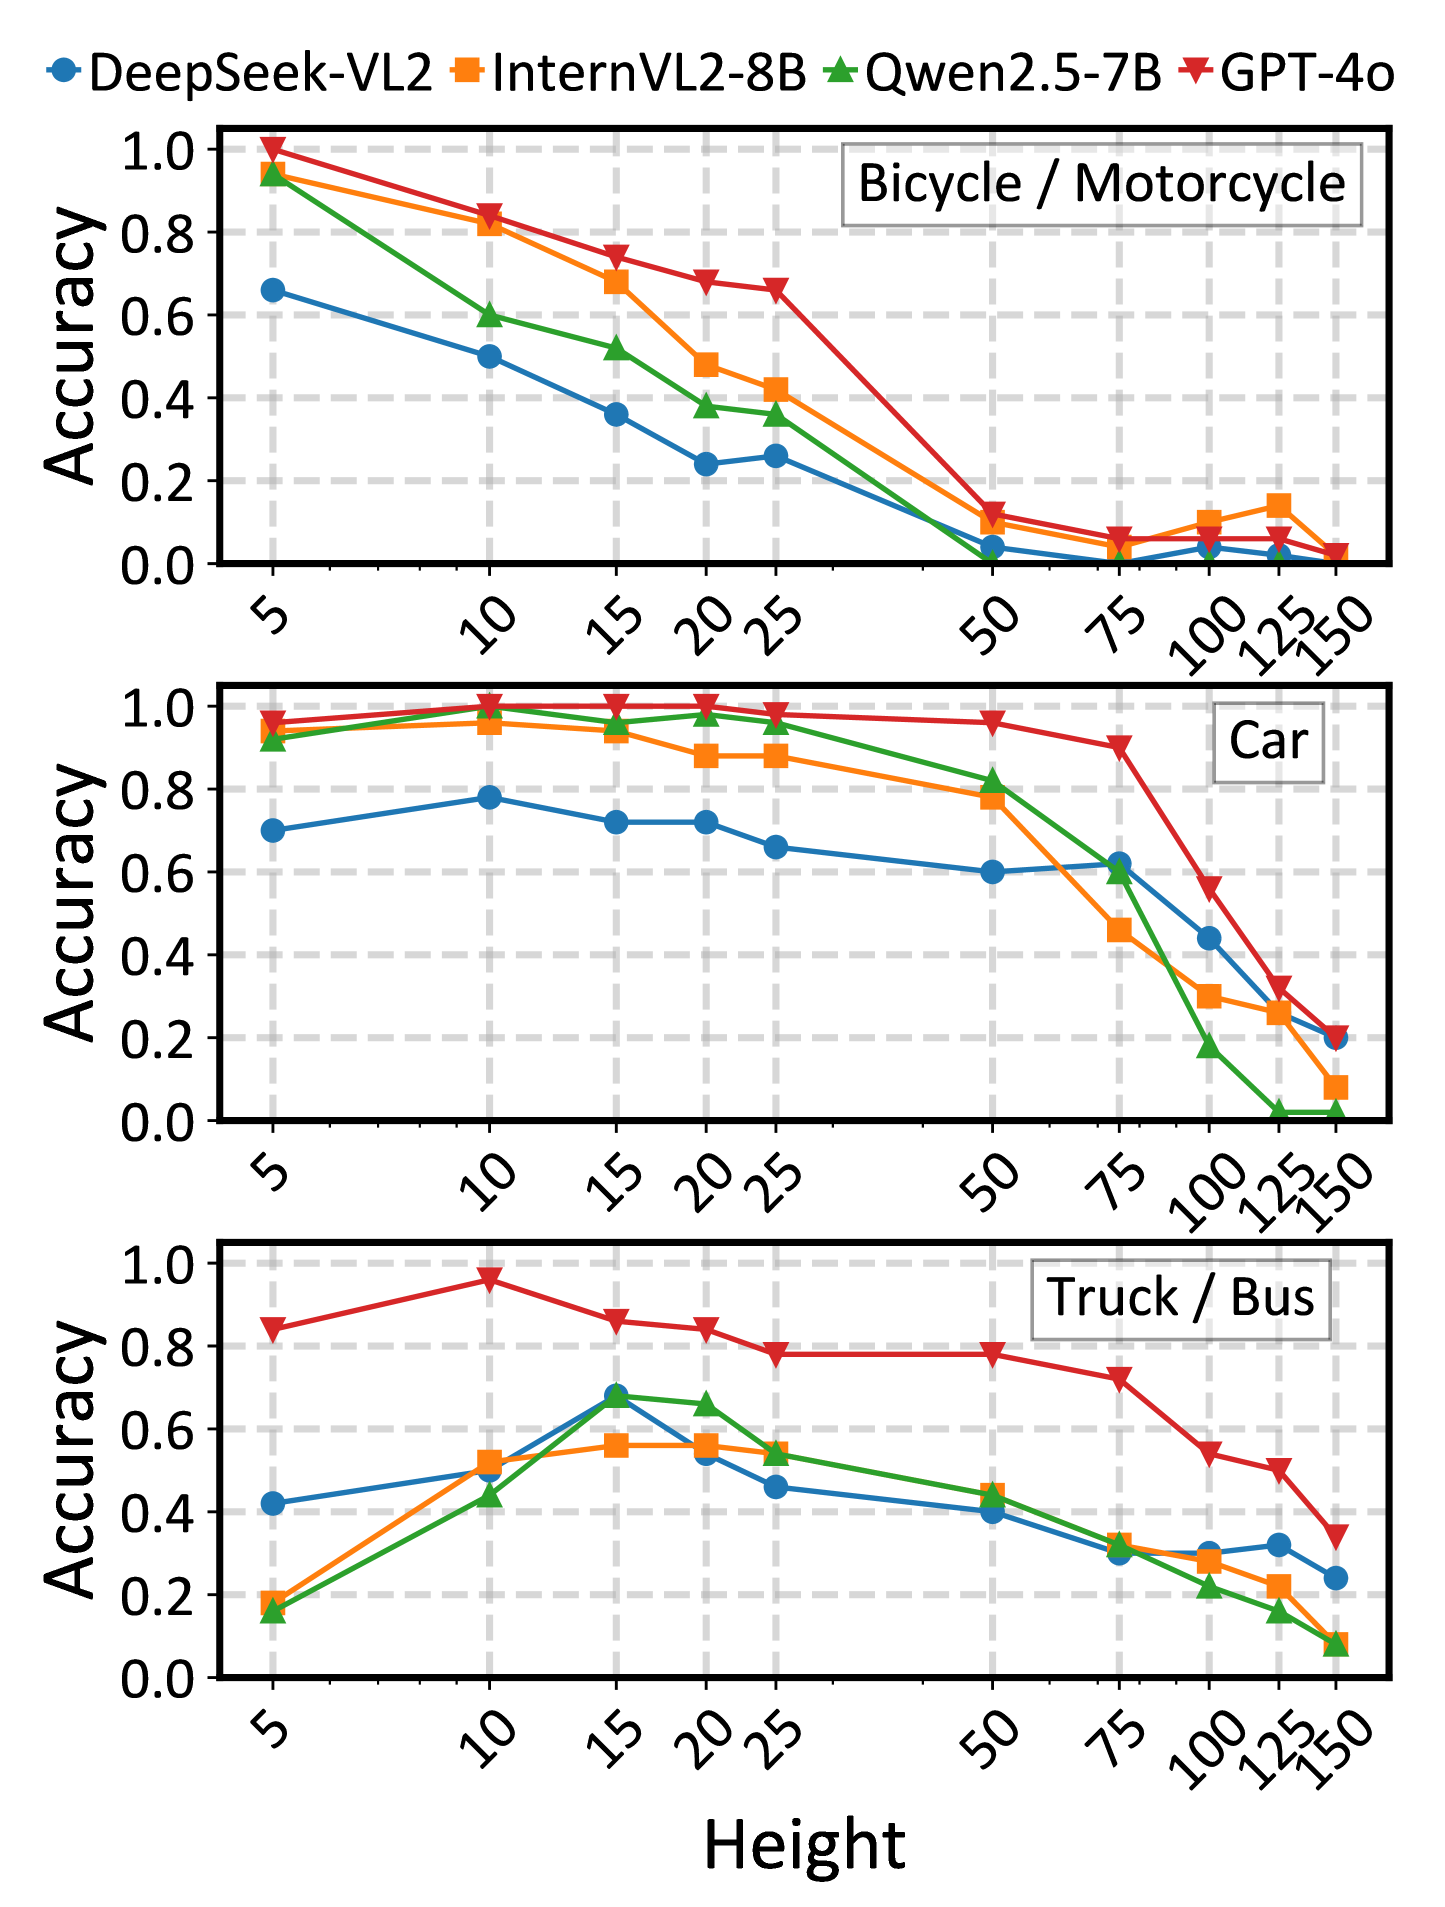
This case study investigates optimal hovering heights for drones with a fixed field of view (FOV) when performing tasks requiring consistent object detection, such as tracking criminal suspects. Unlike the digital magnification approach, we focus on physical magnification—where the drone can freely adjust its altitude to optimize detection performance. Since most existing datasets lack precise camera height metadata, we leveraged the CARLA Simulation environment, which enables simultaneous deployment of multiple cameras at different altitudes above identical scenes as shown in Figure 8(a). We consider three object categories (bicycle/motorcycle, car, and truck/bus), selected for their frequent occurrence in aerial tasks and distinct size differences. We evaluated object presence performance across altitudes ranging from 5 to 150 meters—spanning the typical operational range for commercial and tactical drones—while maintaining consistent image resolution. This approach provides practical insights for drone operation that maximize detection reliability through optimal positioning rather than post-capture image processing.
Results in Figure 8(b) show consistent trends across models: detection accuracy generally decreases with altitude. However, peak performance occurs at specific heights—5 m for bicycles/motorcycles, 10 m for cars, and 15 m for trucks/buses. We believe this is due to the varying field coverage: at lower altitudes, larger objects may be only partially visible, impairing detection, whereas smaller objects remain fully visible even at minimal heights.

5.3 Case Study 3: Object Visibility and Partial Occlusion
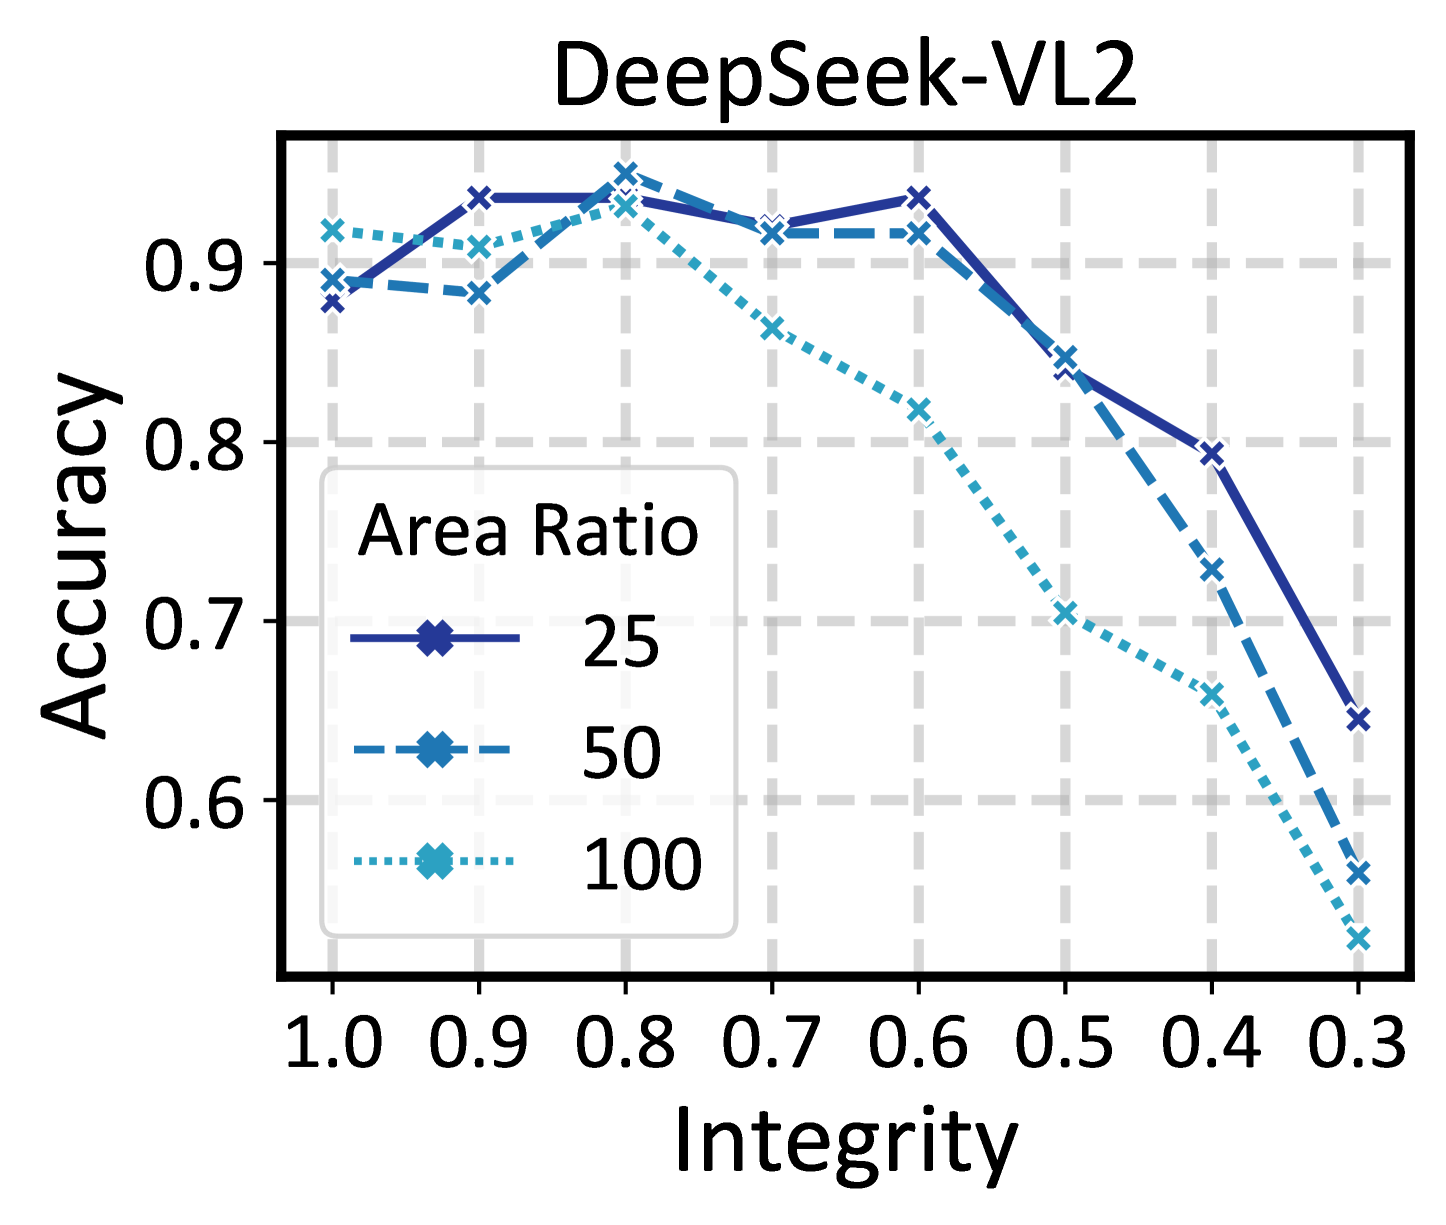
Objects may not always be fully visible in the image, such as a person sitting under a tree with only part of their body visible, or, an object of interest appearing at the image edge. In this study, we primarily focus on the latter scenario. To ensure controlled conditions, we maintained consistent ”magnification” across different visibility levels by using a fixed area ratio (AR). Given a specific AR and bounding box size, we first calculated a squared image mask with an area equal to AR times the bounding box area. We then shifted this mask over the original image to achieve specific percentages of object visibility as illustrated in Figure 9. We define this percentage of visibility as integrity. The green box in the images represents the object bounding box, and in this case the red square is 25 times (i.e., AR=25) the size of the green box. During shifting, we perform the random shift which might be up, down, left or right, in one of the directions that satisfies the visibility requirement.
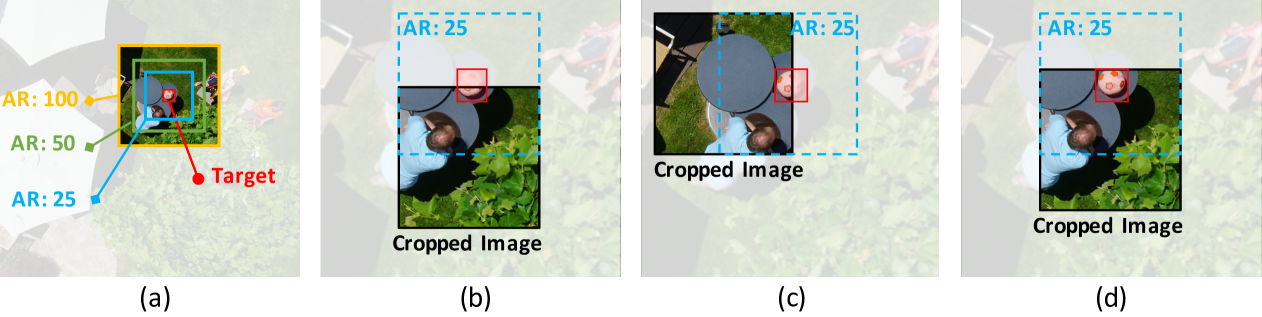
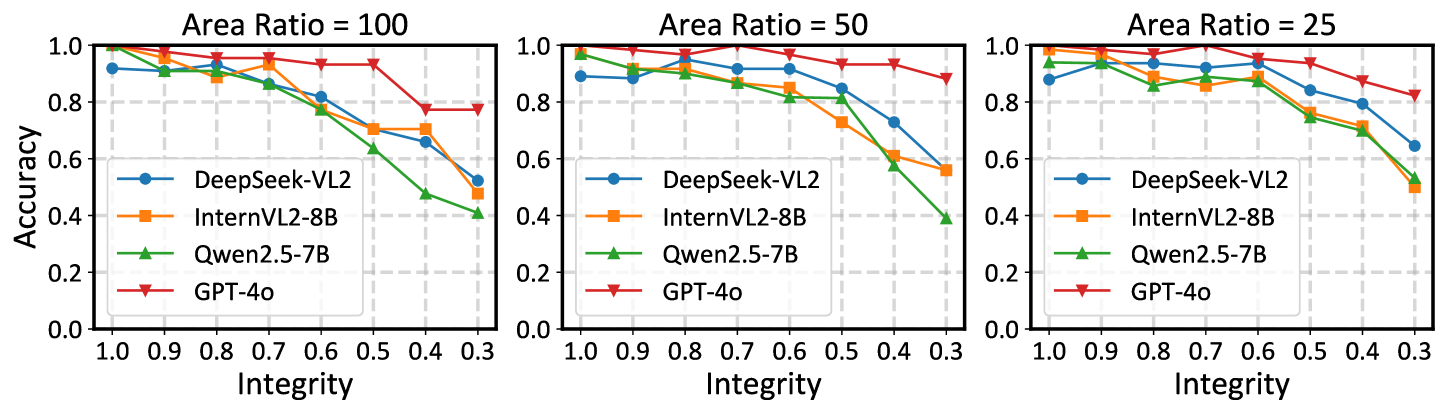
Figure 10(a) illustrates the relationship between image integrity and accuracy across different AR for four models. The horizontal axis is presented in reverse order, ranging from complete visibility (100% integrity) to significant occlusion (30% integrity). We can see that model performance remains relatively stable ( 90% accuracy) until reaching a critical threshold, beyond which accuracy rapidly deteriorates. Notably, this threshold varies with the AR—lower AR values correspond to higher integrity thresholds before performance degradation begins. For instance, with AR=100, accuracy begins to decease after integrity falls below 70%, whereas for the other two AR settings, this threshold occurs at 60% integrity. Figure 10(b) further illustrates this relationship by plotting accuracy against integrity across different AR settings.
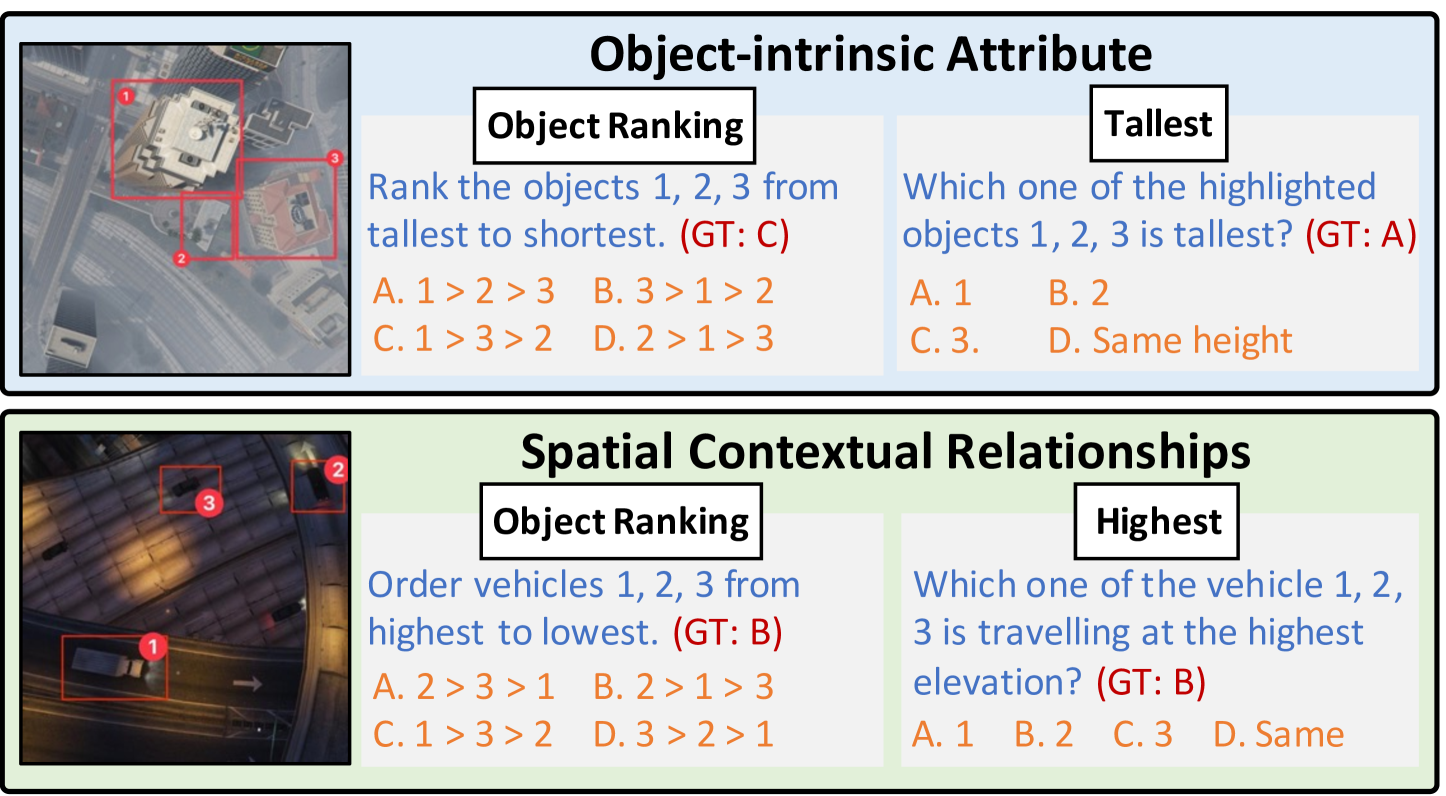
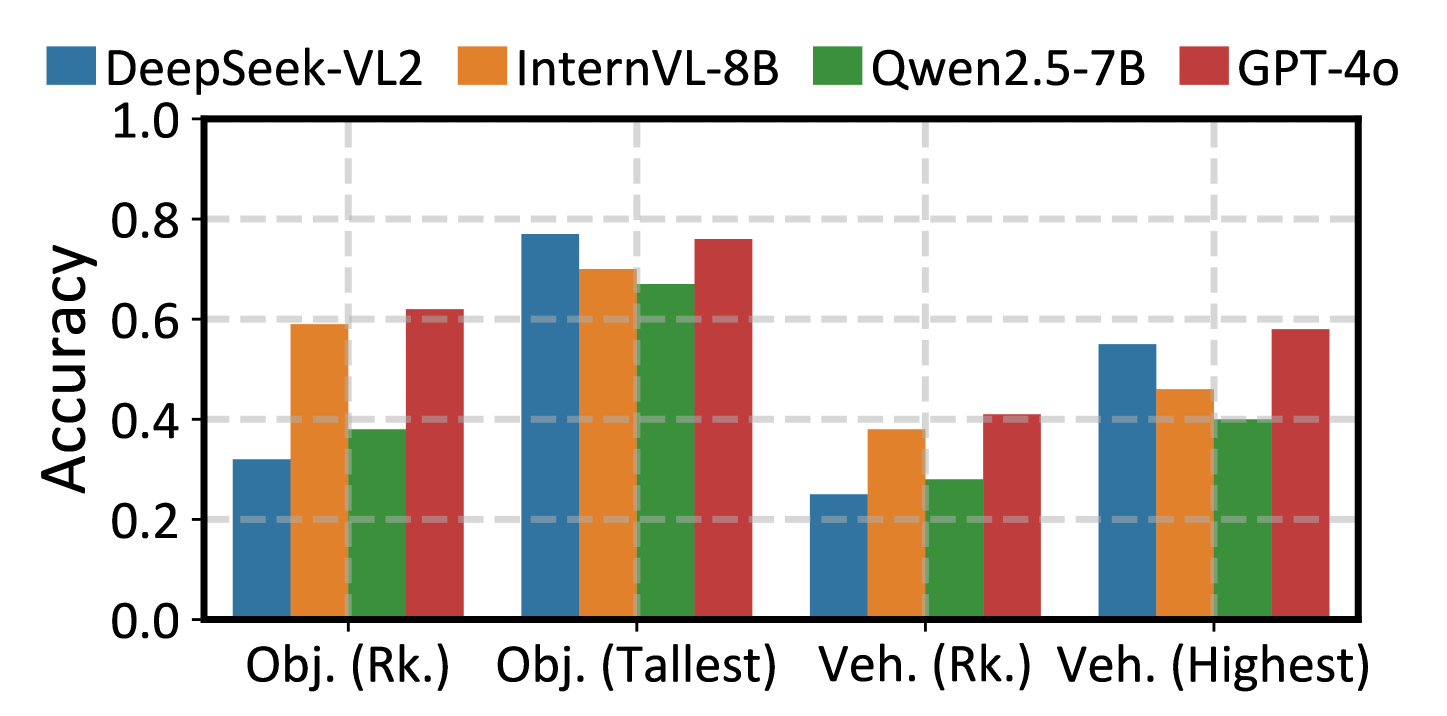
5.4 Case Study 4: Z-Axis Perception and Depth Understanding
Since top-down images preserve the xy planar information, they inevitably sacrifice the altitude information. As shown in Figure 11(a), we have defined two types of z-axis awareness challenges: assessment of an object’s own attributes or properties, such as a building’s or tree’s height, and evaluation of contextual relationships, such as determining whether a car is traveling on a road or overpass. In Figure 11(b), we can see that DeepSeek performed very well on the tallest/highest questions while suffer on the ranking problems, while GPT-4o performs (near) the best in all the cases.
6 Conclusion
In this work, we introduce TDBench, a comprehensive benchmark for objectively evaluating VLMs on top-down images, comprising over 2,000 manually labeled questions across diverse categories. To ensure robust and reliable assessment, we introduced a novel evaluation strategy-RotationalEval—that leverages the rotational invariance inherent to top-down perspectives. This more rigorous evaluation methodology that challenges models beyond standard single-pass approaches. Our multi-dimensional analysis reveals both the capabilities and limitations of current VLMs, spanning both open-source and proprietary models, with particular attention to their performance across different aerial understanding tasks. Furthermore, our four in-depth case studies provide valuable insights for real-world aerial applications while identifying future research directions for advancing VLM performance in this domain.
References
- Achiam et al. (2023) Josh Achiam, Steven Adler, Sandhini Agarwal, Lama Ahmad, Ilge Akkaya, Florencia Leoni Aleman, Diogo Almeida, Janko Altenschmidt, Sam Altman, Shyamal Anadkat, et al. Gpt-4 technical report. arXiv preprint arXiv:2303.08774, 2023.
- Agrawal et al. (2016) Aishwarya Agrawal, Jiasen Lu, Stanislaw Antol, Margaret Mitchell, C. Lawrence Zitnick, Dhruv Batra, and Devi Parikh. Vqa: Visual question answering, 2016. URL https://arxiv.org/abs/1505.00468.
- Alayrac et al. (2022) Jean-Baptiste Alayrac, Jeff Donahue, Pauline Luc, Antoine Miech, Iain Barr, Yana Hasson, Karel Lenc, Arthur Mensch, Katie Millican, Malcolm Reynolds, Roman Ring, Eliza Rutherford, Serkan Cabi, Tengda Han, Zhitao Gong, Sina Samangooei, Marianne Monteiro, Jacob Menick, Sebastian Borgeaud, Andrew Brock, Aida Nematzadeh, Sahand Sharifzadeh, Mikolaj Binkowski, Ricardo Barreira, Oriol Vinyals, Andrew Zisserman, and Karen Simonyan. Flamingo: a visual language model for few-shot learning, 2022. URL https://arxiv.org/abs/2204.14198.
- Anthropic (2024) Anthropic. Claude 3.5 sonnet, 2024. URL https://www.anthropic.com/news/claude-3-5-sonnet. Accessed: 2025-03-26.
- Bai et al. (2025) Shuai Bai, Keqin Chen, and Xuejing Liu et al. Qwen2.5-vl technical report. arXiv preprint arXiv:2502.13923, 2025.
- Chen et al. (2024a) Zhe Chen, Weiyun Wang, Yue Cao, Yangzhou Liu, Zhangwei Gao, Erfei Cui, Jinguo Zhu, Shenglong Ye, Hao Tian, Zhaoyang Liu, et al. Expanding performance boundaries of open-source multimodal models with model, data, and test-time scaling. arXiv preprint arXiv:2412.05271, 2024a.
- Chen et al. (2024b) Zhe Chen, Jiannan Wu, Wenhai Wang, Weijie Su, Guo Chen, Sen Xing, Muyan Zhong, Qinglong Zhang, Xizhou Zhu, Lewei Lu, et al. Internvl: Scaling up vision foundation models and aligning for generic visual-linguistic tasks. In Proceedings of the IEEE/CVF Conference on Computer Vision and Pattern Recognition, pp. 24185–24198, 2024b.
- Dosovitskiy et al. (2017) Alexey Dosovitskiy, German Ros, Felipe Codevilla, Antonio Lopez, and Vladlen Koltun. CARLA: An open urban driving simulator. In Proceedings of the 1st Annual Conference on Robot Learning, pp. 1–16, 2017.
- Dosovitskiy et al. (2021) Alexey Dosovitskiy, Lucas Beyer, Alexander Kolesnikov, Dirk Weissenborn, Xiaohua Zhai, Thomas Unterthiner, Mostafa Dehghani, Matthias Minderer, Georg Heigold, Sylvain Gelly, Jakob Uszkoreit, and Neil Houlsby. An image is worth 16x16 words: Transformers for image recognition at scale, 2021. URL https://arxiv.org/abs/2010.11929.
- Duan et al. (2024) Haodong Duan, Junming Yang, Yuxuan Qiao, Xinyu Fang, Lin Chen, Yuan Liu, Xiaoyi Dong, Yuhang Zang, Pan Zhang, Jiaqi Wang, et al. Vlmevalkit: An open-source toolkit for evaluating large multi-modality models. In Proceedings of the 32nd ACM International Conference on Multimedia, pp. 11198–11201, 2024.
- Fu et al. (2024) Chaoyou Fu, Peixian Chen, Yunhang Shen, Yulei Qin, Mengdan Zhang, Xu Lin, Jinrui Yang, Xiawu Zheng, Ke Li, Xing Sun, Yunsheng Wu, and Rongrong Ji. Mme: A comprehensive evaluation benchmark for multimodal large language models, 2024. URL https://arxiv.org/abs/2306.13394.
- Gasienica-Jozkowy et al. (2021) Jan Gasienica-Jozkowy, Mateusz Knapik, and Boguslaw Cyganek. An ensemble deep learning method with optimized weights for drone-based water rescue and surveillance. Integrated Computer-Aided Engineering, 28(1):1–15, 01 2021. doi: 10.3233/ICA-210649.
- Guo et al. (2025) Daya Guo, Dejian Yang, Haowei Zhang, Junxiao Song, Ruoyu Zhang, Runxin Xu, Qihao Zhu, Shirong Ma, Peiyi Wang, Xiao Bi, et al. Deepseek-r1: Incentivizing reasoning capability in llms via reinforcement learning. arXiv preprint arXiv:2501.12948, 2025.
- Hu et al. (2023) Yuan Hu, Jianlong Yuan, Congcong Wen, Xiaonan Lu, and Xiang Li. Rsgpt: A remote sensing vision language model and benchmark, 2023. URL https://arxiv.org/abs/2307.15266.
- ICG (2019) ICG. Semantic segmentation drone dataset, 2019. URL http://dronedataset.icg.tugraz.at/.
- Jia et al. (2021) Chao Jia, Yinfei Yang, Ye Xia, Yi-Ting Chen, Zarana Parekh, Hieu Pham, Quoc V. Le, Yunhsuan Sung, Zhen Li, and Tom Duerig. Scaling up visual and vision-language representation learning with noisy text supervision, 2021. URL https://arxiv.org/abs/2102.05918.
- Kim et al. (2024) Moo Jin Kim, Karl Pertsch, Siddharth Karamcheti, Ted Xiao, Ashwin Balakrishna, Suraj Nair, Rafael Rafailov, Ethan Foster, Grace Lam, Pannag Sanketi, Quan Vuong, Thomas Kollar, Benjamin Burchfiel, Russ Tedrake, Dorsa Sadigh, Sergey Levine, Percy Liang, and Chelsea Finn. Openvla: An open-source vision-language-action model. arXiv preprint arXiv:2406.09246, 2024.
- Kuckreja et al. (2023) Kartik Kuckreja, Muhammad Sohail Danish, Muzammal Naseer, Abhijit Das, Salman Khan, and Fahad Shahbaz Khan. Geochat: Grounded large vision-language model for remote sensing, 2023. URL https://arxiv.org/abs/2311.15826.
- Lan & Chen (2024) Yu-Ju Lan and Nian-Shing Chen. Teachers’ agency in the era of llm and generative ai. Educational Technology & Society, 27(1):I–XVIII, 2024.
- Li et al. (2024) Feng Li, Renrui Zhang, Hao Zhang, Yuanhan Zhang, Bo Li, Wei Li, Zejun Ma, and Chunyuan Li. Llava-next-interleave: Tackling multi-image, video, and 3d in large multimodal models. arXiv preprint arXiv:2407.07895, 2024.
- Li et al. (2021) Junnan Li, Ramprasaath R. Selvaraju, Akhilesh Deepak Gotmare, Shafiq Joty, Caiming Xiong, and Steven Hoi. Align before fuse: Vision and language representation learning with momentum distillation, 2021. URL https://arxiv.org/abs/2107.07651.
- Li et al. (2022) Junnan Li, Dongxu Li, Caiming Xiong, and Steven Hoi. Blip: Bootstrapping language-image pre-training for unified vision-language understanding and generation, 2022. URL https://arxiv.org/abs/2201.12086.
- Lin et al. (2015) Tsung-Yi Lin, Michael Maire, Serge Belongie, Lubomir Bourdev, Ross Girshick, James Hays, Pietro Perona, Deva Ramanan, C. Lawrence Zitnick, and Piotr Dollár. Microsoft coco: Common objects in context, 2015. URL https://arxiv.org/abs/1405.0312.
- Liu et al. (2023) Haotian Liu, Chunyuan Li, Qingyang Wu, and Yong Jae Lee. Visual instruction tuning. In NeurIPS, 2023.
- Liu et al. (2024) Yuan Liu, Haodong Duan, Yuanhan Zhang, Bo Li, Songyang Zhang, Wangbo Zhao, Yike Yuan, Jiaqi Wang, Conghui He, Ziwei Liu, Kai Chen, and Dahua Lin. Mmbench: Is your multi-modal model an all-around player?, 2024. URL https://arxiv.org/abs/2307.06281.
- Lobry et al. (2020) Sylvain Lobry, Diego Marcos, Jesse Murray, and Devis Tuia. Rsvqa: Visual question answering for remote sensing data. IEEE Transactions on Geoscience and Remote Sensing, 58(12):8555–8566, December 2020. ISSN 1558-0644. doi: 10.1109/tgrs.2020.2988782. URL http://dx.doi.org/10.1109/TGRS.2020.2988782.
- Lu et al. (2024) Pan Lu, Hritik Bansal, Tony Xia, Jiacheng Liu, Chunyuan Li, Hannaneh Hajishirzi, Hao Cheng, Kai-Wei Chang, Michel Galley, and Jianfeng Gao. Mathvista: Evaluating mathematical reasoning of foundation models in visual contexts, 2024. URL https://arxiv.org/abs/2310.02255.
- Microsoft (2025) Microsoft. Phi-4-mini technical report: Compact yet powerful multimodal language models via mixture-of-loras, 2025. URL https://arxiv.org/abs/2503.01743.
- Mou et al. (in press) L. Mou, Y. Hua, P. Jin, and X. X. Zhu. ERA: A dataset and deep learning benchmark for event recognition in aerial videos. IEEE Geoscience and Remote Sensing Magazine, in press.
- Muhtar et al. (2024) Dilxat Muhtar, Zhenshi Li, Feng Gu, Xueliang Zhang, and Pengfeng Xiao. Lhrs-bot: Empowering remote sensing with vgi-enhanced large multimodal language model, 2024. URL https://arxiv.org/abs/2402.02544.
- OpenAI (2024) OpenAI. Gpt-4 technical report, 2024. URL https://arxiv.org/abs/2303.08774.
- O’Shea & Nash (2015) Keiron O’Shea and Ryan Nash. An introduction to convolutional neural networks, 2015. URL https://arxiv.org/abs/1511.08458.
- Radford et al. (2021) Alec Radford, Jong Wook Kim, Chris Hallacy, Aditya Ramesh, Gabriel Goh, Sandhini Agarwal, Girish Sastry, Amanda Askell, Pamela Mishkin, Jack Clark, Gretchen Krueger, and Ilya Sutskever. Learning transferable visual models from natural language supervision, 2021. URL https://arxiv.org/abs/2103.00020.
- Russakovsky et al. (2015) Olga Russakovsky, Jia Deng, Hao Su, Jonathan Krause, Sanjeev Satheesh, Sean Ma, Zhiheng Huang, Andrej Karpathy, Aditya Khosla, Michael Bernstein, Alexander C. Berg, and Li Fei-Fei. Imagenet large scale visual recognition challenge, 2015. URL https://arxiv.org/abs/1409.0575.
- Schuhmann et al. (2022) Christoph Schuhmann, Romain Beaumont, Richard Vencu, Cade Gordon, Ross Wightman, Mehdi Cherti, Theo Coombes, Aarush Katta, Clayton Mullis, Mitchell Wortsman, Patrick Schramowski, Srivatsa Kundurthy, Katherine Crowson, Ludwig Schmidt, Robert Kaczmarczyk, and Jenia Jitsev. Laion-5b: An open large-scale dataset for training next generation image-text models, 2022. URL https://arxiv.org/abs/2210.08402.
- Shaha (2025) Shaha. Aerial traffic images. https://universe.roboflow.com/cg-0fmsf/shaha-adfy7, 2025. Accessed: 2025-03-26.
- Team (2024) Gemini Team. Gemini 1.5: Unlocking multimodal understanding across millions of tokens of context, 2024. URL https://arxiv.org/abs/2403.05530.
- Touvron et al. (2023) Hugo Touvron, Thibaut Lavril, Gautier Izacard, Xavier Martinet, Marie-Anne Lachaux, Timothée Lacroix, Baptiste Rozière, Naman Goyal, Eric Hambro, Faisal Azhar, et al. Llama: Open and efficient foundation language models. arXiv preprint arXiv:2302.13971, 2023.
- Varga et al. (2022) Leon Amadeus Varga, Benjamin Kiefer, Martin Messmer, and Andreas Zell. Seadronessee: A maritime benchmark for detecting humans in open water. In Proceedings of the IEEE/CVF Winter Conference on Applications of Computer Vision, pp. 2260–2270, 2022.
- Xu et al. (2024) Huatao Xu, Liying Han, Qirui Yang, Mo Li, and Mani Srivastava. Penetrative ai: Making llms comprehend the physical world. In Proceedings of the 25th International Workshop on Mobile Computing Systems and Applications, pp. 1–7, 2024.
- Yang et al. (2025) Bufang Yang, Yunqi Guo, Lilin Xu, Zhenyu Yan, Hongkai Chen, Guoliang Xing, and Xiaofan Jiang. Socialmind: Llm-based proactive ar social assistive system with human-like perception for in-situ live interactions. Proceedings of the ACM on Interactive, Mobile, Wearable and Ubiquitous Technologies, 9(1):1–30, 2025.
- Ying et al. (2024) Kaining Ying, Fanqing Meng, Jin Wang, Zhiqian Li, Han Lin, Yue Yang, Hao Zhang, Wenbo Zhang, Yuqi Lin, Shuo Liu, Jiayi Lei, Quanfeng Lu, Runjian Chen, Peng Xu, Renrui Zhang, Haozhe Zhang, Peng Gao, Yali Wang, Yu Qiao, Ping Luo, Kaipeng Zhang, and Wenqi Shao. Mmt-bench: A comprehensive multimodal benchmark for evaluating large vision-language models towards multitask agi, 2024. URL https://arxiv.org/abs/2404.16006.
- Yu et al. (2024) Weihao Yu, Zhengyuan Yang, Linjie Li, Jianfeng Wang, Kevin Lin, Zicheng Liu, Xinchao Wang, and Lijuan Wang. Mm-vet: Evaluating large multimodal models for integrated capabilities, 2024. URL https://arxiv.org/abs/2308.02490.
- Yue et al. (2024) Xiang Yue, Yuansheng Ni, Kai Zhang, Tianyu Zheng, Ruoqi Liu, Ge Zhang, Samuel Stevens, Dongfu Jiang, Weiming Ren, Yuxuan Sun, Cong Wei, Botao Yu, Ruibin Yuan, Renliang Sun, Ming Yin, Boyuan Zheng, Zhenzhu Yang, Yibo Liu, Wenhao Huang, Huan Sun, Yu Su, and Wenhu Chen. Mmmu: A massive multi-discipline multimodal understanding and reasoning benchmark for expert agi, 2024. URL https://arxiv.org/abs/2311.16502.
- Zhiyu Wu (2024) Zizheng Pan et al Zhiyu Wu, Xiaokang Chen. Deepseek-vl2: Mixture-of-experts vision-language models for advanced multimodal understanding, 2024. URL https://arxiv.org/abs/2412.10302.
- Zhu et al. (2021) Pengfei Zhu, Longyin Wen, Dawei Du, Xiao Bian, Heng Fan, Qinghua Hu, and Haibin Ling. Detection and tracking meet drones challenge. IEEE Transactions on Pattern Analysis and Machine Intelligence, 44(11):7380–7399, 2021.