11email: edrigga@noa.gr 22institutetext: Sector of Astrophysics, Astronomy & Mechanics, Department of Physics, Aristotle University of Thessaloniki, Thessaloniki 54124, Greece 33institutetext: Université Paris-Saclay, Université Paris Cité, CEA, CNRS, AIM, 91191, Gif-sur-Yvette, France 44institutetext: National Astronomical Observatory of Japan, 2-21-1 Osawa, Mitaka, Tokyo 181-8588, Japan 55institutetext: Academia Sinica Institute of Astronomy and Astrophysics, 11F of Astronomy-Mathematics Building, AS/NTU, No.1, Section 4, Roosevelt Road, Taipei 10617, Taiwan 66institutetext: Research centre for Space and Cosmic Evolution, Ehime University, 2-5 Bunkyo-cho, Matsuyama, Ehime 790-8577, Japan 77institutetext: Astronomical Institute, Tohoku University, Aramaki, Aoba-ku, Sendai, Miyagi 980-8578, Japan 88institutetext: Università di Bologna, Dip. di Fisica e Astronomia “A. Righi”, Via P. Gobetti 93/2, 40129 Bologna, Italy 99institutetext: INAF – Osservatorio di Astrofisica e Scienza dello Spazio di Bologna, Via Gobetti 93/3, 40129 Bologna, Italy 1010institutetext: Department of Astronomy, University of Geneva, ch. d’Écogia 16, CH-1290 Versoix, Switzerland 1111institutetext: National Observatory of Athens, 18100 Thessio, Athens, Greece 1212institutetext: CERIDES, centre of Excellence in Risk & Decision Sciences, European University of Cyprus, Cyprus
XXL-HSC: Host properties of X-ray detected AGNs in XXL clusters
Abstract
Context. There is compelling evidence that AGNs are strongly influenced by their environment, from their host galaxies to immense structures such as galaxy clusters. Therefore, studying the AGN population of clusters is essential, as both large-scale structures and AGN play key roles in galaxy evolution, though the interactions between these elements are still not well understood.
Aims. The primary objective of this study is to unravel the different factors that may significantly affect the triggering of AGN activity in cluster galaxies, including galaxy merging and interactions with other galaxies, and ram pressure from the hot intracluster medium.
Methods. For our purposes, we have used 82 X-ray detected AGN found within a radius of 164 X-ray detected and spectroscopically confirmed galaxy clusters in the northern 25 deg2 field of the XXL survey, up to a redshift of 1. This field is also covered by deep optical observations of the Hyper Suprime-Cam, mounted on the 8m Telescope, which allows for a reliable morphological classification of galaxies. We thoroughly investigated the morphology of X-ray AGN host galaxies, using both Statmorph software and visual inspection, in an attempt to discover disturbances as indications of interactions that could lead to AGN triggering. Furthermore, using the X-ray hardness ratio, the optical spectra and the spectral energy distributions (SEDs) of the X-ray sources, we have studied the obscuration and other AGN properties, as well as the star formation rate (SFR) of the hosts as further indicators of interactions.
Results. We found a moderately significant, at the confidence level, higher fraction of X-ray AGN in galaxy clusters hosted by merging or disturbed galaxies, compared to non-active cluster galaxies or X-ray AGN in the field. This excess is primarily localised in the cluster outskirts (between 1 and 2). Also, we discovered a higher number of X-ray-hard (hence, possibly obscured) AGN in clusters than in the field, at the confidence level, particularly in the outskirts. These findings further support the idea that galaxy mergers and interactions may serve as mechanisms for the triggering and obscuration of AGN activity.
Conclusions. The relatively high number of disturbed, merging, and possibly obscured AGN hosts in cluster outskirts suggests that galaxy merging and interactions are key drivers in triggering AGN activity in these outer regions of clusters.
Key Words.:
X-ray AGN – galaxy clusters – morphological properties1 Introduction
Supermassive black holes (SMBHs) are at the forefront of modern astrophysical research today not only because they are hosted by every massive galaxy in the local Universe, but also because the evolution of the SMBH and its host galaxy appears tightly linked (e.g. Gültekin et al., 2009; Zubovas & King, 2012). All SMBHs are thought to undergo active phases, the so-called active galactic nucleus (AGN) phases, during which they accrete the surrounding gas and emit an immense amount of energy. Theoretical models and simulations have proposed that during this active phase, the active nucleus produces a feedback wind that can explain the co-evolution of the SMBH and its host galaxy (e.g. Schawinski et al., 2009; Cen & Chisari, 2011). Therefore, the study of AGNs is essential for understanding the cosmic history of accretion into SMBH and their relation to the host galaxy.
One specific research direction for investigating the cosmic history of AGN evolution is studying AGN as a function of their environment. Several studies have provided evidence that AGN are affected by both their immediate surroundings (e.g. Maiolino et al., 1997; Dultzin-Hacyan et al., 1999; Sorrentino et al., 2006; González et al., 2008; Silverman et al., 2008; Dultzin et al., 2008; Koulouridis et al., 2006a, b, 2013; Manzer & De Robertis, 2014; Silva et al., 2021; Duplancic et al., 2021; Pierce et al., 2023; Li et al., 2023) and by their large-scale environment (e.g. Constantin et al., 2008; Stroe et al., 2020; Ceccarelli et al., 2022; Hashiguchi et al., 2023; Muñoz Rodr´ıguez et al., 2023; Koulouridis et al., 2016b, 2024; Toba et al., 2024; de Vos et al., 2024). In addition, early studies reported overdensities of X-ray point-sources in clusters with respect to the field (Cappi et al., 2001; Molnar et al., 2002; D’Elia et al., 2004; Branchesi et al., 2007; Gilmour et al., 2009), and others have spectroscopically verified the existence of a large population of AGN in clusters and argued on their probable evolution with redshift (e.g. Martini et al., 2002; Johnson et al., 2003; Martini et al., 2007, 2009). Therefore, it is crucial to thoroughly investigate the AGN population of galaxy clusters, as both the immense structure and the powerful nucleus seem to play an important role in galaxy evolution.
However, the interplay among the immense cluster and the powerful nucleus is still not well understood. This uncertainty arises from the various physical mechanisms that may influence galaxies and SMBHs within clusters. Numerous studies have demonstrated that the AGN fraction in member galaxies of massive clusters () is lower than the respective fraction in field galaxies (e.g. Kauffmann et al., 2004; Gavazzi et al., 2011; Ehlert et al., 2013, 2014; Mishra & Dai, 2020; Beyoro-Amado et al., 2021). This is likely caused by ram pressure stripping (RPS). In more detail, galaxies within the dense intracluster medium (ICM) of clusters are subjected to intense pressure, leading to the efficient ram pressure stripping of their gas. This reduces the availability of cold gas necessary for fueling AGN, resulting in a diminished cold gas reservoir required to trigger nuclear activity (e.g. Gunn & Gott, 1972; Cowie & Songaila, 1977; Giovanelli & Haynes, 1985; Popesso & Biviano, 2006; Chung et al., 2009; Haines et al., 2012; Sabater et al., 2013; Jaffé et al., 2015; Poggianti et al., 2017a). The impact of RPS is expected to be proportional to the cluster’s mass and inversely proportional to the galaxy’s mass (e.g. Boselli et al., 2022). In support of these expectations, studies on poor clusters and groups reported that AGN activity in group galaxies is at least as frequent as in the field (Sabater et al., 2012; Koulouridis et al., 2014, 2018, hereafter XXL Paper XXXV). However, Bufanda et al. (2017) did not detect differences in the fraction of X-ray luminous AGN ( erg sec-1) between groups and clusters for 432 clusters from the Dark Energy Survey (DES) up to . We note that Poggianti et al. (2017a) proposed that RPS might also act as a triggering mechanism for AGN activity in cluster members. Furthermore, the so-called jellyfish galaxies (Chung et al., 2009; Bekki, 2009; Poggianti et al., 2017a), which are conspicuously affected by RPS, were found to host a significantly higher number of AGN than similar field galaxies (Peluso et al., 2022). Finally, many studies have revealed a positive evolution of the AGN fraction in cluster galaxies with redshift (e.g. Kocevski et al., 2009; Fassbender et al., 2012; Martini et al., 2013; Bufanda et al., 2017; Hashiguchi et al., 2023), while low-mass protoclusters at higher redshifts may potentially contain a higher number of AGN (Lehmer et al., 2013; Krishnan et al., 2017; Gatica et al., 2024; Vito et al., 2024).
Contrary to the suppression of AGN observed in the centre of massive clusters, an increase has been found in the outskirts of the cluster (e.g. Johnson et al., 2003; Branchesi et al., 2007; Koulouridis et al., 2014). However, the results vary depending on the different selection of clusters and AGN samples. In particular, Ruderman & Ebeling (2005) discovered a mild excess of X-ray sources between 1.5 and 3 Mpc in massive clusters that span the redshift range of z. However, the excess was found only in dynamically relaxed clusters, while no excess was found in the outskirts of disturbed clusters. These findings were confirmed more recently in the optical band by Stroe & Sobral (2021), in a sample of 14 clusters () that span a wide range of masses and dynamical states. They found that the H-detected AGN fraction peaks in the outskirts of relaxed clusters ( Mpc). In addition, XXL Paper XXXV revealed a significant overdensity of spectroscopically confirmed X-ray AGN in the outskirts of low-mass clusters (111The cluster mass refers to the total mass of a galaxy cluster within a spherical region where the average density is 500 times the critical density of the universe at the cluster’s redshift. The corresponding radius, , is the radius at which this density contrast is reached. and ) from the XXL Survey Adami et al. (2018, hereafter (XXL Paper XX)), while no excess was confirmed for higher cluster masses. At higher redshifts, a similar excess of X-ray AGN was also reported by Fassbender et al. (2012) between 4 and 6 arcmin from the centres of 22 massive clusters (). Koulouridis & Bartalucci (2019) confirmed a highly significant excess, at the 99.9% confidence level, of X-ray point-like sources in the outskirts () of the five most massive, , and distant, z1, galaxy clusters in the Planck and South Pole Telescope (SPT) surveys. Very recently, Koulouridis et al. (2024) reported a significant excess of X-ray AGN in the outskirts of relaxed clusters, compared both to non-relaxed clusters and to the field. Furthermore, a similar excess in cluster outskirts () was also recently found in the Magneticum simulations (Rihtaršič et al., 2024). Nevertheless, some studies have found that AGN have no special position inside galaxy clusters (Gilmour et al., 2009; Ehlert et al., 2015, e.g.), unless only the most powerful optical AGNs are considered. In addition, Muñoz Rodr´ıguez et al. (2023) demonstrated that the observed excess of X-ray sources in the outskirts of massive clusters () at might be caused by projection effects.
The increase reported by various works may be attributed to a corresponding increase in the galaxy merging rate, which is favoured by the lower galaxy velocities in the outskirts compared to the centre, as well as low-mass groups () when compared to massive clusters (e.g. Ehlert et al., 2015; Lopes et al., 2017; Gordon et al., 2018). During a merger, the involved galaxies experience tidal forces that can lead to the redistribution of their stellar and gaseous components, triggering star formation and potentially fueling AGN. Generally, merging represents a significant process in the hierarchical formation and evolution of galaxies. As galaxies traverse the dense environments of clusters, gravitational interactions and dynamical friction facilitate their coalescence. In addition, notably in the outskirts of clusters, galaxies experience less intense ICM pressure, preserving their cold gas supplies and thus maintaining the conditions favourable for AGN activity. Furthermore, nuclear activity in the outskirts may be triggered by interactions between the host galaxy and the cluster itself during passage through virial shocks (e.g. Keshet & Reiss, 2018).
Another possibility, which explains the excess of AGN in the outskirts of clusters, is that AGN enter the cluster environment along with infalling small groups. Galaxies typically do not enter clusters as isolated entities. Instead, they often enter as part of smaller groups that offer a more favourable environment for AGN triggering, namely, they are pre-processed. Preprocessed indicates that these galaxies have already experienced significant interactions and evolution before entering the cluster (e.g. Fujita, 2004; Haines et al., 2015; Sengupta et al., 2022; Łokas, 2023). However, Koulouridis et al. (2024) found no evidence that the the prevalence of X-ray AGN in clusters is affected by the presence of X-ray-detected infalling groups, or that their location is correlated with the positions of these infalling groups.
In summary, the environmental dichotomy between the cluster centre and the outskirts results in a spatial variation of AGN activity. However, the physical mechanisms that trigger nuclear activity in cluster galaxies are still debated, since the AGN frequency appears to be affected by multiple factors. In this context, we have studied the morphology of cluster galaxies hosting X-ray-detected AGN up to a redshift of . They are located out to a distance of radii from the centres of X-ray detected clusters in the northern 25 deg2 XXL survey field, which is also covered by deep Hyper Suprime-Cam (HSC) optical observations. Our aim is to investigate the role of galaxy merging and interactions in the triggering of AGN activity. In addition, we have studied the obscuration and the accretion power of the AGN, as well as the star formation rate (SFR) of the hosts, as further indicators of the physical mechanisms that drive their triggering and evolution.
The outline of this paper is as follows. In Sect. 2 we discuss the data preparation and sample selection. The methodology is described in 3, and the results are presented in Sect. 4. Our discussion and conclusions are presented in Sect. 5, and a summary is provided in Sect. 6. Throughout this paper we assume a Planck cosmology Planck Collaboration et al. (2016) of H h km s-1 Mpc-1, , and .
2 Sample selection
In this section, we describe the surveys and the data used to study the properties of X-ray AGN in galaxy clusters of the XMM-XXL northern field. We used the latest X-ray catalogue from the XXL survey along with deep HSC imaging. Additionally, we exploited all available spectroscopic and photometric data from a multitude of surveys, to study the spectral properties and the spectral energy distributions (SEDs) of our sources.
2.1 XMM-XXL survey
The XXL survey (Pierre et al., 2016) is the largest XMM-Newton programme to date totaling Msec. It covers two extragalactic fields of about 25 deg2 each, XXL-North (XXL-N) and XXL-South (XXL-S), at a point-source sensitivity of ergs-1 cm-2 in the [0.5-2] keV band (completeness limit). The main goals of the survey are to provide constraints on the dark energy equation of state from the space-time distribution of clusters of galaxies and to serve as a pathfinder for future, wide-area X-ray missions. In the current work, we have used the latest XXL v4.3 catalogue. The cluster selection criteria are described in (Pacaud et al., 2006) and the 365 cluster catalogue is presented in XXL Paper XX. The creation of the XMM-XXL X-ray point-source catalogue, along with the optical counterpart matching and associated multi-wavelength data, is described in Chiappetti et al. (2018), also known as XXL Paper XXVII. However, in this work we used the more recent internal release of the catalogue obtained with the V4.2 XXL pipeline that contains in total 15547 X-ray sources.
Spectroscopic redshifts in XXL-N were obtained with large spectroscopic surveys, such as SDSS, VIPERS (Guzzo et al., 2014), and GAMA (Liske et al., 2015), and from a large campaign with the AAOmega spectrograph mounted on the Anglo-Australian Telescope described in Lidman et al. (2016), also known as XXL Paper XIV. Other smaller-scale spectroscopic observations (e.g. Koulouridis et al., 2016b) complement the sample. The photometric redshifts used are described in Fotopoulou et al. (2016), also known as XXL Paper VI.
2.2 Hyper Suprime-Cam (HSC)
The HSC (Miyazaki et al., 2018) is a 1.77 deg2 imaging camera with a pixel scale of 0.168 arcsec mounted at the prime focus of the 8.2m Subaru Telescope. It is composed of 116 charge-coupled devices (CCDs; 104 for science, four for the auto guider, and eight for focus monitoring). This facility is operated by the National Astronomical Observatory of Japan on the summit of Maunakea (Hawaii, USA). The HSC Subaru Strategic Program (HSC-SSP; (Aihara et al., 2018)) is a three-layered survey (wide, deep, and ultradeep) of 1400 deg2 in five different bands (grizy) and four narrow filters. For our purposes, we used imaging and photometric data from the deep HSC survey, which covers most of the northern XMM-XXL survey, reaching a depth of .
2.3 X-ray detected AGN in XXL clusters
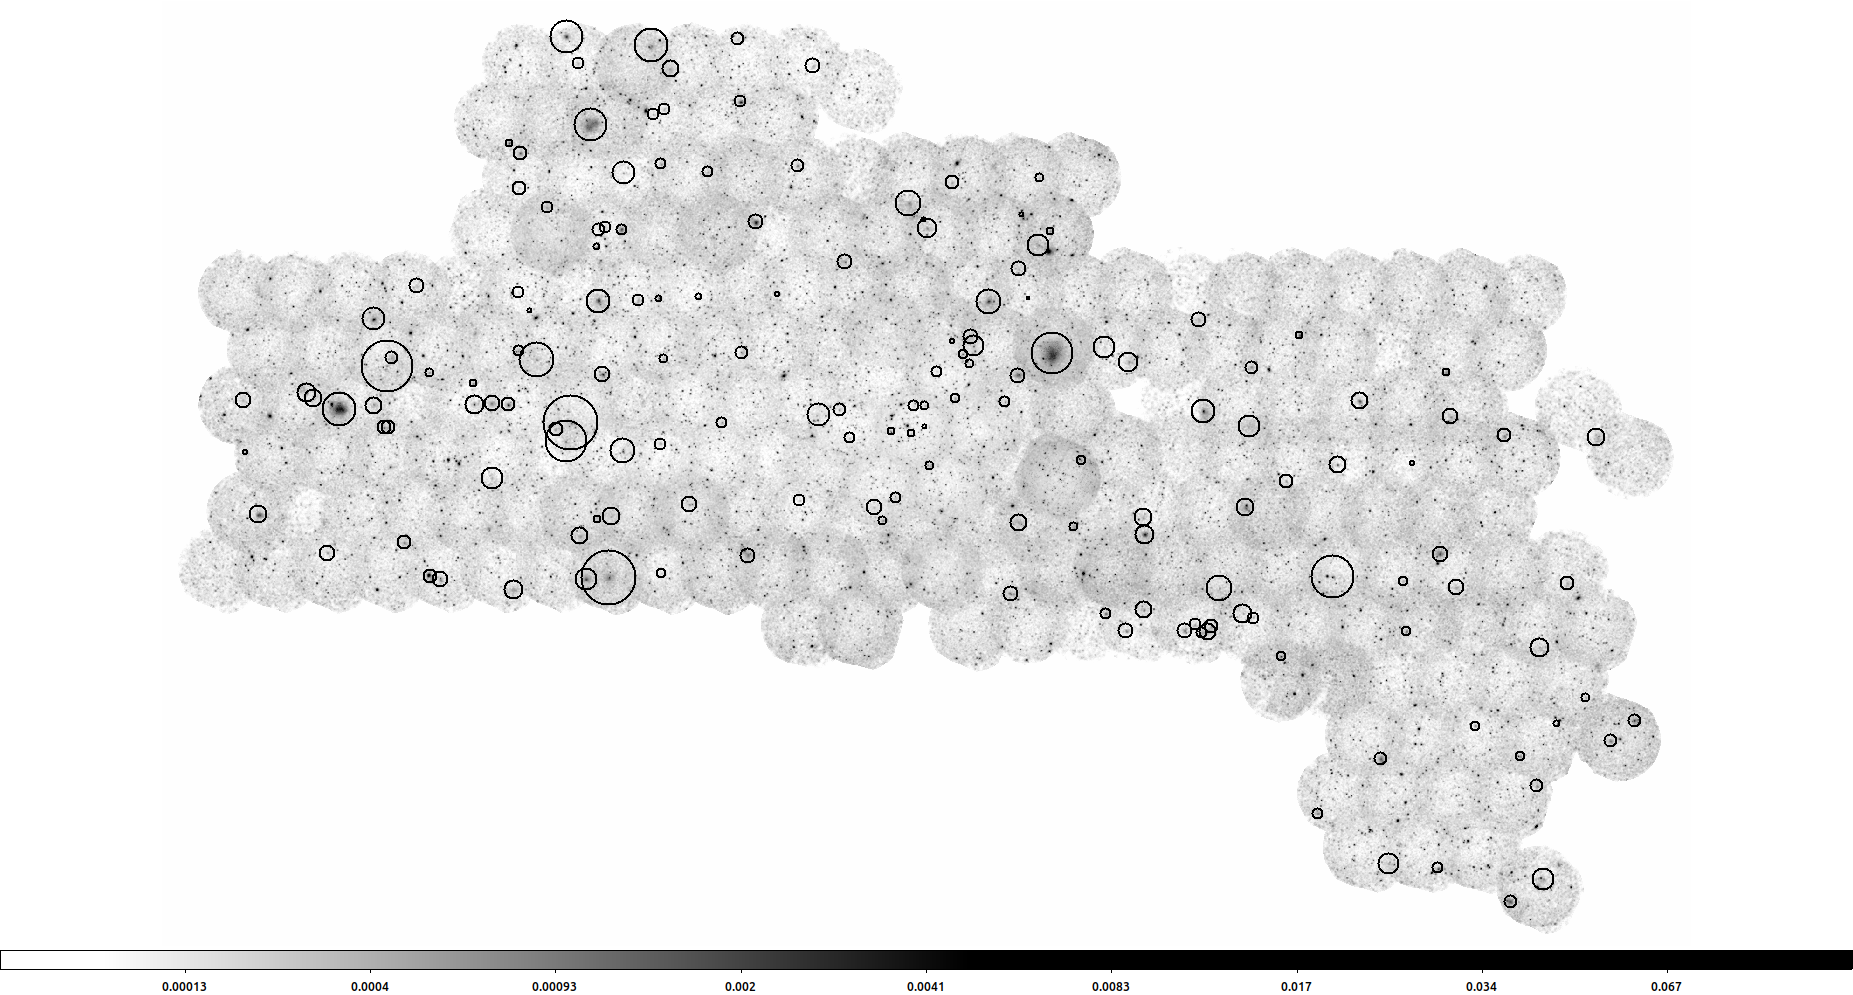
Our aim was to combine X-ray data from the XXL survey with HSC imaging to perform a reliable visual inspection of the X-ray AGN host galaxies up to a high redshift (). The HSC footprint covers only the northern XXL field, therefore our sample comprises 164 clusters. The frequency of AGN activity in most of these clusters, up to redshift , was studied thoroughly in XXL Paper XXXV. We initially selected all point-like X-ray sources within a projected cluster-centric distance of 4. We used the values when available, from Table 5 in XXL Paper XX, derived after a spectral fit of the X-ray observations. In the case where a spectral fit was not possible, we used the values derived from scaling relations ( XXL Paper XX, Table F.1). The XXL-N field and the location of the 164 X-ray detected clusters are presented in Fig. 1.
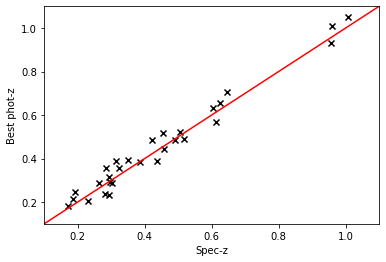
Subsequently, only sources above a luminosity threshold of erg s-1 at the redshift of each cluster were kept in the sample. This luminosity threshold indicates that X-ray emission from point-like sources is most likely due to an AGN rather than other sources such as X-ray binaries or star formation. Finally, only galaxies with concordant spectroscopic or photometric redshift with the redshift of the clusters were kept in the sample. In more detail, in case of available spectroscopic redshifts (50% of our sample), we require the line-of-sight (los) relative velocity to the average cluster redshift, , to be less than 2000 km/sec. When only a photometric redshift is available, the relative los distance should not exceed , where is the average cluster redshift. This threshold allows the selection of the sources with the most reliable photometric redshifts ( XXL Paper VI, see figure 2), while it excludes catastrophic outliers. Furthermore, if the source was outside the 68% confidence interval of the photometric redshift probability distribution (PDZ) around the median value, or if this interval was larger than 0.5, the source was excluded from our analysis. The latter criterion ensures that sources with flat PDZs, and therefore unreliable redshift estimation, are excluded from the analysis. In Fig. 2 we plot the spectroscopic vs. photometric redshifts for the sources that would have been included in our sample even if the spectroscopic redshift was not available. While our stringent criteria verify the purity of our sample, some true X-ray AGN that belong to the clusters inevitably will be missed.
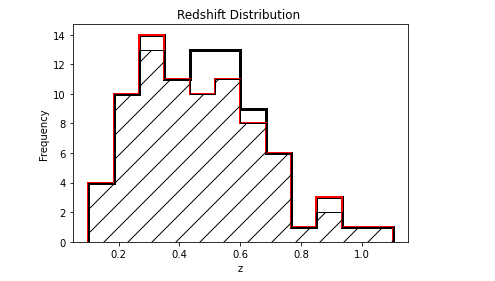
The final selected main sample comprises 82 X-ray AGN up to 4 radii from the centres of the clusters. Moreover, we assembled four control samples to enable a thorough comparative analysis: (i) 1987 field X-ray-detected AGN in XXL-N and (ii) 1914 cluster galaxies selected based on their spectroscopic redshift within 4 radii of our 164 clusters. From these two control samples, we extracted two smaller sub-samples of (iii) 166 field X-ray AGN and (iv) 208 cluster galaxies respectively, in order to visually inspect their morphology and optical spectra. Control samples (i) and (iii) for field X-ray AGN are formulated to mirror the main sample in terms of both redshift and X-ray luminosity distribution. Control samples (ii) and (vi) for cluster galaxies are designed to emulate the main sample in terms of redshift and stellar mass distribution. A summary of the samples is presented in Table 1, while the redshift distributions of the main sample and the two small subsamples (iii) and (iv) are presented in Fig. 3.
| Sample | description | size |
|---|---|---|
| (1) | (2) | (3) |
| Main | cluster X-ray AGN | 82 |
| control (i) | field X-ray AGN | 1987 |
| control (ii) | cluster galaxies | 1914 |
| control (iii) | field X-ray AGN | 166 |
| control (iv) | cluster galaxies | 208 |
3 Methodology
In this section we describe the methodology we followed to treat our data. In order to examine in detail the properties of X-ray AGN in clusters, we divided the circum-cluster area into four concentric annuli centred on the X-ray peak of the diffuse emission. We selected each annulus to have a width of radius. Employing any radius is crucial when studying the impact of the cluster environment on AGN and their host galaxies, as it provides a direct link to the physical conditions at each galaxy’s location (Koulouridis & Bartalucci, 2019). We can assume that similar conditions prevail within the specific annulus of other clusters, regardless of the actual physical or projected distance. The radius is also useful for direct comparison with previous results as it is used extensively in the literature. Then, we stacked the number counts of X-ray AGN found in each respective annuli of all clusters. We consider the first annulus to be the centre of the cluster, while the second annulus the cluster outskirts. The motivation to use these specific boundaries comes from the fact that the radius of 2 roughly coincides with the virial radius and the splash-back radius333The splash-back radius of a galaxy cluster is the boundary that marks the outer edge of its gravitational influence, where the accreted matter reaches its farthest point after falling into the cluster for the first time.. Therefore, we can assume that galaxies within this radius are bound to the cluster potential, while outside they are not yet influenced by any effect of the dense cluster environment. Nevertheless, for any comparison with the field in the current work we have used independent control samples of X-ray AGN (see Sect. 2.3). We note that within an area roughly encompassing the inner half of the radius, therefore 25% of the total area of the central annulus, the high X-ray background caused by the diffuse ICM emission may hinder the detection of low-luminosity point-like sources (e.g., Bhargava et al., 2023).
3.1 Morphological analysis of X-ray AGN host galaxies
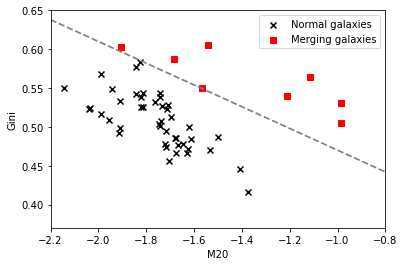
Our goal is to investigate whether merging is more frequent in X-ray AGN hosts within clusters than in the field or when compared to inactive cluster galaxies. To this end, we used HSC imaging and photometry in order to examine and determine the morphology and the immediate environment of all galaxies in our samples. Specifically, we were investigating for signatures of mergers, or interactions with neighbouring galaxies. To find merging systems in all samples, we used Statmorph (Rodriguez-Gomez et al., 2019). This code is designed for measuring the morphological properties of galaxies, especially for the non-parametric morphological indicators. In this work, we employed Gini coefficient and diagnostics to select mergers (Lotz et al., 2004). The Gini coefficient evaluates the bias of the light distribution in a galaxy, where larger values indicate a more concentrated light distribution. On the other hand, assesses the distribution of the brightest twenty percent of the galaxy’s light, where higher values suggest more extended bright regions. To find the merging systems, we applied the Gini- classification to the HSC -band image (see Yanagawa et al. in prep. for a full description of merger classification for HSC sources with Statmorph). In particular, we classified as mergers all galaxies that fall above the line that divides merging and non-merging systems (Lotz et al., 2008; Rodriguez-Gomez et al., 2019):
| (1) |
Sources that were flagged as having a problem with basic measurements for various reasons (Rodriguez-Gomez et al., 2019, see section 4) were discarded from the above analysis as undefined (U). In Fig. 4 we plot the positions of the X-ray AGN host galaxies on the Gini- diagram and the dividing line.
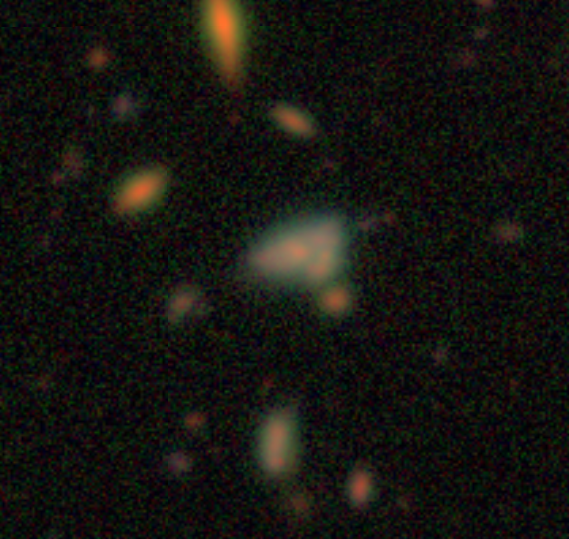
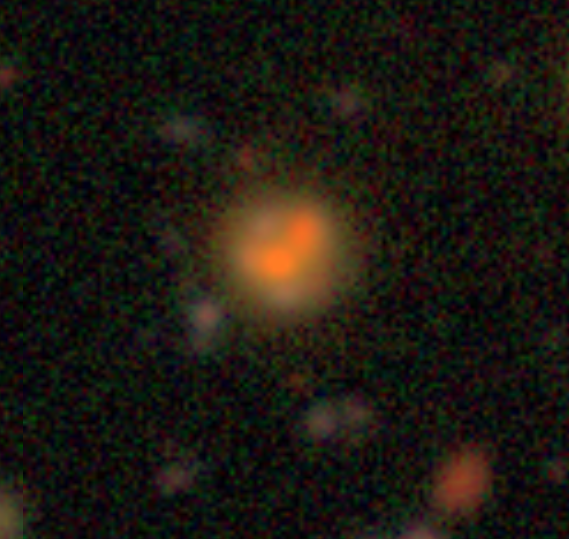
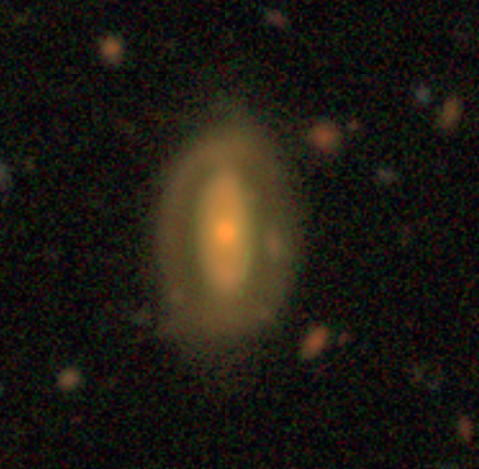
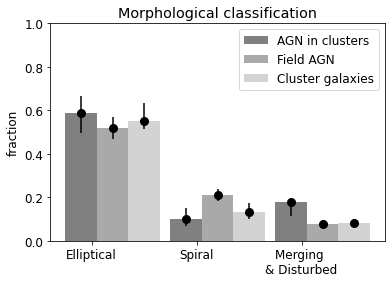
Additionally, for the main sample of 82 X-ray AGN and for the two small control subsamples (iii) and (iv) we performed a visual examination of all HSC images and classified the AGN host galaxies as merging or disturbed (M), Ellipticals (E), Spirals (S) and Undefined (U). In more detail, we classified galaxies as disturbed (D) if they showed clear signs of disturbed morphology, the presence of tidal tails, or noticeable substructures. In addition, mergers should exhibit two visibly separate cores. We note that a few galaxies classified as ”U” by Statmorph due to poorly masked secondary sources were recovered as merging systems when the redshifts of the two cores were also taken into account. Conversely, cases of projection that were incorrectly identified as mergers were excluded. Thus, while the results of Statmorph and visual classification are not identical, they give consistent statistical results. Visually small galaxies or bright QSOs are classified as undefined. However, only two cases among the 82 X-ray AGN in the main sample exhibit such powerful QSO activity that it obstructs the morphological classification of their host galaxies. Three examples of X-ray AGN merging or disturbed hosts can be found in Fig. 5. A mosaic of the full sample of the 82 X-ray-detected AGN in clusters can be found in Table LABEL:fig:mosaic1.
3.2 Multi-wavelength properties
3.2.1 Optical spectra analysis
Active Galactic Nuclei can be classified into two main types, broad-line (BL) and narrow-line (NL) AGN, according to the width of Balmer emission lines in their optical spectrum. In more detail, in AGN models a torus of gas and dust surrounds the central SMBH, obscuring the nucleus from certain viewing angles. Narrow-line AGN are believed to be obscured by the torus, which blocks the direct radiation from the central AGN region so that the broad components of the Balmer lines cannot be detected. However, many studies suggest that below a specific accretion rate of material into the black hole the broad-line region (BLR) might be absent (Nicastro, 2000; Nicastro et al., 2003; Bian & Gu, 2007; Elitzur & Ho, 2009; Bianchi et al., 2012, 2017; Elitzur et al., 2014; Elitzur & Netzer, 2016; Koulouridis, 2014; Koulouridis et al., 2016a). Therefore, some of the low-luminosity sources of our sample might be ”true” narrow-line AGN, intrisically lacking the BLR. In particular, almost 25% of our sources satisfy the criteria of accretion rate and luminosity described in Marinucci et al. (2012); Koulouridis et al. (2016a) that would classify them as potentially lacking the BLR. Furthermore, additional obscuration or dilution, caused by the host galaxy, might affect the AGN classification, regardless of the inclination of the torus (e.g. Lagos et al., 2011; Gkini et al., 2021)
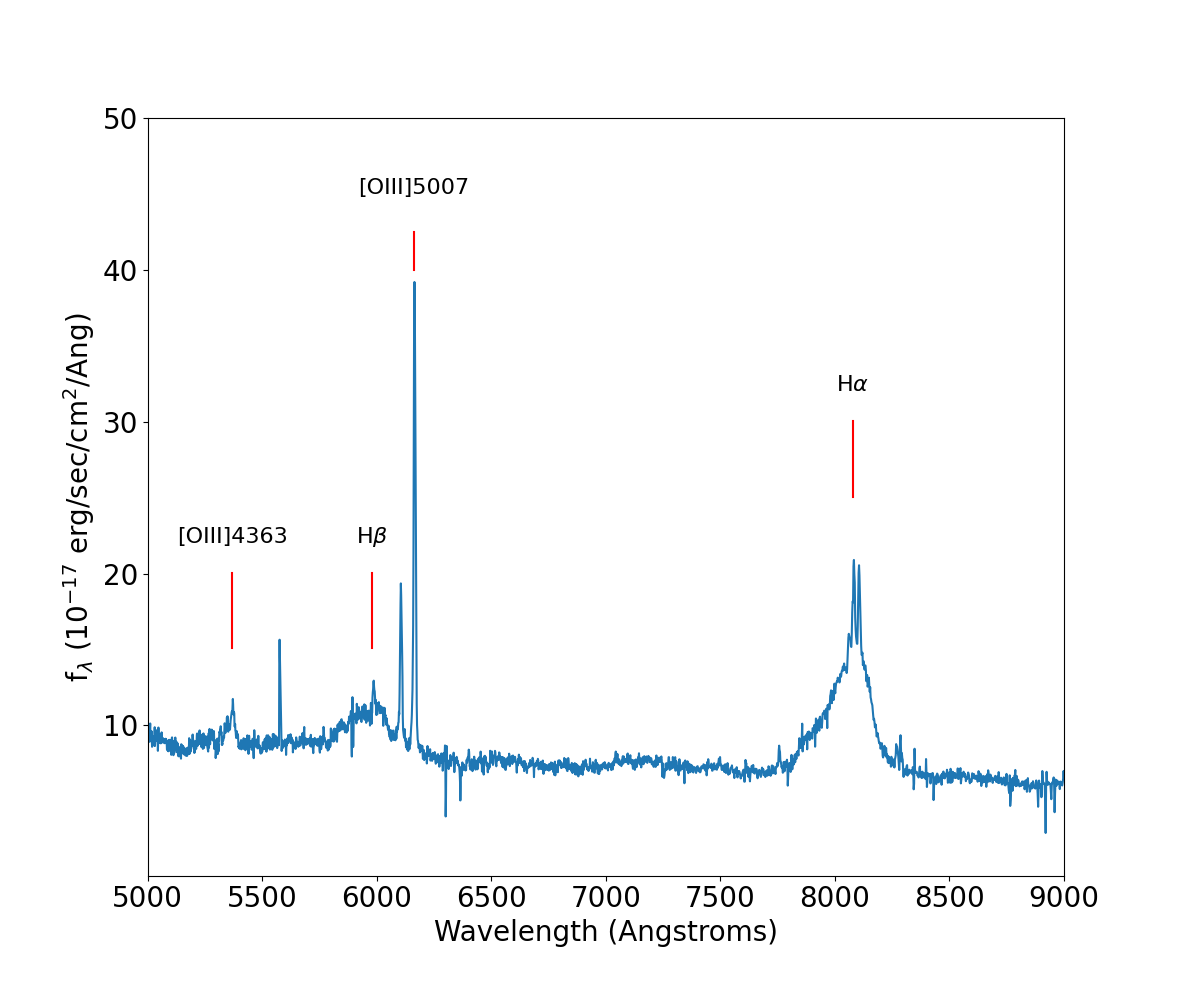
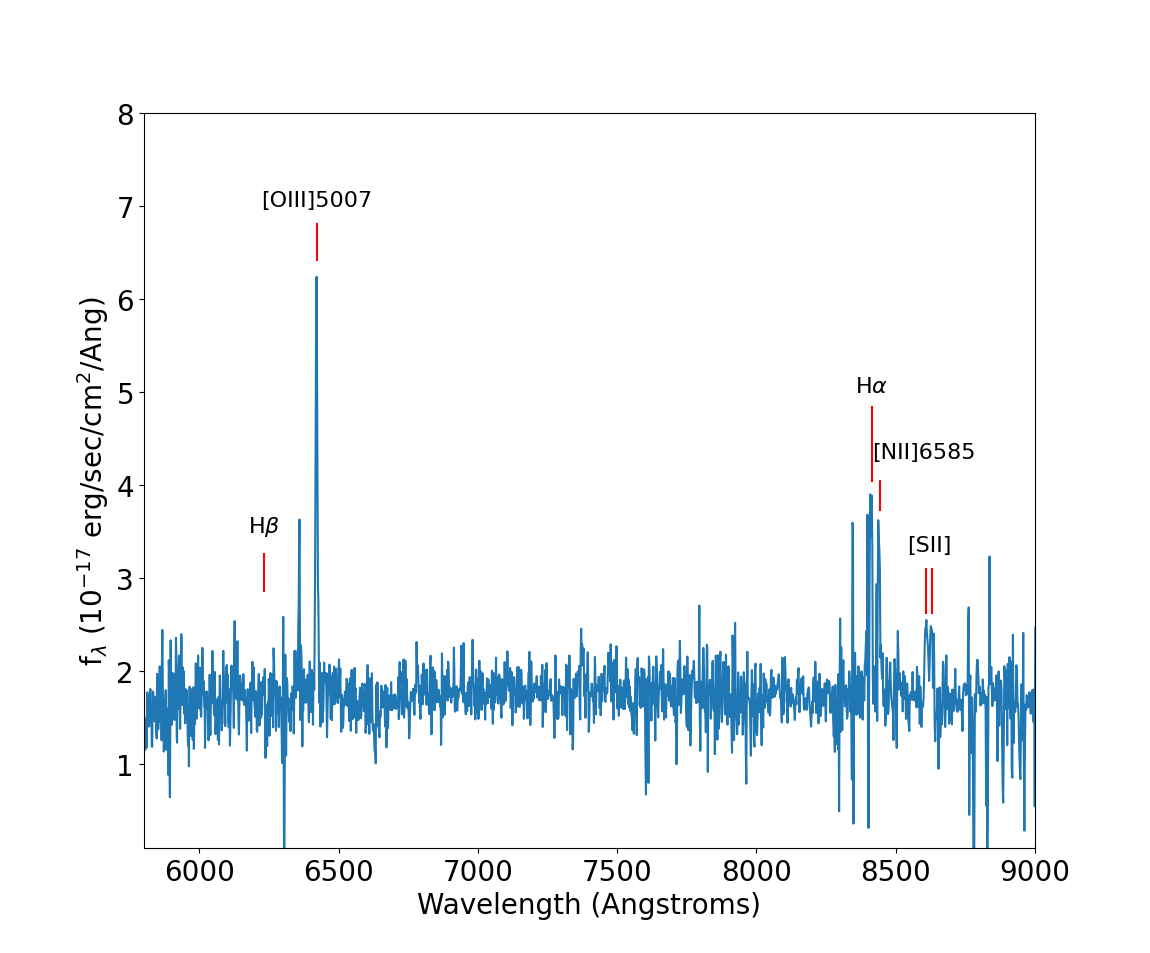
We classified the majority of sources with available optical spectra as either broad-line or narrow-line AGN based on the width of Balmer emission lines, using optical spectra primarily obtained from SDSS. All spectra in the redshift range of this study include at least the H region, while most of them include also the H. In particular, we classify all sources with a FWHM of the Balmer lines less than km/s and no evidence for any broadening with respect to forbidden lines (such as [OIII], [NII]) as narrow-line AGN. Nevertheless, a non-negligible fraction presents the typical spectrum of an absorption-line galaxy (ALG), while we were not able to reliably classify a few of them due to poor spectrum quality. In Fig. 6 we present an example of a broad- and a narrow-line spectrum. A summary of the classification is presented in Table 2, and individual classifications are given in Table LABEL:table:list.
3.2.2 X-ray hardness ratio
The X-ray hardness ratio (HR) refers to a measure of the relative intensity of X-rays at different energies. It is typically calculated as the ratio of the counts detected in two different energy bands with the equation:
| (2) |
where H is the hard- and S is the soft-band count-rate. In our case, we use the [0.5-2] keV band as the soft and the [2-10] keV as the hard. The X-ray hardness ratio can serve as a proxy for absorption from the obscuring torus, assuming a spectral modelling for the continuum emission. For our purposes, we adopt a simplified model for the AGN emission, assuming a single power law fit to the data. The torus absorbs softer X-rays preferentially over harder ones due to its composition and density. Consequently, the X-ray hardness ratio, which compares the counts of X-rays at different energy bands, can indicate the degree of obscuration. High hardness ratio values indicate significant obscuration, as softer X-rays are absorbed more effectively, resulting in a relatively greater detection of harder X-rays. To compute the HR values of our sources, we used the Bayesian method described by Park et al. (2006).
In the current work, this method allows an estimation of obscuration for the full sample, contrary to the similar analysis using optical spectra where we only have data for approximately half of the sample. However, we note that although the X-ray and the optical obscuration are well correlated, they exhibit significant scatter (Jaffarian & Gaskell, 2020) and overall, there is no a one-to-one correlation between them (e.g. Masoura et al., 2020, also known as XXL Paper XL). Furthermore, there are also indications that the X-ray spectral index depends on Eddington rate (e.g. Bianchi et al., 2009), and that the soft X-ray band, [0.5-2] keV, at low redshift may include contributions from the soft excess, leading to the underestimation of obscuration. Nevertheless, for the purpose of statistical comparisons in the current work, the use of HR as an indicator of obscuration is instructive. In Table 2 we quote the average HR values of BL and NL AGN, and ALGs, along with their optical classification. There is a good agreement between the two obscuration proxies with the BL AGN exhibiting significantly lower HR values than the NL population. The average HR of ALG sources does not indicate any heavy absorption in the X-ray band. In these sources, we assume that the AGN optical emission is diluted by the strong stellar continuum of their host galaxies.
| annulus | BL | NL | ALG |
|---|---|---|---|
| (1) | (2) | (3) | (4) |
| 1 | 3 (-0.50) | 6 (-0.07) | 4 (-0.55) |
| 2 | 1 (-0.44) | 6 (0.10) | 1 (-0.76) |
| 3 - 4 | 4 (-0.66) | 12 (-0.32) | 4 (-0.32) |
3.2.3 Spectral Energy Distribution (SED)
The AGN (e.g. accretion power) and the host-galaxy (stellar mass and SFR) properties of the sources were derived through SED fitting techniques using the Code Investigating GALaxy Emission CIGALE algorithm (Boquien et al., 2019; Yang et al., 2020, 2022). The SED fitting analysis is described in detail in Pouliasis et al. (2020, 2022a). In brief, we used the stellar population synthesis model defined in Bruzual & Charlot (2003) assuming the initial mass function by Salpeter (1955) and a constant solar metallicity (Z = 0.02) for the stellar emission in addition to a delayed star-formation history (with a functional form ) that includes a star formation burst, no longer than Myr (Małek et al., 2018; Buat et al., 2019). Furthermore, we used the attenuation law of the stellar emission by Charlot & Fall (2000) and we modelled the dust emission of the galaxy with the templates of Dale et al. (2014) without including the AGN emission. Finally, we used the SKIRTOR model (Stalevski et al., 2012, 2016) for the AGN emission at the different wavelengths without including the X-ray or radio modules The parameter space for the several modules in the SED fitting process was adopted from Mountrichas et al. (2024).
It is important in our analysis, to have reliable measurements of the AGN properties along with both the global M∗ and the SFR of the their host galaxies. For that purpose, we required our sources to have low reduced () that is indicative of the goodness of the SED fitting process. To this end, we excluded sources that have (e.g., Mountrichas et al., 2019; Buat et al., 2021; Pouliasis et al., 2022b).
4 Results
4.1 X-ray-detected AGN in merging and disturbed galaxies
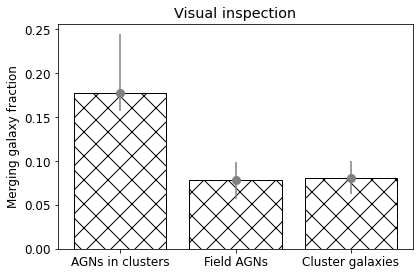
In the current study, the merging fraction in each sample is defined as the number of merging and disturbed galaxies divided by the total number of sample galaxies. The results are presented in Fig. 7. Using either Statmorph classifying software (see Sect. 3.1) or visual classification, the merging fraction of X-ray AGN hosts within clusters is significantly higher, at the 2 confidence level, than in field X-ray AGN or in non-active cluster galaxies.
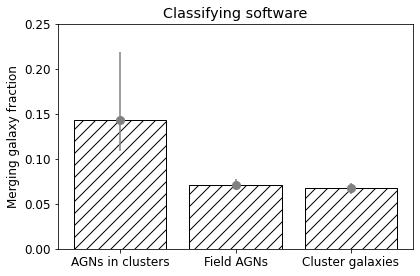
To identify possible trends in the spatial distribution of merging hosts, we followed the methodology described in Sec. 3 to segregate the area around clusters. To improve the statistics, we merge the third and the fourth annuli, which we consider to be the field. This decision was made following our initial inspection, which confirmed that the results from the two outer annuli consistently matched those of the field AGN control samples (i and iii). Our results are plotted in Fig. 8. For comparison, we plot only the results of the large control sample of cluster galaxies (ii), as they coincide with sample (iv) but offer better statistics.

Our analysis revealed that the majority of merging and disturbed X-ray AGN hosts reside in cluster outskirts. In particular, their fraction in the second annulus is significantly higher, at the 2 confidence level, than the respective fraction in non-active cluster galaxies and field X-ray AGN. The merging fraction in the two outer annuli () is consistent with the corresponding fraction () in the control samples. This confirms our assumption that beyond the 2 radius, AGN behave similarly to the field population, as previously reported in XXL Paper XXXV for the XXL sample below . However, the difference between the outskirts and the cluster centre is not significant at any confidence level, due to the small number of sources. The statistical results of the visual classification, including spiral and elliptical hosts, are presented in Fig. 10, while individual classification and images in Table LABEL:table:list and Table LABEL:table:images, respectively.
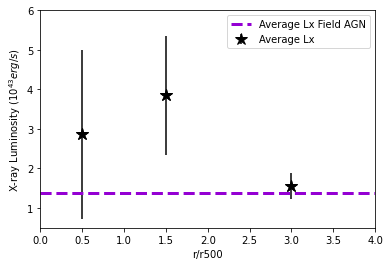
Finally, in Fig. 9 we plot the average X-ray luminosity (Lx) of AGN within clusters, which is a direct output of the XXL pipeline as described in Faccioli et al. (2018), also known as XXL Paper XXIV. It highlights how their radiative output varies with distance from the cluster centre. Similarly to the merging fraction, the average X-ray luminosity is three times higher than in the field, at the confidence level, while the outer annuli are in agreement with the field value. This may further support the idea that the relatively high number of galaxy mergers in the cluster outskirts contribute to the triggering of AGN.
4.2 AGN Obscuration
In this section, we examine the obscuration of X-ray AGN in our samples. Our aim was to investigate potential trends that may reveal the physical conditions responsible for triggering AGN in the dense environments of galaxy clusters. We use two indicators of obscuration, as described in Sect. 3; the AGN optical type (type-1/type-2) and the X-ray hardness ratio.
4.2.1 Optical AGN classification
First, we investigate potential trends related to AGN classification based on the optical spectra of our X-ray-detected AGN. In total, we find eight broad-line and 22 narrow-line AGN. Another six sources have an absorption-line galaxy (ALG) spectrum, typical of elliptical galaxies. However, most of the ALG present some weak emission lines, especially in the H region. Optical emission from these AGN, which are hosted mostly by massive elliptical galaxies, could be diluted by the stellar continuum. In addition, these AGN may be intrinsically weak, since the X-ray luminosity for four out of six is below erg/sec, placing them in the first quartile. The results are presented in Fig. 11. We were unable to identify any significant trends in the cluster-centric radial distribution of optical AGN types, likely due to the small sample size and resulting large uncertainties.

The ratio of type-2 to type-1 AGN identified in the current study is consistent with the field ratio observed in the Local Universe (e.g. Maia et al., 2003) and in high-redshift clusters () (Mo et al., 2018). This is in good agreement with a similar study of spectroscopically confirmed X-ray AGN in 19 galaxy clusters (Koulouridis et al., 2024), within a narrow redshift range . However, our findings diverge from recent results obtained from local clusters in the WINGS and Omega-WINGS surveys. In those studies, a notably higher optical type-2 to type-1 fraction was reported (approximately 10 to 1) compared to the field (Marziani et al., 2023). However, the sample selections in these studies differ significantly, so any comparisons should be approached with caution.
Interestingly, Koulouridis et al. (2024) reported that three out of the four broad-line AGN within were found in the central annulus. They argued that close to the cluster core, AGN activity may be triggered either by the influence of strong RPS, as suggested by studies of ”jellyfish” galaxies (Poggianti et al., 2017b; Peluso et al., 2022), or by tidal shocks, as galaxies pass through cluster pericentre. Our results support these findings, since three out of the four broad-line sources up to were found again in the same region. We note, that the cluster mass distribution of the current sample, mostly comprising groups and poor clusters, is markedly different from the massive clusters used in Koulouridis et al. (2024). In addition, the SED analysis showed that the accretion power of these three broad-line sources is higher than that of the rest of the X-ray AGN sample, and also of the other five broad-line AGN found farther from the cluster centre. We note that the fraction of broad-line AGN in the first two annuli is comparable to that in the last two annuli, which represent the field. However, the environment is drastically different.
We note that only half of our X-ray AGN have available spectroscopic data. Consequently, in the next section, we present the results of a statistical analysis based on the X-ray hardness ratio of our entire source sample.
4.2.2 X-ray hardness ratio
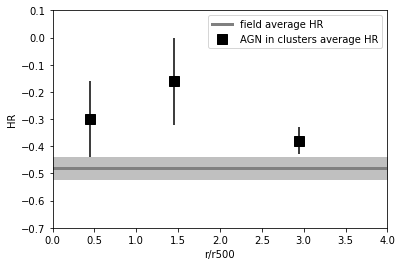
The X-ray hardness ratios of cluster and field X-ray AGN were computed following the methodology described in Sect. 3.2.2. For our purposes, we then derived the mean HR in each cluster annulus. The results are presented in Fig. 12. We cannot claim any difference between the outskirts and the central annulus because of the large uncertainties. Nevertheless, The mean HR values indicate that X-ray AGN in cluster outskirts are more obscured compared to those in the outer annuli (2-4), at the 1 confidence level, or in the field, at the 90% confidence level (Gehrels, 1986).
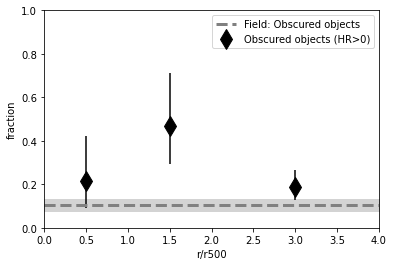
The higher average obscuration observed in the outskirts compared to the field may result from a higher number of obscured sources or, alternatively, from the presence of a few heavily obscured sources. To determine the source of obscuration, we needed to estimate the fraction of sources that are obscured in each annulus. To this end, we used PIMMS online tool555https://heasarc.gsfc.nasa.gov/cgi-bin/Tools/w3pimms/w3pimms.pl to compute the HR value that would best define a threshold between obscured and unobscured sources based on the column density of the obscuring material. A reasonable value of the column density above which we can assume that a source is obscured is cm-2. The HR that corresponds to this value depends on redshift and the slope () of the X-ray spectrum. Our computations within the redshift range of our sources and for various values of result in an average HR=0 as a reasonable threshold. The results are plotted in the bottom panel of Fig. 12. The fraction of obscured sources in the outskirts of clusters are significantly higher than the corresponding fraction in the field at the 2 confidence level. However, we cannot confirm any statistically significant difference between the outskirts and the centre of clusters due to small number statistics.
The results from the HR analysis are seemingly not in agreement with the results from the optical spectra analysis presented in the previous section. However, the two analyses are not directly comparable, since the samples are different. The current sample includes many faint sources (mi¿21) without spectroscopic data, possibly more obscured than the spectroscopic part of the sample. More importantly, as described in Sect. 3.2.2, the correlation between these two obscuration proxies presents large scatter.
In summary, the average obscuration is higher in cluster outskirts than in the field, at the confidence level, due to a larger number of obscured AGN. The obscuration excess coincides with the merging excess shown in Fig. 8, further supporting galaxy merging as the main AGN triggering mechanism in the outskirts.
4.3 AGN and host galaxy properties derived from SED fitting
The SED analysis of the X-ray AGN in our cluster sample may reveal some interesting environmental trends. Specifically, we statistically examine the black hole mass (), the black hole accretion rate (BHAR), and the Eddington rate () of the AGN, as well as the SFR of their host galaxies.
In order to estimate the , we used the following equation from Kormendy & Ho (2013) that takes into account the stellar-mass dependence:
| (3) |
where is the quantity ”bayes.stellar.mstar” from CIGALE. The average BHAR and may provide insight into the mass growth rates of black holes across different cluster regions. For the calculation, we used the following equation from Yang et al. (2023); Pouliasis et al. (2024):
| (4) |
where is the quantity ”agn.accretion.power” from our SED fits, which is the viewing-angle-averaged intrinsic accretion-disk luminosity. Also, is the radiative efficiency, the fraction of the accreted mass converted into radiation. For comparison, we derive the of sources both from the SEDs and from the X-rays, assuming . In particular, the calculated from the SEDs is:
| (5) |
while from the X-rays it is
| (6) |
where and is the bolometric correction as described in Duras et al. (2020).
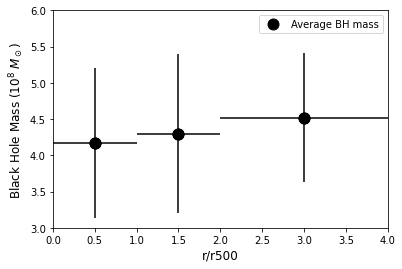
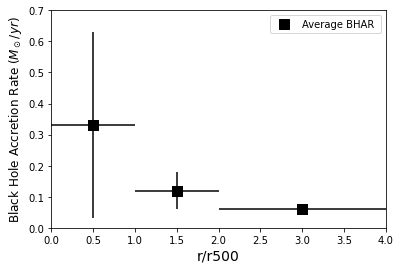
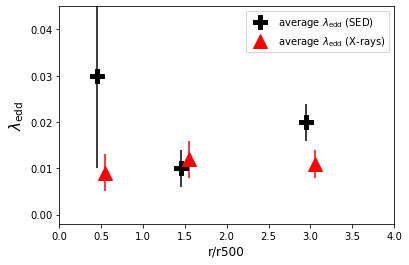
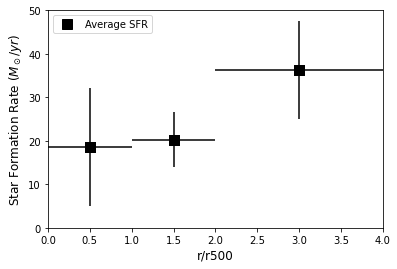
The top panels of Fig. 13 illustrate the average values of the and the BHAR as a function of cluster-centric distance. We found an average and BHAR for all X-ray AGN in all annuli. Similarly, we find no statistically significant differences in the Eddington rate of AGN in clusters (bottom left panel of Fig. 13), either calculated from the SEDs or directly from the X-rays. However, we found evidence that the average SFR (bottom right panel of Fig. 13) is decreasing toward the cluster centres, although the uncertainties are large. This is in agreement with results from both the local and high-redshift Universe, where the mean SFR was always found to be higher in field galaxies than in the cluster centres (Treu et al., 2003; Poggianti et al., 2006; Raichoor & Andreon, 2014; Haines et al., 2015). The decreasing SFR is probably an indication of the ram pressure induced by the ICM and frequent galaxy-galaxy interactions, which are very effective in stripping the gas of infalling galaxies (e.g. Larson et al., 1980; Cole et al., 2000; Balogh et al., 1999; Kawata & Mulchaey, 2008; Boselli et al., 2022), transforming them into inactive ellipticals.
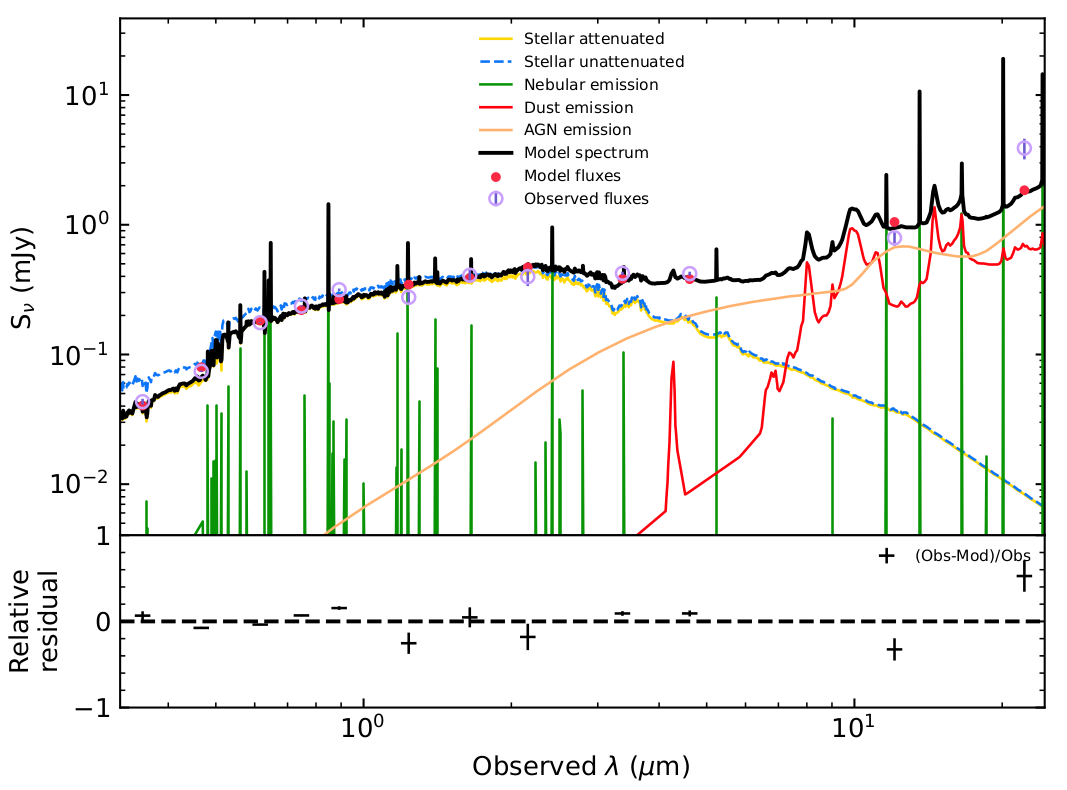
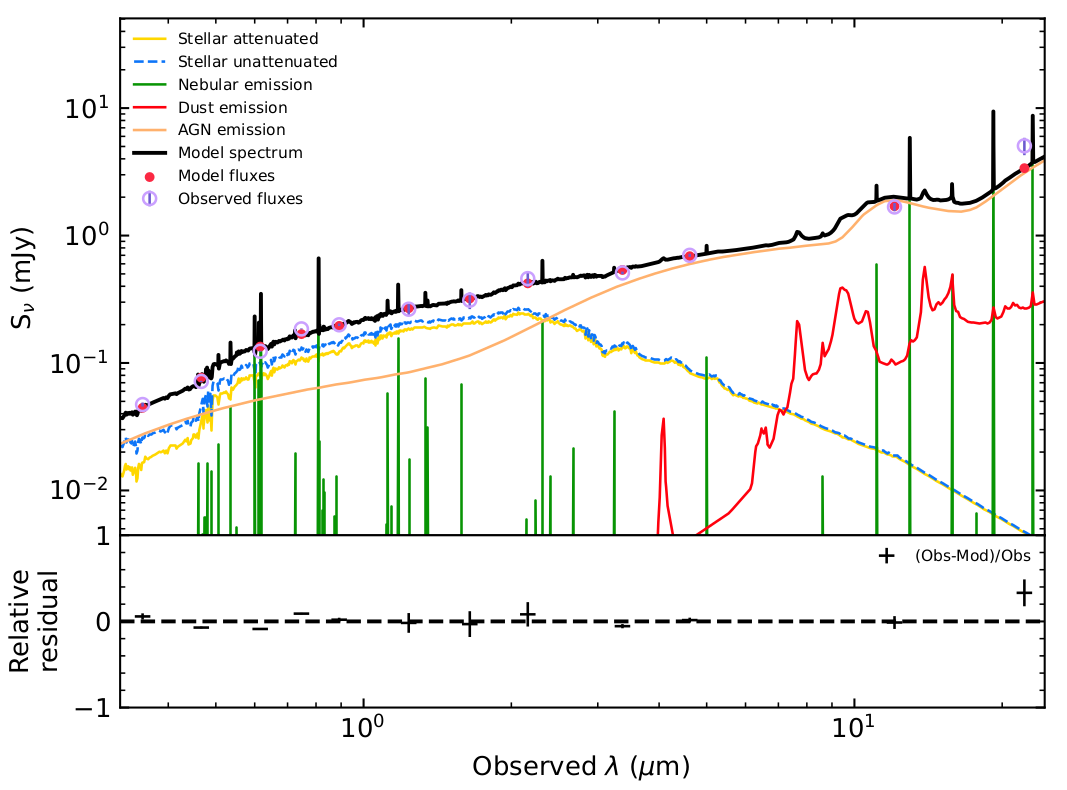
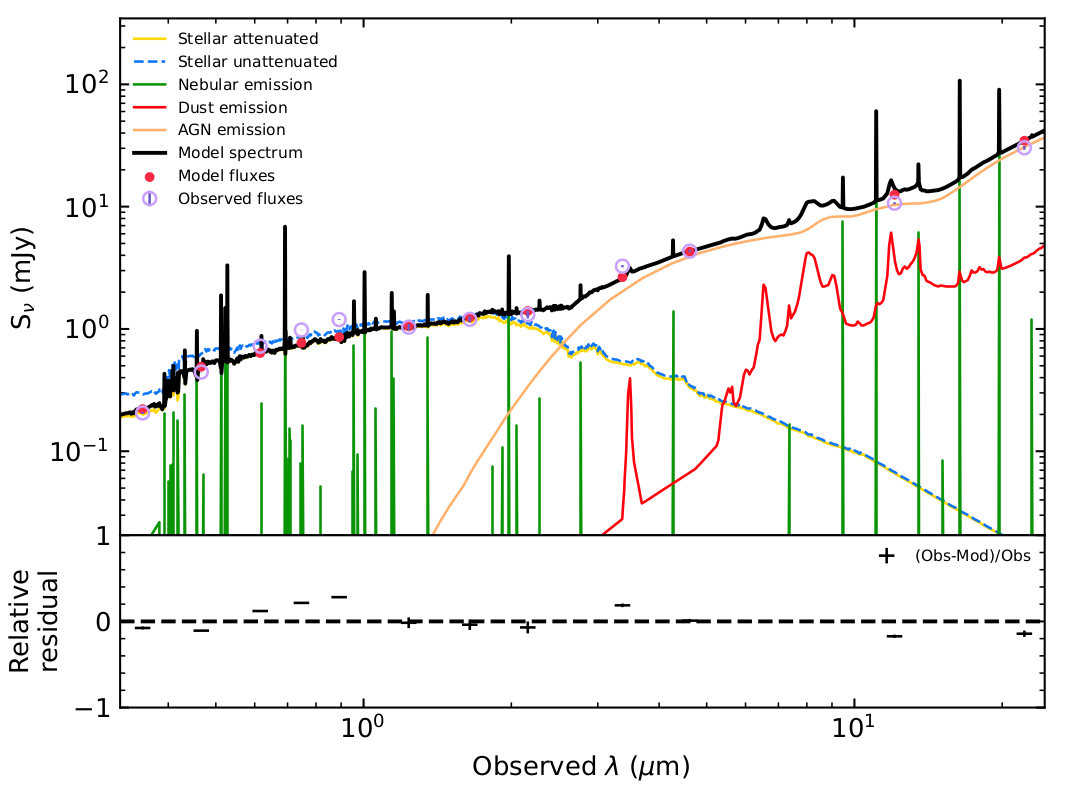
In addition, sources closer to cluster centres have slightly larger stellar masses () compared to AGN in the 2-4 annuli (). Further analysis of the SFR-stellar mass relation of our AGN relative to the main sequence (MS) of the star-forming galaxies is presented in Appendix C. The SEDs plotted in Fig. 14 are examples (with a good fit of ) of different categories of host galaxies of our sample, namely a spiral, an elliptical, and a merging host galaxy, respectively.
5 Discussion and conclusions
In the current study, our aim was at investigating the role of specific properties of X-ray-detected AGN in galaxy clusters, such as the merging fraction and the morphology of their host galaxies, obscuration, star formation and accretion rate. To this end, we have used a main sample of 82 X-ray AGN detected within 4 radii of XXL clusters. Moreover, we assembled four control samples (consisting of field X-ray AGN and non-AGN cluster galaxies) to enable a thorough comparative analysis.
We discovered that cluster galaxies that host X-ray AGN are significantly more often merging or disturbed, at the confidence level, than similar X-ray AGN hosts in the field and cluster galaxies without X-ray detected AGN. These findings align with earlier research, which indicates that the interactions occurring during mergers may play a crucial role in triggering the formation of AGN in dense environments (e.g. Ehlert et al., 2015; Koulouridis et al., 2024). Mergers can trigger the formation of new stars, as well as the recirculation of gas and dust. Furthermore, they are thought to be a very efficient way to trigger AGN activity, as they can provide a large amount of gas and dust to fuel the SMBH (e.g. Silk & Rees, 1998; Granato et al., 2004; Häring & Rix, 2004; Springel et al., 2005; Koulouridis et al., 2006b; Hopkins et al., 2008; Zubovas & King, 2012; Steffen et al., 2023; Li et al., 2023; Comerford et al., 2024; Duan et al., 2024; La Marca et al., 2024; Bonaventura et al., 2025).
Likewise, we found that the excess of merging and disturbed AGN hosts can be largely attributed to galaxies in cluster outskirts (between and 2). This result supports the scenario in which the excess of AGN activity in the outskirts of clusters (Johnson et al., 2003; Ruderman & Ebeling, 2005; Branchesi et al., 2007; Fassbender et al., 2012; Koulouridis et al., 2014; Koulouridis & Bartalucci, 2019; Koulouridis et al., 2024; Hashiguchi et al., 2023) can be attributed to a high frequency of galaxy interactions and merging. While high-velocity dispersions in massive clusters may diminish the probability of galaxy interactions (e.g. Arnold et al., 2009; Manzer & De Robertis, 2014), Haines et al. (2012) proposed the existence of two separate groups of X-ray AGN in the outskirts: newly infalling galaxies and those that have already passed the pericentre and are nearing the apocentre of their orbit, termed the back-splash population. These galaxies likely have low velocities, potentially facilitating interactions and mergers with other galaxies in the outskirts. Supporting our findings, a recent study of mergers in six low-redshift clusters suggested that post-merging galaxies likely merged in low-velocity environments, such as clusters outskirts and dynamically relaxed clusters Kim et al. (2024).
A high merging frequency may result in increased absorption of the AGN emission, as obscuring material is driven towards the galaxy nucleus (e.g. Hopkins2008; Koulouridis et al., 2014, 2016a; La Marca et al., 2024). Therefore, investigating the obscuration of the sources may provide some further evidence of the mechanisms that trigger AGN in clusters. To this end, we have followed two different approaches to estimate the intrinsic absorption in the samples under study: investigating (a) the optical spectra of the sources that have spectroscopic data (50% of the sample), and (ii) the X-ray hardness ratio (full sample). The classification of the optical spectra showed a predominance of narrow emission-line spectra among AGN situated in galaxy clusters. However, the broad to narrow-line ratio in clusters (up to 2R500) is not dissimilar to the respective ratio in the field. Nevertheless, three out of four broad-line sources are located within the central R500 annulus, including the only powerful QSO (with AP erg/sec, erg/sec and no visible host galaxy) found in this sample. Despite the small number statistics, this is an interesting trend corroborated by recent similar results from a different sample of 19 clusters below (Koulouridis et al., 2024). As suggested in that publication, this trend may indicate a different triggering mechanism or accretion rate, between the cluster’s core and its periphery. In more detail, AGN activity near the cluster centre might arise from two primary triggers: the influence of strong RPS, as indicated by research on ”jellyfish” galaxies (Poggianti et al., 2017b; Peluso et al., 2022), and tidal shocks occurring as galaxies traverse the pericentre of a cluster. It is important to note that the SED analysis revealed a significantly higher value of accretion power in these broad-line AGN. This indicates that the processes driving the growth of these SMBH are more intense, providing further support for the AGN triggering by RPS scenario. The accretion power rate is a crucial factor in understanding the dynamics and evolution of these AGN and influences the emission and the overall energetic output in cluster cores. This heightened activity within the core region suggests that a number of centrally located AGN may have more efficient energy feedback, which could have significant implications for the surrounding cluster environment.
Regarding the X-ray hardness ratio distribution of the full sample, our analysis indicates that the emission coming from AGN located in cluster outskirts is significantly more absorbed when compared either to the control sample of field X-ray AGN (at the 90% confidence level) or to the 2-4R500 region (at the level). Furthermore, we confirmed that this higher obscuration is due to a high number of obscured sources in the outskirts and not just a few highly obscured ones. These findings align with the noted increase in galaxy merging and interactions within the outskirts. The excess of obscured sources in this region suggests that the dense, dynamic environment, characterised by frequent merging events, plays a crucial role in the process of AGN triggering.
6 Summary
The conclusions that can be drawn from the above analysis are the following:
-
•
We identified a significant excess, at the 2 confidence level, of X-ray AGN in galaxy clusters hosted by merging or disturbed galaxies, compared to non-active cluster galaxies or X-ray AGN in the field. This excess can be localised in the cluster outskirts (between 1 and radius). Previous studies suggest a connection between galaxy interactions and the triggering of AGN in cluster environments. We argue that galaxy merging and interactions are more likely to happen in the outskirts of clusters, causing a higher frequency of AGN triggering than in field galaxies and thus, leading to the observed excess.
-
•
The hardness ratio distribution indicates higher level of obscuration in clusters than in the field, specifically in the outskirts, further supporting that galaxy merging and interactions may act as an AGN triggering mechanism.
-
•
The ratio of narrow-line to broad-line AGN in clusters is comparable to that in the field. Interestingly, three out of four broad-line AGN, including the only QSO, are found close to the cluster centre (within ). SED analysis of these broad-line AGN revealed that their accretion power is among the highest in our sample. These results are possibly indicating AGN triggering in infalling galaxies by RPS.
Future research should focus on maximizing AGN sample sizes within meticulously characterised cluster datasets. Our future plans include thorough studies of AGN in large X-ray-selected cluster samples, such as X-CLASS Koulouridis et al. (2021), XCS (Mehrtens et al., 2012; Giles et al., 2022) and eROSITA (Bulbul et al., 2024).
Acknowledgements.
The authors extend their gratitude to the anonymous referee for the attentive review and valuable feedback. ED acknowledges financial support by the European Union’s Horizon 2020 programme “XMM2ATHENA” under grant agreement No 101004168. EK acknowledges support under the grant 5089 financed by IAASARS/NOA. EP acknowledges financial support by the European Union’s Horizon 2020 programme ”XMM2ATHENA” under grant agreement No 101004168. The research leading to these results has received funding (EP) from the European Union’s Horizon 2020 Programme under the AHEAD2020 project (grant agreement n. 871158). This research has made use of ”Aladin sky atlas” developed at CDS, Strasbourg Observatory, France. This research has made use of ESASky (Baines et al., 2017; Giordano et al., 2018), developed by the ESAC Science Data Centre (ESDC) team and maintained alongside other ESA science mission’s archives at ESA’s European Space Astronomy Centre (ESAC, Madrid, Spain). This research made use of Astropy, a community-developed core Python package for Astronomy (http://www.astropy.org, Astropy Collaboration et al. (2022)). This publication made use of SAOImageDS9 (Joye & Mandel, 2003). This publication made use of TOPCAT (Taylor, 2005) for table manipulations. The plots in this publication were produced using Matplotlib, a Python library for publication quality graphics (Hunter, 2007). Based on observations obtained with XMM-Newton, an ESA science mission with instruments and contributions directly funded by ESA member states and NASA.References
- Adami et al. (2018) Adami, C., Giles, P., Koulouridis, E., et al. 2018, A&A, 620, A5
- Aihara et al. (2018) Aihara, H., Armstrong, R., Bickerton, S., et al. 2018, PASJ, 70, S8
- Aird et al. (2019) Aird, J., Coil, A. L., & Georgakakis, A. 2019, MNRAS, 484, 4360
- Arnold et al. (2009) Arnold, T. J., Martini, P., Mulchaey, J. S., Berti, A., & Jeltema, T. E. 2009, ApJ, 707, 1691
- Astropy Collaboration et al. (2022) Astropy Collaboration, Price-Whelan, A. M., Lim, P. L., et al. 2022, ApJ, 935, 167
- Baines et al. (2017) Baines, D., Giordano, F., Racero, E., et al. 2017, PASP, 129, 028001
- Balogh et al. (1999) Balogh, M. L., Morris, S. L., Yee, H. K. C., Carlberg, R. G., & Ellingson, E. 1999, ApJ, 527, 54
- Bekki (2009) Bekki, K. 2009, MNRAS, 399, 2221
- Beyoro-Amado et al. (2021) Beyoro-Amado, Z., Pović, M., Sánchez-Portal, M., et al. 2021, in Nuclear Activity in Galaxies Across Cosmic Time, ed. M. Pović, P. Marziani, J. Masegosa, H. Netzer, S. H. Negu, & S. B. Tessema, Vol. 356, 163–168
- Bhargava et al. (2023) Bhargava, S., Garrel, C., Koulouridis, E., et al. 2023, A&A, 673, A92
- Bian & Gu (2007) Bian, W. & Gu, Q. 2007, ApJ, 657, 159
- Bianchi et al. (2009) Bianchi, S., Guainazzi, M., Matt, G., Fonseca Bonilla, N., & Ponti, G. 2009, A&A, 495, 421
- Bianchi et al. (2017) Bianchi, S., Marinucci, A., Matt, G., et al. 2017, MNRAS, 468, 2740
- Bianchi et al. (2012) Bianchi, S., Panessa, F., Barcons, X., et al. 2012, MNRAS, 426, 3225
- Bonaventura et al. (2025) Bonaventura, N., Lyu, J., Rieke, G. H., et al. 2025, ApJ, 978, 74
- Boquien et al. (2019) Boquien, M., Burgarella, D., Roehlly, Y., et al. 2019, A&A, 622, A103
- Boselli et al. (2022) Boselli, A., Fossati, M., & Sun, M. 2022, A&A Rev., 30, 3
- Branchesi et al. (2007) Branchesi, M., Gioia, I. M., Fanti, C., Fanti, R., & Cappelluti, N. 2007, A&A, 462, 449
- Bruzual & Charlot (2003) Bruzual, G. & Charlot, S. 2003, MNRAS, 344, 1000
- Buat et al. (2019) Buat, V., Ciesla, L., Boquien, M., Małek, K., & Burgarella, D. 2019, A&A, 632, A79
- Buat et al. (2021) Buat, V., Mountrichas, G., Yang, G., et al. 2021, A&A, 654, A93
- Bufanda et al. (2017) Bufanda, E., Hollowood, D., Jeltema, T. E., et al. 2017, MNRAS, 465, 2531
- Bulbul et al. (2024) Bulbul, E., Liu, A., Kluge, M., et al. 2024, A&A, 685, A106
- Cappi et al. (2001) Cappi, M., Mazzotta, P., Elvis, M., et al. 2001, ApJ, 548, 624
- Ceccarelli et al. (2022) Ceccarelli, L., Duplancic, F., & Garcia Lambas, D. 2022, MNRAS, 509, 1805
- Cen & Chisari (2011) Cen, R. & Chisari, N. E. 2011, ApJ, 731, 11
- Cezar et al. (2024) Cezar, P. H., Pastoriza, M. G., Riffel, R., et al. 2024, A&A, 689, A312
- Charlot & Fall (2000) Charlot, S. & Fall, S. M. 2000, ApJ, 539, 718
- Chiappetti et al. (2018) Chiappetti, L., Fotopoulou, S., Lidman, C., et al. 2018, A&A, 620, A12, (XXL Paper XXVII)
- Chung et al. (2009) Chung, A., van Gorkom, J. H., Kenney, J. D. P., Crowl, H., & Vollmer, B. 2009, AJ, 138, 1741
- Cole et al. (2000) Cole, S., Lacey, C. G., Baugh, C. M., & Frenk, C. S. 2000, MNRAS, 319, 168
- Comerford et al. (2024) Comerford, J. M., Nevin, R., Negus, J., et al. 2024, ApJ, 963, 53
- Constantin et al. (2008) Constantin, A., Hoyle, F., & Vogeley, M. S. 2008, ApJ, 673, 715
- Cowie & Songaila (1977) Cowie, L. L. & Songaila, A. 1977, Nature, 266, 501
- Dale et al. (2014) Dale, D. A., Helou, G., Magdis, G. E., et al. 2014, ApJ, 784, 83
- Daoutis et al. (2023) Daoutis, C., Kyritsis, E., Kouroumpatzakis, K., & Zezas, A. 2023, A&A, 679, A76
- de Vos et al. (2024) de Vos, K., Hatch, N. A., & Merrifield, M. R. 2024, MNRAS, 535, 217
- D’Elia et al. (2004) D’Elia, V., Fiore, F., Elvis, M., et al. 2004, A&A, 422, 11
- Duan et al. (2024) Duan, Q., Li, Q., Conselice, C. J., et al. 2024, arXiv e-prints, arXiv:2411.04944
- Dultzin et al. (2008) Dultzin, D., Gonzalez, J. J., Krongold, Y., et al. 2008, Mem. Soc. Astron. Italiana, 79, 1326
- Dultzin-Hacyan et al. (1999) Dultzin-Hacyan, D., Krongold, Y., Fuentes-Guridi, I., & Marziani, P. 1999, ApJ, 513, L111
- Duplancic et al. (2021) Duplancic, F., Lambas, D. G., Alonso, S., & Coldwell, G. V. 2021, MNRAS, 504, 4389
- Duras et al. (2020) Duras, F., Bongiorno, A., Ricci, F., et al. 2020, A&A, 636, A73
- Ehlert et al. (2015) Ehlert, S., Allen, S. W., Brandt, W. N., et al. 2015, MNRAS, 446, 2709
- Ehlert et al. (2014) Ehlert, S., von der Linden, A., Allen, S. W., et al. 2014, MNRAS, 437, 1942
- Ehlert et al. (2013) Ehlert, S., Werner, N., Simionescu, A., et al. 2013, MNRAS, 430, 2401
- Elitzur & Ho (2009) Elitzur, M. & Ho, L. C. 2009, ApJ, 701, L91
- Elitzur et al. (2014) Elitzur, M., Ho, L. C., & Trump, J. R. 2014, MNRAS, 438, 3340
- Elitzur & Netzer (2016) Elitzur, M. & Netzer, H. 2016, MNRAS, 459, 585
- Faccioli et al. (2018) Faccioli, L., Pacaud, F., Sauvageot, J. L., et al. 2018, A&A, 620, A9
- Fassbender et al. (2012) Fassbender, R., Šuhada, R., & Nastasi, A. 2012, Advances in Astronomy, 2012, 138380
- Fotopoulou et al. (2016) Fotopoulou, S., Buchner, J., Georgantopoulos, I., et al. 2016, A&A, 587, A142
- Fujita (2004) Fujita, Y. 2004, PASJ, 56, 29
- Gatica et al. (2024) Gatica, C., Demarco, R., Dole, H., et al. 2024, MNRAS, 527, 3006
- Gavazzi et al. (2011) Gavazzi, G., Savorgnan, G., & Fumagalli, M. 2011, A&A, 534, A31
- Gehrels (1986) Gehrels, N. 1986, ApJ, 303, 336
- Giles et al. (2022) Giles, P. A., Romer, A. K., Wilkinson, R., et al. 2022, MNRAS, 516, 3878
- Gilmour et al. (2009) Gilmour, R., Best, P., & Almaini, O. 2009, MNRAS, 392, 1509
- Giordano et al. (2018) Giordano, F., Racero, E., Norman, H., et al. 2018, Astronomy and Computing, 24, 97
- Giovanelli & Haynes (1985) Giovanelli, R. & Haynes, M. P. 1985, ApJ, 292, 404
- Gkini et al. (2021) Gkini, A., Plionis, M., Chira, M., & Koulouridis, E. 2021, A&A, 650, A75
- González et al. (2008) González, J. J., Krongold, Y., Dultzin, D., et al. 2008, in Revista Mexicana de Astronomia y Astrofisica Conference Series, Vol. 32, Revista Mexicana de Astronomia y Astrofisica Conference Series, 170–172
- Gordon et al. (2018) Gordon, Y. A., Pimbblet, K. A., Owers, M. S., et al. 2018, MNRAS, 475, 4223
- Granato et al. (2004) Granato, G. L., De Zotti, G., Silva, L., Bressan, A., & Danese, L. 2004, ApJ, 600, 580
- Gültekin et al. (2009) Gültekin, K., Richstone, D. O., Gebhardt, K., et al. 2009, ApJ, 698, 198
- Gunn & Gott (1972) Gunn, J. E. & Gott, III, J. R. 1972, ApJ, 176, 1
- Guzzo et al. (2014) Guzzo, L., Scodeggio, M., Garilli, B., et al. 2014, A&A, 566, A108
- Haines et al. (2012) Haines, C. P., Pereira, M. J., Sanderson, A. J. R., et al. 2012, ApJ, 754, 97
- Haines et al. (2015) Haines, C. P., Pereira, M. J., Smith, G. P., et al. 2015, ApJ, 806, 101
- Häring & Rix (2004) Häring, N. & Rix, H.-W. 2004, ApJ, 604, L89
- Hashiguchi et al. (2023) Hashiguchi, A., Toba, Y., Ota, N., et al. 2023, PASJ, 75, 1246
- Hopkins et al. (2008) Hopkins, P. F., Hernquist, L., Cox, T. J., & Kereš, D. 2008, ApJS, 175, 356
- Hunter (2007) Hunter, J. D. 2007, Computing in Science & Engineering, 9, 90
- Jaffarian & Gaskell (2020) Jaffarian, G. W. & Gaskell, C. M. 2020, MNRAS, 493, 930
- Jaffé et al. (2015) Jaffé, Y. L., Smith, R., Candlish, G. N., et al. 2015, MNRAS, 448, 1715
- Johnson et al. (2003) Johnson, O., Best, P. N., & Almaini, O. 2003, MNRAS, 343, 924
- Joye & Mandel (2003) Joye, W. A. & Mandel, E. 2003, in Astronomical Society of the Pacific Conference Series, Vol. 295, Astronomical Data Analysis Software and Systems XII, ed. H. E. Payne, R. I. Jedrzejewski, & R. N. Hook, 489
- Kauffmann et al. (2004) Kauffmann, G., White, S. D. M., Heckman, T. M., et al. 2004, MNRAS, 353, 713
- Kawata & Mulchaey (2008) Kawata, D. & Mulchaey, J. S. 2008, ApJ, 672, L103
- Kelkar et al. (2019) Kelkar, K., Gray, M. E., Aragón-Salamanca, A., et al. 2019, Monthly Notices of the Royal Astronomical Society, 486, 868
- Keshet & Reiss (2018) Keshet, U. & Reiss, I. 2018, ApJ, 869, 53
- Kim et al. (2024) Kim, D., Sheen, Y.-K., Jaffé, Y. L., et al. 2024, ApJ, 966, 124
- Kocevski et al. (2009) Kocevski, D. D., Lubin, L. M., Gal, R., et al. 2009, ApJ, 690, 295
- Kormendy & Ho (2013) Kormendy, J. & Ho, L. C. 2013, ARA&A, 51, 511
- Koulouridis (2014) Koulouridis, E. 2014, A&A, 570, A72
- Koulouridis & Bartalucci (2019) Koulouridis, E. & Bartalucci, I. 2019, A&A, 623, L10
- Koulouridis et al. (2006a) Koulouridis, E., Chavushyan, V., Plionis, M., Krongold, Y., & Dultzin-Hacyan, D. 2006a, ApJ, 651, 93
- Koulouridis et al. (2021) Koulouridis, E., Clerc, N., Sadibekova, T., et al. 2021
- Koulouridis et al. (2016a) Koulouridis, E., Georgantopoulos, I., Loukaidou, G., et al. 2016a, A&A, 586, A3
- Koulouridis et al. (2024) Koulouridis, E., Gkini, A., & Drigga, E. 2024, A&A, 684, A111
- Koulouridis et al. (2013) Koulouridis, E., Plionis, M., Chavushyan, V., et al. 2013, A&A, 552, A135
- Koulouridis et al. (2006b) Koulouridis, E., Plionis, M., Chavushyan, V., et al. 2006b, ApJ, 639, 37
- Koulouridis et al. (2014) Koulouridis, E., Plionis, M., Melnyk, O., et al. 2014, A&A, 567, A83
- Koulouridis et al. (2016b) Koulouridis, E., Poggianti, B., Altieri, B., et al. 2016b, A&A, 592, A11
- Koulouridis et al. (2018) Koulouridis, E., Ricci, M., Giles, P., et al. 2018, A&A, 620, A20, (XXL paper XXXV)
- Krishnan et al. (2017) Krishnan, C., Hatch, N. A., Almaini, O., et al. 2017, MNRAS, 470, 2170
- La Marca et al. (2024) La Marca, A., Margalef-Bentabol, B., Wang, L., et al. 2024, A&A, 690, A326
- Lagos et al. (2011) Lagos, C. D. P., Padilla, N. D., Strauss, M. A., Cora, S. A., & Hao, L. 2011, MNRAS, 414, 2148
- Larson et al. (1980) Larson, R. B., Tinsley, B. M., & Caldwell, C. N. 1980, ApJ, 237, 692
- Lehmer et al. (2013) Lehmer, B. D., Lucy, A. B., Alexander, D. M., et al. 2013, ApJ, 765, 87
- Li et al. (2023) Li, W., Nair, P., Irwin, J., et al. 2023, ApJ, 944, 168
- Lidman et al. (2016) Lidman, C., Ardila, F., Owers, M., et al. 2016, PASA, 33, e001
- Liske et al. (2015) Liske, J., Baldry, I. K., Driver, S. P., et al. 2015, MNRAS, 452, 2087
- Łokas (2023) Łokas, E. L. 2023, A&A, 678, A147
- Lopes et al. (2017) Lopes, P. A. A., Ribeiro, A. L. B., & Rembold, S. B. 2017, MNRAS, 472, 409
- Lotz et al. (2008) Lotz, J. M., Jonsson, P., Cox, T. J., & Primack, J. R. 2008, MNRAS, 391, 1137
- Lotz et al. (2004) Lotz, J. M., Primack, J., & Madau, P. 2004, AJ, 128, 163
- Maia et al. (2003) Maia, M. A. G., Machado, R. S., & Willmer, C. N. A. 2003, AJ, 126, 1750
- Maiolino et al. (1997) Maiolino, R., Ruiz, M., Rieke, G. H., & Papadopoulos, P. 1997, ApJ, 485, 552
- Małek et al. (2018) Małek, K., Buat, V., Roehlly, Y., et al. 2018, A&A, 620, A50
- Manzer & De Robertis (2014) Manzer, L. H. & De Robertis, M. M. 2014, ApJ, 788, 140
- Marinucci et al. (2012) Marinucci, A., Bianchi, S., Nicastro, F., Matt, G., & Goulding, A. D. 2012, ApJ, 748, 130
- Martini et al. (2002) Martini, P., Kelson, D. D., Mulchaey, J. S., & Trager, S. C. 2002, ApJ, 576, L109
- Martini et al. (2013) Martini, P., Miller, E. D., Brodwin, M., et al. 2013, ApJ, 768, 1
- Martini et al. (2007) Martini, P., Mulchaey, J. S., & Kelson, D. D. 2007, ApJ, 664, 761
- Martini et al. (2009) Martini, P., Sivakoff, G. R., & Mulchaey, J. S. 2009, ApJ, 701, 66
- Martínez et al. (2022) Martínez, H. J., Coenda, V., Muriel, H., de los Rios, M., & Ruiz, A. N. 2022, Monthly Notices of the Royal Astronomical Society, 519, 4360
- Marziani et al. (2023) Marziani, P., D’Onofrio, M., Radovich, M., Moretti, A., & Poggianti, B. M. 2023, Advances in Space Research, 71, 5493
- Masoura et al. (2020) Masoura, V. A., Georgantopoulos, I., Mountrichas, G., et al. 2020, A&A, 638, A45
- Mehrtens et al. (2012) Mehrtens, N., Romer, A. K., Hilton, M., et al. 2012, MNRAS, 423, 1024
- Mishra & Dai (2020) Mishra, H. D. & Dai, X. 2020, AJ, 159, 69
- Miyazaki et al. (2018) Miyazaki, S., Komiyama, Y., Kawanomoto, S., et al. 2018, PASJ, 70, S1
- Mo et al. (2018) Mo, W., Gonzalez, A., Stern, D., et al. 2018, ApJ, 869, 131
- Molnar et al. (2002) Molnar, S. M., Hughes, J. P., Donahue, M., & Joy, M. 2002, ApJ, 573, L91
- Mountrichas et al. (2019) Mountrichas, G., Georgakakis, A., & Georgantopoulos, I. 2019, MNRAS, 483, 1374
- Mountrichas et al. (2024) Mountrichas, G., Viitanen, A., Carrera, F. J., et al. 2024, A&A, 683, A172
- Muñoz Rodr´ıguez et al. (2023) Muñoz Rodríguez, I., Georgakakis, A., Shankar, F., et al. 2023, MNRAS, 518, 1041
- Nicastro (2000) Nicastro, F. 2000, ApJ, 530, L65
- Nicastro et al. (2003) Nicastro, F., Martocchia, A., & Matt, G. 2003, ApJ, 589, L13
- Oxland et al. (2024) Oxland, M., Parker, L. C., de Carvalho, R. R., & Sampaio, V. M. 2024, MNRAS, 529, 3651
- Pacaud et al. (2006) Pacaud, F., Pierre, M., Refregier, A., et al. 2006, MNRAS, 372, 578
- Park et al. (2006) Park, T., Kashyap, V. L., Siemiginowska, A., et al. 2006, ApJ, 652, 610
- Peluso et al. (2022) Peluso, G., Vulcani, B., Poggianti, B. M., et al. 2022, ApJ, 927, 130
- Pierce et al. (2023) Pierce, J. C. S., Tadhunter, C., Ramos Almeida, C., et al. 2023, MNRAS, 522, 1736
- Pierre et al. (2016) Pierre, M., Pacaud, F., Adami, C., et al. 2016, A&A, 592, A1, (XXL Paper I)
- Planck Collaboration et al. (2016) Planck Collaboration, Ade, P. A. R., Aghanim, N., et al. 2016, A&A, 594, A13
- Poggianti et al. (2017a) Poggianti, B. M., Jaffé, Y. L., Moretti, A., et al. 2017a, Nature, 548, 304
- Poggianti et al. (2017b) Poggianti, B. M., Moretti, A., Gullieuszik, M., et al. 2017b, ApJ, 844, 48
- Poggianti et al. (2006) Poggianti, B. M., von der Linden, A., De Lucia, G., et al. 2006, ApJ, 642, 188
- Popesso & Biviano (2006) Popesso, P. & Biviano, A. 2006, A&A, 460, L23
- Pouliasis et al. (2022a) Pouliasis, E., Georgantopoulos, I., Ruiz, A., et al. 2022a, A&A, 658, A175
- Pouliasis et al. (2022b) Pouliasis, E., Mountrichas, G., Georgantopoulos, I., et al. 2022b, A&A, 667, A56
- Pouliasis et al. (2020) Pouliasis, E., Mountrichas, G., Georgantopoulos, I., et al. 2020, MNRAS, 495, 1853
- Pouliasis et al. (2024) Pouliasis, E., Ruiz, A., Georgantopoulos, I., et al. 2024, A&A, 685, A97
- Raichoor & Andreon (2014) Raichoor, A. & Andreon, S. 2014, A&A, 570, A123
- Rihtaršič et al. (2024) Rihtaršič, G., Biffi, V., Fabjan, D., & Dolag, K. 2024, A&A, 683, A57
- Rodriguez-Gomez et al. (2019) Rodriguez-Gomez, V., Snyder, G. F., Lotz, J. M., et al. 2019, MNRAS, 483, 4140
- Ruderman & Ebeling (2005) Ruderman, J. T. & Ebeling, H. 2005, ApJ, 623, L81
- Sabater et al. (2013) Sabater, J., Best, P. N., & Argudo-Fernández, M. 2013, MNRAS, 430, 638
- Sabater et al. (2012) Sabater, J., Verdes-Montenegro, L., Leon, S., Best, P., & Sulentic, J. 2012, A&A, 545, A15
- Salpeter (1955) Salpeter, E. E. 1955, ApJ, 121, 161
- Schawinski et al. (2009) Schawinski, K., Lintott, C. J., Thomas, D., et al. 2009, ApJ, 690, 1672
- Schreiber et al. (2016) Schreiber, C., Elbaz, D., Pannella, M., et al. 2016, A&A, 589, A35
- Schreiber et al. (2015) Schreiber, C., Pannella, M., Elbaz, D., et al. 2015, A&A, 575, A74
- Sengupta et al. (2022) Sengupta, A., Keel, W. C., Morrison, G., et al. 2022, ApJS, 258, 32
- Shimakawa et al. (2022) Shimakawa, R., Tanaka, M., Bottrell, C., et al. 2022, PASJ, 74, 612
- Silk & Rees (1998) Silk, J. & Rees, M. J. 1998, A&A, 331, L1
- Silva et al. (2021) Silva, A., Marchesini, D., Silverman, J. D., et al. 2021, ApJ, 909, 124
- Silverman et al. (2008) Silverman, J. D., Green, P. J., Barkhouse, W. A., et al. 2008, ApJ, 679, 118
- Sorrentino et al. (2006) Sorrentino, G., Radovich, M., & Rifatto, A. 2006, A&A, 451, 809
- Speagle et al. (2014) Speagle, J. S., Steinhardt, C. L., Capak, P. L., & Silverman, J. D. 2014, ApJS, 214, 15
- Springel et al. (2005) Springel, V., Di Matteo, T., & Hernquist, L. 2005, MNRAS, 361, 776
- Stalevski et al. (2012) Stalevski, M., Fritz, J., Baes, M., Nakos, T., & Popović, L. Č. 2012, MNRAS, 420, 2756
- Stalevski et al. (2016) Stalevski, M., Ricci, C., Ueda, Y., et al. 2016, MNRAS, 458, 2288
- Steffen et al. (2023) Steffen, J. L., Fu, H., Brownstein, J. R., et al. 2023, ApJ, 942, 107
- Storchi-Bergmann & Schnorr-Müller (2019) Storchi-Bergmann, T. & Schnorr-Müller, A. 2019, Nature Astronomy, 3, 48
- Stroe et al. (2020) Stroe, A., Hussaini, M., Husemann, B., Sobral, D., & Tremblay, G. 2020, ApJ, 905, L22
- Stroe & Sobral (2021) Stroe, A. & Sobral, D. 2021, ApJ, 912, 55
- Taylor (2005) Taylor, M. B. 2005, in Astronomical data analysis software and systems XIV, Vol. 347, 29
- Toba et al. (2024) Toba, Y., Hashiguchi, A., Ota, N., et al. 2024, ApJ, 967, 65
- Treu et al. (2003) Treu, T., Ellis, R. S., Kneib, J.-P., et al. 2003, ApJ, 591, 53
- Vito et al. (2024) Vito, F., Brandt, W. N., Comastri, A., et al. 2024, A&A, 689, A130
- Whitaker et al. (2012) Whitaker, K. E., van Dokkum, P. G., Brammer, G., & Franx, M. 2012, ApJ, 754, L29
- Yang et al. (2022) Yang, G., Boquien, M., Brandt, W. N., et al. 2022, ApJ, 927, 192
- Yang et al. (2020) Yang, G., Boquien, M., Buat, V., et al. 2020, MNRAS, 491, 740
- Yang et al. (2023) Yang, G., Caputi, K. I., Papovich, C., et al. 2023, ApJ, 950, L5
- Zubovas & King (2012) Zubovas, K. & King, A. R. 2012, MNRAS, 426, 2751
Appendix A Inventory of host galaxies of X-ray detected AGN in clusters
Table LABEL:table:list provides a list of the 82 X-ray detected AGN in our cluster sample, while Fig. LABEL:fig:mosaic1 display their colour images.
| Cluster name | source name | RA (J2000) | Dec (J2000) | spec/phot | host | Spectral | ||
| XLSSC | 4XLSSU | degrees | degrees | morphology | type | |||
| (1) | (2) | (3) | (4) | (5) | (6) | (7) | (8) | (9) |
| 025 | 1 | J022521.1-043950 | 36.337835 | -4.663836 | spec | 0.265 | E | NL |
| 030 | 1 | J022310.5-041249 | 35.795024 | -4.214393 | spec | 0.626 | M | ALG |
| 040 | 1 | J022206.2-043251 | 35.523711 | -4.546156 | spec | 0.323 | E | ALG |
| 080 | 1 | J021819.1-052343 | 34.579399 | -5.396029 | spec | 0.647 | E | ALG |
| 082 | 1 | J021046.1-060854 | 32.692832 | -6.148447 | spec | 0.428 | E | NL |
| 091 | 1 | J023147.2-045702 | 37.947556 | -4.950985 | spec | 0.190 | M | NL |
| 111 | 1 | J021234.2-053545 | 33.142287 | -5.595251 | spec | 0.302 | S | NL |
| 114 | 1 | J020139.1-050118 | 30.413549 | -5.021844 | spec | 0.231 | E | BL |
| 117 | 1 | J021235.9-053210 | 33.14998 | -5.536541 | spec | 0.299 | E | BL |
| 142 | 1 | J021856.0-052611 | 34.733459 | -5.435817 | spec | 0.448 | E | U |
| 168 | 1 | J022935.0-055210 | 37.396398 | -5.869275 | spec | 0.293 | U | QSO BL |
| 183 | 1 | J022016.9-045645 | 35.070248 | -4.946167 | spec | 0.517 | E | NL |
| 187 | 1 | J021631.8-042958 | 34.132286 | -4.499856 | spec | 0.454 | E | ALG |
| 194 | 1 | J021648.5-043318 | 34.202471 | -4.555327 | spec | 0.41 | S/tidal | NL |
| 040 | 2 | J022206.5-042909 | 35.52714 | -4.485877 | spec | 0.315 | E | ALG |
| 049 | 2 | J022347.1-043346 | 35.946002 | -4.563383 | spec | 0.49 | D | NL |
| 071 | 2 | J022238.1-050100 | 35.659184 | -5.016476 | phot | 0.87 | E | - |
| 071 | 2 | J022236.1-050143 | 35.650138 | -5.027919 | spec | 0.844 | D | NL |
| 083 | 2 | J021035.8-061027 | 32.649452 | -6.17388 | spec | 0.433 | E | NL |
| 089 | 2 | J022832.6-044608 | 37.134301 | -4.768676 | phot | 0.60 | E | - |
| 097 | 2 | J021325.6-060329 | 33.357639 | -6.058701 | spec | 0.694 | U | U |
| 101 | 2 | J020838.3-042511 | 32.15988 | -4.419889 | spec | 0.753 | E | NL |
| 105 | 2 | J023324.9-053106 | 38.35469 | -5.517847 | spec | 0.436 | M | NL |
| 107 | 2 | J020534.3-073708 | 31.392291 | -7.618196 | phot | 0.43 | no HSC | - |
| 110 | 2 | J021413.9-053405 | 33.557274 | -5.568639 | phot | 0.440 | no HSC | NL |
| 116 | 2 | J021047.8-060354 | 32.699967 | -6.064865 | phot | 0.53 | E | - |
| 130 | 2 | J022053.8-052538 | 35.224761 | -5.42698 | phot | 0.54 | E | - |
| 156 | 2 | J020305.0-070948 | 30.771721 | -7.163623 | phot | 0.33 | D/tidal | - |
| 158 | 2 | J021118.8-042516 | 32.828806 | -4.422185 | spec | 0.445 | S/D | BL |
| 048 | 3 | J022236.1-032639 | 35.651316 | -3.444693 | spec | 1.008 | E | NL |
| 083 | 3 | J021117.5-061916 | 32.825396 | -6.320064 | phot | 0.43 | E | - |
| 083 | 3 | J021052.9-061809 | 32.721253 | -6.302944 | spec | 0.423 | E | NL |
| 085 | 3 | J021125.7-061936 | 32.858153 | -6.327543 | phot | 0.42 | U | - |
| 085 | 3 | J021153.7-061033 | 32.974242 | -6.177046 | spec | 0.420 | E | U |
| 101 | 3 | J020853.8-042937 | 32.225226 | -4.493658 | phot | 0.75 | E | - |
| 139 | 3 | J021649.4-032831 | 34.206554 | -3.474726 | phot | 0.21 | E/tidal | - |
| 157 | 3 | J020336.4-070010 | 30.901106 | -7.003745 | phot | 0.59 | E | - |
| 159 | 3 | J020919.5-051152 | 32.329839 | -5.198636 | spec | 0.612 | M | NL |
| 163 | 3 | J021007.1-060459 | 32.529514 | -6.083835 | spec | 0.282 | E | NL |
| 172 | 3 | J020613.0-054957 | 31.554222 | -5.832453 | phot | 0.43 | E | - |
| 183 | 3 | J022029.8-044657 | 35.123919 | -4.782901 | phot | 0.51 | E/D | - |
| 200 | 3 | J020115.4-064331 | 30.314141 | -6.725744 | phot | 0.32 | E | - |
| 001 | 4 | J022445.4-035509 | 36.188901 | -3.919289 | spec | 0.605 | U | QSO BL |
| 003 | 4 | J022750.3-032106 | 36.958818 | -3.352099 | phot | 0.84 | U | - |
| 008 | 4 | J022519.4-035444 | 36.331233 | -3.912253 | spec | 0.299 | ring/D | BL |
| 011 | 4 | J022700.7-042022 | 36.753235 | -4.339044 | spec | 0.053 | E | NL |
| 018 | 4 | J022430.5-050842 | 36.127355 | -5.144935 | spec | 0.322 | S/tidal | NL |
| 029 | 4 | J022418.9-041316 | 36.078919 | -4.221791 | spec | 1.057 | E | U |
| 030 | 4 | J022254.3-041629 | 35.725574 | -4.274752 | spec | 0.63 | E | NL |
| 056 | 4 | J021537.1-045005 | 33.904892 | -4.834451 | spec | 0.350 | E | ALG |
| 064 | 4 | J021818.4-045843 | 34.576028 | -4.978517 | phot | 0.87 | E | - |
| 067 | 4 | J021835.9-053758 | 34.649637 | -5.632743 | spec | 0.387 | E | BL |
| 071 | 4 | J022255.1-045328 | 35.730888 | -4.891314 | phot | 0.83 | E/U | - |
| 077 | 4 | J021731.0-032444 | 34.380138 | -3.41251 | phot | 0.20 | S | - |
| 078 | 4 | J021616.8-045033 | 34.069856 | -4.842637 | spec | 0.959 | E/M | NL |
| 078 | 4 | J021610.6-045232 | 34.044313 | -4.874921 | spec | 0.956 | E/D | NL |
| 091 | 4 | J023138.0-051420 | 37.908463 | -5.238549 | spec | 0.187 | E | NL |
| 093 | 4 | J020629.7-064905 | 31.624312 | -6.81841 | phot | 0.42 | E | - |
| 093 | 4 | J020614.4-065635 | 31.561428 | -6.94357 | phot | 0.43 | U | - |
| 097 | 4 | J021304.4-060037 | 33.268811 | -6.009716 | phot | 0.69 | E | - |
| 104 | 4 | J022841.1-055724 | 37.171036 | -5.956224 | spec | 0.297 | E | ALG |
| 106 | 4 | J020516.2-055230 | 31.317255 | -5.875662 | spec | 0.295 | E | NL |
| 107 | 4 | J020553.3-073743 | 31.473609 | -7.627636 | phot | 0.43 | no HSC | |
| 109 | 4 | J020909.6-062617 | 32.289923 | -6.437786 | phot | 0.49 | E | - |
| 109 | 4 | J020930.7-062542 | 32.378151 | -6.428463 | phot | 0.49 | E | - |
| 110 | 4 | J021353.0-053917 | 33.470966 | -5.655553 | phot | 0.45 | E | - |
| 116 | 4 | J020954.7-060712 | 32.479197 | -6.120809 | phot | 0.53 | U | - |
| 124 | 4 | J021759.0-045551 | 34.496463 | -4.931106 | spec | 0.506 | E/tidal | ALG |
| 128 | 4 | J022342.4-030411 | 35.927244 | -3.069659 | phot | 0.48 | E | - |
| 135 | 4 | J021453.6-035929 | 33.724019 | -3.991403 | phot | 0.37 | U | - |
| 137 | 4 | J021815.7-034141 | 34.565714 | -3.694404 | phot | 0.29 | U | - |
| 149 | 4 | J022959.9-045716 | 37.498909 | -4.954494 | spec | 0.286 | U | NL |
| 158 | 4 | J021144.9-041843 | 32.937205 | -4.311633 | phot | 0.44 | E/D | - |
| 158 | 4 | J021043.2-042509 | 32.679161 | -4.420212 | phot | 0.45 | E | - |
| 169 | 4 | J023044.0-053605 | 37.68341 | -5.601003 | phot | 0.49 | S | - |
| 169 | 4 | J023007.4-054902 | 37.530904 | -5.81804 | phot | 0.49 | E | - |
| 182 | 4 | J022542.5-032024 | 36.426675 | -3.340322 | spec | 0.170 | E | BL |
| 183 | 4 | J021922.3-045943 | 34.844415 | -4.995945 | phot | 0.51 | E | - |
| 183 | 4 | J021921.5-045838 | 34.840431 | -4.977854 | spec | 0.512 | E | U |
| 184 | 4 | J022115.7-040901 | 35.315354 | -4.150097 | phot | 0.81 | U | - |
| 187 | 4 | J021543.7-042456 | 33.932907 | -4.414839 | spec | 0.457 | E | ALG |
| 199 | 4 | J020019.5-064750 | 30.082133 | -6.797771 | phot | 0.33 | E | - |
| J022521 | J022310 | J022206 | J021819 | J021046 | J023147 |
![[Uncaptioned image]](/html/2504.03422/assets/x1.png)
|
![[Uncaptioned image]](/html/2504.03422/assets/x2.png) |
![[Uncaptioned image]](/html/2504.03422/assets/x3.png) |
![[Uncaptioned image]](/html/2504.03422/assets/x4.png) |
![[Uncaptioned image]](/html/2504.03422/assets/x5.png) |
![[Uncaptioned image]](/html/2504.03422/assets/x6.png) |
| J021234 | J020139 | J021235 | J021856 | J022935 | J022016 |
![[Uncaptioned image]](/html/2504.03422/assets/x7.png)
|
![[Uncaptioned image]](/html/2504.03422/assets/x8.png) |
![[Uncaptioned image]](/html/2504.03422/assets/x9.png) |
![[Uncaptioned image]](/html/2504.03422/assets/x10.png) |
![[Uncaptioned image]](/html/2504.03422/assets/x11.png) |
![[Uncaptioned image]](/html/2504.03422/assets/x12.png) |
| J021631 | J021648 | J022206 | J022347 | J022238 | J022236 |
![[Uncaptioned image]](/html/2504.03422/assets/x13.png)
|
![[Uncaptioned image]](/html/2504.03422/assets/x14.png) |
![[Uncaptioned image]](/html/2504.03422/assets/x15.png) |
![[Uncaptioned image]](/html/2504.03422/assets/x16.png) |
![[Uncaptioned image]](/html/2504.03422/assets/x17.png) |
![[Uncaptioned image]](/html/2504.03422/assets/x18.png) |
| J021035 | J022832 | J021325 | 020838 | J023324 | J021047 |
![[Uncaptioned image]](/html/2504.03422/assets/x19.png)
|
![[Uncaptioned image]](/html/2504.03422/assets/x20.png) |
![[Uncaptioned image]](/html/2504.03422/assets/x21.png) |
![[Uncaptioned image]](/html/2504.03422/assets/x22.png) |
![[Uncaptioned image]](/html/2504.03422/assets/x23.png) |
![[Uncaptioned image]](/html/2504.03422/assets/x24.png) |
| J022053 | J020305 | J021118 | J022236 | J021117 | J021052 |
![[Uncaptioned image]](/html/2504.03422/assets/x25.png)
|
![[Uncaptioned image]](/html/2504.03422/assets/x26.png) |
![[Uncaptioned image]](/html/2504.03422/assets/x27.png) |
![[Uncaptioned image]](/html/2504.03422/assets/x28.png) |
![[Uncaptioned image]](/html/2504.03422/assets/x29.png) |
![[Uncaptioned image]](/html/2504.03422/assets/x30.png) |
| J021125 | J021153 | J020853 | J021649 | J020336 | J020919 |
![[Uncaptioned image]](/html/2504.03422/assets/x31.png)
|
![[Uncaptioned image]](/html/2504.03422/assets/x32.png) |
![[Uncaptioned image]](/html/2504.03422/assets/x33.png) |
![[Uncaptioned image]](/html/2504.03422/assets/x34.png) |
![[Uncaptioned image]](/html/2504.03422/assets/x35.png) |
![[Uncaptioned image]](/html/2504.03422/assets/x36.png) |
| J021007 | J020613 | J022029 | J020115 | J022445 | J022750 |
![[Uncaptioned image]](/html/2504.03422/assets/x37.png)
|
![[Uncaptioned image]](/html/2504.03422/assets/x38.png) |
![[Uncaptioned image]](/html/2504.03422/assets/x39.png) |
![[Uncaptioned image]](/html/2504.03422/assets/x40.png) |
![[Uncaptioned image]](/html/2504.03422/assets/x41.png) |
![[Uncaptioned image]](/html/2504.03422/assets/x42.png) |
| J022519 | J2022700 | J022430 | J022418 | J022254 | J021537 |
![[Uncaptioned image]](/html/2504.03422/assets/x43.png)
|
![[Uncaptioned image]](/html/2504.03422/assets/x44.png) |
![[Uncaptioned image]](/html/2504.03422/assets/x45.png) |
![[Uncaptioned image]](/html/2504.03422/assets/x46.png) |
![[Uncaptioned image]](/html/2504.03422/assets/x47.png) |
![[Uncaptioned image]](/html/2504.03422/assets/x48.png) |
| J021818 | J021835 | J022255 | J021731 | J021616 | J021610 |
![[Uncaptioned image]](/html/2504.03422/assets/x49.png)
|
![[Uncaptioned image]](/html/2504.03422/assets/x50.png) |
![[Uncaptioned image]](/html/2504.03422/assets/x51.png) |
![[Uncaptioned image]](/html/2504.03422/assets/x52.png) |
![[Uncaptioned image]](/html/2504.03422/assets/x53.png) |
![[Uncaptioned image]](/html/2504.03422/assets/x54.png) |
| J023138 | J020629 | J020614 | J021304 | J022841 | J020516 |
![[Uncaptioned image]](/html/2504.03422/assets/x55.png)
|
![[Uncaptioned image]](/html/2504.03422/assets/x56.png) |
![[Uncaptioned image]](/html/2504.03422/assets/x57.png) |
![[Uncaptioned image]](/html/2504.03422/assets/x58.png) |
![[Uncaptioned image]](/html/2504.03422/assets/x59.png) |
![[Uncaptioned image]](/html/2504.03422/assets/x60.png) |
| J020909 | J020930 | J021353 | J020954 | J021759 | J022342 |
![[Uncaptioned image]](/html/2504.03422/assets/x61.png)
|
![[Uncaptioned image]](/html/2504.03422/assets/x62.png) |
![[Uncaptioned image]](/html/2504.03422/assets/x63.png) |
![[Uncaptioned image]](/html/2504.03422/assets/x64.png) |
![[Uncaptioned image]](/html/2504.03422/assets/x65.png) |
![[Uncaptioned image]](/html/2504.03422/assets/x66.png) |
| J021453 | J021815 | J022959 | J021144 | J021043 | J023044 |
![[Uncaptioned image]](/html/2504.03422/assets/x67.png)
|
![[Uncaptioned image]](/html/2504.03422/assets/x68.png) |
![[Uncaptioned image]](/html/2504.03422/assets/x69.png) |
![[Uncaptioned image]](/html/2504.03422/assets/x70.png) |
![[Uncaptioned image]](/html/2504.03422/assets/x71.png) |
![[Uncaptioned image]](/html/2504.03422/assets/x72.png) |
| J023007 | J022542 | J021922 | J021921 | J022115 | J021543 |
![[Uncaptioned image]](/html/2504.03422/assets/x73.png)
|
![[Uncaptioned image]](/html/2504.03422/assets/x74.png) |
![[Uncaptioned image]](/html/2504.03422/assets/x75.png) |
![[Uncaptioned image]](/html/2504.03422/assets/x76.png) |
![[Uncaptioned image]](/html/2504.03422/assets/x77.png) |
![[Uncaptioned image]](/html/2504.03422/assets/x78.png) |
| J020019. | |||||
![[Uncaptioned image]](/html/2504.03422/assets/x79.png)
|
Appendix B The case of spiral galaxies
In this section, we focus specifically on the spiral host galaxies of X-ray AGN in clusters, comparing them with the spiral galaxy population in the control samples. We categorised them into two types: passive (red) and active (blue). The colours were defined using HSC photometric magnitudes. We define a galaxy as red and thus passive when ¿ 0.5 (Daoutis et al. 2023; Shimakawa et al. 2022). Passive spiral galaxies are characterised by a lack of star formation, in sharp contrast to active spiral galaxies (Shimakawa et al. 2022), which are also the vast majority. Our results are presented in Fig. 15. Despite the limited number of spiral host cases, we observe a clear trend in the results. Specifically, in the main sample of X-ray AGN in clusters, all spiral hosts are passive, whereas in the field, active hosts dominate. We also examined the spiral host galaxies in the control sample of cluster galaxies, finding mostly passive cases with only a few active ones. Additionally, we reviewed the SFR of our sample galaxies using their SED, as described in Sect. 3.2.3. Because of the low number of spiral hosts, we use all derived SEDs even if . The results confirm the low-level of star forming activity (average SFR /yr) in the spiral galaxies of our sample.
This is likely a consequence of environmental processes such as ram pressure stripping. Quenching mechanisms probably suppress star formation more rapidly than the time needed for morphological transformation through bulge growth and disc fading (e.g. Kelkar et al. 2019; Martínez et al. 2022; Oxland et al. 2024). These results suggest that the conditions within clusters, including interactions with other galaxies and the intracluster medium, play a significant role in quenching star formation and rendering these spiral hosts inactive.
We conclude that all spiral X-ray AGN hosts within clusters are passive in terms of star formation, as defined by colour or SED analysis. This is also true for the majority of non-AGN spiral cluster galaxies, but opposite from what we observe in the field. Although the number of spiral hosts is small, we argue that this is likely a result of ram pressure stripping.
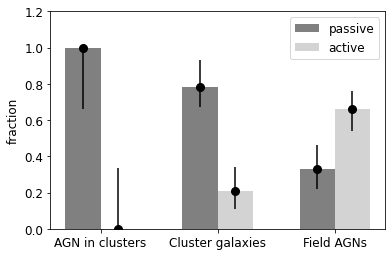
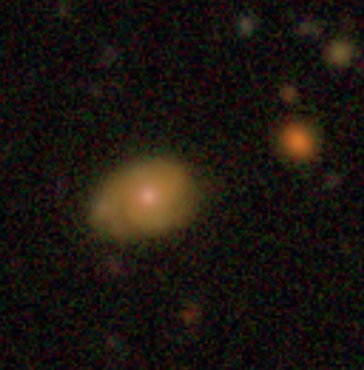
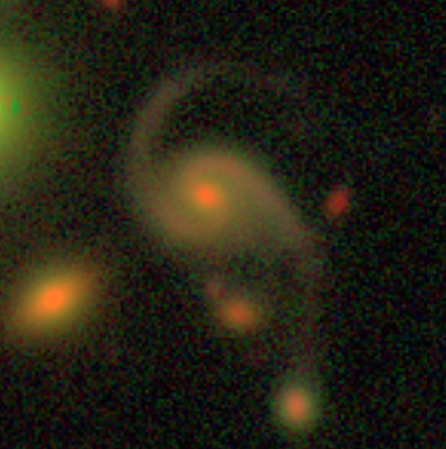
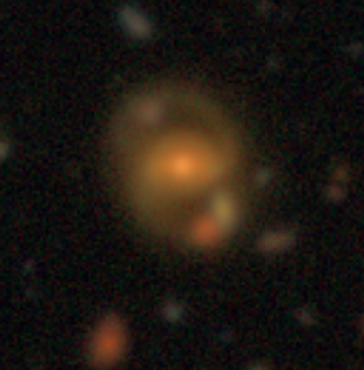
Appendix C SFR-stellar mass relation of AGN in clusters
In this section we explore the SFR-stellar mass relation of our sources relative to the main sequence (MS) of the star-forming galaxies. Star-forming galaxies show a tight correlation between their stellar mass (M∗) and SFRs, known as the MS of star-forming galaxies (e.g., Whitaker et al. 2012; Speagle et al. 2014; Schreiber et al. 2015). This relation is valid through a wide range of redshifts (Schreiber et al. 2016). Hence, we used the SED derived properties of our samples to examine the location of the X-ray AGN with respect to the MS.
In Fig. 17, we plot our sources in the SFR-M∗ plane using the estimated SFR and M∗ values for our three samples, as indicated in the legend. The sources are colour-coded with the accretion power (AP) of the AGN (”agn.accretion.power” derived from CIGALE). It provides the intrinsic (unextinct) luminosity of the AGN disc averaged in all directions (e.g. Yang et al. 2023). We compared the source positions relative to the MS, using for the latter the analytical expression of equation 9 of Schreiber et al. (2015) (dashed line). For this calculation, we used the median redshift of our sample (). The sources that have SFRs within dex from the Schreiber et al. (2015) SFR (dotted lines) are considered to lie within the MS. Using the best SFR and M∗ values, we find that the majority of the sources inside or above the MS (that is about 56% of the full sample) have in general higher AGN accretion power erg/s) compared to those that lie below the MS erg/s). To evaluate whether the sources below and those above or inside the MS come from the same parent distribution, we performed a two-side Kolmogorov-Smirnov (KS) test. The p-value is 0.00053, indicating that the two distributions are different. These results agree with previous studies (e.g. Aird et al. 2019; Pouliasis et al. 2022b) that may indicate that higher accreting SMBHs may reside in host galaxies with enhanced SFR.
In clusters this might be linked to the high frequency of merging and disturbed galaxies. Indeed, we found evidence that host galaxies that are visually identified as disturbed exhibit relatively high values of SFR. This elevated SFR appears to be associated with substantial AP. In more detail, the same hosts that show signs of disturbance, possibly due to interactions or mergers, are also the ones where both vigorous star formation and intense accretion activity are present. This is in agreement with previous results (e.g. Storchi-Bergmann & Schnorr-Müller 2019; Silva et al. 2021; Cezar et al. 2024) and suggests a connection between the dynamic state of these galaxies and their energetic processes, both in forming new stars and in feeding their central black holes.
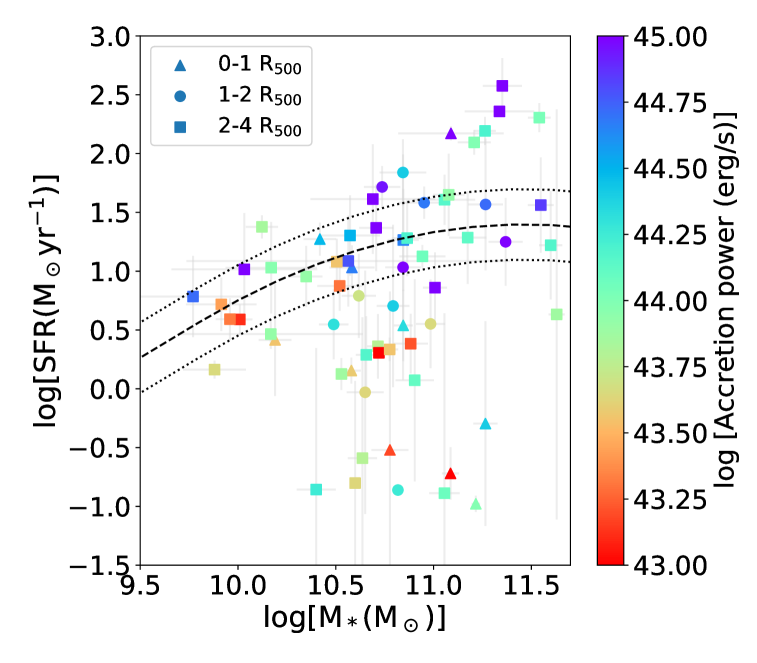
Furthermore, our results revealed that 50% of the sources in the centre of clusters lie inside or above the MS of the star-forming galaxies, while this percentage increases to about 65% in the case of sources in the field.