The HCI GenAI ST Calculator: A Tool for Calculating the Carbon Footprint of Generative AI Use in Human-Computer Interaction Research
Abstract.
Increased usage of generative AI (GenAI) in Human-Computer Interaction (HCI) research induces a climate impact from carbon emissions due to energy consumption of the hardware used to develop and run GenAI models and systems. The exact energy usage and and subsequent carbon emissions are difficult to estimate in HCI research because HCI researchers most often use cloud-based services where the hardware and its energy consumption are hidden from plain view. The HCI GenAI ST Calculator is a tool designed specifically for the HCI research pipeline, to help researchers estimate the energy consumption and carbon footprint of using generative AI in their research, either a priori (allowing for mitigation strategies or experimental redesign) or post hoc (allowing for transparent documentation of carbon footprint in written reports of the research).
1. Introduction and motivation
The extensive use of generative AI (GenAI) models in research worldwide has a significant carbon footprint. In recent years, the electricity use by Meta, Amazon, Microsoft, and Google — main providers of cloud compute services — has more than doubled, and the electricity consumption by global data centers has increased by 20-40% (Luccioni et al., 2024; Hintemann and Hinterholzer, 2022). Irish data centers are on the path to derail the entire country’s climate targets (Ambrose, 2024).
In this paper we present the HCI GenAI ST Calculator: a calculator designed specifically for Human-Computer Interaction (HCI) researchers to estimate the carbon footprint due to electricity consumption of GenAI use in their research. When researchers explore, test, and prototype with GenAI, their use causes additional consumption. Additionally the downstream effects of GenAI being integrated into more systems, processes, and user interactions because of our research is something that the HCI community have a share in responsibility for.
With this calculator, we hope to make two contributions to the HCI community: First, we wish to enable HCI researchers to be fully transparent of their own research and acknowledge their own climate impact. Second, we hope to evoke critical thinking about the importance and necessity of HCI research conducted with the use of GenAI.
2. Background — sustainable HCI and carbon tracking
In 2007, Blevis coined the term Sustainable Interaction Design (SID) and argued that “sustainability can and should be a central focus of interaction design” (Blevis, 2007). This perspective includes the responsible audit of tools we use to conduct our research. The large-scale adoption of GenAI tools is more than likely to contribute to the replication of “our modern society’s overconsumption habits of natural resources within the digital space” (Utz and DiPaola, 2023).
Research on sustainable AI and ML generally fall into two camps: AI and ML for sustainability and sustainability of AI and ML, see e.g. (Lab, 2024; Wright et al., 2023). While a growing number of publications are directed towards AI for the UN Sustainable Development Goals, there is little research addressing the, often hidden, environmental costs of AI (Lab, 2024). These efforts are significantly higher in ML and AI communities than in HCI. For example, because a model’s architecture can affect how much power it consumes (Derczynski, 2020), different more energy-efficient approaches in the IT-infrastructure, data, modeling, training, deployment, and evaluation of ML models have been suggested — see Mehlin et al. (2023); Bartoldson et al. (2023).
Assessing the full climate impact of computing is complex: Environmental impact due to mining for rare earth minerals, green house gas (GHG) emissions due to hardware manufacturing, pollution due to e-waste disposal, and water consumption for cooling are all contributing factors (Strubell et al., 2020). In this work, we focus on energy consumption during development and deployment of GenAI models, which constitutes a substantial share of the overall climate impact of GenAI (Henderson et al., 2020; Anthony et al., 2020), and which is a factor that can be mitigated by the individual researcher.
There are several carbon and energy tracking tools available — Wright and colleagues discuss pros and cons of seven of these (Wright et al., 2023). None of them, however, have the focus of HCI research, and many of their metrics do not make sense in an HCI context (such as choosing the type of hardware used for the computation and the ML tasks performed). Similarly, mitigation strategies directed at the architecture and training of models are rarely relevant to researchers outside ML, who rely on off-the-shelf, multi-purpose models. This exacerbates the sustainability issue for HCI researchers, since multi-purpose, generative architectures (such as the GPT models) are orders of magnitude more expensive than task-specific systems (Luccioni et al., 2024). The lack of transparency from large multi-purpose model providers (such as OpenAI, Microsoft, and Google) about critical data, such as model training and hosting, complicates the issue.
3. The HCI ST Calculator
The HCI ST Calculator is, at its core, a calculator through which the researcher can input how they used GenAI in their research, which model they used, how much they used it, and the calculator will give an estimate of the in kilos, this GenAI research use has cost. The estimate is based on a combination of energy measurements from experiments conducted with publicly available models run on our own hardware (see section 3.4), and a thorough review of how GenAI was used in submissions from the CHI 2024 corpus which used GenAI in some form (Inie et al., 2025). In contrast to existing carbon footprint calculators111E.g., https://mlco2.github.io/impact/
https://www.deloitte.com/uk/en/services/consulting/content/ai-carbon-footprint-calculator.html
https://www.carbonfootprint.com/calculator.aspx
https://genai-impact.org/blog/post-2/, which tend to focus on technical features such as hardware, ML tasks, and world location where the training was performed, the HCI calculator is designed to match the level of detail likely to be relevant to HCI researchers. Since we can not know the exact training and running cost of many of the models, we emphasize that all results are estimates and that calculations err on the conservative side.
3.1. Which information is necessary?
The factors we use to calculate a credible estimate of consumption of model use are: model type, usage numbers, and input/output resolution (depending on the model type). If GenAI is integrated into a prototype or used as part of a user study, we need to know the number of test runs and number of interactions with the system) — an overview is shown in Table 1. However, not all of these factors are relevant to all HCI research pipelines.
| HCI Transparency Factor | Explanation |
|---|---|
| model | Name or type of model (text-to-text, text-to-image, audio-to-text etc.) |
| usage # | Number of prompts, images generated, minutes transcribed etc. |
| resolution | Length of prompts/size of dataset, resolution of images generated |
| If the research involves the integration of GenAI into a prototype or system and/or user tests, further: | |
| # test runs | Number of tests of the system during prototyping or other factors which makes it possible to estimate how many times, the API has been called. |
| # interactions | Number of interactions with the system during the evaluation. |
The table shows two columns entitled Factor and Explanation. The first three rows shows factors which should be considered if the research does not use GenAI as part of a system or prototype. These factors are: Model (this is the name or type of model, such as text-to-text, text-to-image, audio-to-text, etc), usage (this is the number of prompts, images generated, minutes transcribed etc), and resolution (this is the length of prompts or size of the dataset, and resolution of images generated). The last two rows show factors which should be considered if GenAI is integrated into a system. These are number of test runs during prototyping and number of interactions with the system during the evaluation.
The goal is to translate the technical factors affecting the carbon footprint of GenAI use into an interface that makes it easy for an HCI researcher to audit their empirical research. We hypothesize that the categorization imposed by the calculator will prompt reflection about different types uses that might incur st which the researcher had not thought of, such as automatic transcription, automatic proofreading, or the generation of images for slides for a conference presentation.
3.2. Reflecting typical HCI research pipelines
The input fields reflect typical pipelines of HCI research and, for simplicity, some of the inputs are based on averages. For example, when the user records a Literature review and search under the Research planning phase, we do not expect them to count the exact about of characters or words of each of the articles that they have input into a given system. Instead, we assume an average of 6000 words per article, and perform the calculation based on that average. All of these estimates and averages are clarified on the website under Research, and our categorization of GenAI use in different research phases is described in Table 2.
|
Research
Planning |
Prototyping
& Building |
Evaluation
& User studies |
Data Collection |
Analysis
& Synthesis |
Dissemination & Communication |
Training
& Fine-tuning |
|---|---|---|---|---|---|---|
| Description: Where a research subject is selected and a research method is chosen. | Description: Where a product or system is built. | Description: Where a product is evaluated, used, or explored by users. | Description: Where the researcher gathers data for analysis. | Description: Where the researcher makes sense of the data. | Description: Where the results are communicated to the scientific community. | Where GenAI models are made or redesigned specifically for HCI research purposes. |
| Example use: • Identifying research gaps • Generating study materials • Literature search • Study design • CHI workshops and courses | Example use: • Integrating GenAI functionality into prototypes. • Using GenAI to generate code for systems. • Generating content or visuals for a prototype, system, or probe. | Example use: • User evaluation. • User studies. | Example use: • Generating data for exploration of the output. • Generating data for evaluation of the output. • Transcription of audio data. • Simulating human-generated data. | Example use: • Qualitative analysis. • Quantitative analysis. • Data trend identification. | Example use: • Generation of manuscript text. • Generating suggestions for text improvement. • Generating graphics for articles and presentations. | Example use: • Training novel GenAI models. • Fine-tuning existing GenAI models. |
The table shows a seven-stage model of HCI research with examples under each headlines. The columns are: 1. Research planning, which includes: identifying research gaps, generating study materials, literature search, and study design. 2. Prototyping and building, which includes: Integrating GenAI functionality into prototypes, using GenAI to generate code for systems, and generating content or visuals for a prototype, system, or probe. 3. Evaluation and user studies, which includes: Evaluation of prototypes with users, user studies with off-the-shelf GenAI products (such as ChatGPT). 4. Data collection, which includes: Generating data for exploration of the output, generating data for evaluation of the output, transcription of audio data, simulating human-generated data. 5. Analysis and synthesis, which includes: Qualitative analysis, quantitative analysis, and data trend identification. 6. Dissemination and communication, which includes: Generating manuscript text, Generating suggestions for text improvement, and generating graphics for articles and presentations, and 7. Training and fine-tuning, which includes: Training novel GenAI models for HCI research, and fine-tuning existing GenAI models for HCI research.
3.3. Front-end and design
This section explains the front-end design of the calculator module only. For more about the online version, see Section 3.5. Based on Inie et al. (2025), we create a flow that begins with choosing which Research phase the use was part of (Research planning, Prototyping & building, Evaluation & user studies, Data collection, Analysis & synthesis, Dissemination & communication, or AI model training or fine-tuning) (see Table 2 in the appendix for more detail about the research phases). Based on a user’s selection of research phase, the input fields will change to reflect which factors needs to be input to obtain an estimate.
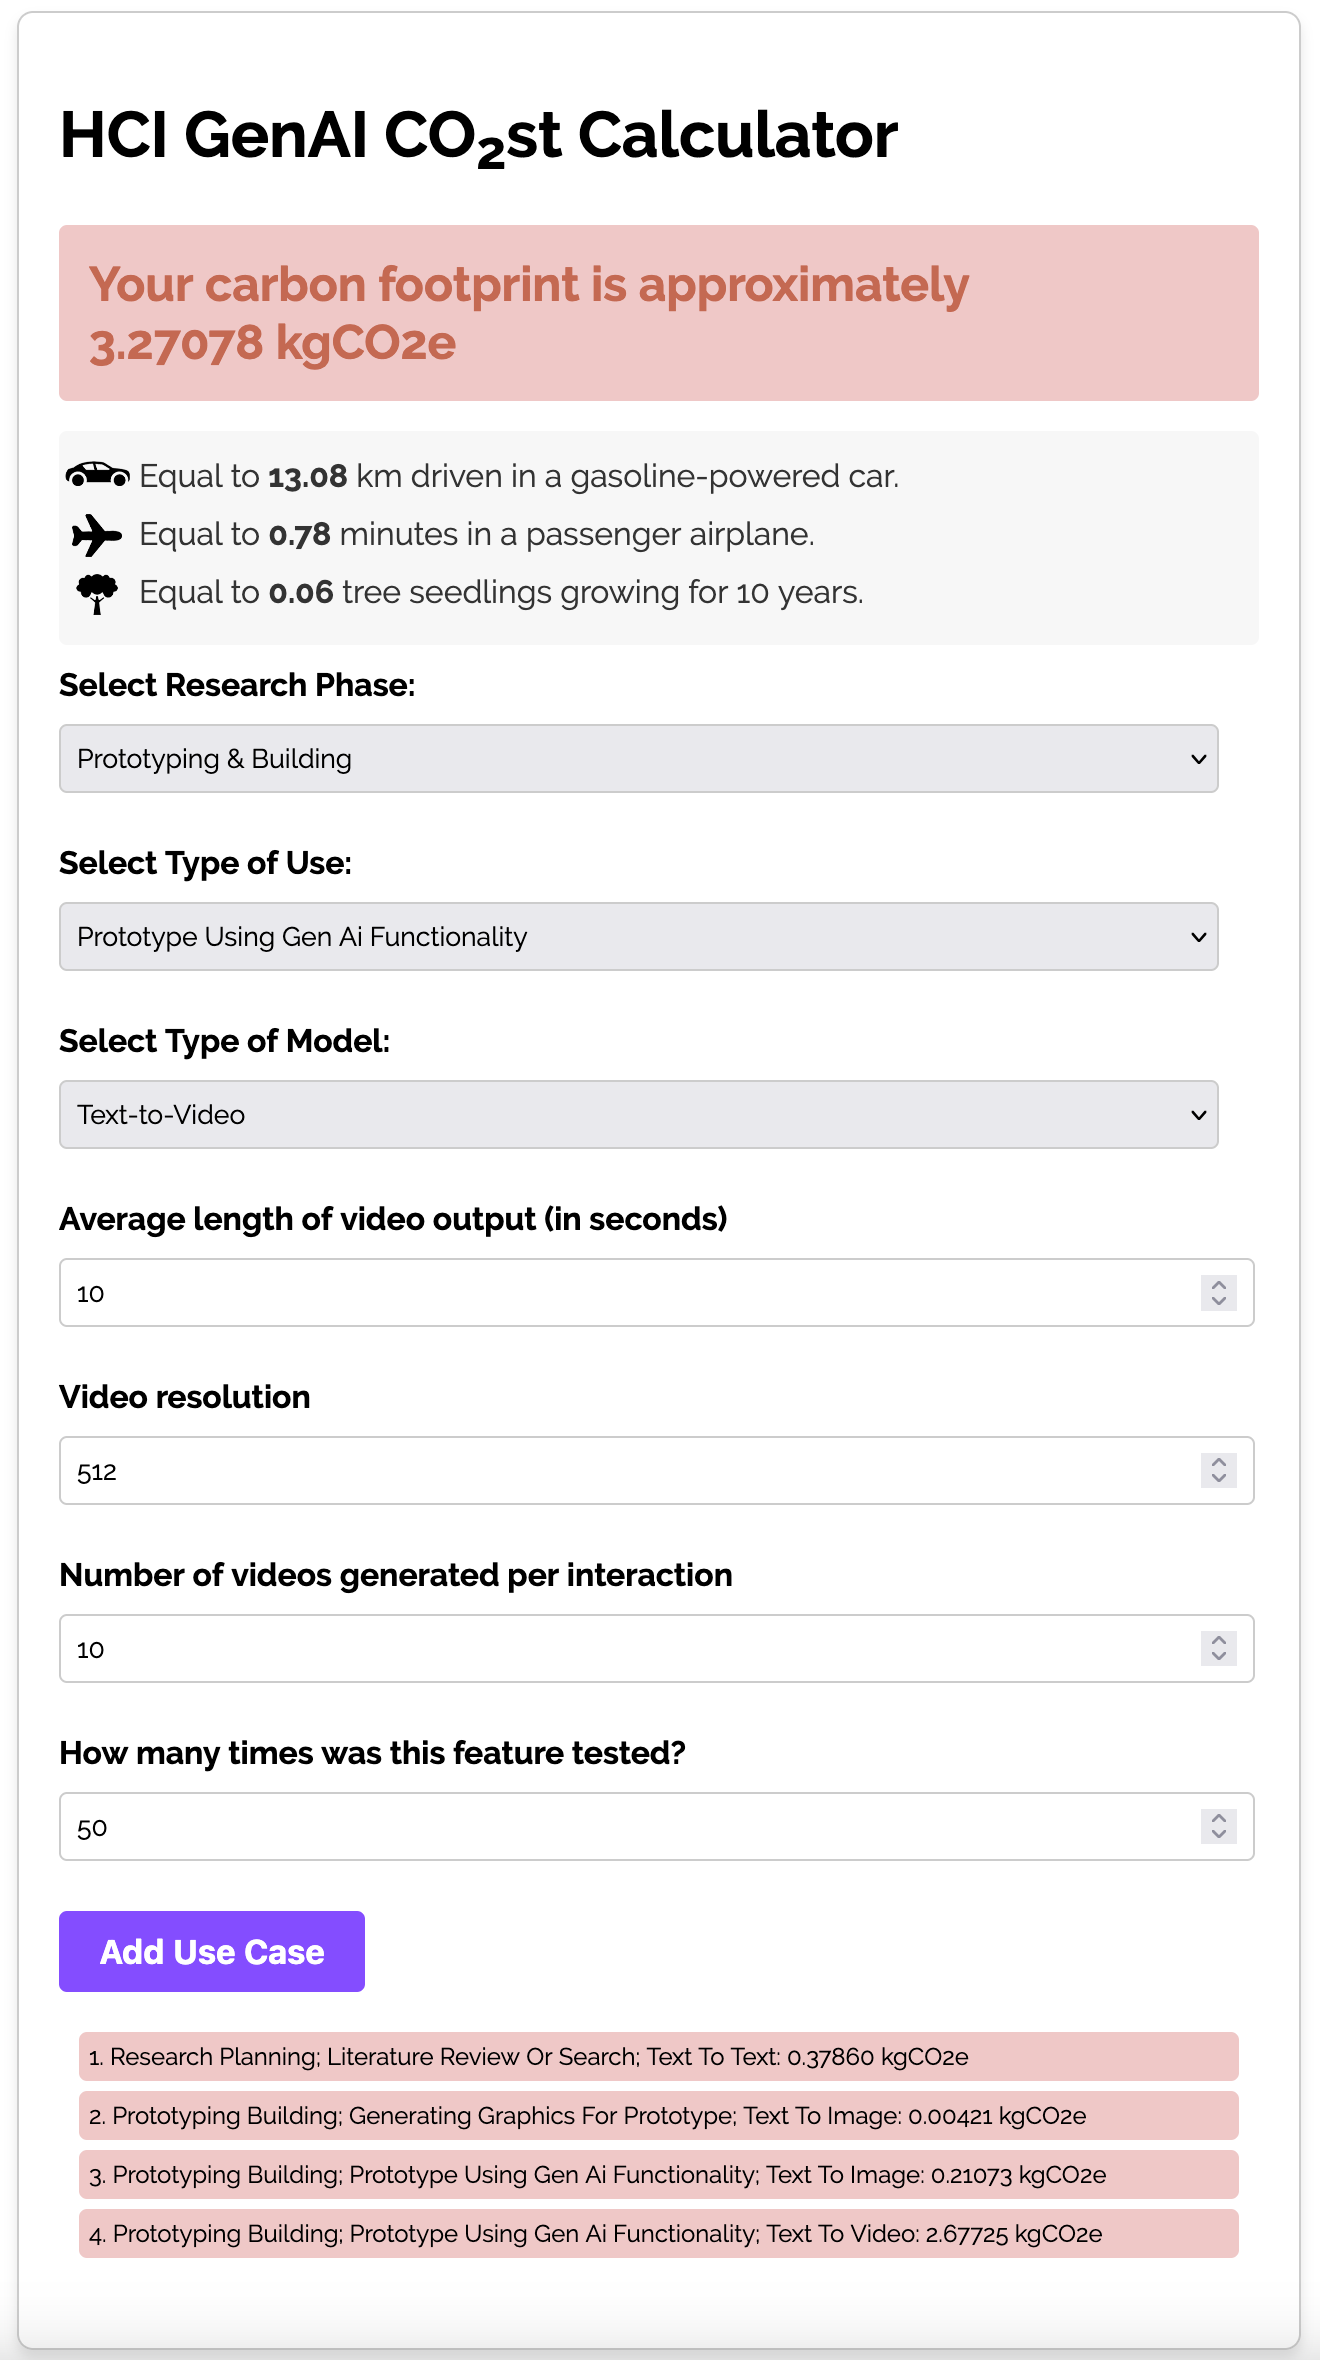
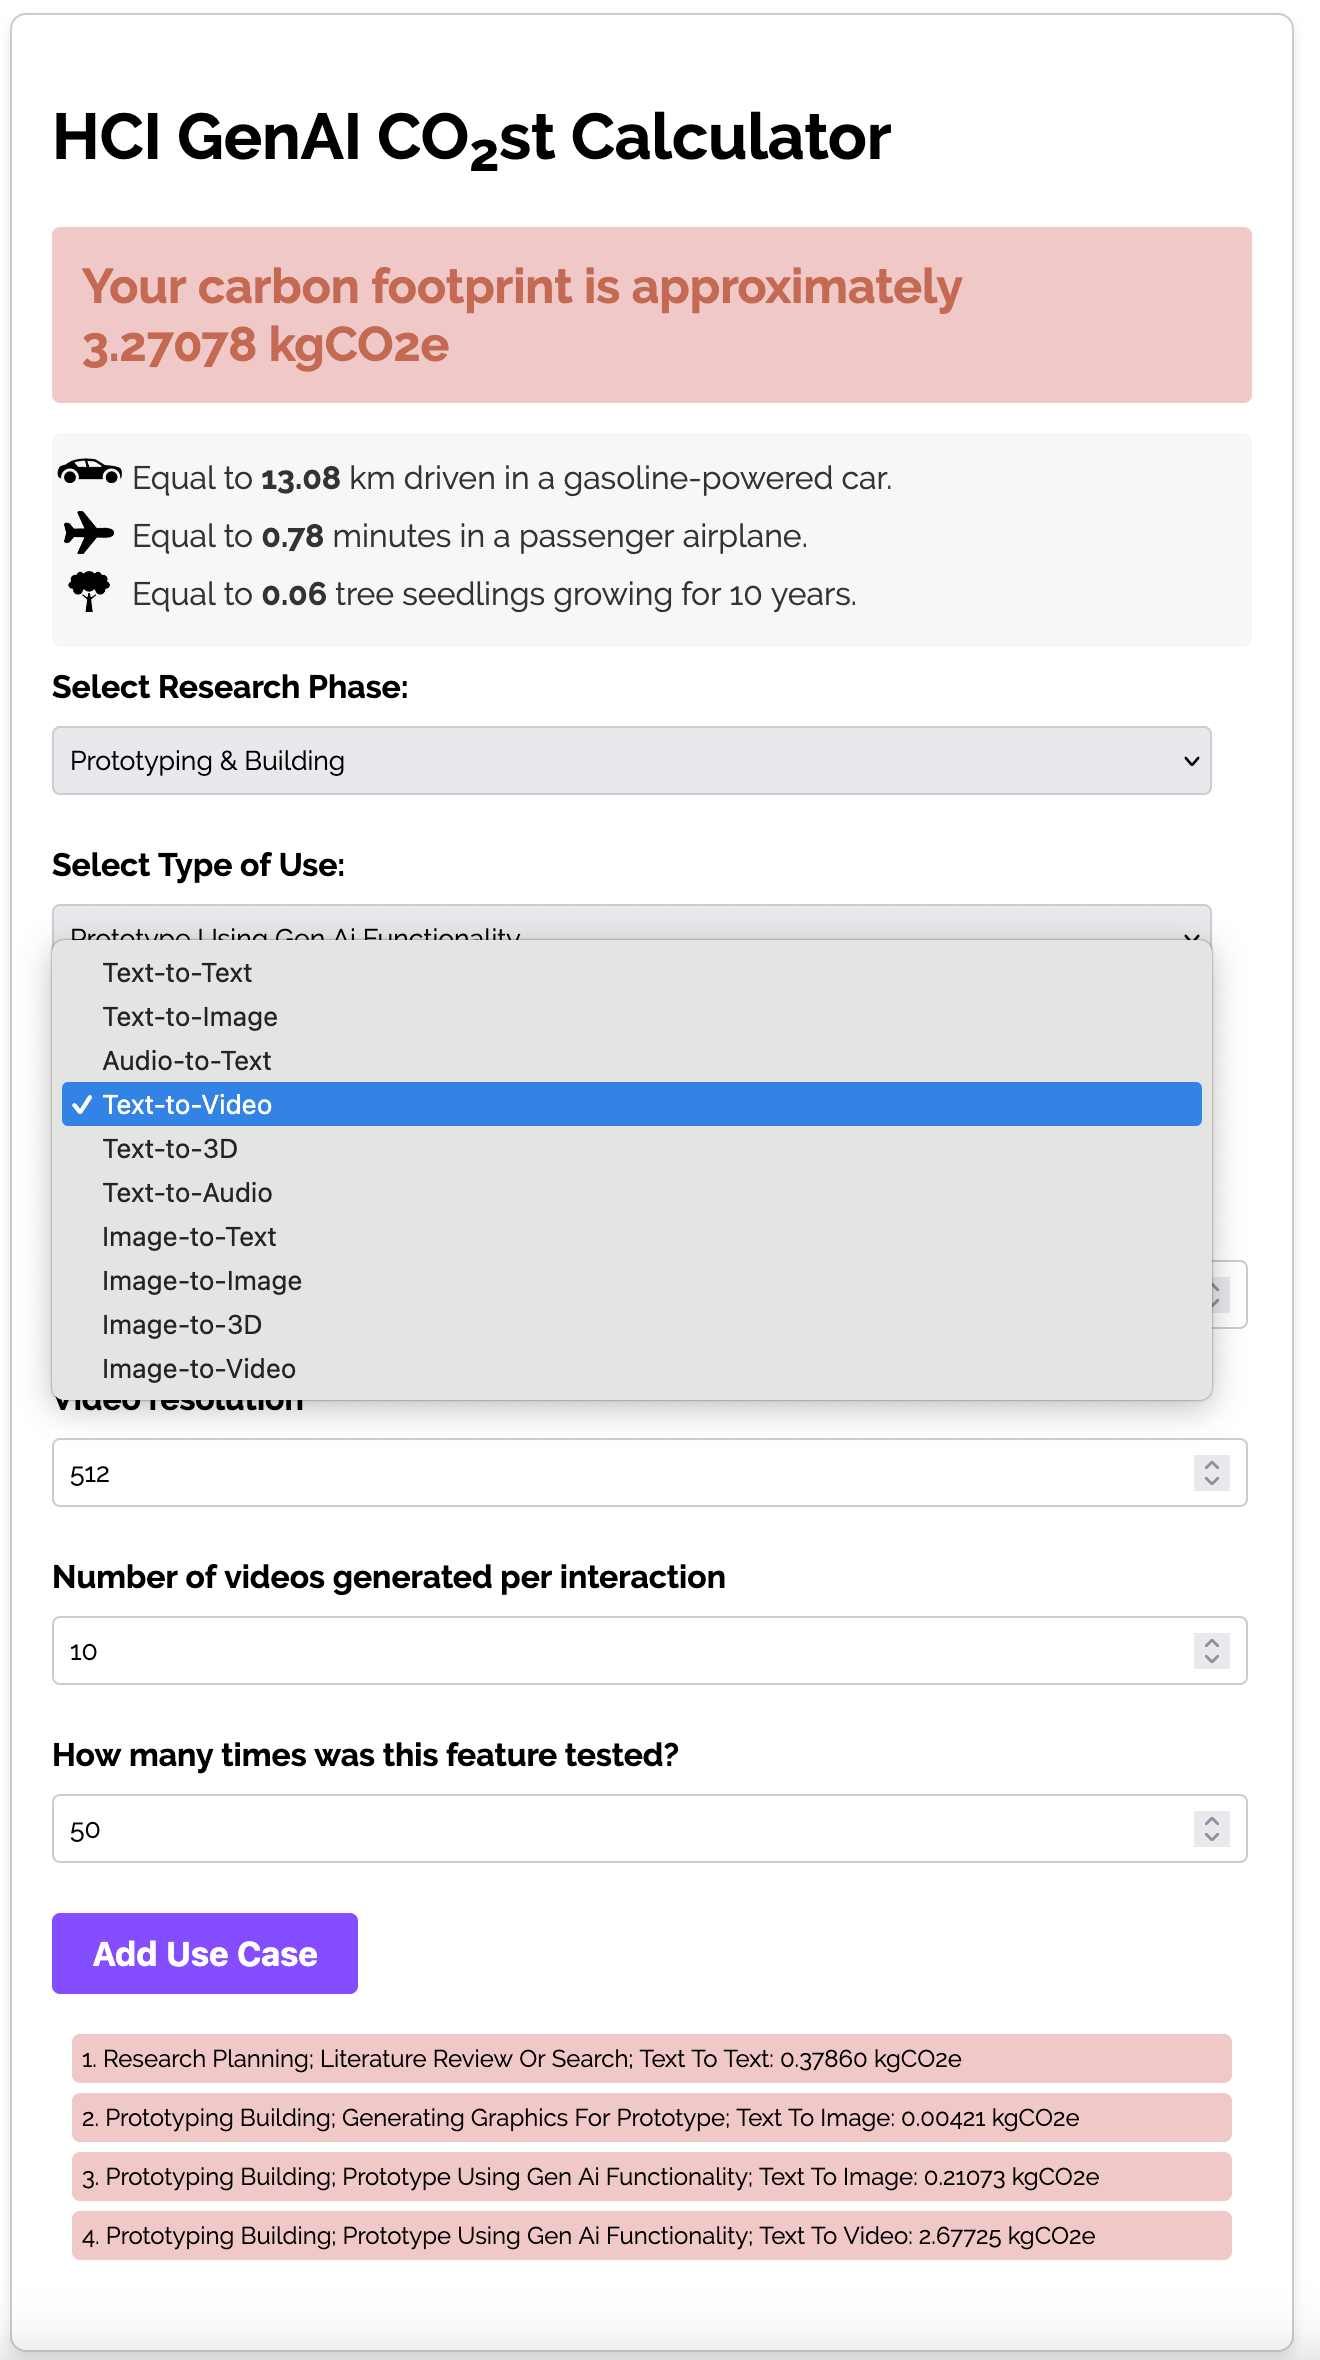
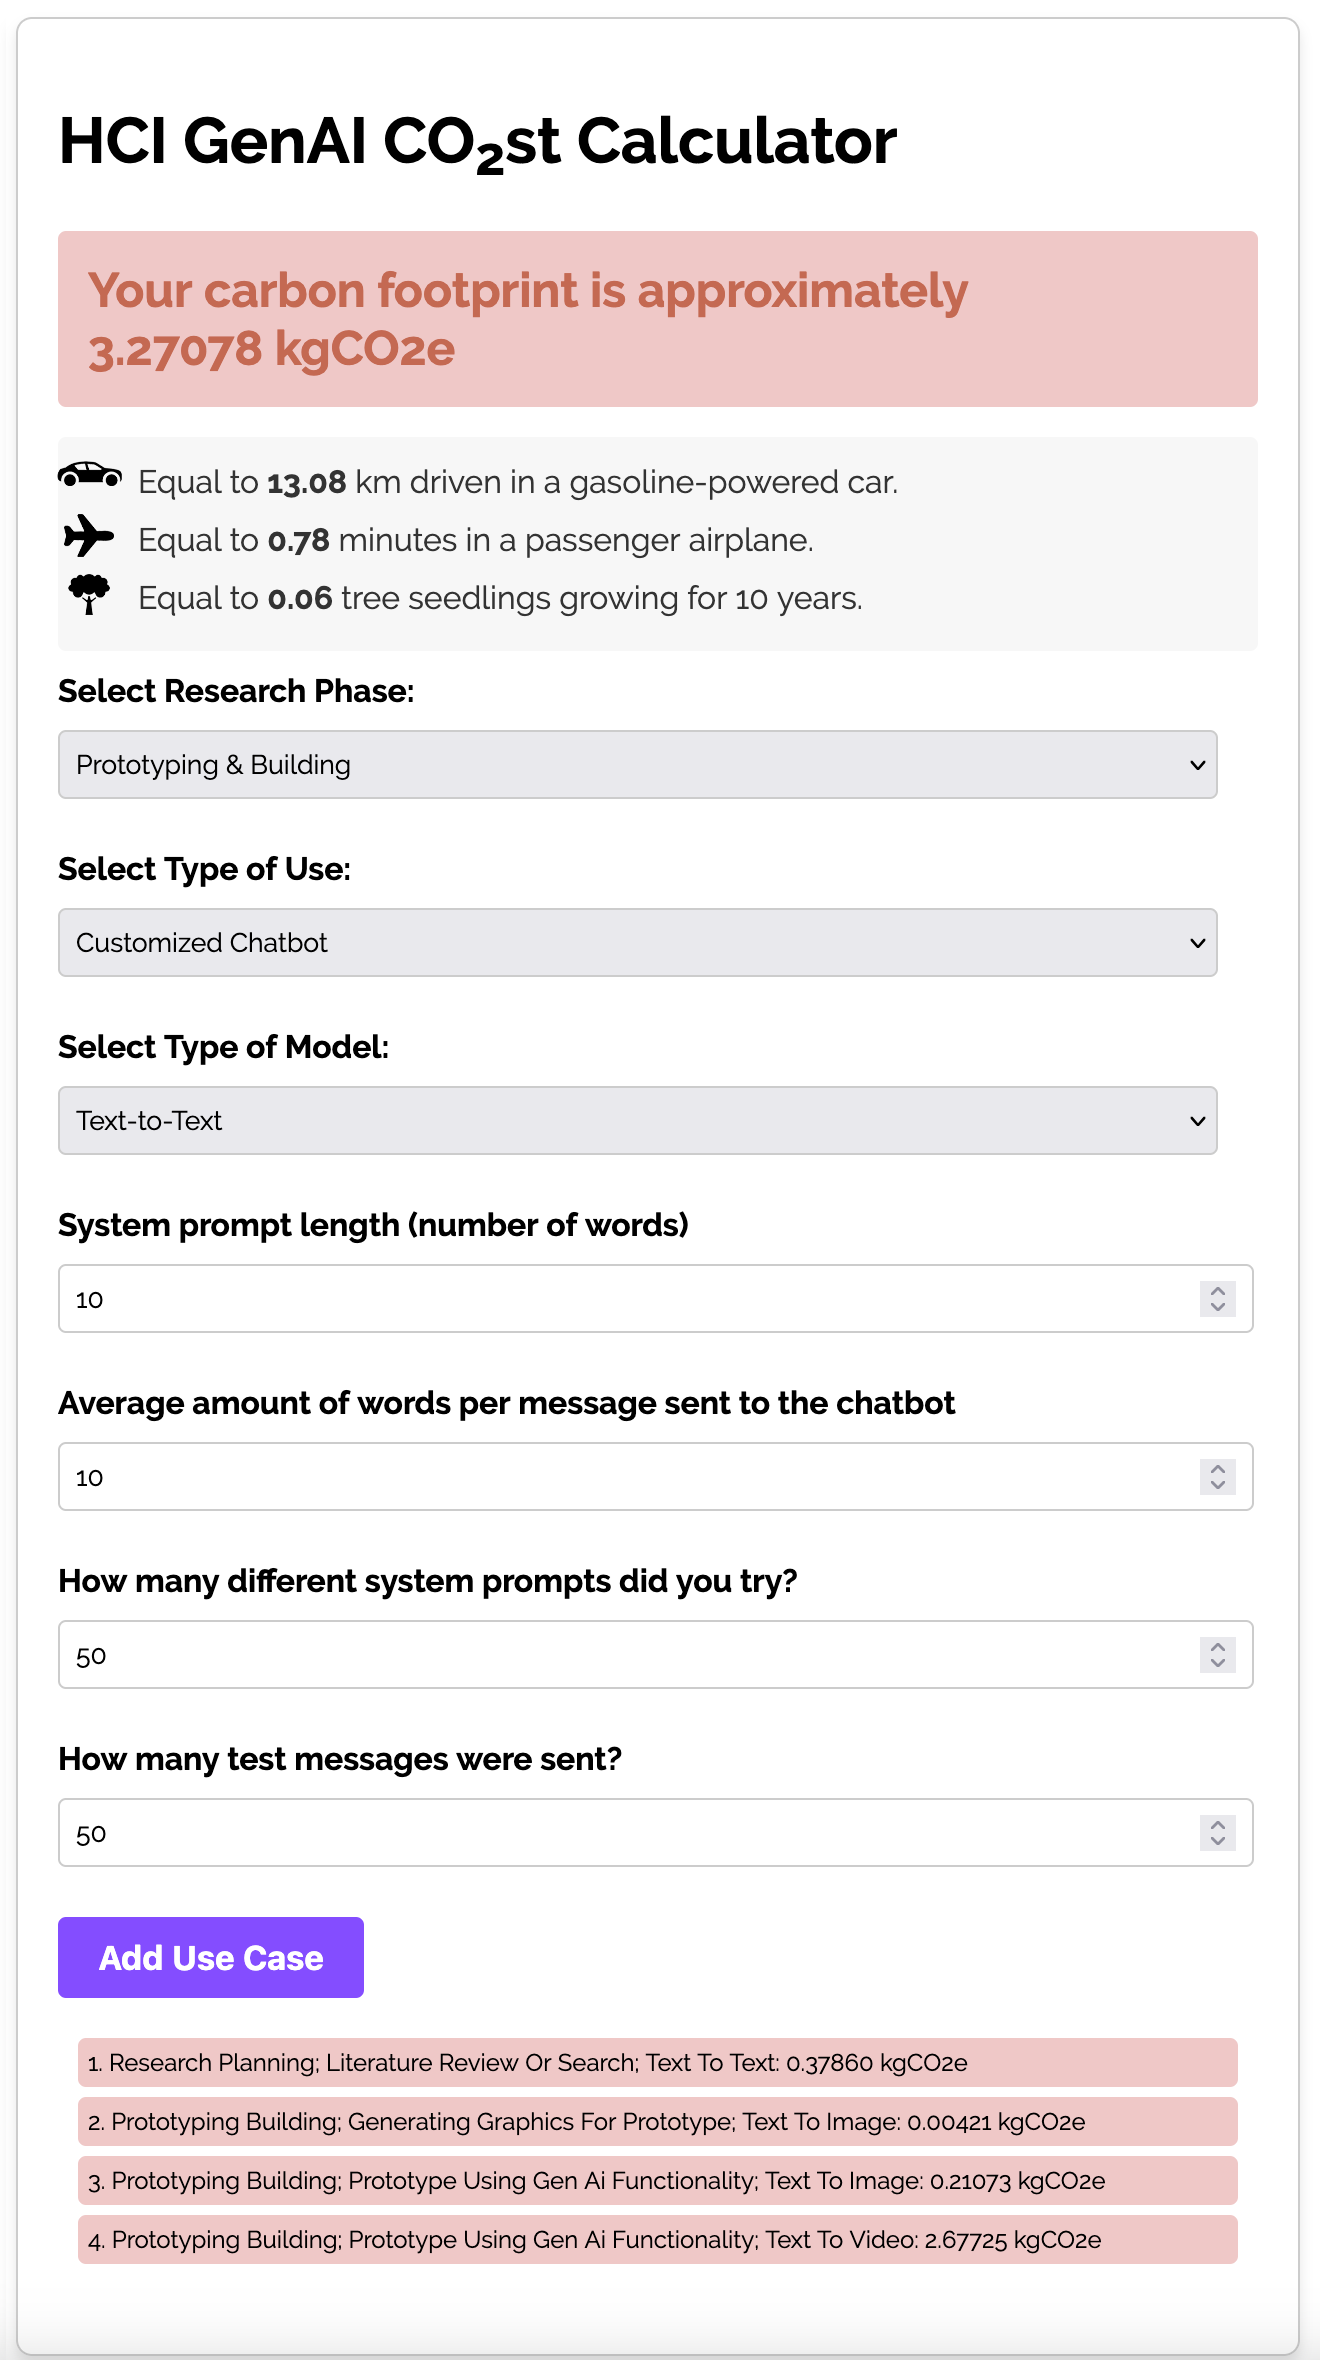
Figure 2 shows two examples from the calculator. We see that the input fields are different when the Type of use is changed, mirroring the direct relevance to HCI research and simplifying the input. We have generally attempted to constrain the input fields to fewer, but more specific options in order to limit the amount of choices, the user has to make. We hope that, despite imposing constraints that are likely to miss some of the unique HCI research pipelines, the process of choosing between the available research processes and adding an individual use case per use encourages reflection on the extent of each research pipeline and the st it incurs. In the categorization we have maintained that GenAI use cases observed in the CHI 2024 corpus are represented (Inie et al., 2025). The list is obviously open to change and expansion.
The result of the calculation is shown in a colored box on top of the page and updated when the user presses “Add use case”. Use cases can be stacked because each research pipeline is likely to incur several GenAI uses, e.g., one for prototyping, and one for the subsequent user evaluation of a prototype, one for automatic transcription of audio data, and so forth. The result in kg is translated into equivalent numbers: km driven in a gasoline-powered car, number of minutes as a passenger on a commercial airplane, and number of tree seedlings grown for 10 years. These numbers are based on the EPA Greenhouse Gas Equivalencies Calculator. 222https://www.epa.gov/energy/greenhouse-gas-equivalencies-calculator
3.4. Back-end and algorithms
At a high-level, for each task we have measured the energy consumption for a single use (or prompt) denoted watt-hour (kWh). Using an in-house set-up comprising an NVIDIA-RTX3090 GPU, Intel-i7 processor with 32GB memory, we measured the energy consumption for various models using Carbontracker (Anthony et al., 2020), which are reported in Table 3. The specific models shown in this table are used as proxies for the different model types (text-to-text, text-to-image, etc.) based on their popularity, ease-of-use, and availability (open-source). These choices provide useful approximations of the actual costs, which can vary between users due to differences in models and hardware used.
We have not included multi-modal models in the calculator, but instead reduced them to the most computationally heavy parameters (which results in a conservative estimate). For example, text+image-to-image becomes image-to-image or image+video-to-image becomes video-to-image, and so forth. This is done partially for simplicity of the interface, and partially to reduce our own carbon footprint when reproducing experiments.
We aggregate the usage information based on the user input into , which is then used to estimate the overall energy consumption per use-case: (kWh). This energy consumption is then converted to the carbon footprint using the global average carbon intensity of (kgCO2e/kWh) (Our World in Data, 2024). The final carbon footprint is estimated as: (kgCO2e).
| Task | Model | (Wh) |
|---|---|---|
| Text-to-text | Llama-3.1-Instruct (Dubey et al., 2024) | 0.004685 |
| Text-to-image | Stable-diffusion-XL (Podell et al., 2024) | 0.001301 |
| Audio-to-text | Whisper (Radford et al., 2023) | 0.006335 |
| Text-to-Video | AnimateDiff (Lin and Yang, 2024) | 0.021742 |
| Text-to-3D model | Shap-E (Jun and Nichol, 2023) | 0.026320 |
| Text-to-Audio | MusicGen (Copet et al., 2024) | 0.011418 |
| Image-to-text | BLIP (Li et al., 2022) | 0.003423 |
| Image-to-image | Instruct-Pix2Pix (Brooks et al., 2023) | 0.000885 |
| Image-to-3D | One-2-3-45 (Liu et al., 2024) | 0.013010 |
| Video-to-text | XCLIP (Ni et al., 2022) | 0.001040 |
| Video-to-video | RIFE (Huang et al., 2022) | 0.026020 |
| Audio-to-audio | FreeVC (Li et al., 2023) | 0.006335 |
| Image-to-video | SadTalker (Zhang et al., 2023) | 0.026020 |
3.5. Online version
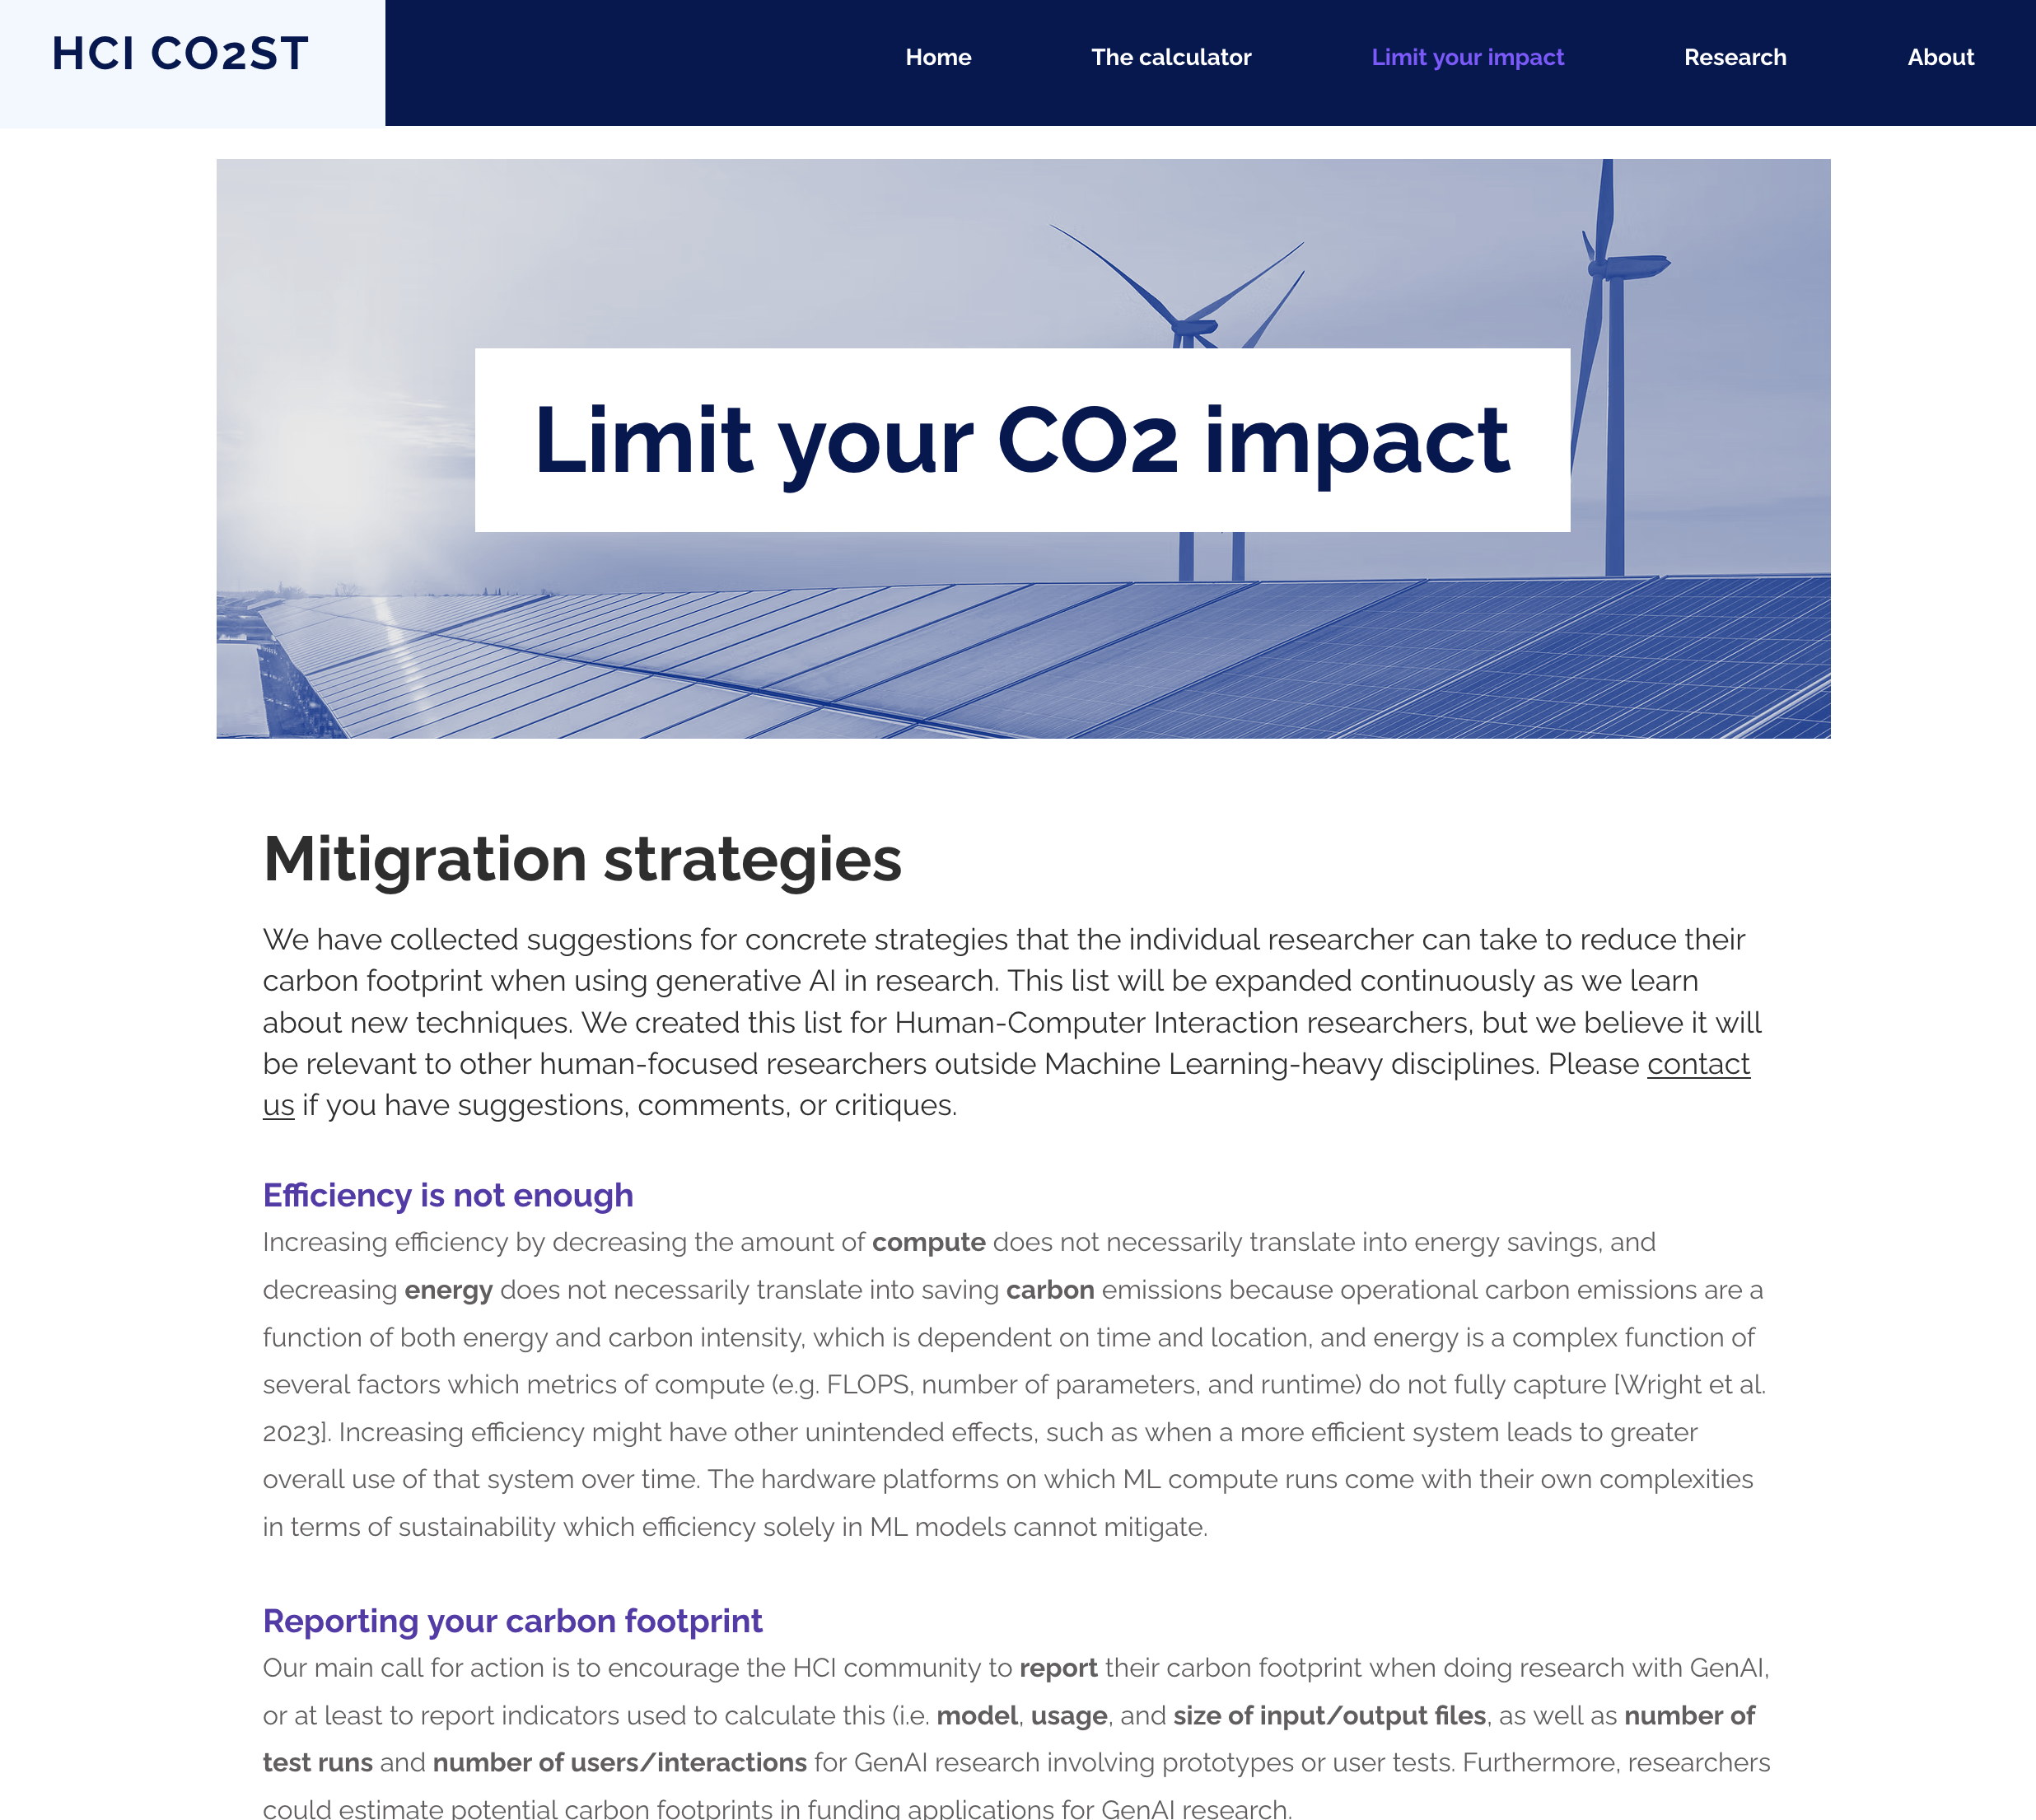
The calculator is published on www.hcico2st.com. This website will be updated with relevant research and updated estimates as our knowledge about large GenAI models and their use in HCI expands. As more research pipelines are input, we can improve the estimates of average carbon footprint for different research phases, allowing researchers to obtain post hoc estimates of their research even if they have not logged their detailed use of the models. Hosting the calculator on a website allows us to clarify and explain all data on which we base the calculations, as well as to present concrete mitigation strategies (https://www.hcico2st.com/limit-your-impact).
4. Impact: awareness, transparency, and mitigation
When planning research with GenAI there is a range of trade-offs which the individual HCI researcher can make to reduce their carbon footprint. Many of these are opaque to a user of cloud-based models, as the factors which increase ST are not clear or open. We intend for this system to have two practical impacts: First, to raise awareness of the carbon footprint caused by GenAI as it is typically used in HCI research, and second, enabling the HCI community to expect and increase transparency in reporting of research carbon footprint. The calculator will enable HCI researchers to report the estimated carbon footprint of their research in a research paper’s ethical statement. Hopefully, both awareness and transparency will lead to increased reflection upon researchers’ own practices and potentially mitigation strategies for the planning of future experiments.
The calculator will show that the energy consumption grows almost linearly with the task load i.e., longer prompts or more images or images of higher resolution cost more in energy. It will show that the far most carbon intensive research uses are training and fine-tuning new models and large-scale open-ended generation of datasets. Experiment designers could consider if increasing the task load to high ranges is always necessary. Prompting techniques can also be refined, reducing the need for several attempts. For research where users have to interact with GenAI models, users could be taught strategies for prompt engineering tailored for the specific research goal to reduce the amount of useless output.
5. Summary
This paper presents the HCI GenAI ST Calculator, a system designed to help HCI researchers estimate the carbon footprint of using generative AI in their research. The interface is designed to represent typical HCI pipelines, and the calculations performed by the calculator are based on estimates derived from experiments run on our own hardware. The calculator is intended to support HCI researchers in daily research practices. With this system, we hope to promote increased awareness and transparency in the HCI community about the climate impact of using GenAI in research.
Acknowledgements.
Funding acknowledgments: NI received funding from the VILLUM Foundation, grant 37176 (ATTiKA: Adaptive Tools for Technical Knowledge Acquisition). RS acknowledges funding received under Independent Research Fund Denmark (DFF) under grant 4307-00143B, and European Union’s Horizon Europe Research and Innovation programme under grant agreements No. 101070284, No. 10107040 and No. 101189771.References
- (1)
- Ambrose (2024) Jillian Ambrose. 2024. Ireland’s datacentres overtake electricity use of all urban homes combined — theguardian.com. https://www.theguardian.com/world/article/2024/jul/23/ireland-datacentres-overtake-electricity-use-of-all-homes-combined-figures-show. [Accessed 25-07-2024].
- Anthony et al. (2020) Lasse F. Wolff Anthony, Benjamin Kanding, and Raghavendra Selvan. 2020. Carbontracker: Tracking and Predicting the Carbon Footprint of Training Deep Learning Models. ICML Workshop on Challenges in Deploying and monitoring Machine Learning Systems. arXiv:2007.03051.
- Bartoldson et al. (2023) Brian R Bartoldson, Bhavya Kailkhura, and Davis Blalock. 2023. Compute-efficient deep learning: Algorithmic trends and opportunities. Journal of Machine Learning Research 24, 122 (2023), 1–77.
- Blevis (2007) Eli Blevis. 2007. Sustainable interaction design: invention & disposal, renewal & reuse. In Proceedings of the SIGCHI Conference on Human Factors in Computing Systems (San Jose, California, USA) (CHI ’07). Association for Computing Machinery, New York, NY, USA, 503–512. doi:10.1145/1240624.1240705
- Brooks et al. (2023) Tim Brooks, Aleksander Holynski, and Alexei A Efros. 2023. Instructpix2pix: Learning to follow image editing instructions. In Proceedings of the IEEE/CVF Conference on Computer Vision and Pattern Recognition. IEEE, 18392–18402.
- Copet et al. (2024) Jade Copet, Felix Kreuk, Itai Gat, Tal Remez, David Kant, Gabriel Synnaeve, Yossi Adi, and Alexandre Défossez. 2024. Simple and controllable music generation. Advances in Neural Information Processing Systems 36 (2024).
- Derczynski (2020) Leon Derczynski. 2020. Power consumption variation over activation functions. arXiv preprint arXiv:2006.07237 (2020).
- Dubey et al. (2024) Abhimanyu Dubey, Abhinav Jauhri, Abhinav Pandey, Abhishek Kadian, Ahmad Al-Dahle, Aiesha Letman, Akhil Mathur, Alan Schelten, Amy Yang, Angela Fan, et al. 2024. The Llama 3 herd of models. arXiv preprint arXiv:2407.21783 (2024).
- Henderson et al. (2020) Peter Henderson, Jieru Hu, Joshua Romoff, Emma Brunskill, Dan Jurafsky, and Joelle Pineau. 2020. Towards the systematic reporting of the energy and carbon footprints of machine learning. Journal of Machine Learning Research 21, 248 (2020), 1–43.
- Hintemann and Hinterholzer (2022) Ralph Hintemann and Simon Hinterholzer. 2022. Cloud computing drives the growth of the data center industry and its energy consumption. Data centers (2022).
- Huang et al. (2022) Zhewei Huang, Tianyuan Zhang, Wen Heng, Boxin Shi, and Shuchang Zhou. 2022. Real-time intermediate flow estimation for video frame interpolation. In European Conference on Computer Vision. Springer, 624–642.
- Inie et al. (2025) Nanna Inie, Jeanette Falk, and Raghavendra Selvan. 2025. How CO2STLY Is CHI? The Carbon Footprint of Generative AI in HCI Research and What We Should Do About It. In Proceedings of the 2025 CHI Conference on Human Factors in Computing Systems.
- Jun and Nichol (2023) Heewoo Jun and Alex Nichol. 2023. Shap-e: Generating conditional 3d implicit functions. arXiv preprint arXiv:2305.02463 (2023).
- Lab (2024) Sustainable AI Lab. 2024. About us - Bonn Sustainable AI Lab — sustainable-ai.eu. https://sustainable-ai.eu/about-us/. [Accessed 25-08-2024].
- Li et al. (2022) Junnan Li, Dongxu Li, Caiming Xiong, and Steven Hoi. 2022. Blip: Bootstrapping language-image pre-training for unified vision-language understanding and generation. In International conference on machine learning. PMLR, 12888–12900.
- Li et al. (2023) Jingyi Li, Weiping Tu, and Li Xiao. 2023. Freevc: Towards high-quality text-free one-shot voice conversion. In ICASSP 2023-2023 IEEE International Conference on Acoustics, Speech and Signal Processing (ICASSP). IEEE, 1–5.
- Lin and Yang (2024) Shanchuan Lin and Xiao Yang. 2024. Animatediff-lightning: Cross-model diffusion distillation. arXiv preprint arXiv:2403.12706 (2024).
- Liu et al. (2024) Minghua Liu, Chao Xu, Haian Jin, Linghao Chen, Mukund Varma T, Zexiang Xu, and Hao Su. 2024. One-2-3-45: Any single image to 3d mesh in 45 seconds without per-shape optimization. Advances in Neural Information Processing Systems 36 (2024).
- Luccioni et al. (2024) Sasha Luccioni, Yacine Jernite, and Emma Strubell. 2024. Power hungry processing: Watts driving the cost of AI deployment?. In The 2024 ACM Conference on Fairness, Accountability, and Transparency. 85–99.
- Mehlin et al. (2023) Vanessa Mehlin, Sigurd Schacht, and Carsten Lanquillon. 2023. Towards energy-efficient Deep Learning: An overview of energy-efficient approaches along the Deep Learning Lifecycle. arXiv:2303.01980 [cs.LG] https://arxiv.org/abs/2303.01980
- Ni et al. (2022) Bolin Ni, Houwen Peng, Minghao Chen, Songyang Zhang, Gaofeng Meng, Jianlong Fu, Shiming Xiang, and Haibin Ling. 2022. Expanding language-image pretrained models for general video recognition. In European Conference on Computer Vision. Springer, 1–18.
- Our World in Data (2024) Our World in Data. 2024. Carbon intensity of electricity generation. https://ourworldindata.org/grapher/carbon-intensity-electricity.
- Podell et al. (2024) Dustin Podell, Zion English, Kyle Lacey, Andreas Blattmann, Tim Dockhorn, Jonas Müller, Joe Penna, and Robin Rombach. 2024. SDXL: Improving Latent Diffusion Models for High-Resolution Image Synthesis. In The Twelfth International Conference on Learning Representations. https://openreview.net/forum?id=di52zR8xgf
- Radford et al. (2023) Alec Radford, Jong Wook Kim, Tao Xu, Greg Brockman, Christine McLeavey, and Ilya Sutskever. 2023. Robust speech recognition via large-scale weak supervision. In International Conference on Machine Learning. PMLR, 28492–28518.
- Strubell et al. (2020) Emma Strubell, Ananya Ganesh, and Andrew McCallum. 2020. Energy and policy considerations for modern deep learning research. In Proceedings of the AAAI conference on artificial intelligence, Vol. 34. 13693–13696.
- Utz and DiPaola (2023) Vanessa Utz and Steve DiPaola. 2023. Climate implications of diffusion-based generative visual ai systems and their mass adoption. In Proceedings of the 14th International Conference on Computational Creativity.
- Wright et al. (2023) Dustin Wright, Christian Igel, Gabrielle Samuel, and Raghavendra Selvan. 2023. Efficiency is Not Enough: A Critical Perspective of Environmentally Sustainable AI. arXiv:2309.02065 [cs.LG] https://arxiv.org/abs/2309.02065
- Zhang et al. (2023) Wenxuan Zhang, Xiaodong Cun, Xuan Wang, Yong Zhang, Xi Shen, Yu Guo, Ying Shan, and Fei Wang. 2023. Sadtalker: Learning realistic 3d motion coefficients for stylized audio-driven single image talking face animation. In Proceedings of the IEEE/CVF Conference on Computer Vision and Pattern Recognition. 8652–8661.