SPHERE/ZIMPOL insights into discs around evolved stars: arcs, asymmetries and porous dust aggregates
Abstract
Second-generation circumbinary discs around evolved binary stars, such as post-Asymptotic Giant Branch (post-AGB) binaries, provide insights into poorly understood mechanisms of dust processing and disc evolution across diverse stellar environments. We present a multi-wavelength polarimetric survey of five evolved binary systems — AR Pup, HR 4049, HR 4226, U Mon, and V709 Car — using the Very Large Telescope SPHERE/ZIMPOL instrument. Post-AGB discs show significant polarimetric brightness at optical and near-IR wavelengths, often exceeding 1% of the system’s total intensity. We also measured a maximum fractional polarization of the scattered light for AR Pup of 0.7 in the -band and 0.55 in the -band. To investigate wavelength-dependent polarization, we combine the SPHERE/ZIMPOL dataset with results from previous SPHERE/IRDIS studies. This analysis reveals that post-AGB discs exhibit a grey to blue polarimetric colour in the optical and near-IR. Along with high fractional polarization of the scattered light and polarized intensity distribution, these findings indicate that porous dust aggregates dominate the surface dust composition. We also find evidence of diverse disc geometries within the post-AGB sample, including arcs, asymmetries and significant variations in disc size across optical and near-IR wavelengths for some systems (U Mon, V709 Car). Combining our findings with existing multi-technique studies, we question the classification of two systems in our sample, HR 4226 and V709 Car, which were originally identified as post-AGB binaries based on their near-IR excess. On comparing post-AGB discs to circumstellar environments around AGB stars and YSOs, we found that post-AGB systems exhibit a higher degree of polarization than single AGB stars and are comparable to the brightest protoplanetary discs around YSOs. Overall, our results reinforce the importance of polarimetric observations in probing dust properties and complex circumbinary structures. We also highlight the importance of combining multi-wavelength and multi-technique observations with advanced radiative-transfer modelling to differentiate between the various evolutionary pathways of circumbinary discs.
keywords:
stars: evolution - binaries - AGB and post-AGB - YSO- circumstellar discsAstrophysics and Space Technologies Research Centre, Macquarie University, Balaclava Road, Sydney, NSW 2109, Australia Kateryna Andrych]kateryna.andrych@mq.edu.au \alsoaffiliationAstrophysics and Space Technologies Research Centre, Macquarie University, Balaclava Road, Sydney, NSW 2109, Australia \alsoaffiliationINAF, Observatory of Rome, Via Frascati 33, I-00077 Monte Porzio Catone (RM), Italy \alsoaffiliationLarge Binocular Telescope Observatory, University of Arizona, 933 N. Cherry Avenue, Tucson, AZ 85721-0065, USA
1 Introduction
At the end of their lives, low- to intermediate-mass stars (0.8-8M⊙) experience significant mass loss as they evolve along the asymptotic giant branch (AGB). This mass loss plays a key role in the chemical enrichment of the interstellar medium, although the details of how mass-loss occurs are not yet fully understood Habing2003agbs.conf.....H; Khouri2020A&A...635A.200K. In binary systems, mass loss can be amplified through stellar interactions, often resulting in the formation of dusty circumbinary discs during the AGB and early post-AGB phases VanWinckel2003ARA&A..41..391V; Kamath2015MNRAS.454.1468K. Studying these second-generation circumbinary discs around post-AGB binary stars provides insights into the still-mysterious processes that govern dust processing and the binary interactions that terminate the giant evolutionary phase of these stars.
Observational studies have revealed key parameters regarding the structure and dynamics of circumbinary discs in post-AGB systems. These binary stars display a distinctive spectral energy distribution (SED) profile, with dust emission peaking in the near-infrared (DeRuyter2006A&A...448..641D; VanWinckel2009A&A...505.1221V; Kamath2014MNRAS.439.2211K; Kamath2015MNRAS.454.1468K; Gezer2015MNRAS.453..133G; Kluska2022, near-IR, e.g.,). Near-IR excess is typically attributed to circumstellar dust and gas within a stable disc with an inner rim near the dust sublimation radius. These discs are generally found to exhibit Keplerian rotation, with angular sizes ranging from roughly 0.5” to 1” (100 to 500 AU) as inferred from position-velocity mapping (Bujarrabal2015A&A...575L...7B; Gallardo_cava2021A&A...648A..93G, e.g.,). High-resolution near-IR interferometric studies have spatially resolved the hot dust inner rim in post-AGB discs, verifying that it is predominantly located at the dust sublimation radius (Hillen2016; Kluska2019A&A...631A.108K, 6 AU; e.g.,). These circumbinary discs are called ‘full’ discs. However, the recent study by Corporaal2023A&A...674A.151C confirmed the presence of ‘transition’ post-AGB discs with the dust inner rim up to 7.5 times larger than the theoretical dust sublimation radius. Pilot high-resolution imaging studies of 9 post-AGB circumbinary discs with VLT/SPHERE revealed their complex morphologies and large diversity in terms of disc size and orientation at larger angular scale (Ertel2019AJ....157..110E; Andrych2023MNRAS.524.4168A, mas;). The latter study also identified significant polarized brightness of post-AGB circumbinary discs in near-IR wavelengths, reaching up to of the total system intensity.
Recently, a detailed multi-wavelength polarimetric imaging study of the post-AGB binary IRAS 08544-4431 revealed a relatively consistent polarized brightness across optical and near-IR wavelengths, along with substantial forward scattering in optical polarimetry Andrych2024IRAS08. These results align with theoretical models that propose large, porous aggregates of submicron-sized monomers as the main dust components in the disc surface layers. Furthermore, Andrych2024IRAS08 observed wavelength-dependent variations in the IRAS 08544-4431 disc structure, with the near-IR -band revealing a more extended disc surface compared to the optical and -bands. The authors suggested that this structural variation across wavelengths could indicate potential disc warping.
Moreover, the presence of circumbinary disc significantly influences the chemical composition of the post-AGB binary, often leading to a phenomenon known as photospheric chemical depletion of refractory elements (VanWinckel1995PhDT........31V; DeRuyter2005A&A...435..161D, usually traced with [Zn/Ti];). This depletion arises from the re-accretion of chemically fractionated gas and dust in the circumbinary disc Kama2015A&A...582L..10K, resulting in unique elemental abundance patterns observed in these systems Oomen2019A&A...629A..49O; Kluska2022; Mohorian2024MNRAS.530..761M. The observed orbital parameters of post-AGB binary systems, including their high eccentricities and wide range of orbital periods, do not align with predictions of binary evolution theory (Nie2012MNRAS.423.2764N, e.g.,). Long-term radial velocity monitoring studies have shown that their typical orbital periods range from a hundred to a few thousand days Oomen2018; VanWinckel2009A&A...505.1221V. The formation and interaction of circumbinary discs in these systems remain poorly understood, particularly in relation to their influence on the binary evolution of the central stars.
Despite distinct formation histories and lifetimes, post-AGB circumbinary discs (Bujarrabal2017A&A...597L...5B, with a lifetime of years,) and protoplanetary discs (PPDs) around young stellar objects (Benisty2022arXiv220309991B, YSOs; with disc lifetime of up to a few Myr,) share many characteristics. Both disc types show comparable IR excesses, dust disc masses (Corporaal_IRAS08_2023A&A...671A..15C, ,), chemical depletion patterns Kluska2022; Mohorian2024MNRAS.530..761M, and dust mineralogy Gielen2011A&A...533A..99G; Scicluna2020MNRAS.494.2925S. These discs also exhibit similar polarimetric brightnesses and morphologies Andrych2023MNRAS.524.4168A; Andrych2024IRAS08. Radiative transfer (RT) modelling efforts for circumbinary discs around post-AGB binaries (Corporaal_IRAS08_2023A&A...671A..15C, e.g.,) show that high-angular resolution interferometric data for these systems can be accurately reproduced by using passively irradiated disc models initially developed for PPDs around YSOs.
In this paper, we present multi-wavelength polarimetric imaging results for five evolved binary systems (AR Pup, HR 4049, HR 4226, U Mon, and V709 Car) observed with VLT/SPHERE adaptive optics (AO) instrument. We aim to investigate the consistency of polarimetric properties, surface morphologies, and dust composition across the post-AGB sample and to compare these with findings from AGB and YSO systems. In Section 2, we present our target sample and relevant observational details collected from the literature. In Section 3, we introduce our observing strategy and data reduction methodology. In Section 4, we present the analysis of the VLT/SPHERE-ZIMPOL data and corresponding results. In Section 5, we discuss the dust properties of post-AGB circumbinary discs and highlight similarities and differences between circumstellar environments of AGB stars, circumbinary discs around post-AGB binaries, and PPDs around YSOs. In Section 6, we present our conclusions.
2 Target details
| Name | IRAS |
|
LIR/L∗ | E(B-V) | RVb |
|
|
[Fe/H] | [Zn/Ti] |
|
|
|
|
||||||||||||||
|---|---|---|---|---|---|---|---|---|---|---|---|---|---|---|---|---|---|---|---|---|---|---|---|---|---|---|---|
| AR Pup3,11,12,13 | 08011-3627 | 661 | 9.15 | 0.4 | y | 1194 | 5925 | -1 | - | 1.7 | 63 | 75 | full | ||||||||||||||
| HR40491,6,11 | 10158-2844 | 1500 | 0.26 | 0.21 | y | 430.60.1 | 7750 | -4.5 | - | 6.6 | 42 | 49 | full | ||||||||||||||
| HR42265,11 | 10456-5712 | 1104 | 0.44 | 0.34 | n | 5726 | 4275 | 0.0 | - | 7.4 | 58 | - | full∗ | ||||||||||||||
| U Mon1,2,4,10,11 | 07284-0940 | 800 | 0.23 | 0.18 | y | 2550143 | 5050 | -0.8 | 0.0 | 7 | 50 | 58 | full | ||||||||||||||
| V709 Car5,11 | 10174-5704 | 2590 | - | 0.88 | n | 32350 | 3500 | - | - | 3 | 140 | 33 | full |
-
•
Notes: The distances to the targets were adopted from DR3 Bailer-Jones2021AJ....161..147B. However, these distances are uncertain because: i) targets are too far away and therefore not flagged as astrometric binaries ii) the orbital motion of the binary results in an angular displacement comparable to the parallax. LIR/L∗ represents the infrared luminosity adopted from Kluska2022. E(B-V) indicates the total reddening, and Teff represents stellar effective temperature derived from SED fitting Hillen2017. RVb represents the presence of RVb phenomenon with ’y’ indicating ’yes’ and ’n’ indicating ’no’. Porbital represents the orbital period in days. represents theoretical dust sublimation radius and represents the outer disc diameter as estimated from geometrical modelling of mid-IR interferometric data Hillen2017. The disc inclination, , was derived from near-IR interferometric observations Kluska2019A&A...631A.108K for all targets except AR Pup. For AR Pup the disc inclination was estimated using high-resolution imaging Ertel2019AJ....157..110E. Disc type represents disc category based on SED and IR-excess features Kluska2022. We note that ∗ indicates that for HR 4226 we infer the disc type from SED shape only, as it had previously remained uncategorized due to the lack of precise infrared photometric observations with Wide-field Infrared Survey Explorer (WISE). More details on the tabulated information can be found in the individual studies mentioned as superscripts in column ’Name’: 1 - Oomen2018, 2 - Kiss2007MNRAS.375.1338K, 3 - Kiss2017, 4 - Giridhar2000ApJ...531..521G, 5 - Maas2003A&A...405..271M, 6 - VanWinckel1995PhDT........31V, 10 - Bodi2019, 11 - Hillen2017, 12 - Ertel2019AJ....157..110E, 13 - Gonzalez1997EPLyrDYOriARPupRSgt.
In this study, we focus on five binary systems that are considered to host circumbinary discs: AR Pup, HR 4049, HR 4226, U Mon and V709 Car. These targets were selected from the mid-infrared interferometric survey for discs around 19 post-AGB stars using VLTI/MIDI Hillen2017. The final selection was based on objects that are observable for Spectro-Polarimetric High-contrast Exoplanet Research/Zurich Imaging Polarimeter (Schmid2018A&A...619A...9S, ; SPHERE/ZIMPOL,) and have warm disc diameters greater than 40 mas in near-IR. Initially, all targets were classified as post-AGB binary stars based on their strong near-IR excesses in the SEDs, typically attributed to circumstellar dust near the dust sublimation temperature DeRuyter2006A&A...448..641D.
This selection represents a diverse subset of five post-AGB binary systems, offering insights into disc properties and evolutionary stages across different circumstellar environments. In Table 1, we present selected observational parameters of our target sample relevant to this study, including their corresponding IRAS names, Gaia DR3 distances, SED characteristics, orbital parameters, and interferometric disc sizes. We also present additional details on individual targets, along with the findings of this study, in Section 4.7.
In summary, our target sample displays diverse properties, particularly regarding atmospheric parameters and elemental abundances of the primary star, as well as binary orbital characteristics and disc orientation. By analyzing the polarimetric and interferometric data for these systems, we aim to provide a comprehensive understanding of how binary interactions influence the circumstellar environments of evolved stars.
3 Data and Observations
In this paper, we present multi-wavelength, high-angular-resolution polarimetric observations of the circumbinary discs surrounding a diverse sample of five post-AGB binary systems. This section provides an overview of the data and the methodology used for data reduction.
3.1 Observations
| Target | R mag | V mag | Reference star | Observing night | Filters |
|
NDIT | ND filter |
|
||||
|---|---|---|---|---|---|---|---|---|---|---|---|---|---|
| AR Pup | 9.5 | 9.6 | HD 75885 | 08 Apr 2018 | V, N_I | 10 | 2 | ND_3.5 | 0.30 - 0.98 | ||||
| HR 4049 | 5.5 | 5.5 | HD 96314 | 07/08 Jan 2019∗ | V, Cnt820 | 1.2 | 16 | ND_3.5 | 0.37 - 0.95 | ||||
| HR 4226 | 6.3 | 6.3 | HD 98025 | 08 Apr 2018 | V, Cnt820 | 1.2 | 16 | No | 0.30 - 0.98 | ||||
| U Mon | 6.8 | 6.0 | HD 71253 | 29 Dec 2018 | V, Cnt820 | 1.2 | 16 | ND_3.5 | 0.38 - 1.71 | ||||
| V709 Car | 9.3 | 11.3 | HD 94680 | 03 Mar 2018 | V, N_I | 10 | 2 | ND_3.5 | 0.33 - 1.2 |
Notes: Observations were conducted using SPHERE/ZIMPOL in P1 mode without a coronagraph. We note that ∗ indicates that HR 4049 was observed twice, on 7th and 8th January, due to non-ideal conditions. The detector integration time (DIT) and number of detector integrations (NDIT) were chosen based on the target brightness and neutral density filter (ND filter) configuration. DITNDIT is the integration for one out of four half-wave plate position angles of a polarimetric cycle, and 20 polarization cycles were taken per target resulting in a total integration time of 40DITNDIT per data set. See Section 3.1 for more details.
The data for this study were obtained using the Zurich Imaging Polarimeter (Schmid2018A&A...619A...9S, ZIMPOL,) of the extreme AO instrument SPHERE Beuzit2019 as part of ESO observational program 0101.D-0752(A) (PI: Kamath). To effectively resolve the scattered light around the post-AGB binary stars and ensure the best accuracy for the multi-wavelength characteristics, we used SPHERE/ZIMPOL in its polarimetric P1 mode without coronagraph. This mode provides high polarimetric sensitivity and calibration accuracy by averaging out instrumental effects as the sky field rotates with respect to the instrument and telescope pupil Schmid2018A&A...619A...9S. In addition to the target systems, reference stars were observed as a part of a program. These stars were selected for their similar brightness, colour, and location to the corresponding binary systems. Reference stars were observed immediately after each target, allowing their data to serve as a point-spread function (PSF) during the reduction process.
We obtained data in both the -band and -band for all targets in our sample. Specifically, the -band observations were conducted using the ZIMPOL ’V’ filter ( nm, nm), while -band data were obtained using either the ’Cnt820’ filter ( nm, nm) or the ’N_I’ filter ( nm, nm), with broader ’N_I’ filter used for fainter targets. For consistency, we refer to both ’Cnt820’ and ’N_I’ as the -band throughout the text and figures, while their exact names are specified in the tables. In total 20 polarimetric cycles were taken for each target and 10 polarimetric cycles for reference stars. Each observational frame contained counts, ensuring non-saturated observations Schmid2018A&A...619A...9S. In Table 2 we present additional observational details for each target.
In addition to SPHERE/ZIMPOL data, we also include results of near-IR polarimetric observations using the Infra-Red Dual-beam Imaging and Spectroscopy camera (Dohlen2008, IRDIS,) of the same instrument for two targets (Andrych2023MNRAS.524.4168A, HR 4049 and U Mon,).
3.2 Data reduction
The reduction of our SPHERE/ZIMPOL polarimetric data was performed following the methodology presented in Andrych2024IRAS08. Here, we provide only a brief overview, highlighting relevant modifications and target-specific details.
3.2.1 Polarimetric differential imaging (PDI) reduction
Initial steps, including bias subtraction, flat fielding, frame centring, polarimetric beam shift correction, and calculation of the Stokes vectors and , were carried out using the High-Contrast Data Centre (HC-DC, formerly SPHERE Data Centre) pipeline111This software is based on the SPHERE ESO pipeline, complemented with additional routines such as improved centring algorithms, automatic frame sorting, and analysis tools for systematic SPHERE data processing. Delorme2017sf2a.conf..347D. Instrumental polarization was corrected using the -pipeline developed at ETH Zurich, which accounts for telescope polarization offsets during the observations following Schmid2018A&A...619A...9S. In A, we provide details of the measured fractional polarization (, where is the total intensity of the target) before and after correction for each observation cycle, alongside the corresponding telescope polarization data for each target. Further processing included our custom Python pipeline. To mitigate atmospheric variability during the observations, we selected the best 75%222This value was selected to balance between excluding frames with poorer instrumental performance while still keeping enough frames to benefit from mean combining and significantly improve the signal-to-noise ratio. of frames based on the normalized peak intensity . Then, we computed azimuthal Stokes parameters and (deBoer2020, following the definitions of), total polarized intensity , and the Angle of Linear Polarization . Positive indicates linear polarization in the azimuthal direction, while negative indicates radial polarization. represents linear polarization rotated by relative to these directions, and defines the local orientation of the polarization vector.
3.2.2 Evaluating the reliability of as a measure of polarized intensity
For low-inclination () and optically thick discs, single scattering of stellar light on the disc surface causes polarization vectors to align azimuthally relative to the central star, making a reliable measure of polarized flux while minimizing noise biases compared to Schmid2006A&A...452..657S; Canovas2015A&A...582L...7C; Simmons1985A&A...142..100S. To test this approach for our data, we calculated the ratio of polarized signal to . We found that two out of five targets in our sample (HR 4049 and HR 4226) show >85%, indicating the dominance of single scattering and resolved circumstellar polarization (see Table 4). For the remaining targets, lower values limit the reliability of as a measure of polarized intensity and indicate that the contribution of unresolved polarization is relatively high. For AR Pup, the decrease in the value is likely due to the disc’s nearly edge-on orientation. The significantly lower values in U Mon and V709 Car (<70%) suggest higher disc inclinations and potential multiple scattering, which could alter the orientation of the polarization vector. Furthermore, we examined the mean flux distribution in in the radial annuli, similar to the analyses of Avenhaus2018ApJ...863...44A and Andrych2023MNRAS.524.4168A. Although all targets showed signs of an astrophysical signal in , separating it from instrumental residuals remains challenging. For all targets except HR 4049 we found that the net signal accounts for more than 5% of , supporting the use of for further analysis. For HR 4049, however, we will use .
3.2.3 Correction of the unresolved central polarized signal
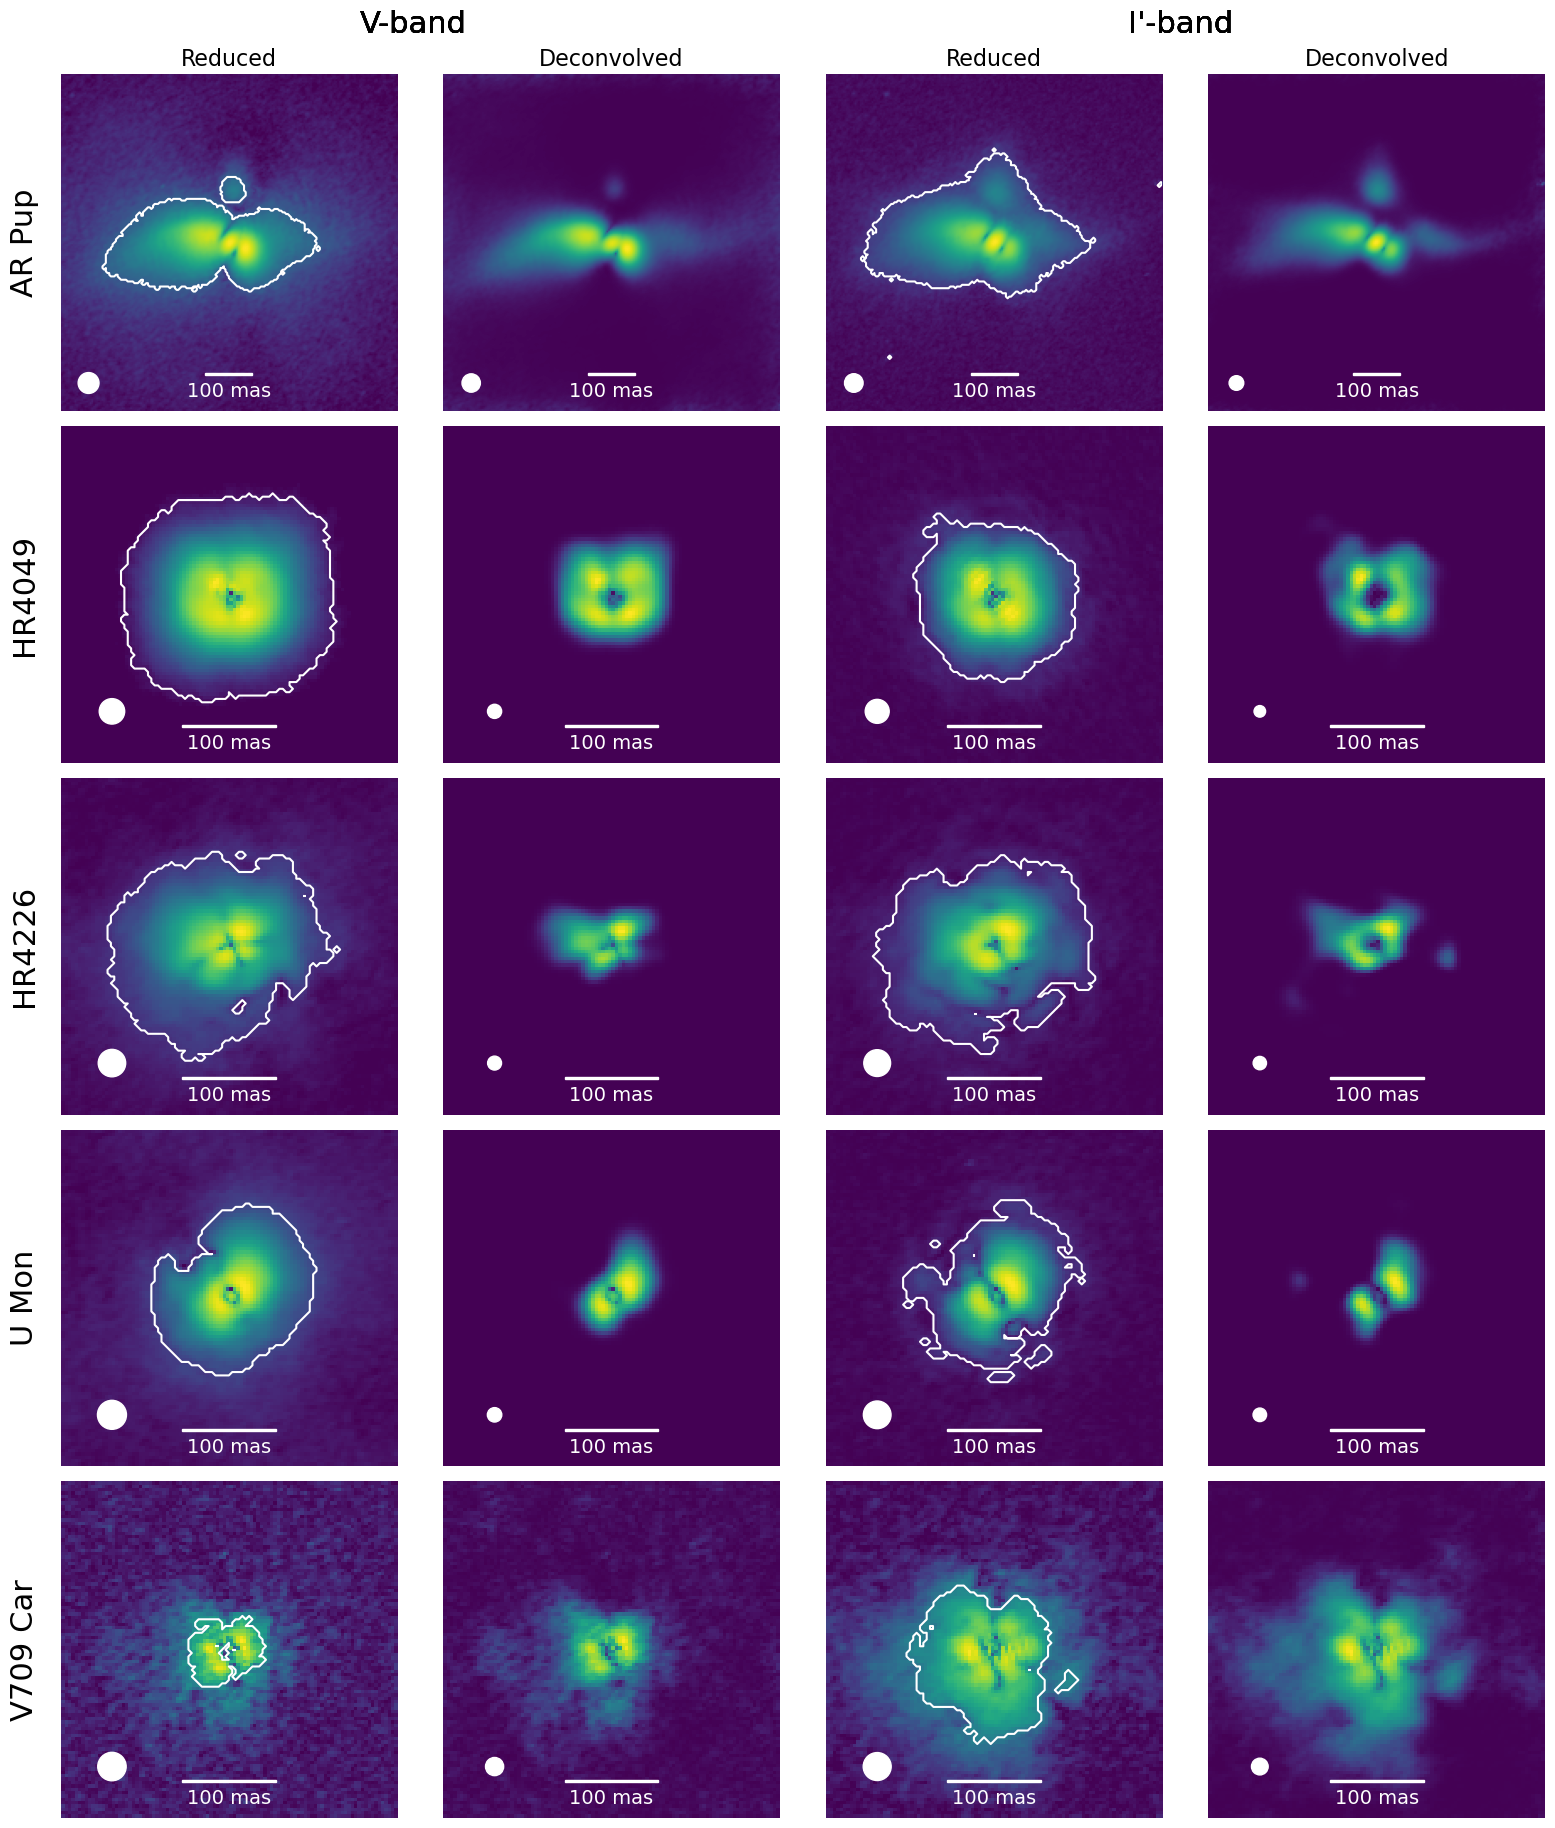
The reduced linearly polarized images of all targets show features commonly attributed to the presence of a bright but spatially unresolved central region of the circumbinary disc (Keppler2018A&A...617A..44K, e.g.,), including a butterfly pattern in and a halo in the images (see top row of Fig. 11, 12, 13, 14, 15 in B). To correct the data for the unresolved central polarization, we applied the method from Holstein2020A&A...633A..64V and calculated the degree and angle of the unresolved central polarization for all targets using a 3-pixel ( mas)333Similar to Andrych2023MNRAS.524.4168A, the 3-pixel aperture was chosen to reliably correct for the unresolved polarized signal while minimizing contributions from the resolved signal. circular aperture centred on the stellar position (see Table 3).
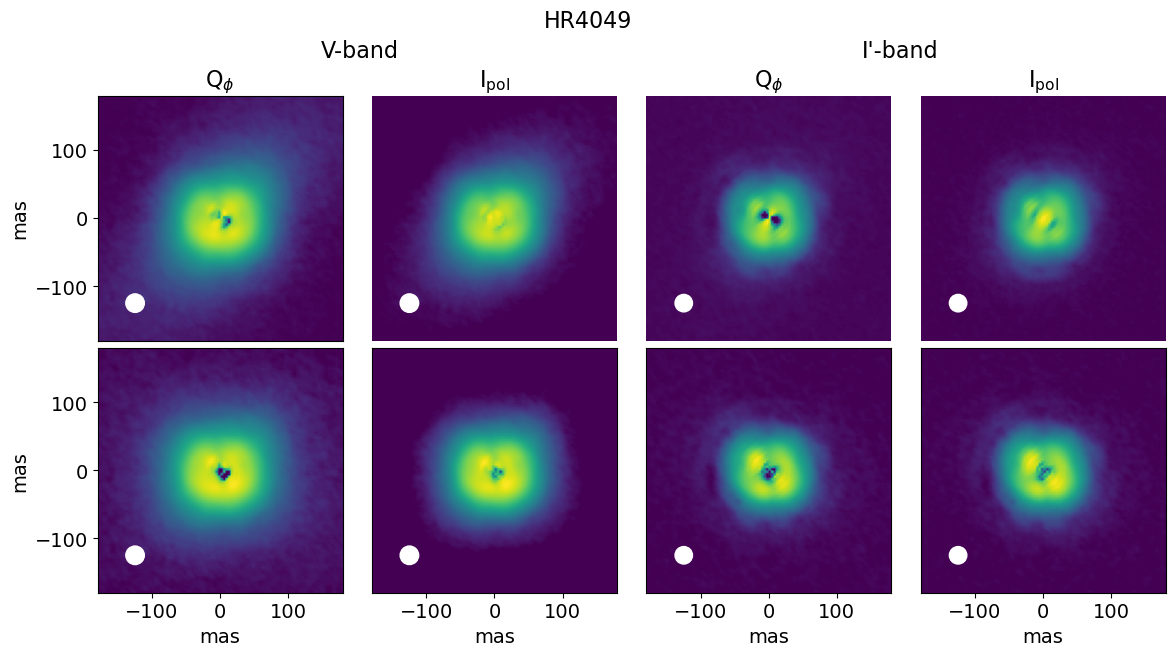
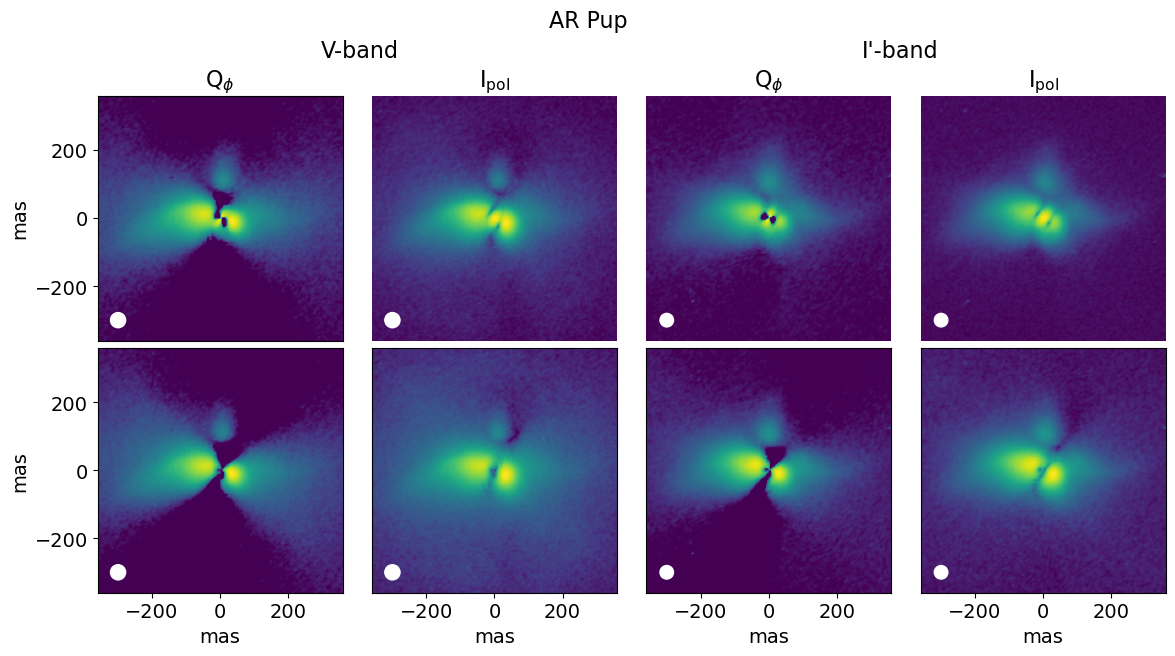
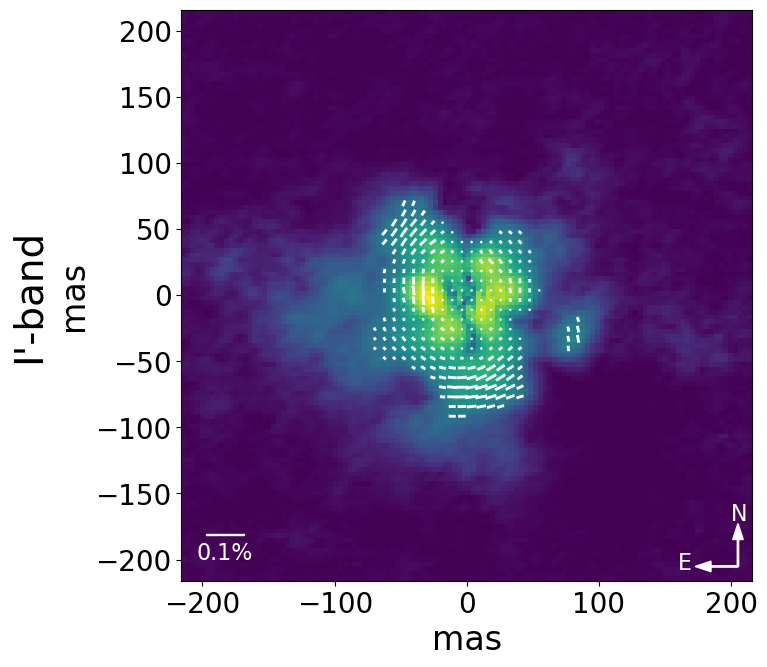
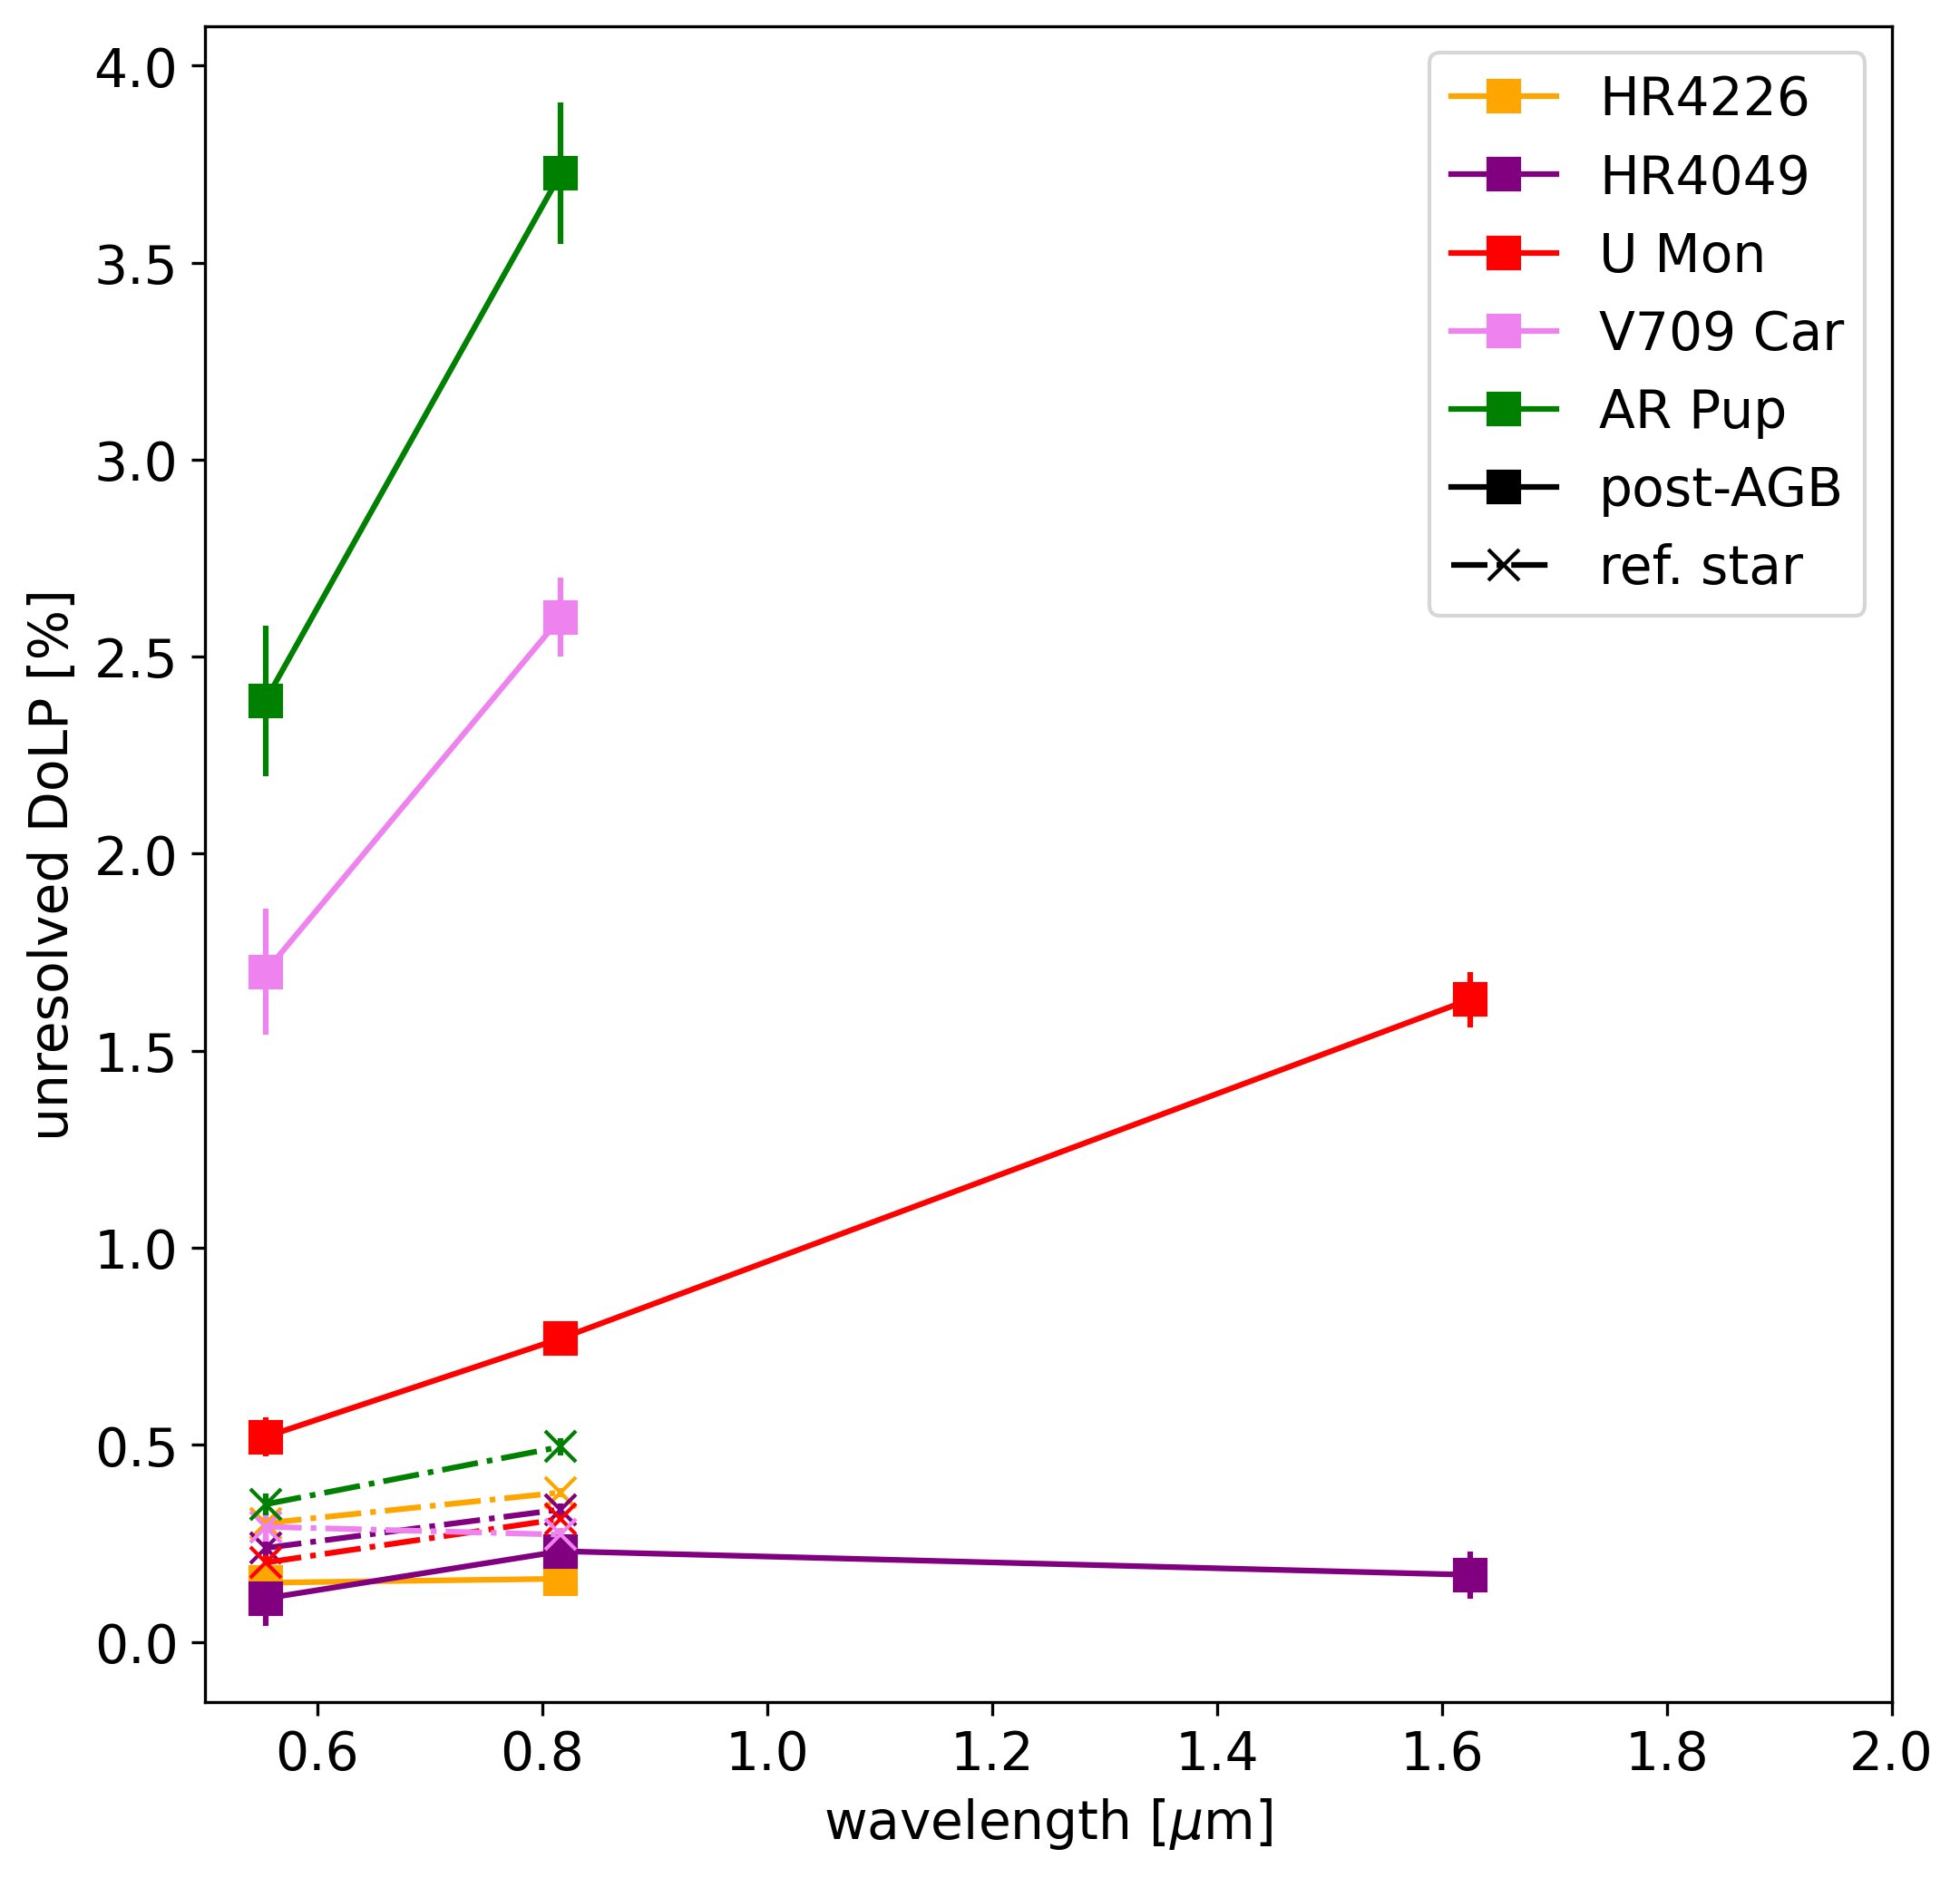
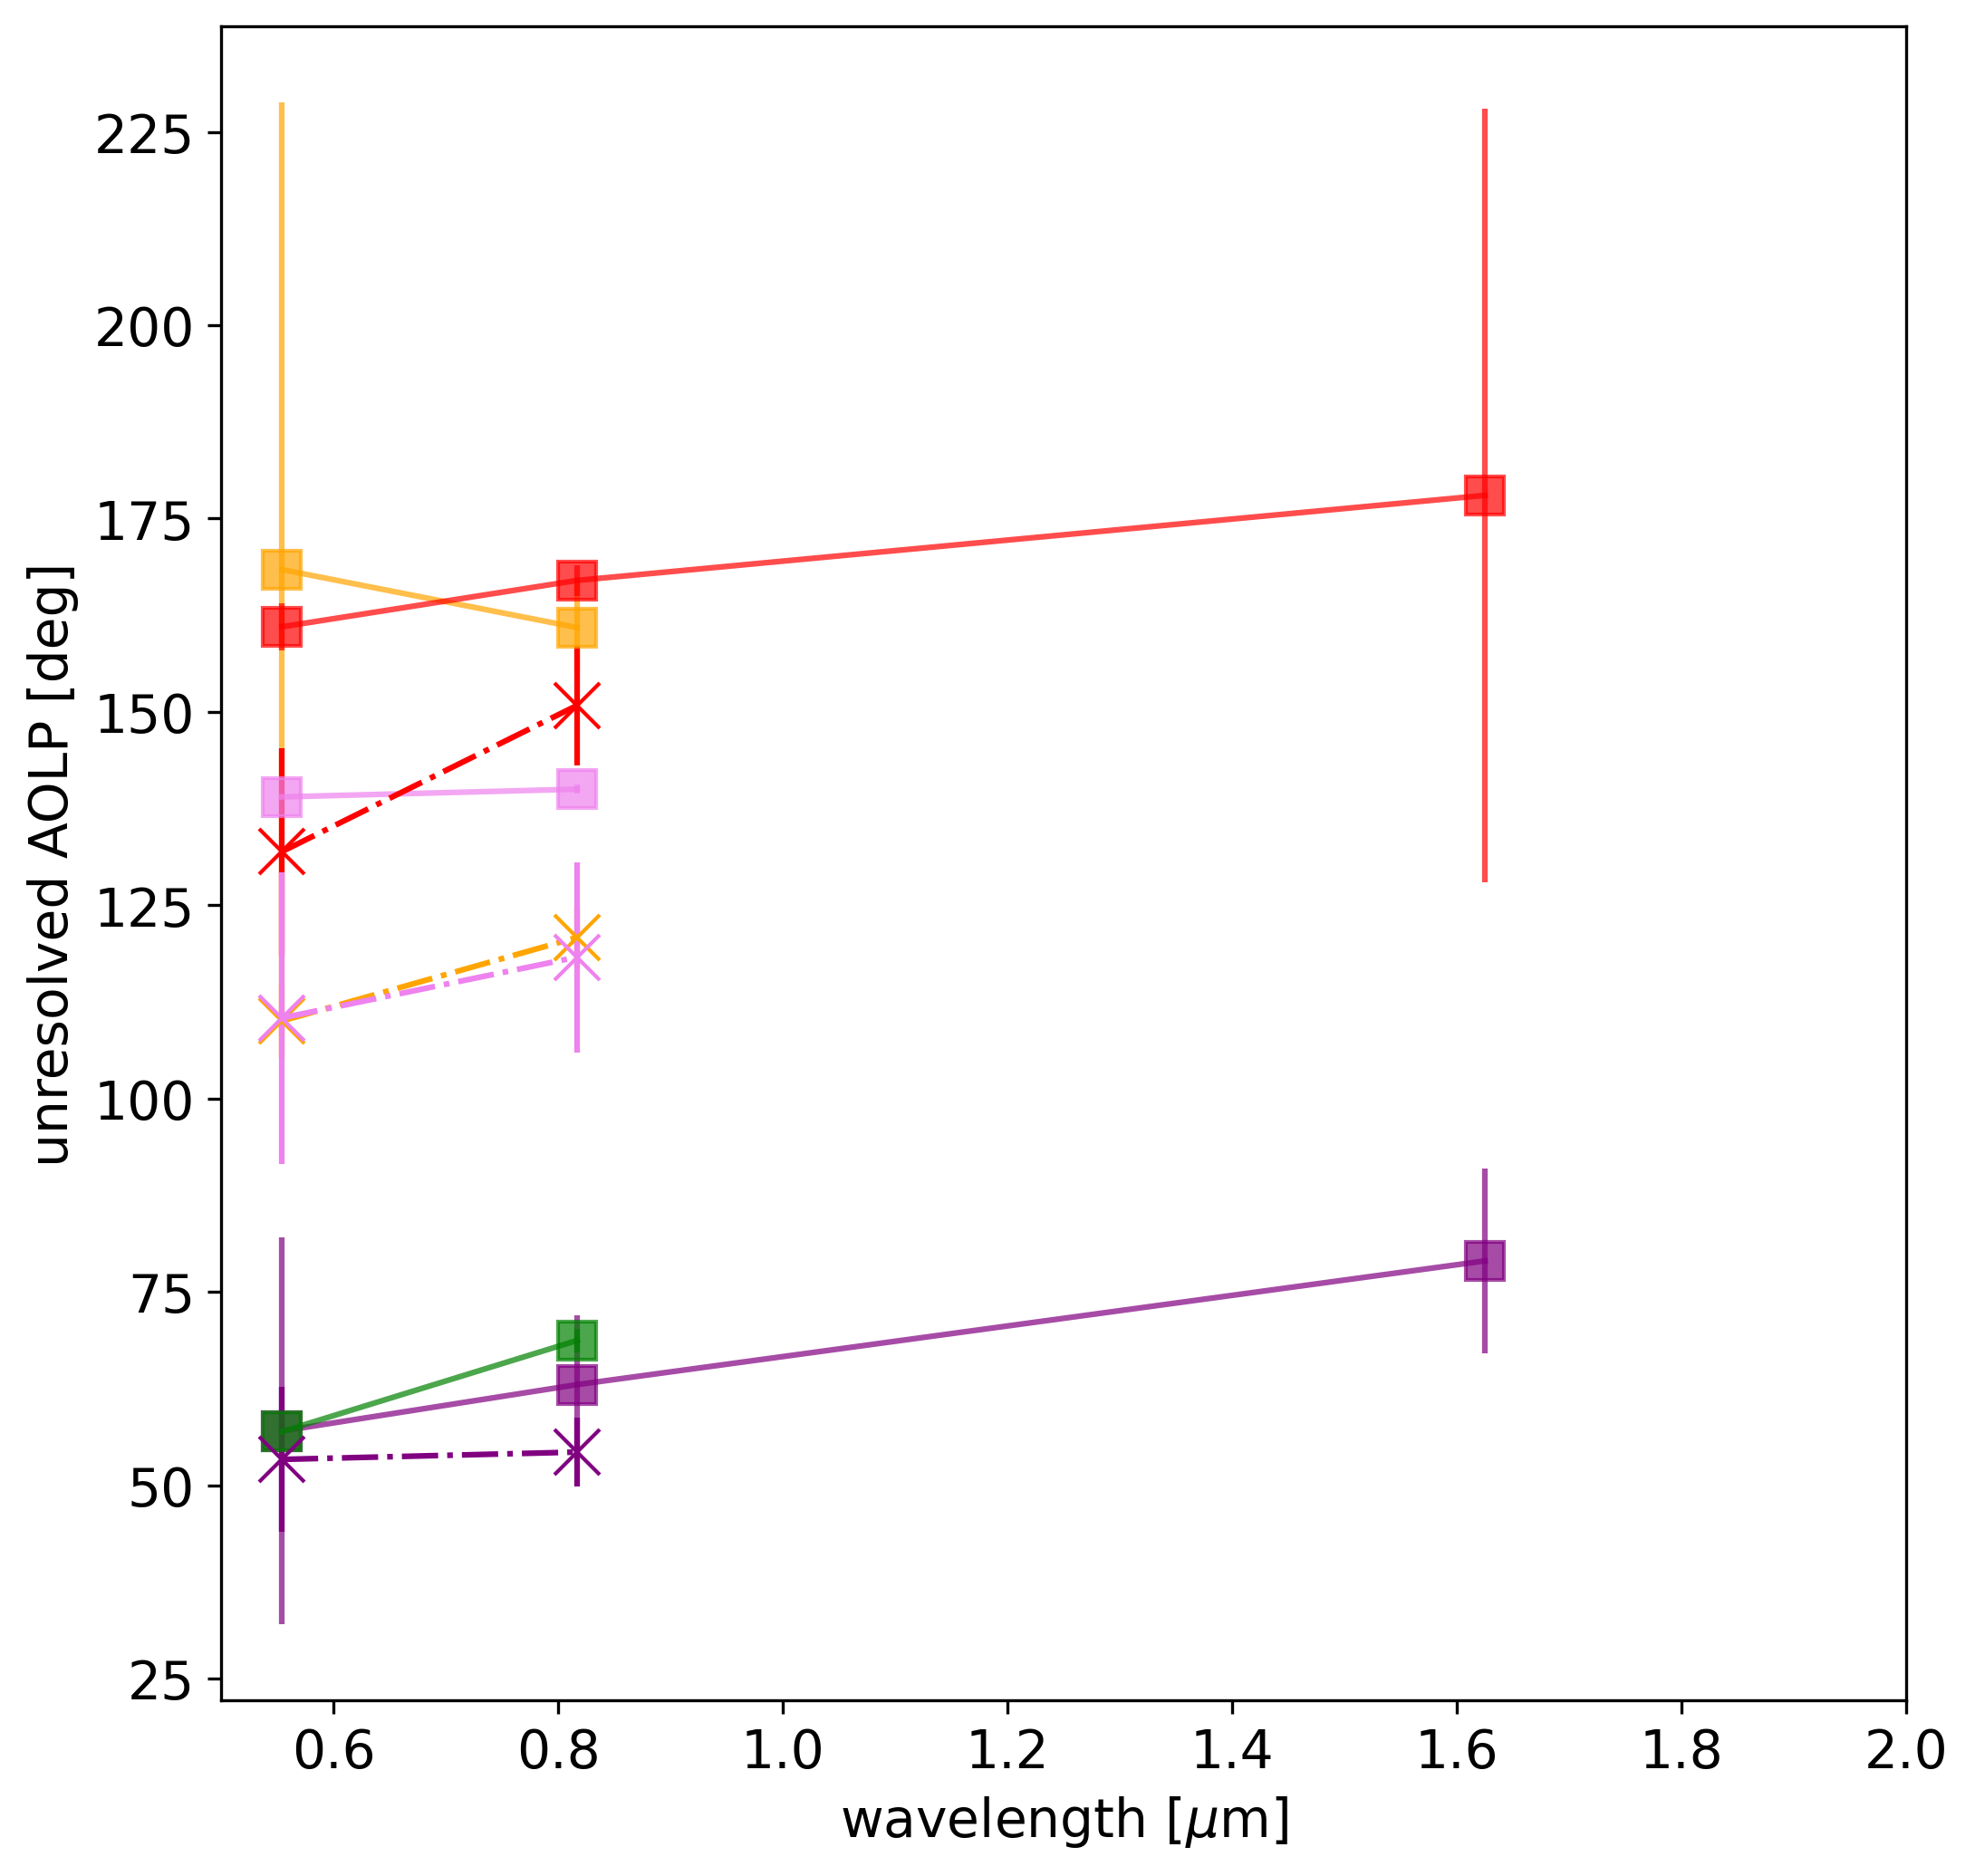
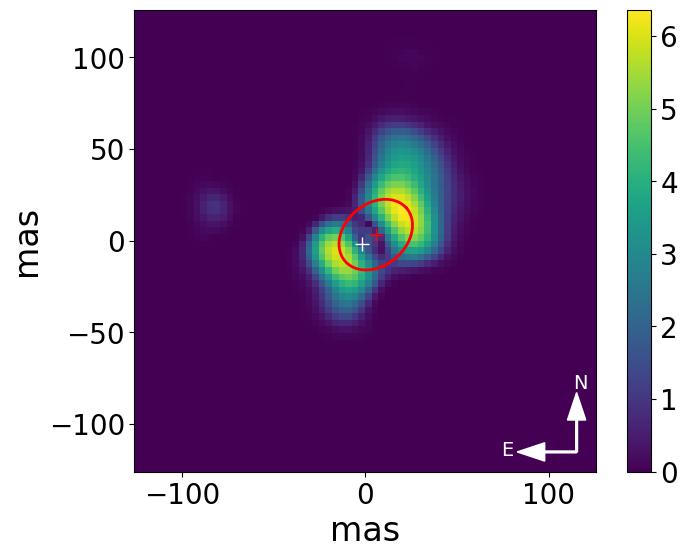
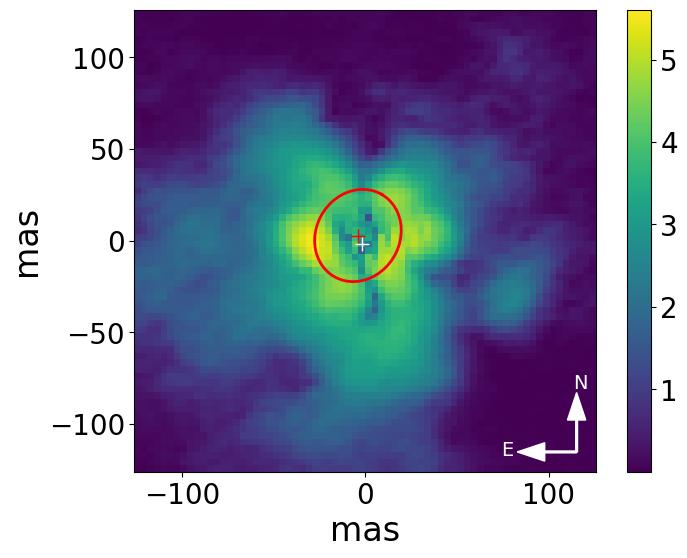
We also compared the degree of this unresolved polarization with the total linear polarization detected from reference stars at the observed wavelengths (see Fig. 1) and results of Galactic interstellar polarization surveys Heiles2000AJ....119..923H; Versteeg2023AJ....165...87V. This comparison helps to determine whether the unresolved signal originates primarily from interstellar polarization or the disc itself Andrych2024IRAS08. We found that for HR 4049 and V709 Car the degree of the unresolved polarization component closely aligns with the estimated interstellar polarization. In contrast, for AR Pup, HR 4226, and U Mon, it is significantly higher, indicating that the unresolved polarization is primarily driven by the unresolved portion of the circumbinary disc rather than the polarization from the diffuse interstellar medium along the line of sight. We note that in the case of AR Pup, viewed nearly edge-on with the disc partially obscuring the central star, the unresolved central polarized signal is overestimated, making it impossible to subtract without disturbing the resolved disc structure. For all other targets, we subtracted the measured unresolved central polarized signal from the and images and recalculated and , ensuring that the final images reflect only the resolved circumstellar material. However, this method produces an unrealistically low intensity in the central 5x5 pixel region of the and images. Therefore, we exclude this region from further analysis (see Section 3.2.7). The resulting polarized images are presented in Fig.2.
| Name | Band | DoLP, % | AoLP, ∘ |
|---|---|---|---|
| AR Pup | V | 2.40.2 | 572 |
| N_I | 3.70.2 | 692 | |
| HR4049 | V | 0.110.07 | 5725 |
| Cnt820 | 0.230.04 | 639 | |
| H∗ | 0.170.06 | 7912 | |
| HR4226 | V | 0.150.06 | 16862 |
| Cnt820 | 0.160.04 | 1616 | |
| U Mon | V | 0.520.05 | 1613.4 |
| Cnt820 | 0.770.04 | 1671.5 | |
| H∗ | 1.630.07 | 17850 | |
| V709 Car | V | 1.70.16 | 1390.9 |
| N_I | 2.60.1 | 1400.6 |
-
•
Notes: ’DoLP’ represents the degree of linear polarisation, ’AoLP’ represents the predominant angle of linear polarisation for the unresolved central polarisation. See Section 3.2 for details. We note that for AR Pup the orientation of the disc likely leads to a significant overestimation of the unresolved polarized signal (see Section 4.7.1).
3.2.4 Correction of PSF smearing effect
To accurately measure the total polarized flux from the circumbinary disc, we also corrected resolved and images for polarimetric cancellation due to PSF smearing with the instrument PSF, following the methodology proposed by Ma2024A&A...683A..18M. While correction of polarimetric cancellation is crucial for restoring the total polarimetric brightness for barely resolved targets, it can distort the resolved disc structure near the binary Andrych2024IRAS08. Therefore, the correction was used solely to restore the polarimetric brightness and omitted during disc orientation and morphology analyses.
3.2.5 Estimation of the signal-to-noise ratio (SNR)
To determine the statistically significant region of the final reduced images, we measured the background noise using an annular region of the reduced image without the target signal and defined the region of with a signal-to-noise ratio (SNR) of as statistically significant for each observation (see second and fourth column of Fig. 2). We also estimated the spatial resolution of the data to be mas for all targets except AR Pup (with mas, likely due to slightly worse observing conditions or suboptimal selection of the reference star), which is consistent with SPHERE/ZIMPOL specifications Schmid2018A&A...619A...9S.
3.2.6 Deconvolution
Finally, to retrieve the specially resolved substructures we deconvolved the resulting linearly polarized images with the reference PSF using the Richardson–Lucy deconvolution algorithm Richardson1972JOSA...62...55R; Lucy1974AJ.....79..745L. We note that convergence of the deconvolution process was achieved within 30 iterations for both and bands for all targets, with pixel-to-pixel variation between neighbouring iterations reaching less than 1.5%. However, we note that the same amount of iterations was overcorrecting the AR Pup and V709 Car images, resulting in degenerate results. Therefore, for AR Pup and V709 Car, we stopped iterations when we achieved pixel-to-pixel variation of 5% ( iterations).
3.2.7 Data reduction artefacts
Some of the features observed in the resulting polarized images (see Fig.2) are data reduction artefacts rather than real disc substructures. Below, we describe these artefacts and their possible causes.
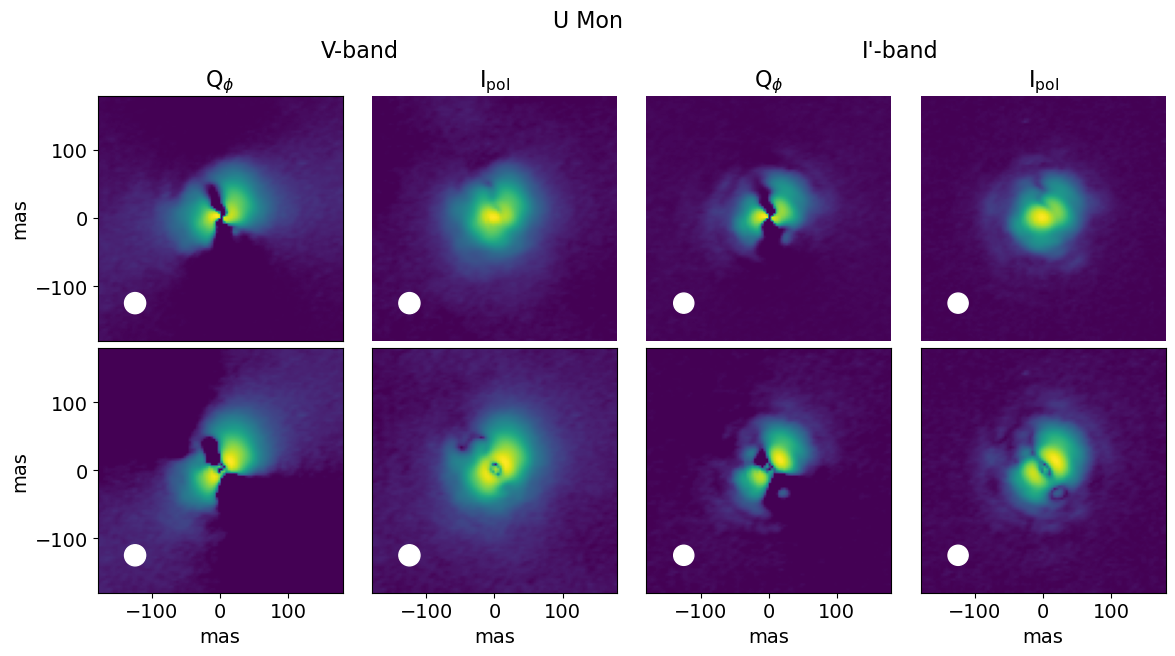
During data reduction, we correct for the unresolved central polarization to retrieve the polarized intensity of the resolved disc (see Section 3.2.3). However, this method produces an unrealistically low intensity in the central 5x5 pixel region of the and images, and any intrinsic component remains undetectable due to limited spatial resolution (see Fig.2). Therefore, we exclude this region from further analysis, noting that this discrepancy is an artefact of the reduction process. In addition, the final reduced -band image of U Mon shows a bright ring, while the -band image shows two arcs separated by a dark strip. This dark strip is also an artefact of the unresolved central polarization subtraction, which inadvertently removes some polarized emission from the disc.
For AR Pup, we do not apply the correction for the unresolved central polarization due to the inability to clearly separate it from the resolved signal, given the edge-on orientation of the disc (see Section 3.2.3). However, the overlapping of differently oriented polarization vectors from the unresolved intensity and the resolved disc structure creates two linear ‘shadows’ within 20 mas of the central binary, perpendicular to the disc midplane. We emphasize that these shadows are not physical features of AR Pup but rather artefacts of the observational technique and data reduction.
Additionally, the reduced images of HR 4226, HR 4049, and V709 Car exhibits a thin cross-shaped decrease in polarized intensity, particularly visible in the -band data for HR 4226. This pattern is not a genuine feature, but rather a reduction artefact, as it is also seen in reference star data for these targets. While the exact cause of this effect is unclear, we emphasize these are not physical characteristics of the circumbinary discs of HR 4226, HR 4049, and V709 Car.
4 Analysis and Results
In this section, we present the analysis of reduced linearly polarized images and discuss the results for each target individually, following the methodology presented in Andrych2023MNRAS.524.4168A; Andrych2024IRAS08. Our analysis includes investigating the fractional polarization, determining the disc orientation, defining the relative disc brightness in polarized light, and characterizing the wavelength-dependent polarized intensity and structure of circumbinary discs.
4.1 Measuring fractional polarisation
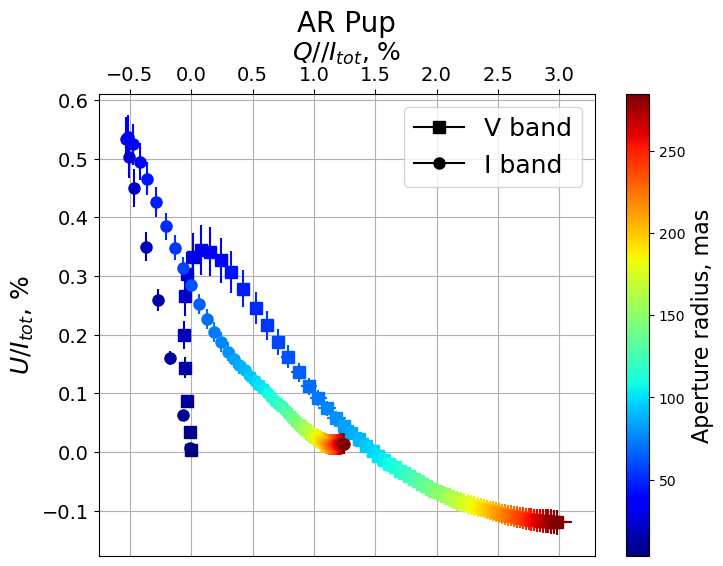
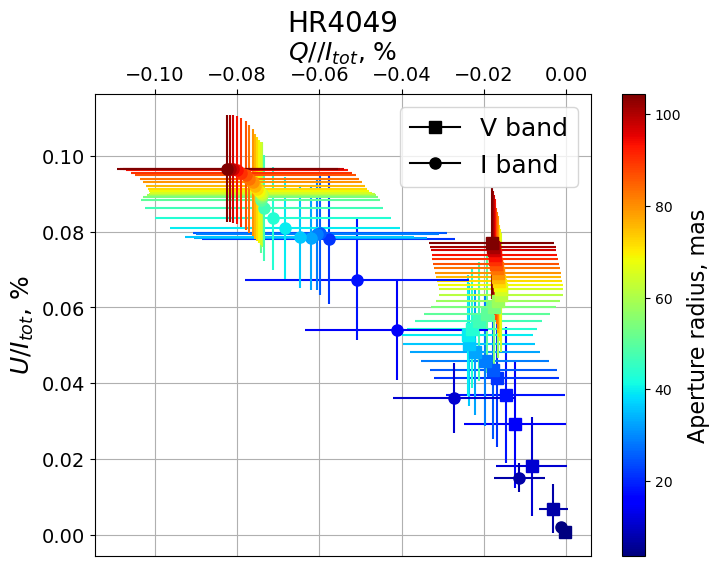
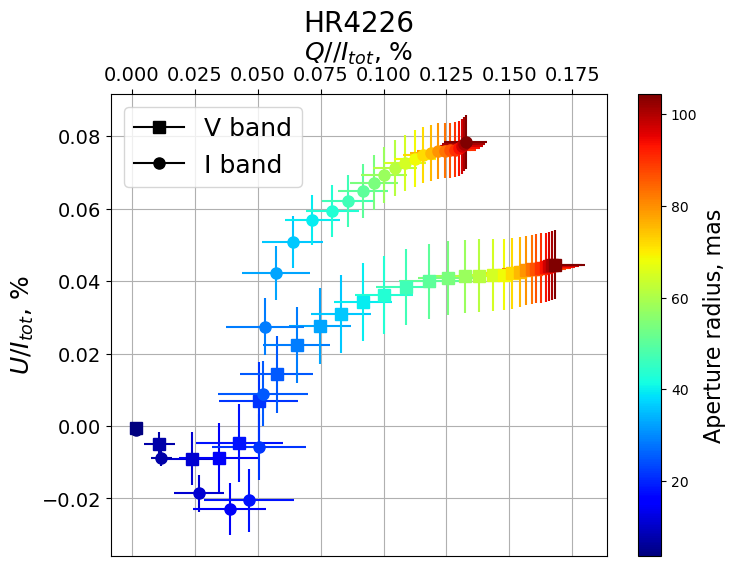
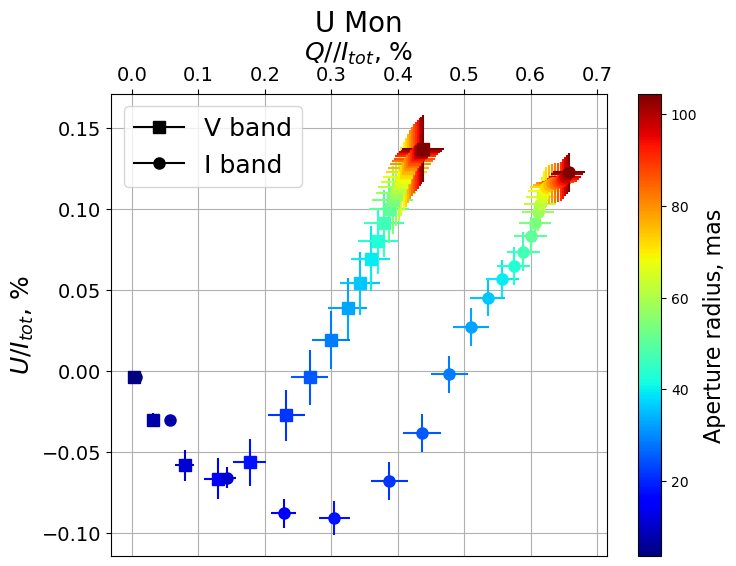
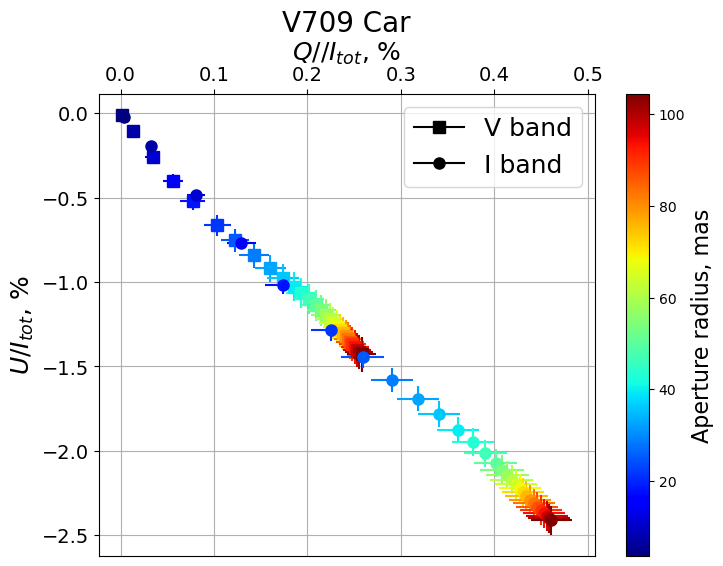
To investigate geometric variations in the circumbinary discs of our five targets, we analyzed how fractional polarization () varies with distance from the central binary using aperture polarimetry. This method offers insights into the unresolved disc component contributing to the detected central polarization. Significant tearing or misalignment in the disc would manifest as abrupt shifts in the plane(Nixon2013MNRAS.434.1946N; Kraus2020Sci...369.1233K, e.g.,).
We measured total fractional polarization and using circular apertures that gradually increased in radius from 0.004” to 0.11” (0.25” for AR Pup), with a step size of 0.0036” (1 pixel). The resulting data (see Fig. 16 in C) show a smooth and continuous change in fractional polarization with aperture size for all targets. However, the curves for AR Pup, HR 4226, and U Mon exhibit a more complex shape, likely due to changes in the orientation of the scattering surface relative to the binary, which affects the resulting polarization vector. Additionally, interstellar polarization contributes to the unresolved central polarization, impacting the fractional polarization closer to the binary. This effect could explain the changes in polarization orientation, particularly for HR 4226 and U Mon, given their small disc sizes. We discuss these factors in more detail for each target in Section 4.7.
4.2 Measuring the polarized disc brightness
To estimate the polarized disc brightness relative to the total intensity of the system, we calculated the ratio of the resolved polarized emission from the disc to the total unpolarized intensity of the target. The resolved polarized emission was measured within the area with SNR for each observation, while total unpolarized intensity was integrated in a large 3” aperture. To minimize bias, we used the azimuthally polarized, total polarized and unpolarized images (, and ) prior to deconvolution with the point spread function (PSF), while also accounting for the effects of PSF smearing during the observations (see Section 3.2). We note that the resulting values for polarized disc brightness represent a lower limit due to the partial subtraction of the disc polarized signal during data reduction. The final polarized disc brightness ratios ( and , where is the total system intensity integrated in a large 3” aperture) for both the and bands across all targets are presented in Table 4. For reference, we also provide the polarized disc brightness value without PSF smearing correction ().
To ensure an accurate comparison of the available SPHERE/ /ZIMPOL and SPHERE/IRDIS data for our targets, we also applied a similar correction for PSF smearing to the -band SPHERE/IRDIS data of HR 4049 and U Mon, which were previously analyzed and presented by Andrych2023MNRAS.524.4168A.
| Name | Band |
|
|
|
|
|
|
|
|
|||||||||||||||||
|---|---|---|---|---|---|---|---|---|---|---|---|---|---|---|---|---|---|---|---|---|---|---|---|---|---|---|
| AR Pup | V | 80 | - | 7510 | 505 | - | 75 | 4.40.3 | 4.40.3 | 3.00.2 | ||||||||||||||||
| N_I | 80 | - | 7510 | 505 | - | 80 | 5.10.3 | 5.20.2 | 3.60.2 | |||||||||||||||||
| HR4049 | V | 29 | 25 | 29 | 109 | 0.5 | >85 | 1.10.3 | 1.20.3 | 0.50.1 | ||||||||||||||||
| Cnt820 | 29 | 27 | 23 | 138 | 0.4 | >85 | 0.950.1 | 0.950.1 | 0.510.05 | |||||||||||||||||
| H∗∗ | 37 | 35 | 17 | 174 | 0.29 | - | 0.60.15† | 0.60.15† | 0.30.15 | |||||||||||||||||
| HR4226 | V | 20 | 13 | 51 | 104 | 0.77 | >85 | 1.80.1 | 1.90.1 | 0.510.03 | ||||||||||||||||
| Cnt820 | 23 | 17 | 40 | 106 | 0.64 | >85 | 1.60.06 | 1.750.06 | 0.610.02 | |||||||||||||||||
| U Mon | V | 19 | 13 | 48 | 128 | 0.75 | 57 | 1.20.1 | 1.80.2 | 0.540.05 | ||||||||||||||||
| Cnt820 | 22 | 17 | 41 | 131 | 0.65 | 65 | 1.050.05 | 1.40.07 | 0.550.03 | |||||||||||||||||
| H∗∗ | 32 | 29 | 25 | 144 | 0.42 | - | 0.570.15† | 0.660.15† | 0.340.15 | |||||||||||||||||
| V709 Car | V | 19 | 16 | 27 | 121 | 0.47 | 68 | 0.50.06 | 0.60.09 | 0.290.03 | ||||||||||||||||
| N_I | 26 | 23 | 28 | 150 | 0.47 | 80 | 0.400.04 | 0.490.07 | 0.250.03 |
-
•
Notes: and represent the major and minor half-axes of the disc in mas, indicates the inclination, represents the eccentricity. represent the ratio of azimuthal to total polarized disc brightness of the target. and represent the azimuthal and total polarized disc brightness relative to the total intensity of the target. represents the total polarized disc brightness without correction for the PSF smearing (see Section 3.2). The position angle () is presented in degrees and rises counterclockwise from the vertical axis (North) to the first principal radius (major axis). See Section 4 for more details.
∗∗ indicates the data adopted from Andrych2023MNRAS.524.4168A
4.3 Determination of disc orientation
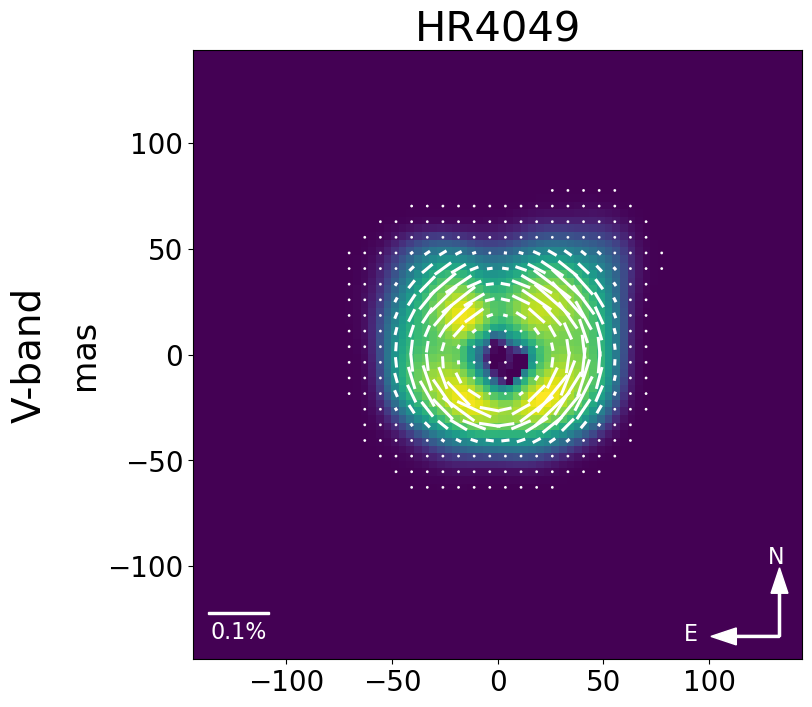
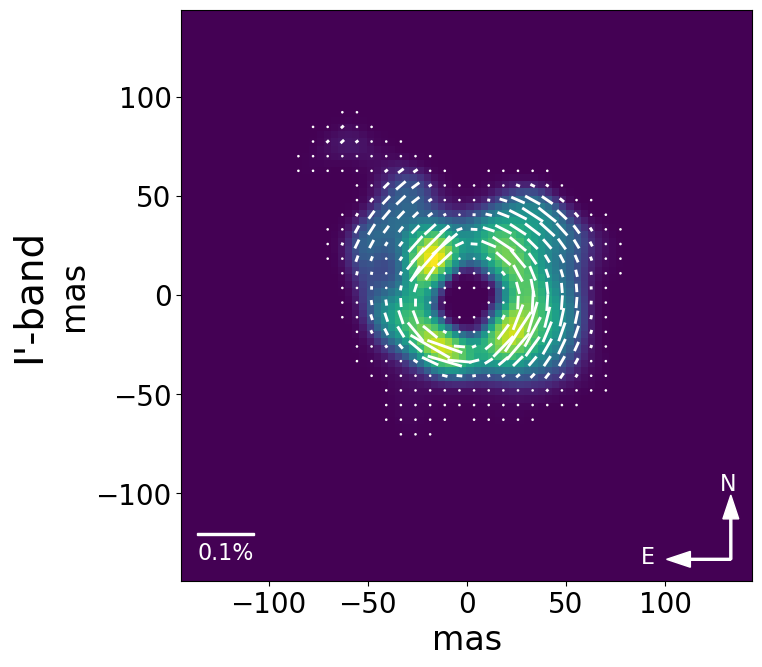
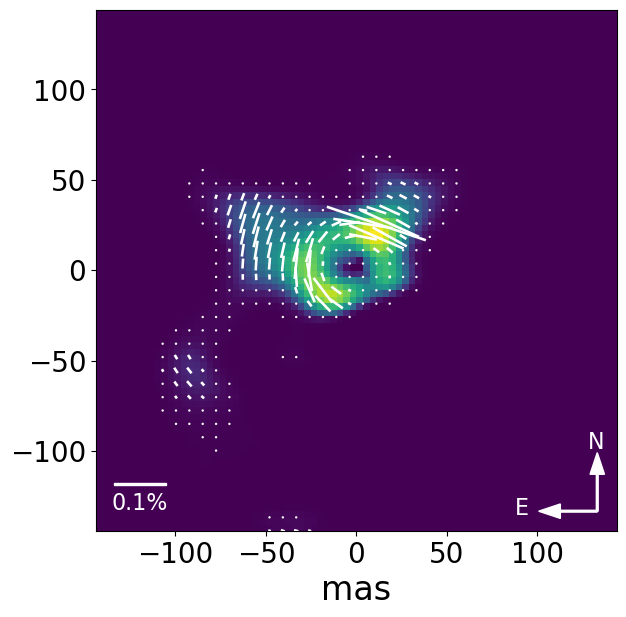
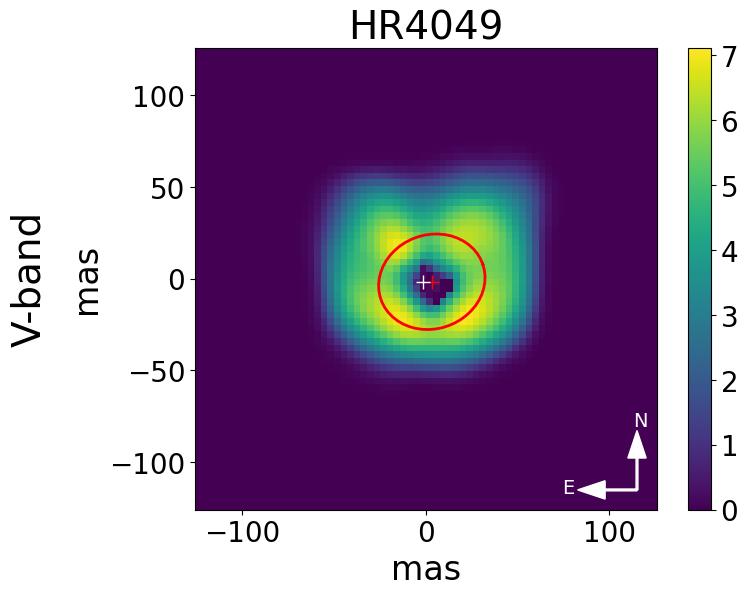
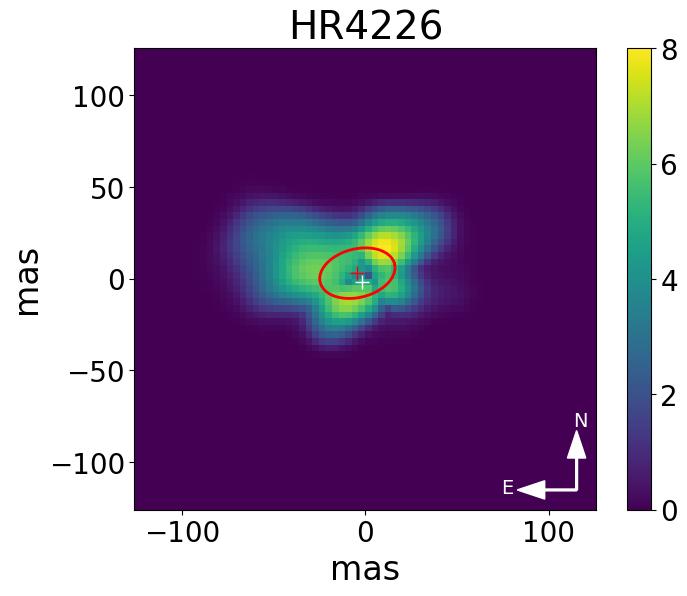
The final reduced polarized images reveal a bright resolved ‘ring’ structure in both and band observations for HR 4049, HR 4226, U Mon and V709 Car (see Fig. 2). However, for V709 Car, the ‘ring’ is not fully resolved and the target shows lower polarized intensity compared to the other targets (see Table 4), so it should be interpreted with caution. Additionally, no ‘ring’ is observed for AR Pup due to the nearly edge-on disc orientation (see Sec. 2 for details). Although we refer to the brightest resolved structure as a ‘ring’, it is important to clarify that it represents the smallest resolved section of the circumbinary disc close to the central binary rather than the physical dust inner rim of the circumbinary disc, which is too small to be resolved by the SPHERE instrument for post-AGB systems (see Section 3.2.7).
Following the methodology outlined in Andrych2023MNRAS.524.4168A; Andrych2024IRAS08, we used the deconvolved linearly polarized images (, or in case of HR 4049, see Section 3.2) to estimate the orientation of the resolved disc surface. To do this, we fitted an ellipse to the positions of peak brightness along the ‘ring’ and determined the corresponding semi-major and semi-minor axis lengths, as well as the position angle (PA)444The PA is measured counterclockwise from the vertical axis (North) to the first principal radius (major axis), with ambiguity in the disc PA on the sky. of the disc. Near-infrared interferometric observations of post-AGB circumbinary discs (Kluska2019A&A...631A.108K; Corporaal2023A&A...674A.151C, e.g.,) indicate that the dust inner rim aligns with or extends beyond the sublimation radius rather than being truncated by the binary. Additionally, SPHERE lacks the resolution to resolve the disc inner rim for any of these systems, instead probing the disc surface layers farther from the central binary. Therefore, regardless of the binary orbit eccentricity, the disc can be assumed to be circular, and its elliptical appearance (see second and fourth column of Fig. 2) as resulting from the projection onto the field of view. Following this assumption, we estimated the corresponding disc inclination for each target using the semi-major and semi-minor axes of the ellipse. The most plausible position and orientation of circumbinary discs, resolved in and bands for each target, are presented in Fig. 3 and Table 4.
4.4 Exploring the extended disc morphology
In this section, we investigate the extended disc morphology of our targets by analyzing the disc brightness profiles and examining the resolved substructures in both the and bands.
4.4.1 Brightness profiles
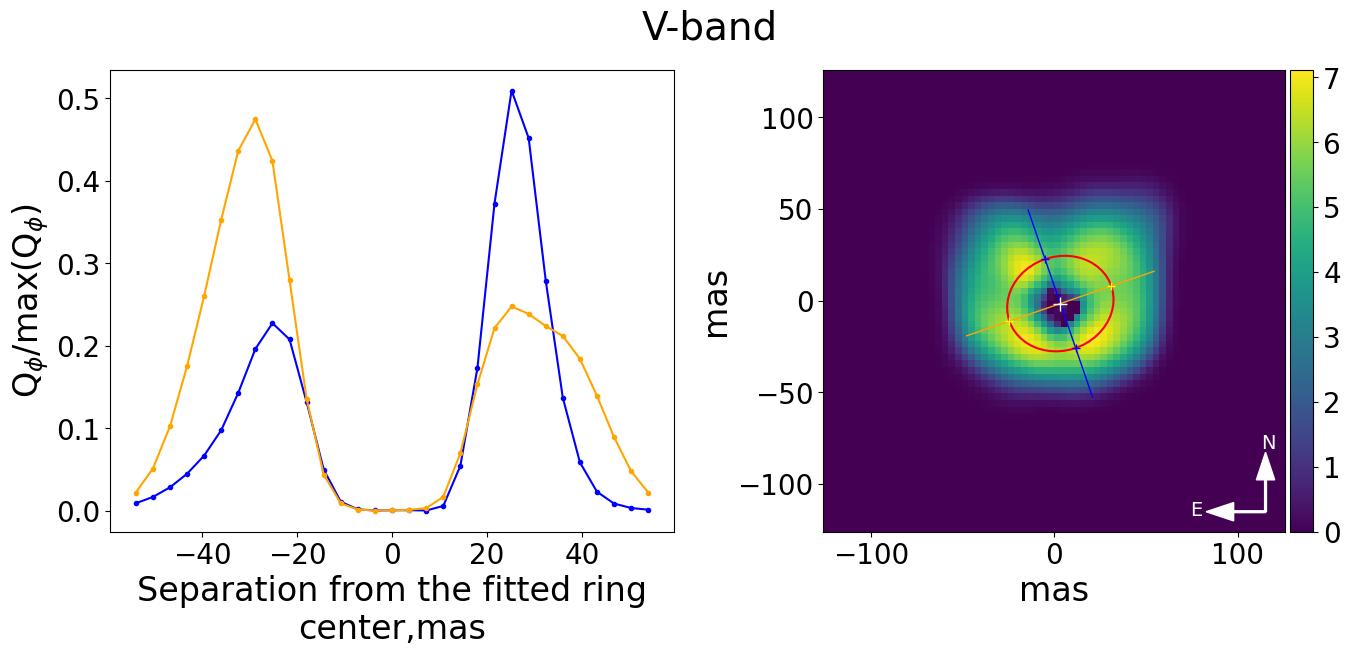
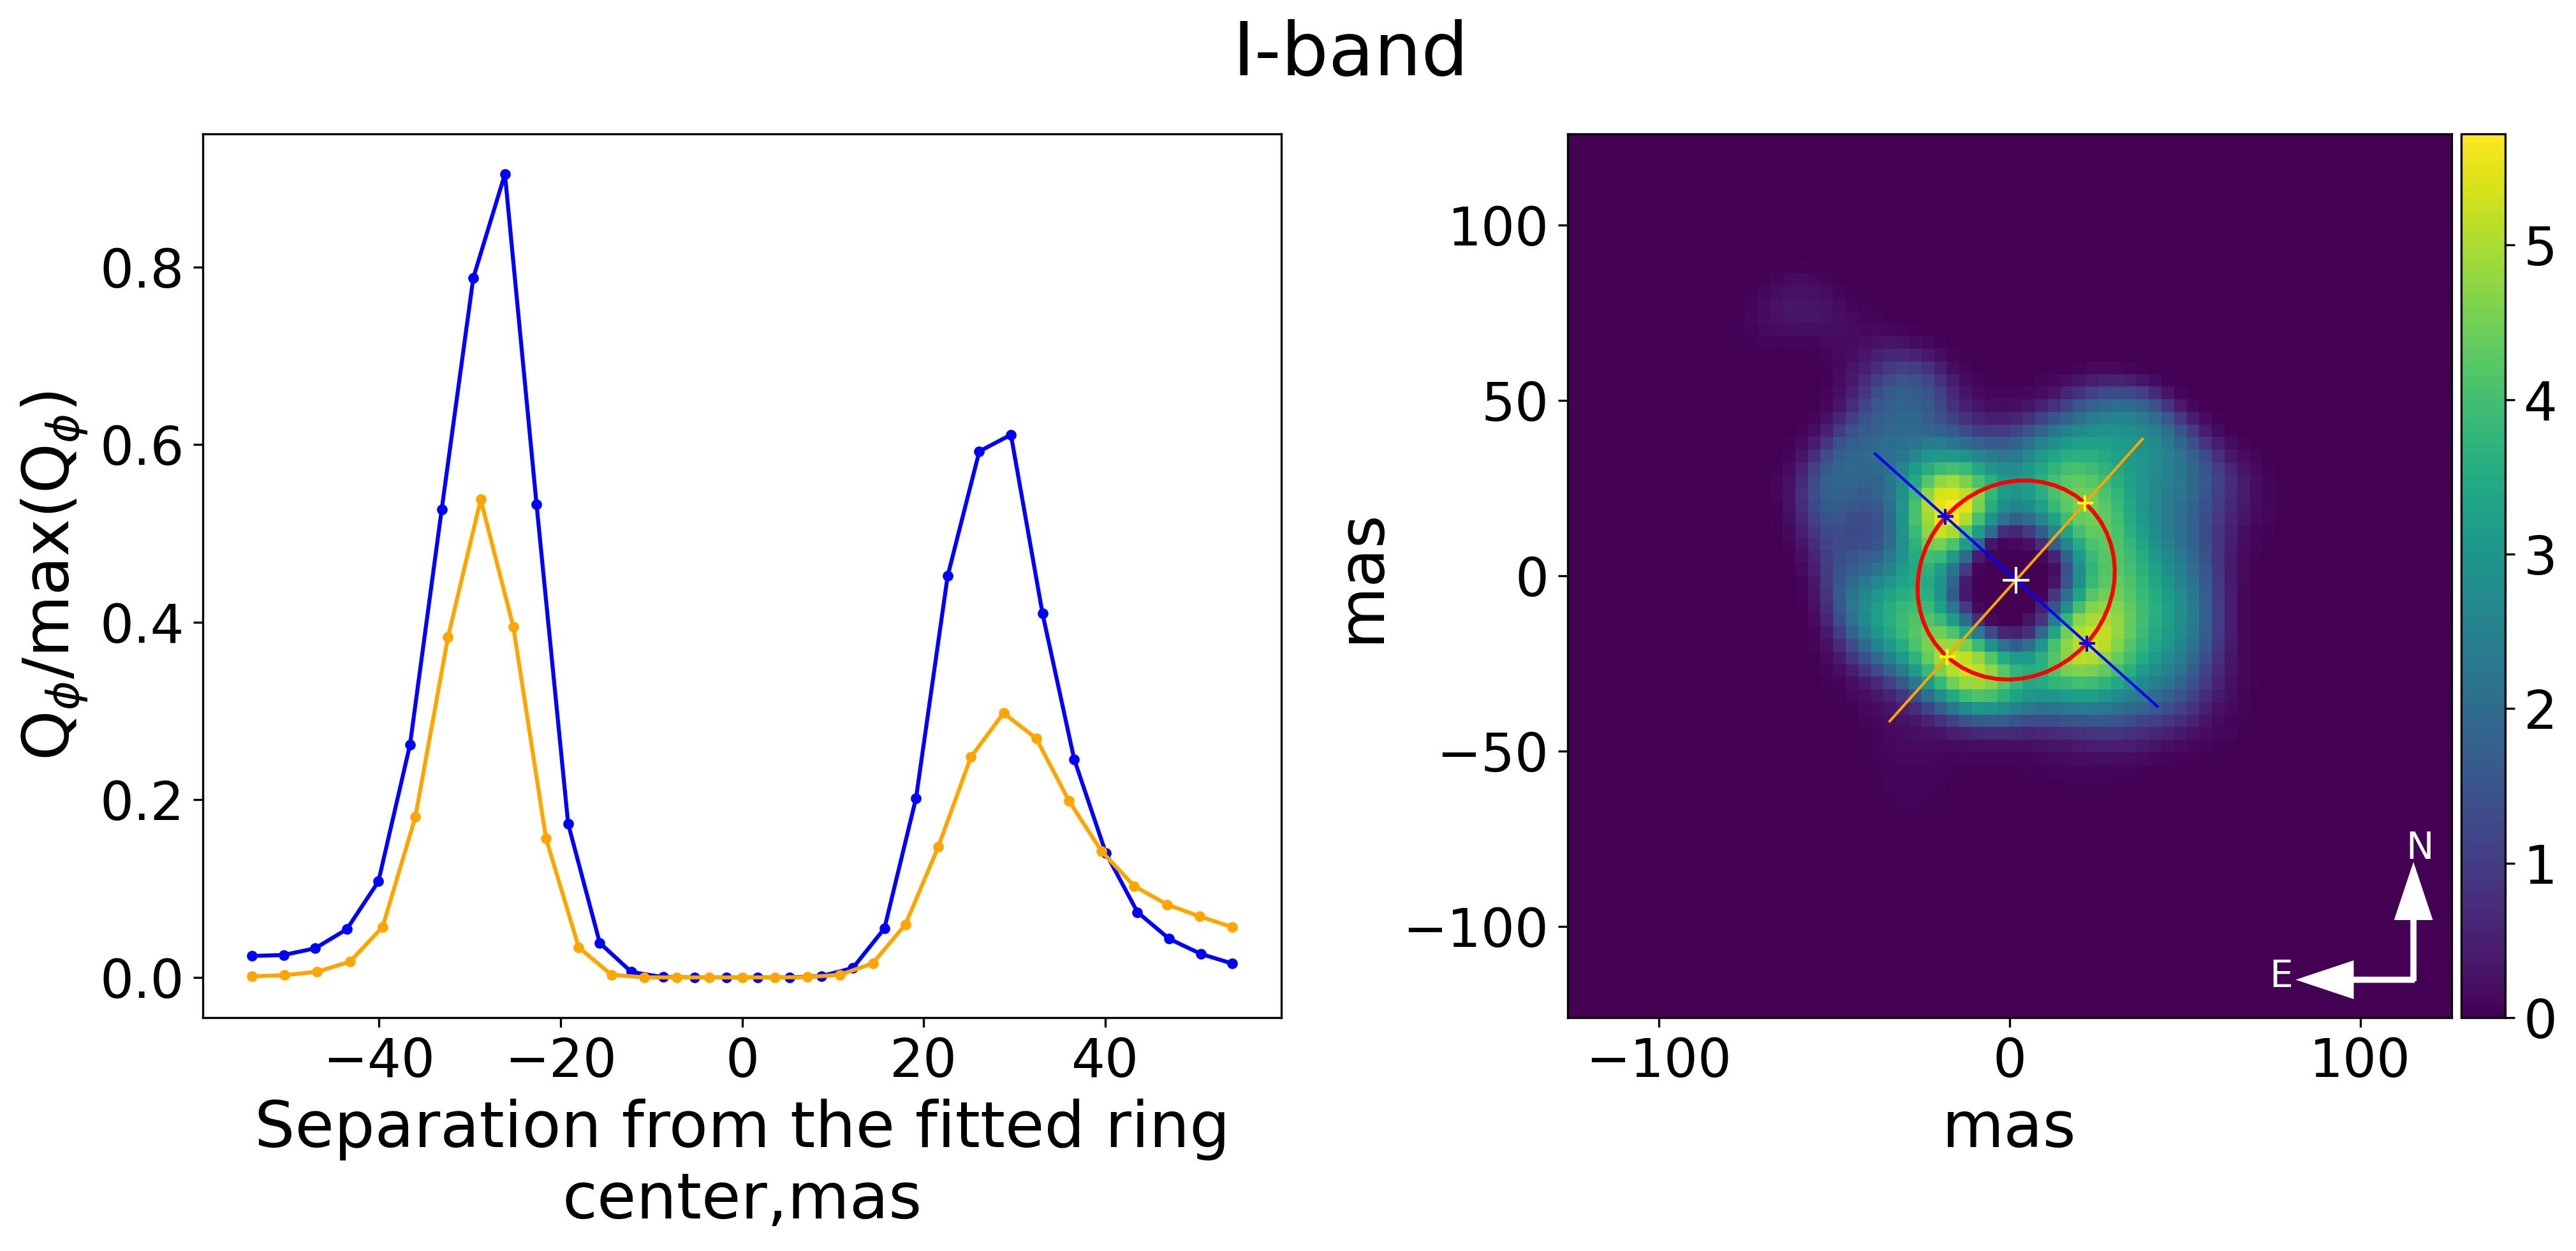
To explore the complexity of the resolved disc surface and reveal the spatial distribution of polarized intensity, we calculated linear, azimuthal, and radial brightness profiles following the methodology of Andrych2023MNRAS.524.4168A; Andrych2024IRAS08.
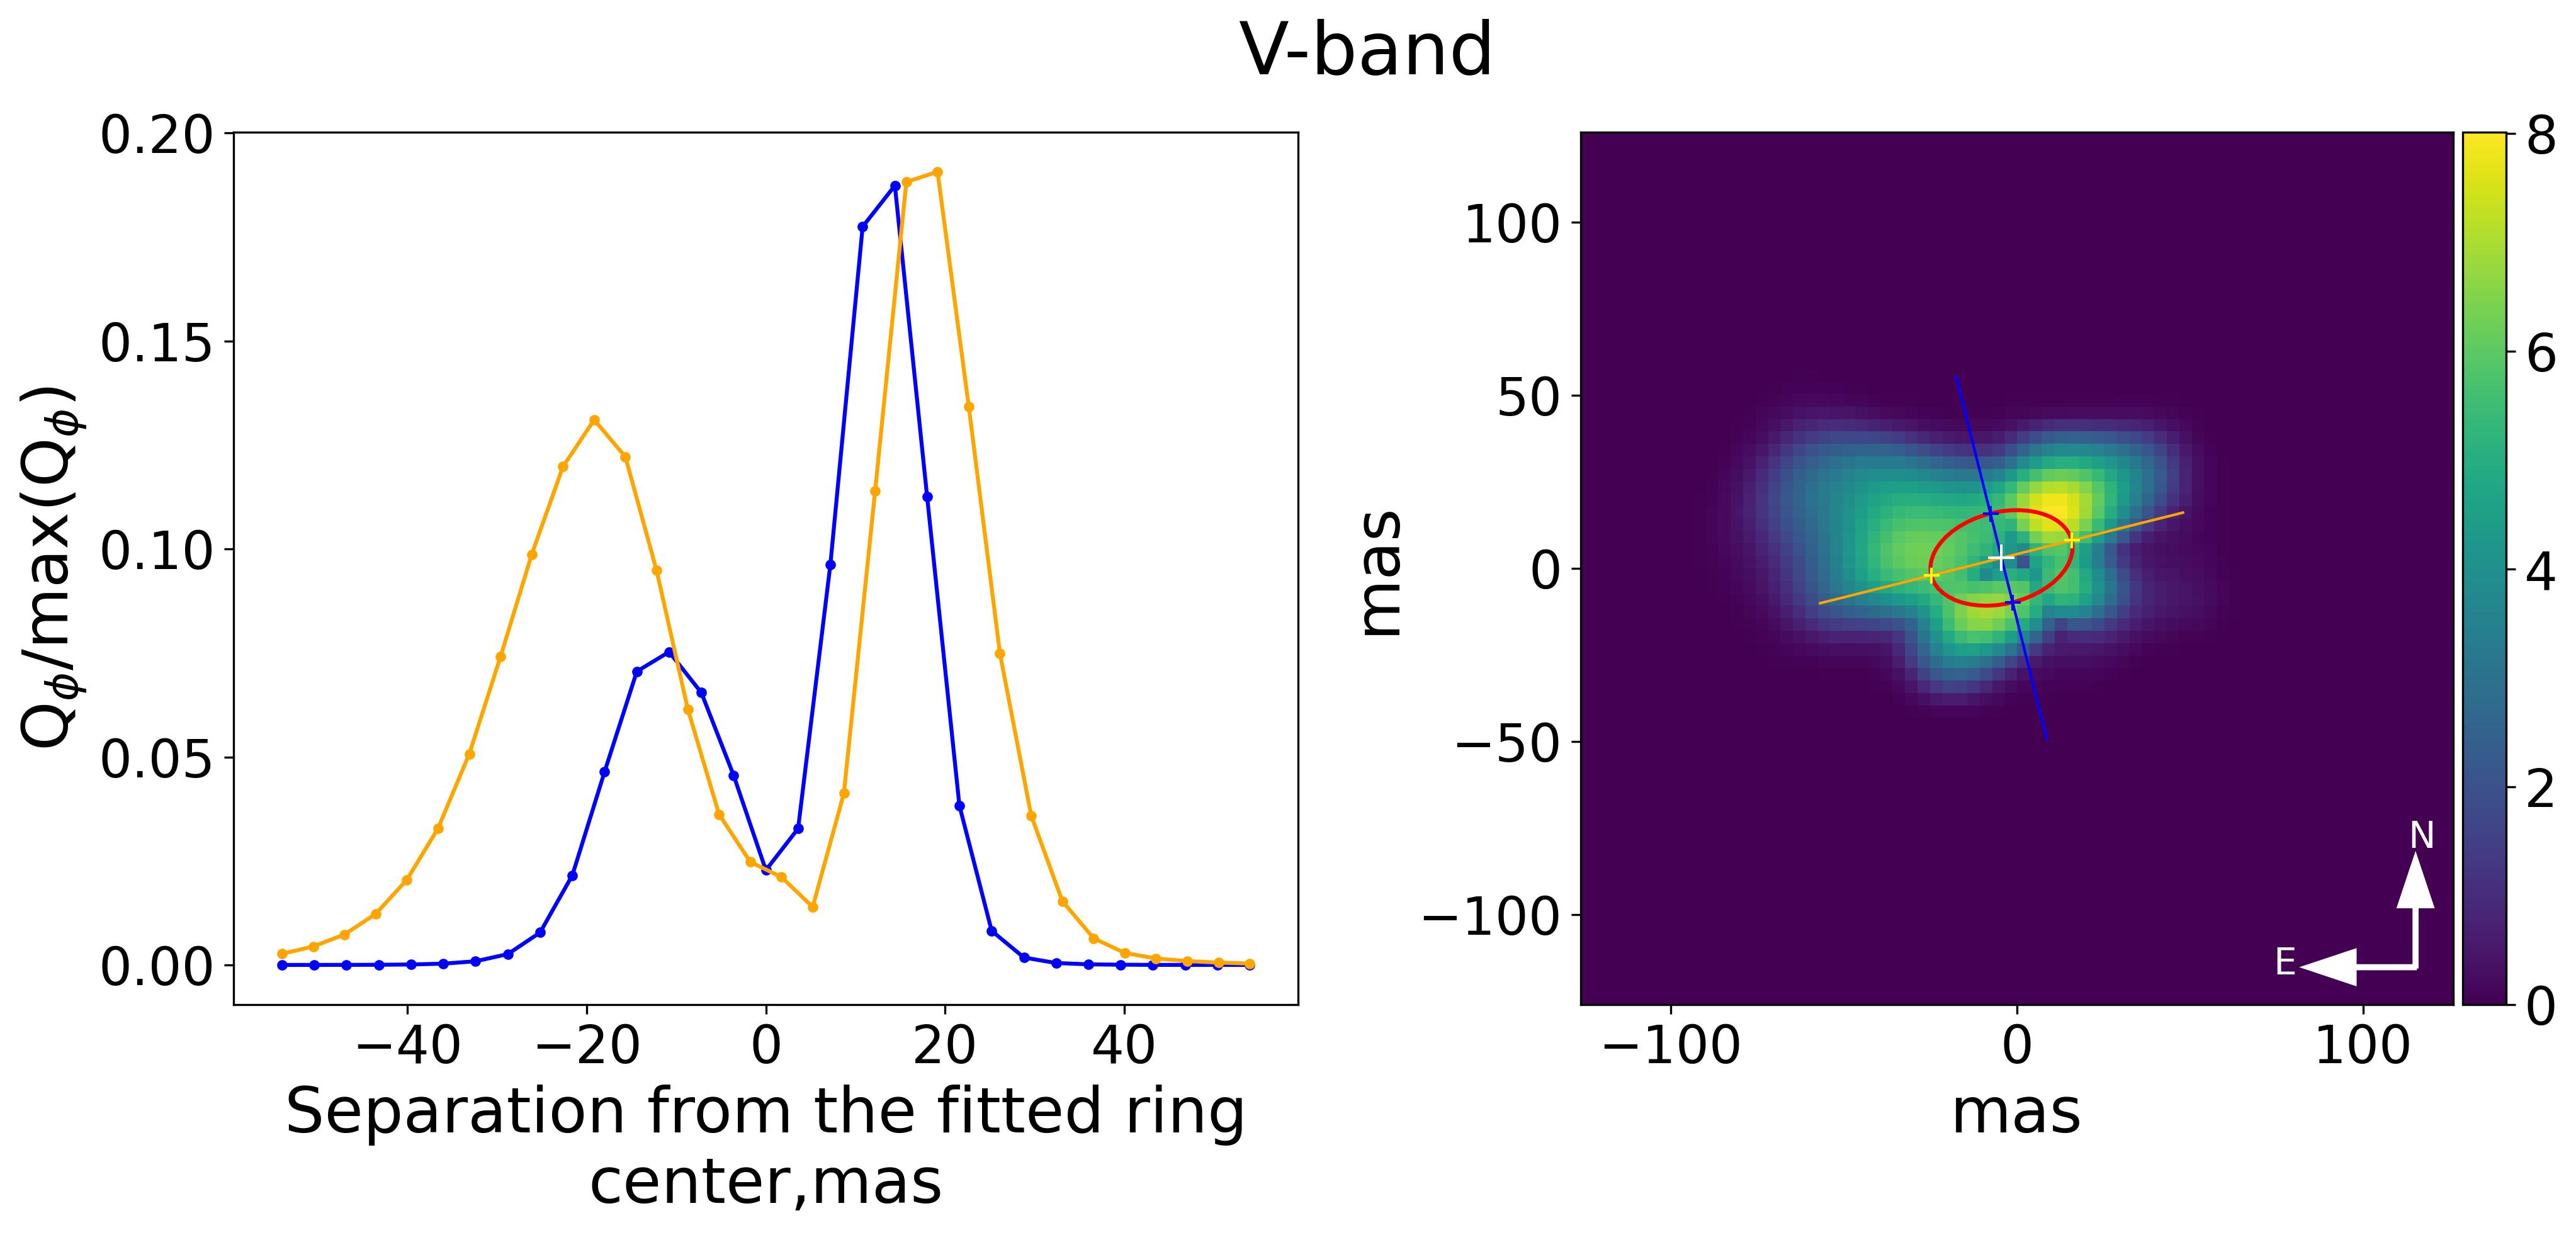
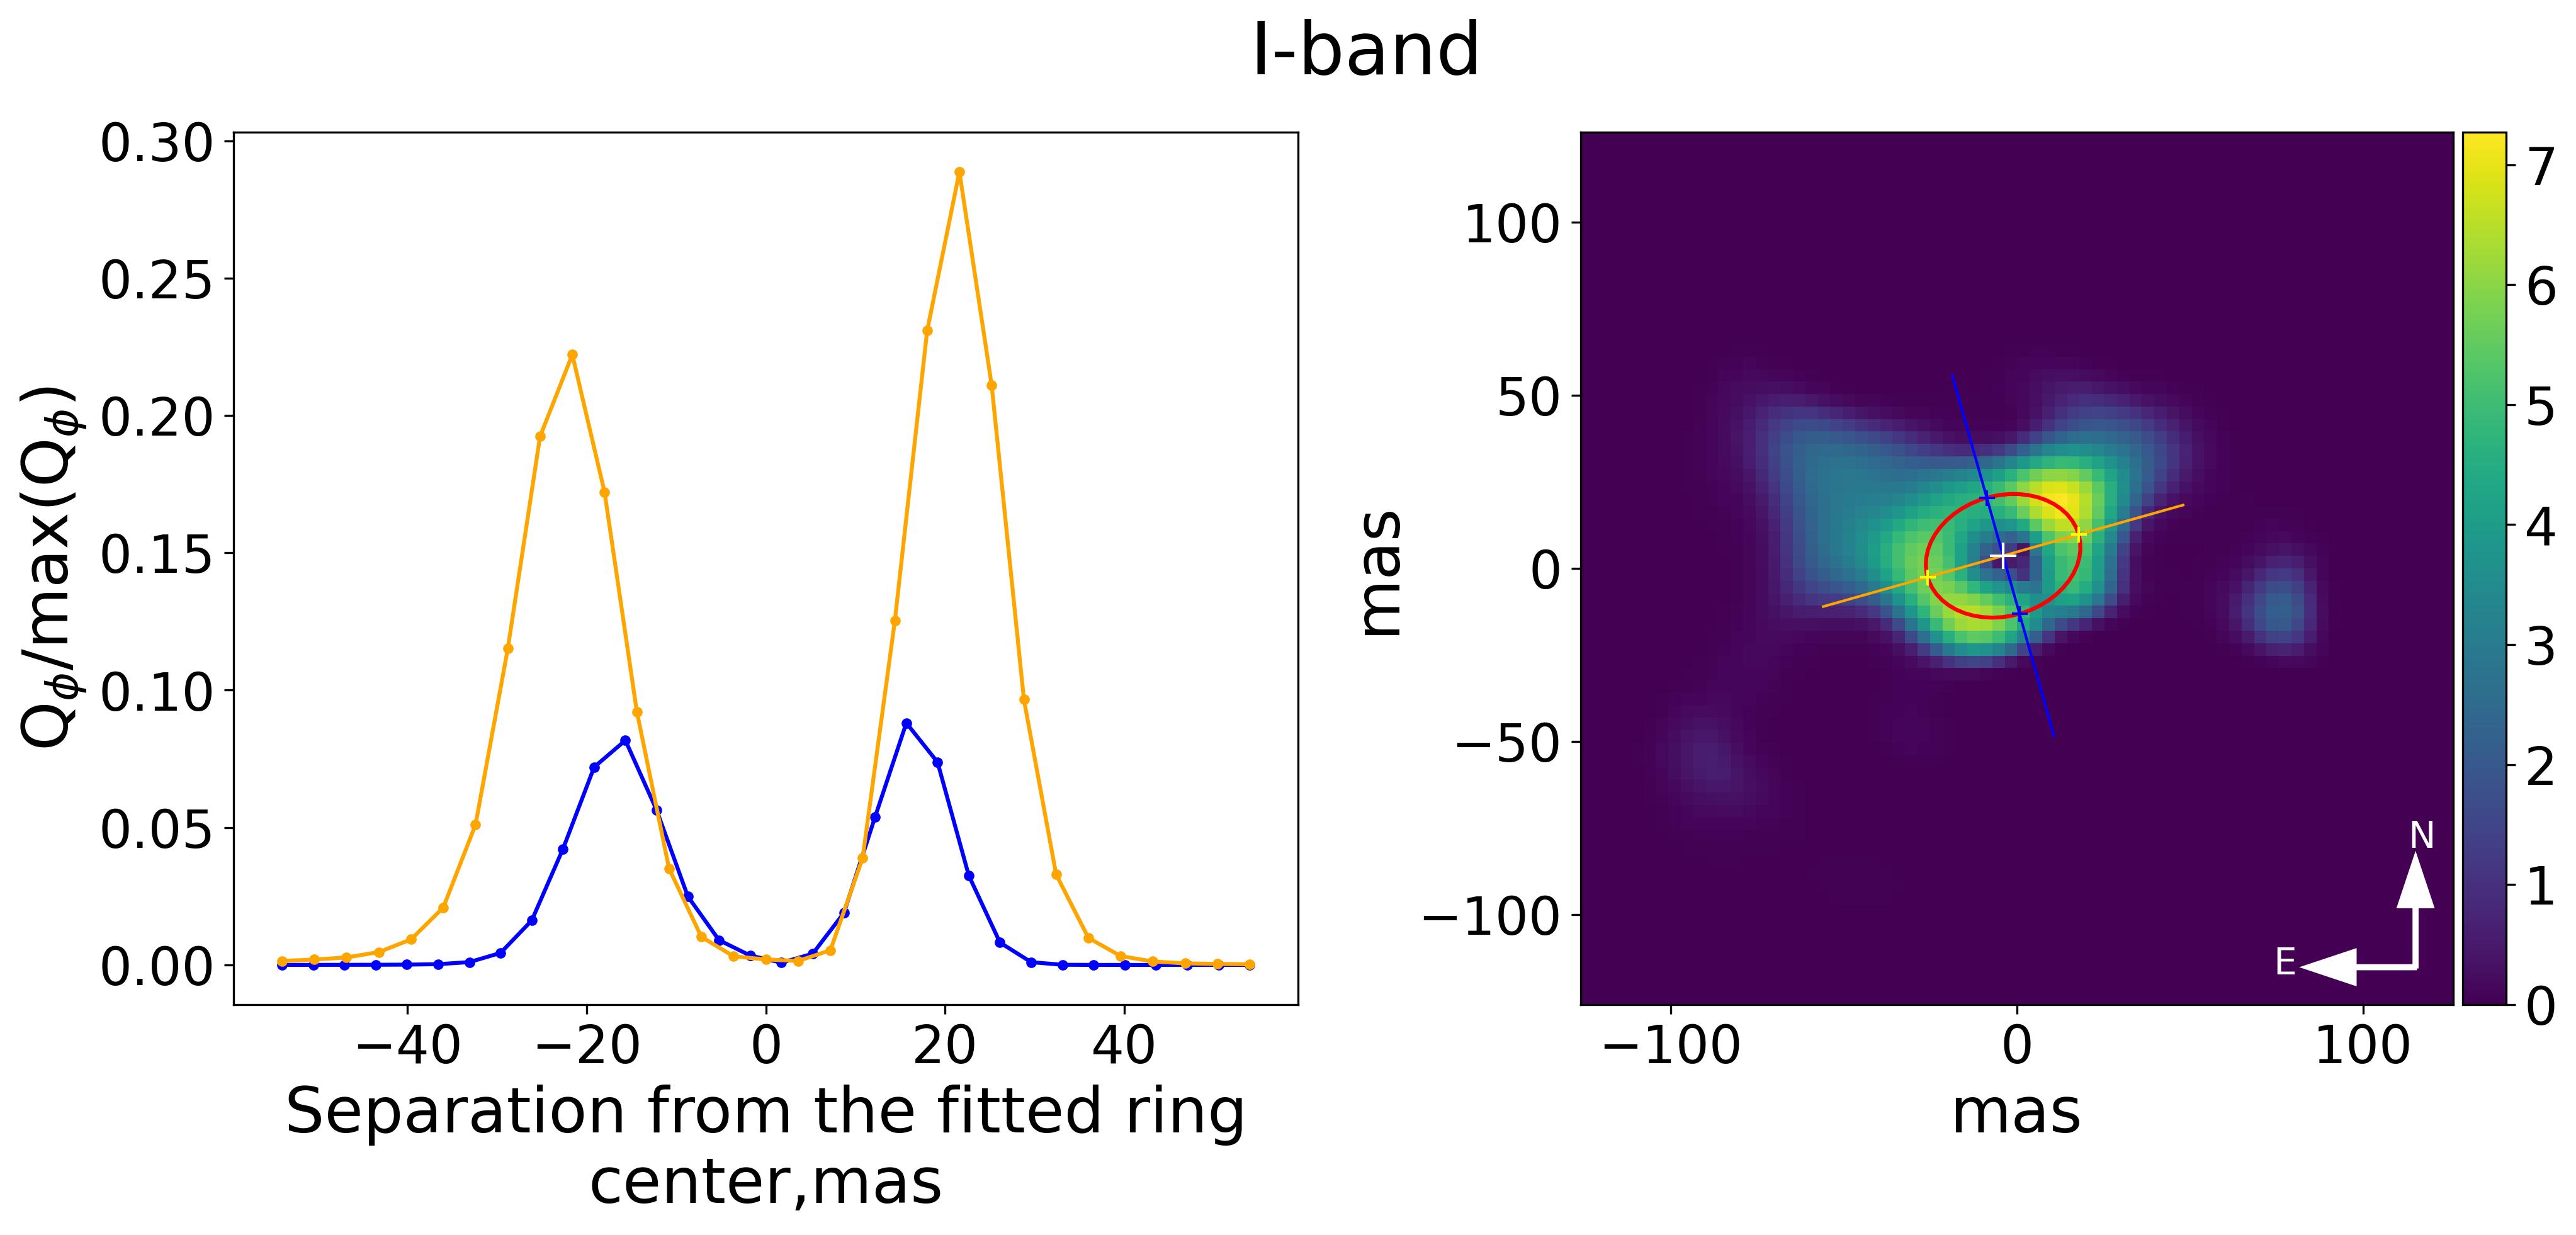
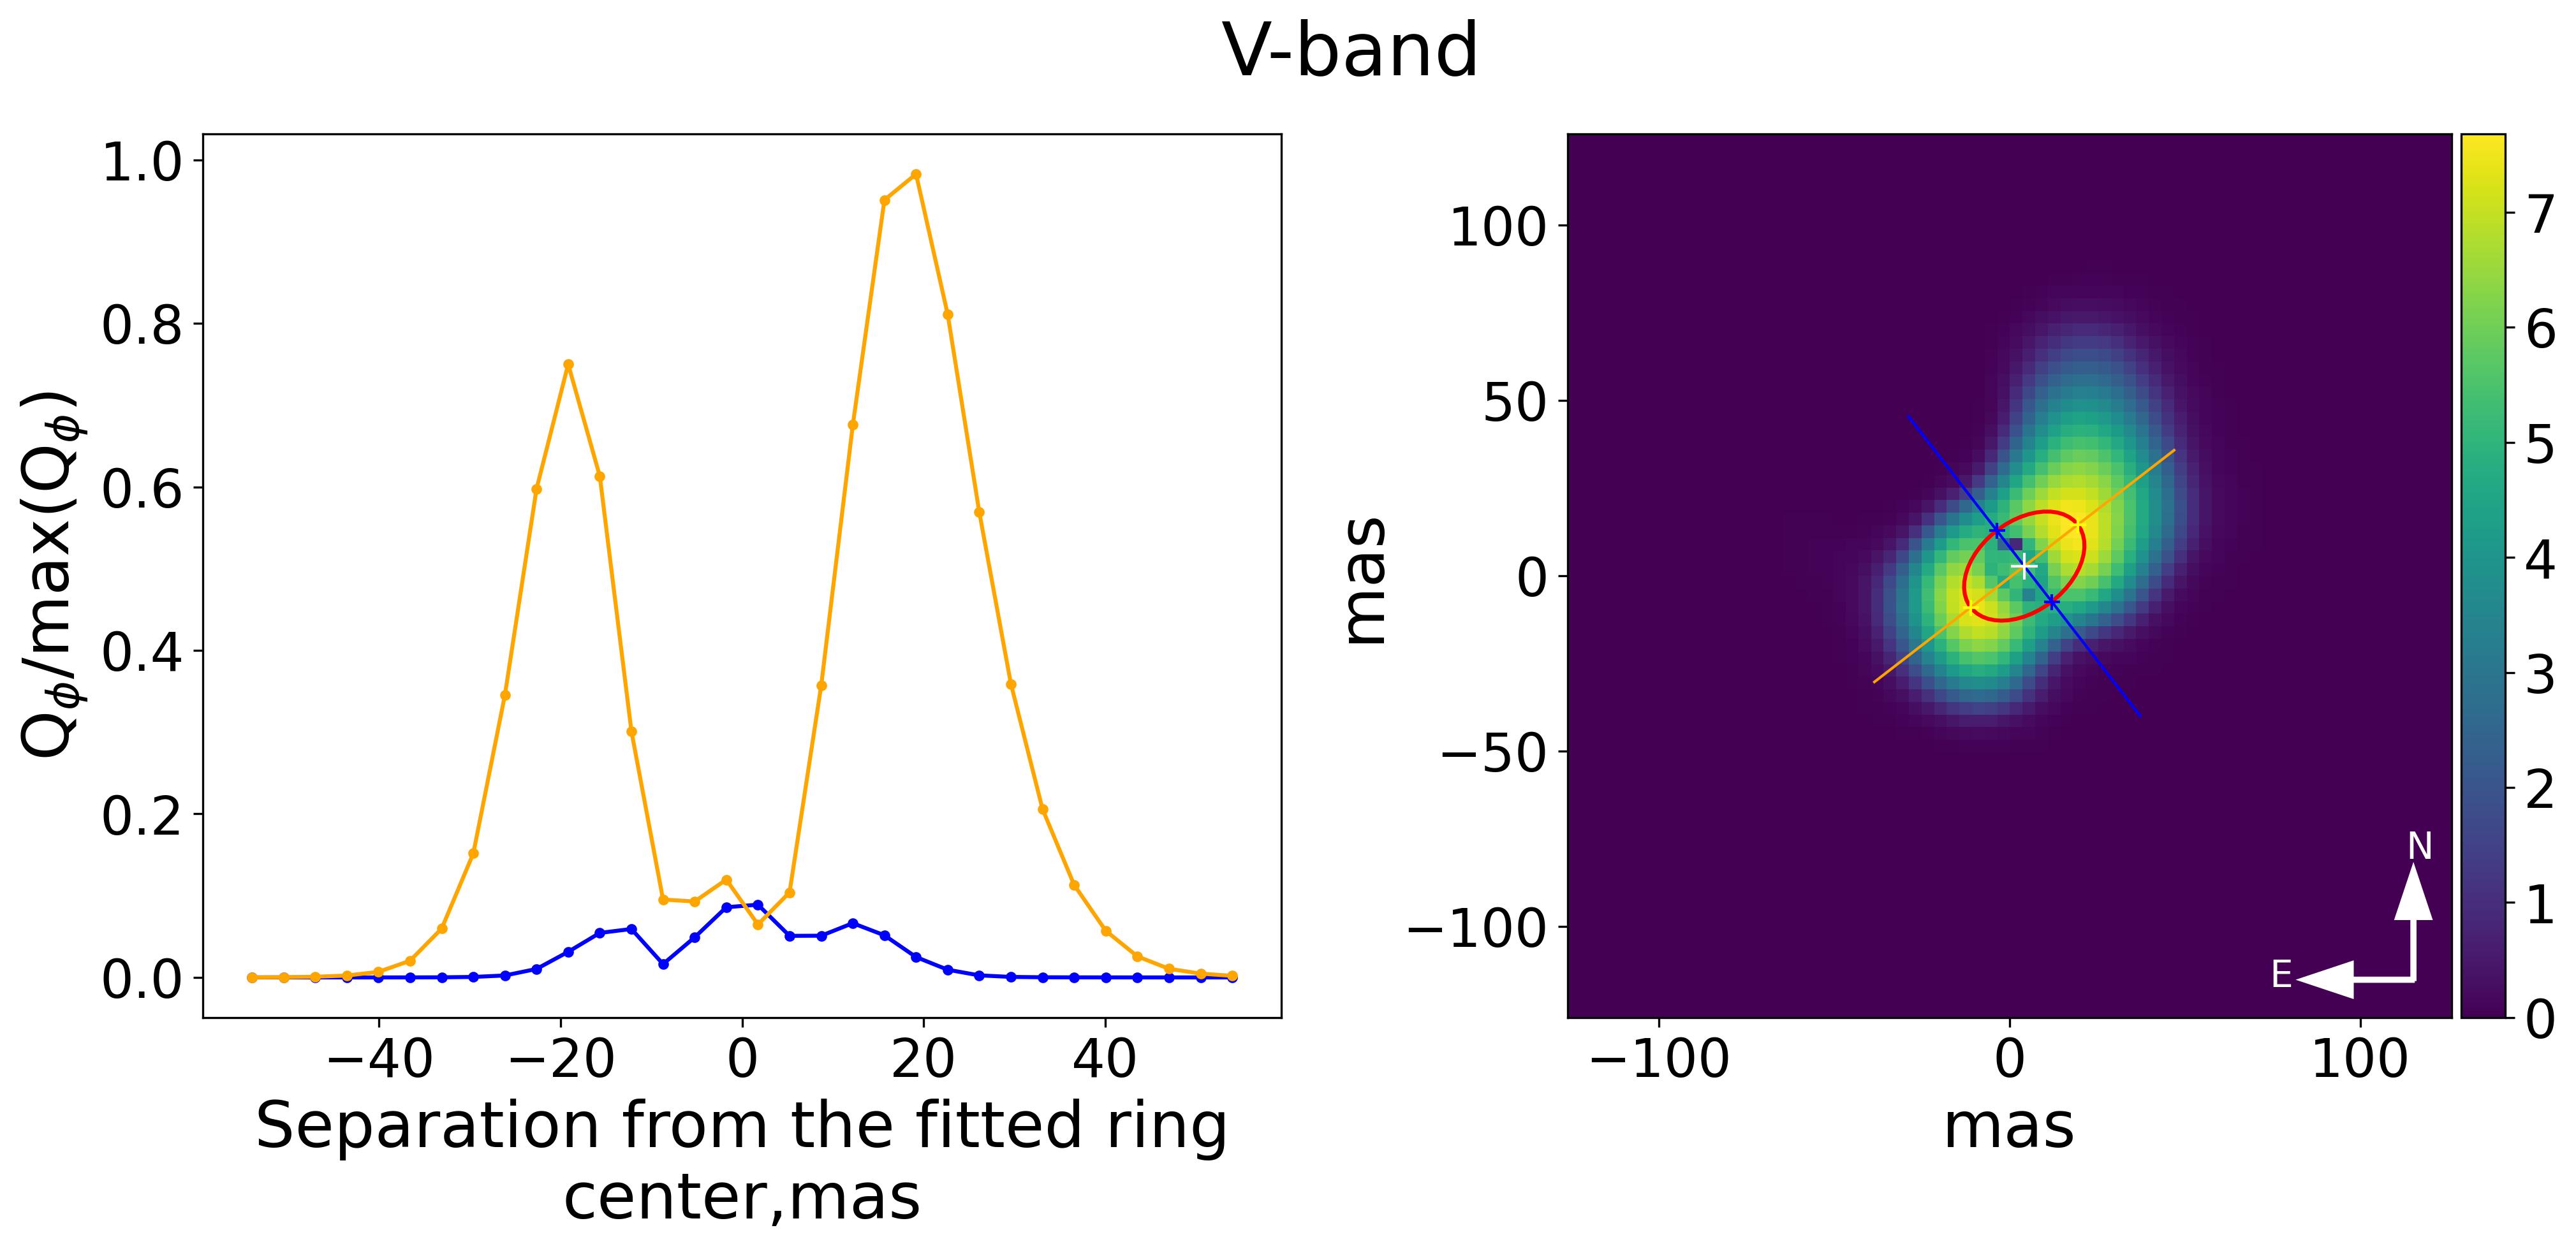
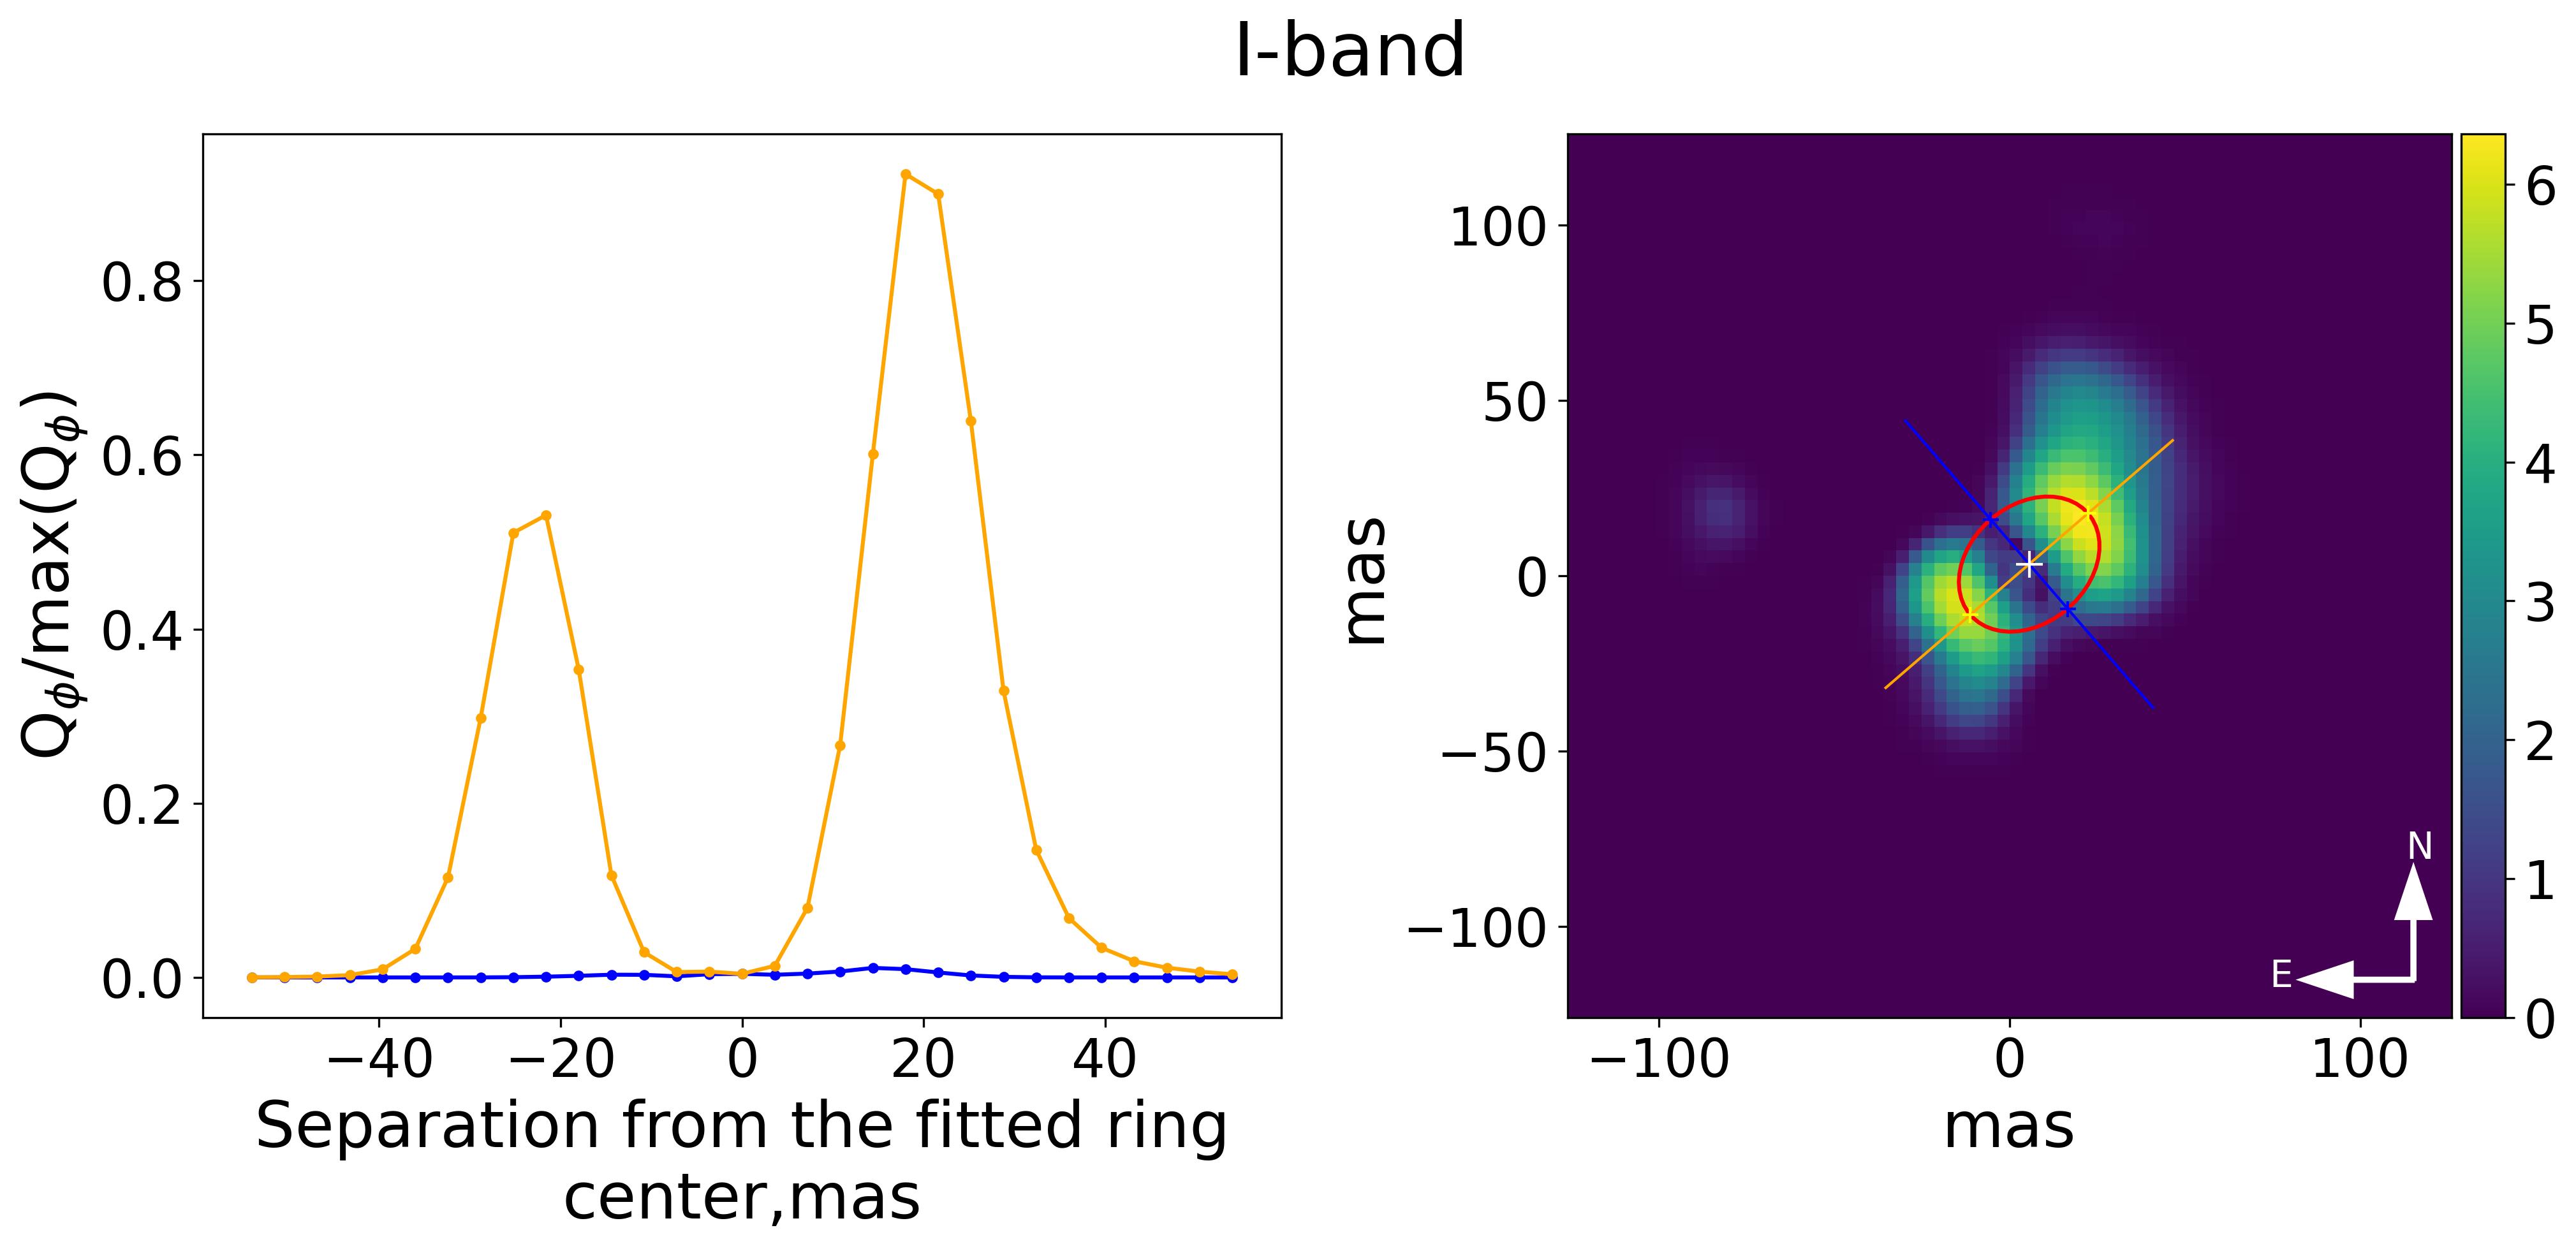
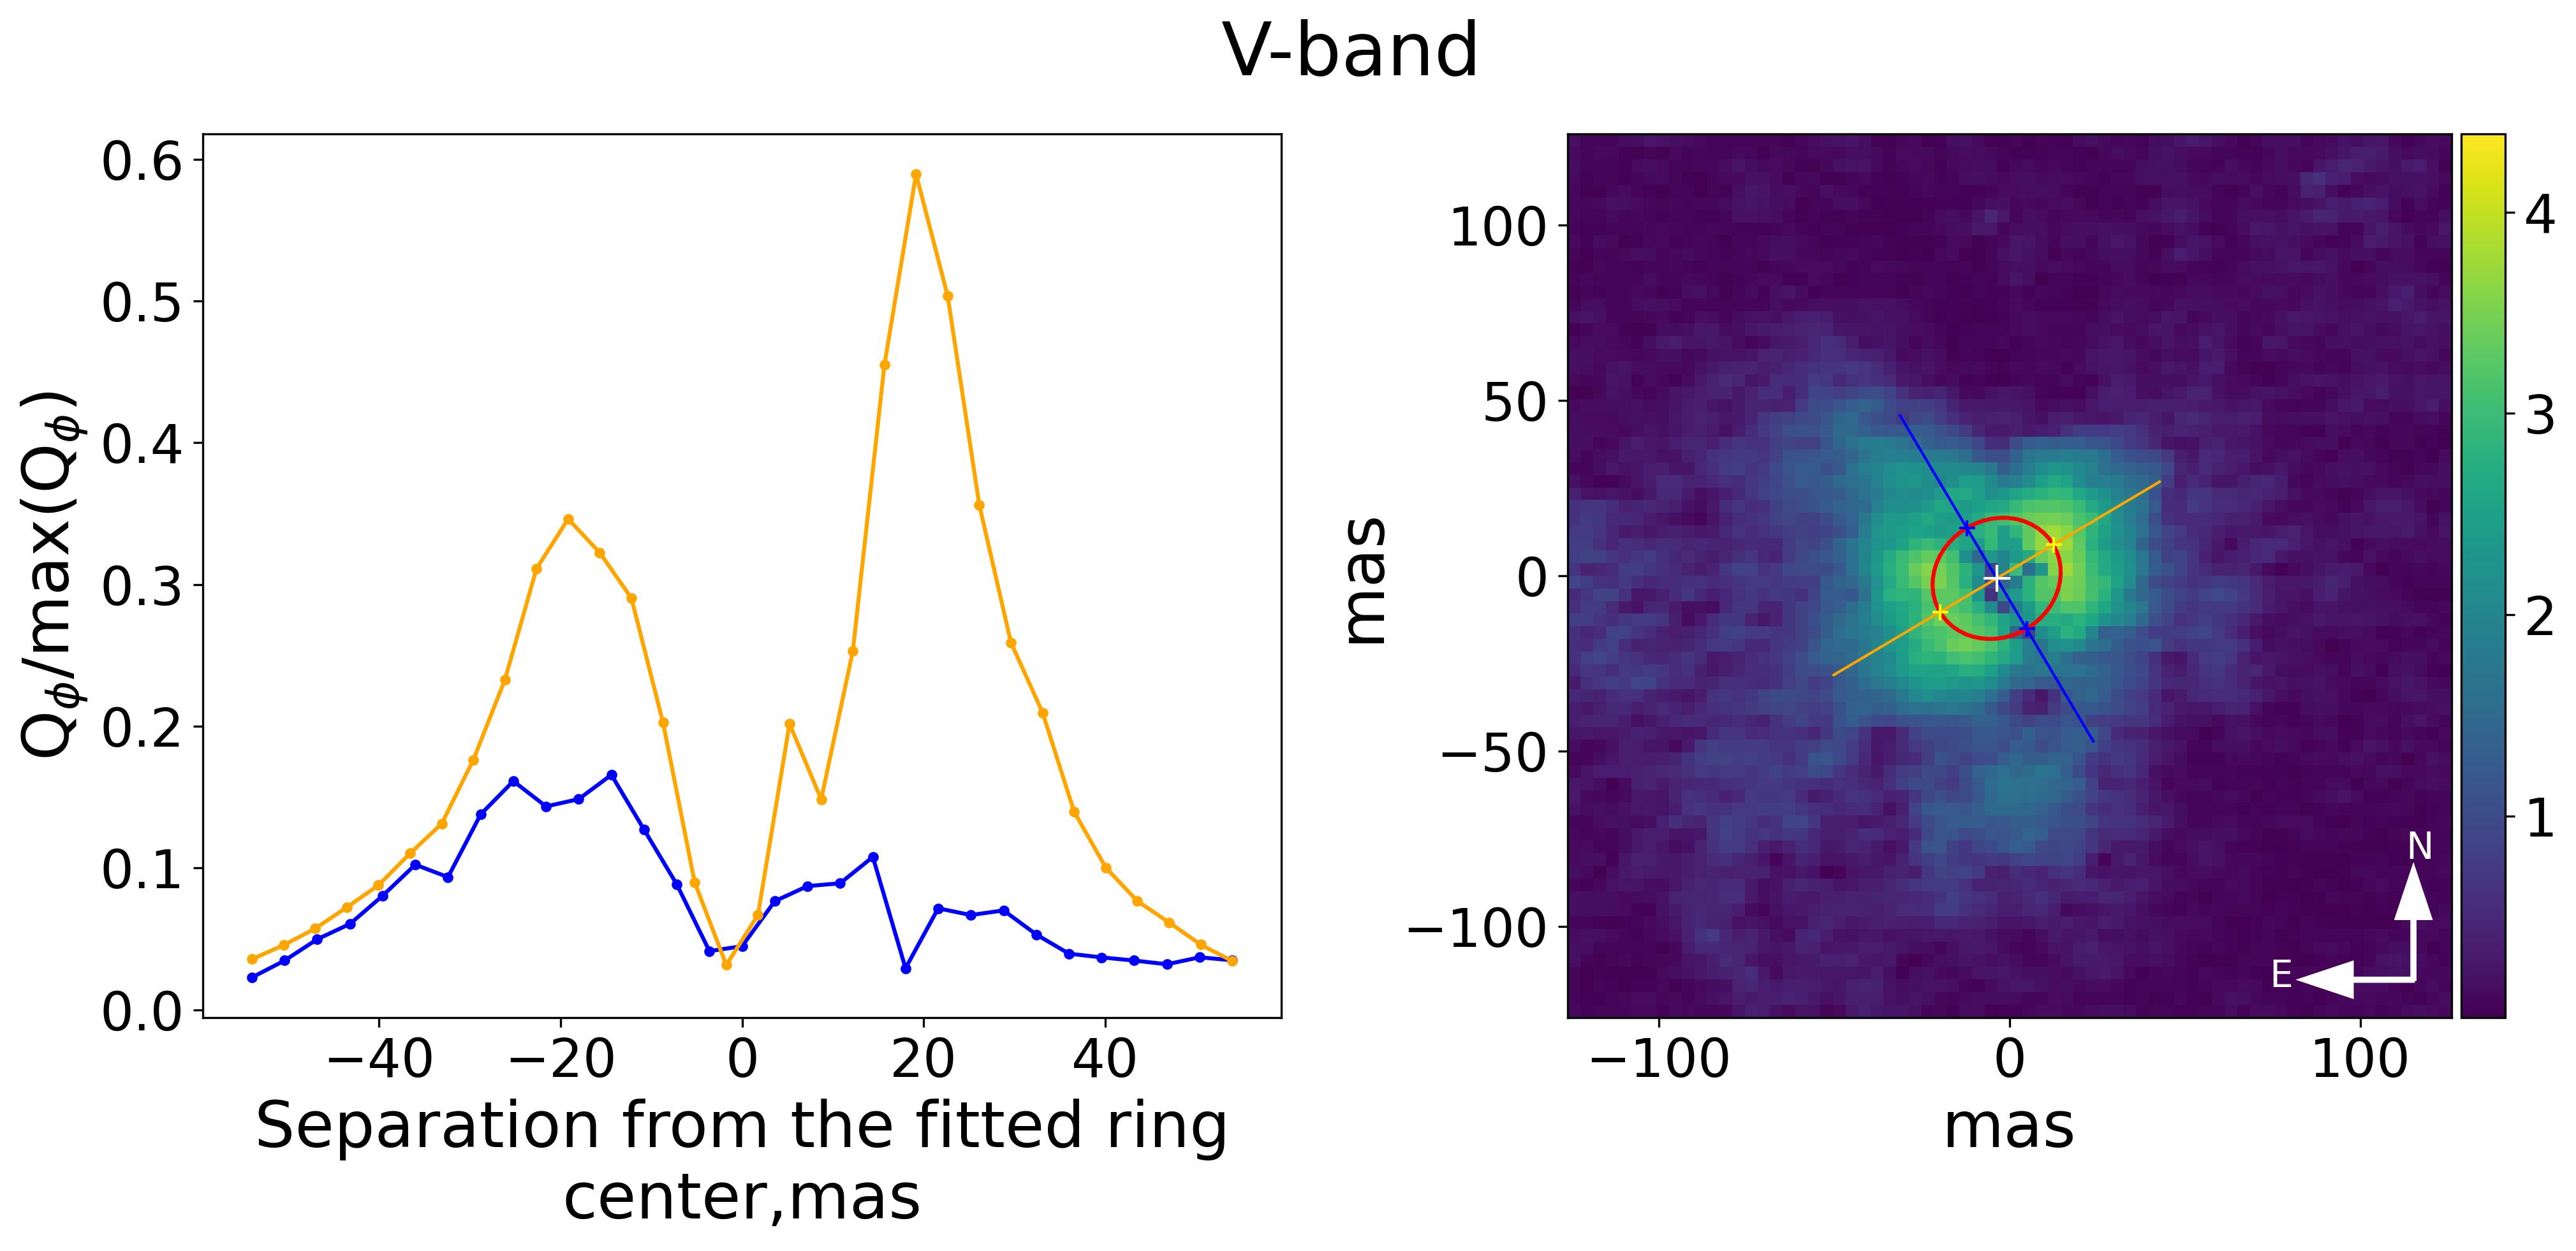
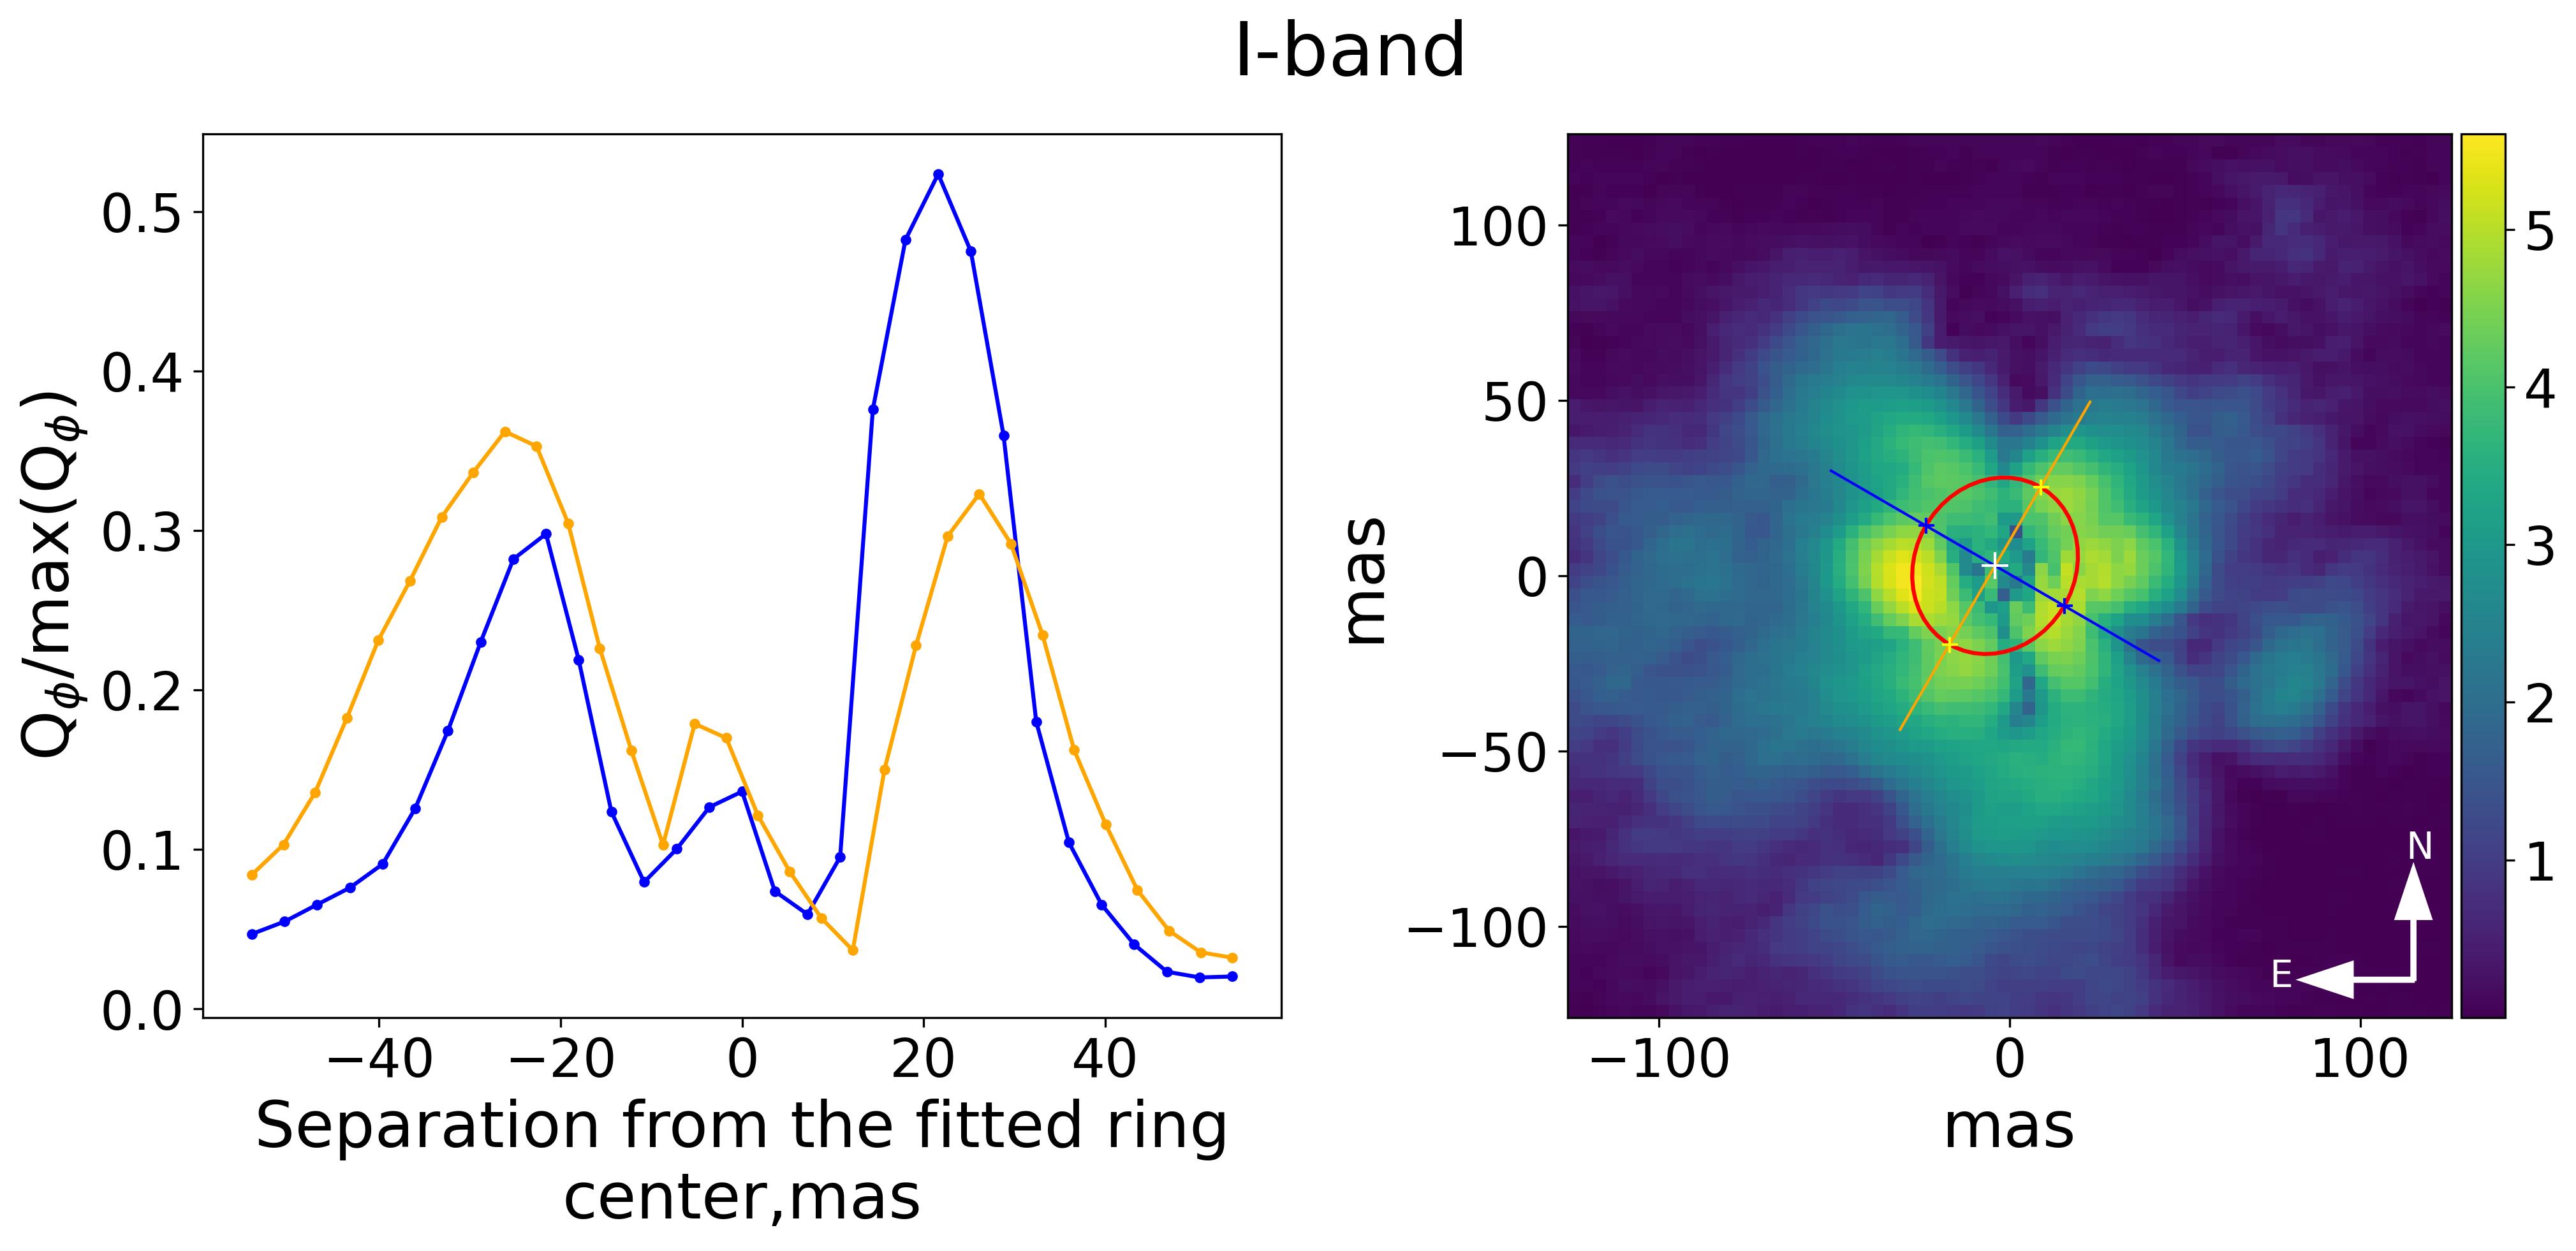
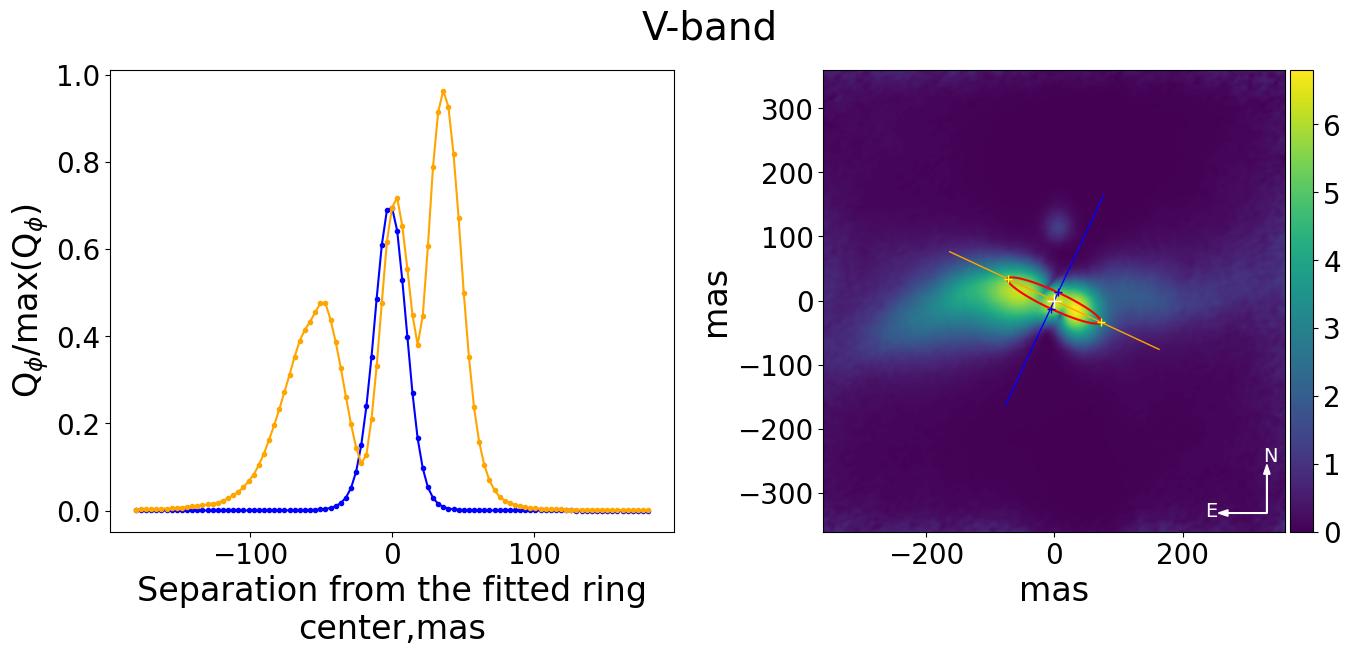
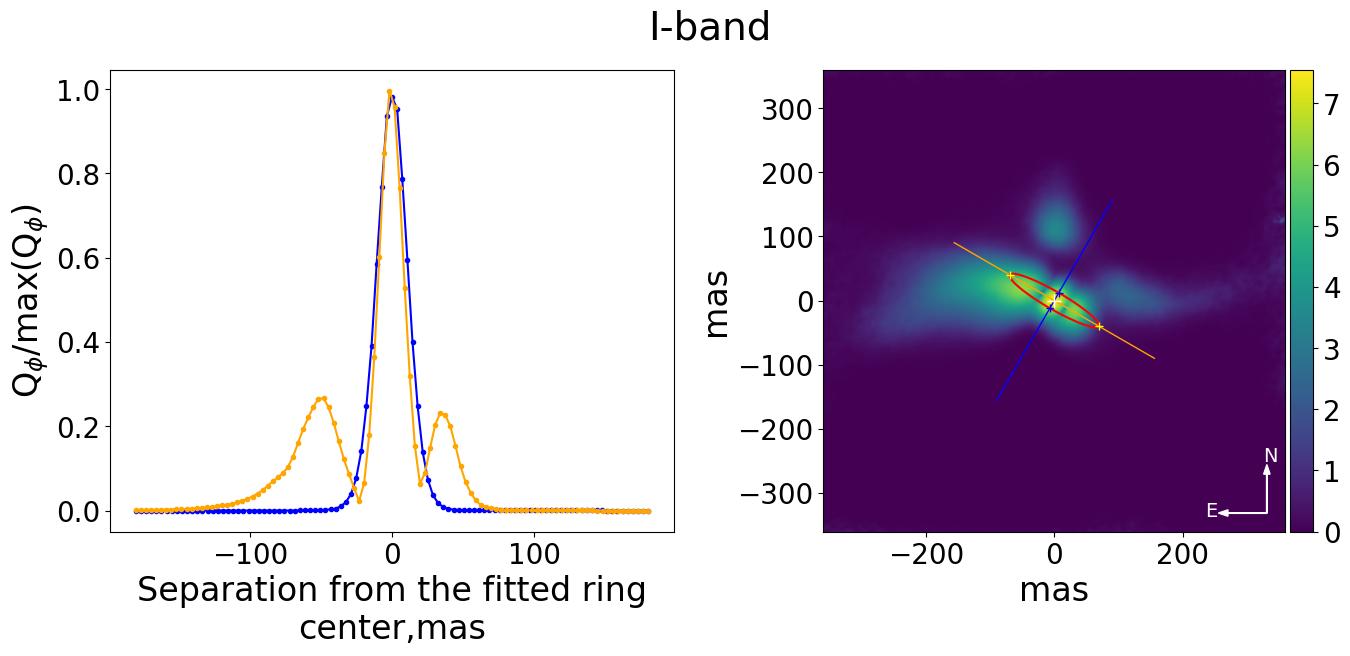
The linear brightness profiles reflect the symmetry of the disc along its major and minor axes. The azimuthal brightness profile reflects asymmetries along the smallest resolved part of the circumbinary disc (‘ring’), starting from the eastern end of the major axis and proceeding counterclockwise. The radial brightness profile describes the variation of disc polarized intensity with distance from the central binary. To account for the impact of disc orientation on the radial intensity distribution, we deproject observed discs to a ’face-on’ view based on the estimated inclination of the resolved disc surface for both the and bands (see Section 4.3 for details on the inclination and Andrych2023MNRAS.524.4168A for more information on the methodology). However, we note that we do not perform the deprojection for AR Pup (due to the nearly edge-on orientation of the disc) and V709 Car (due not fully resolved ‘ring’, see Section 4.3).
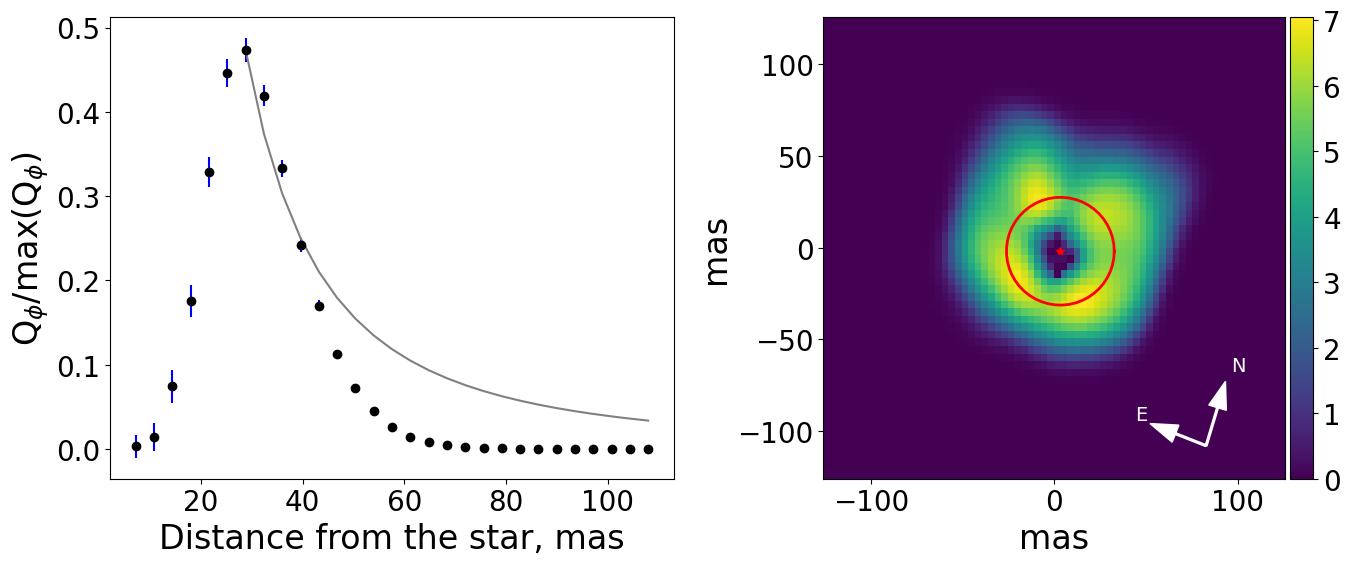
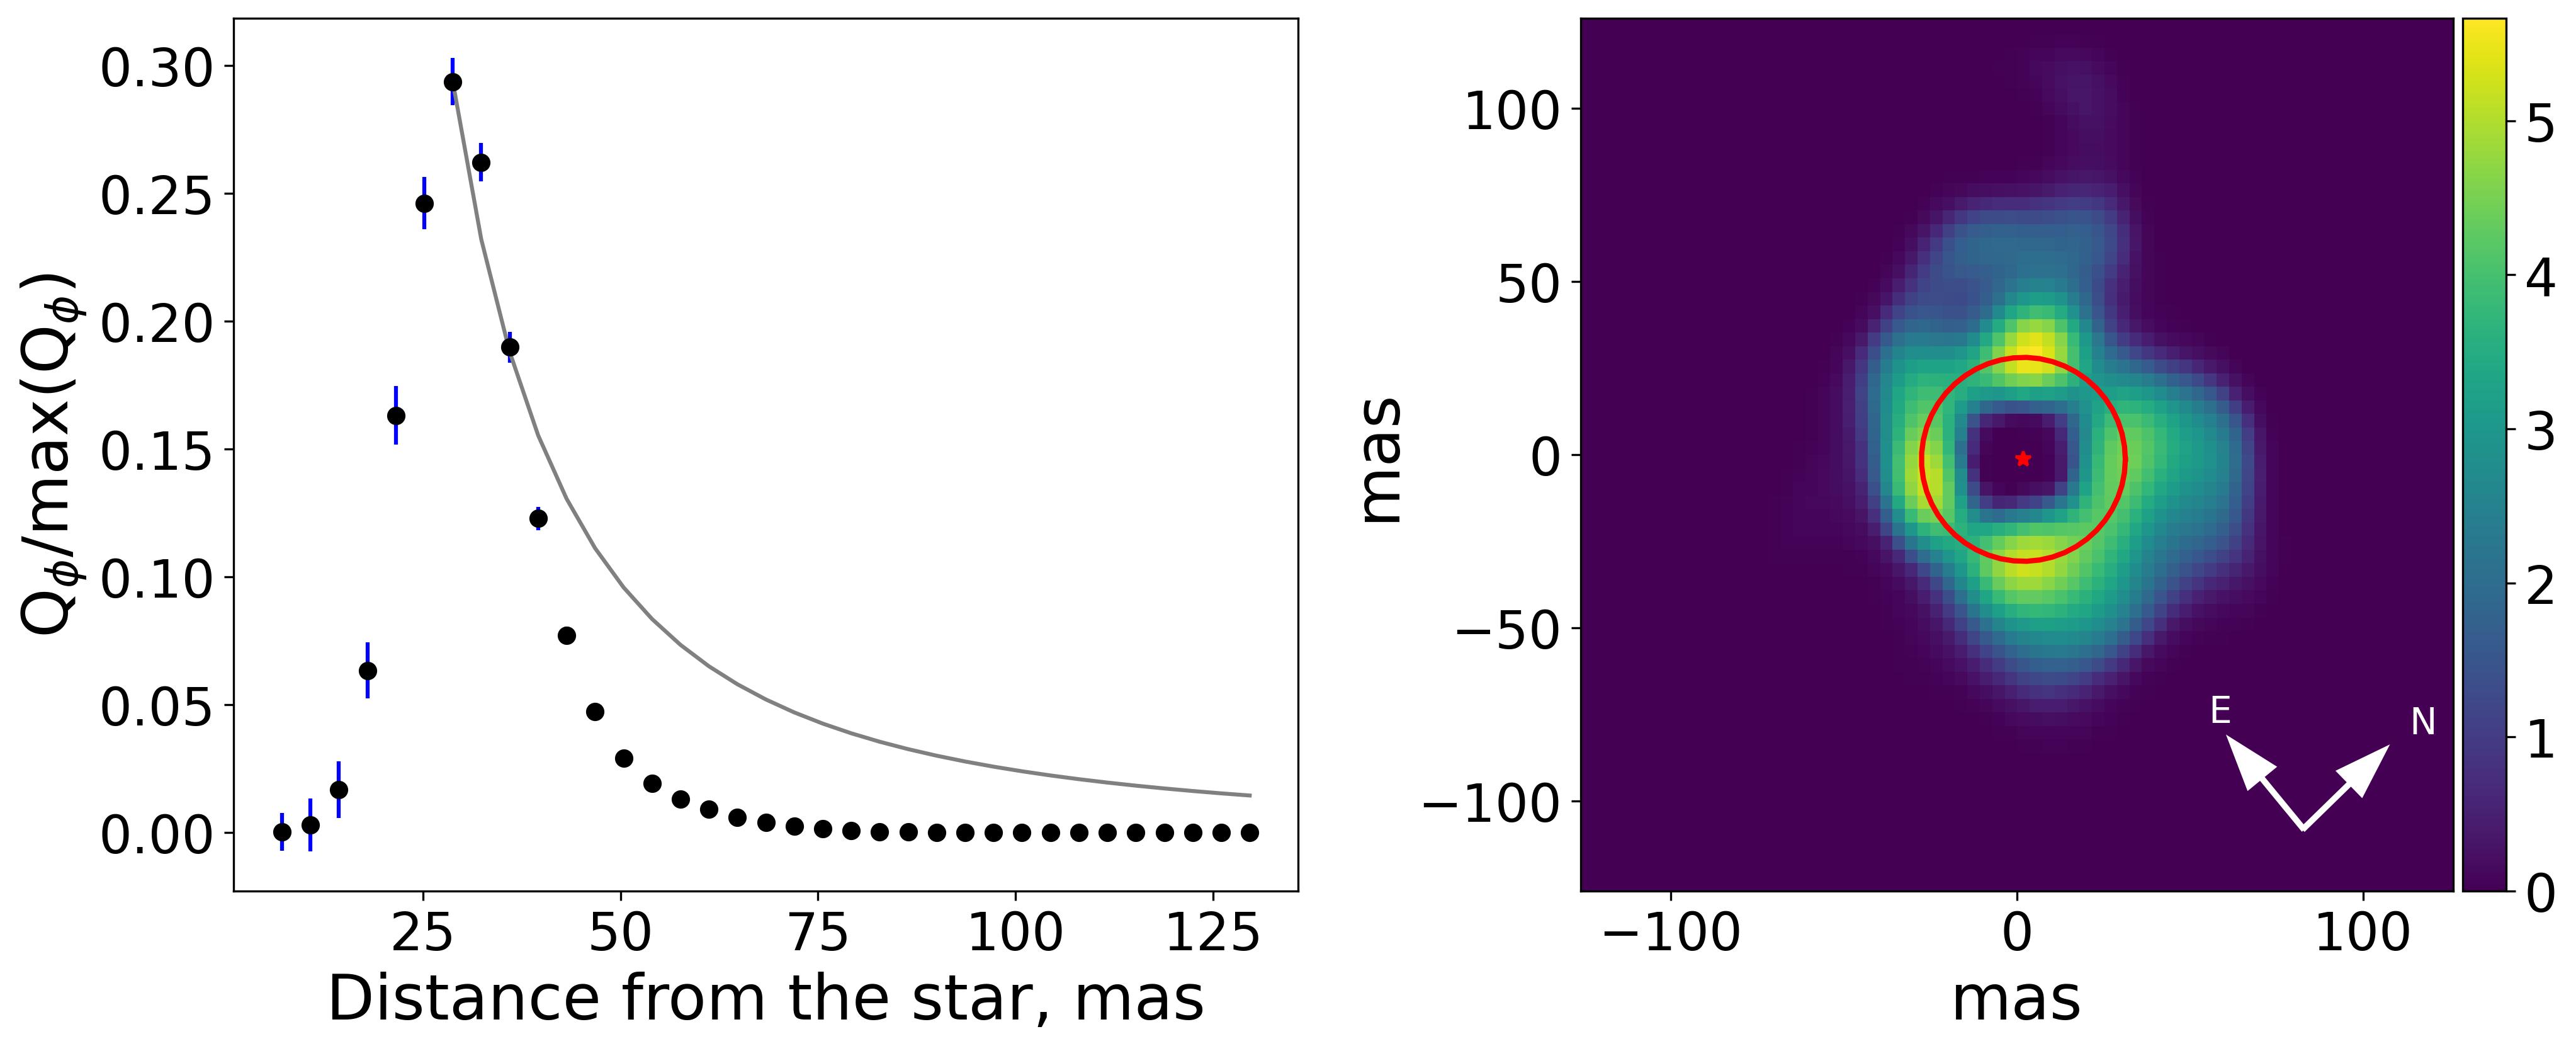
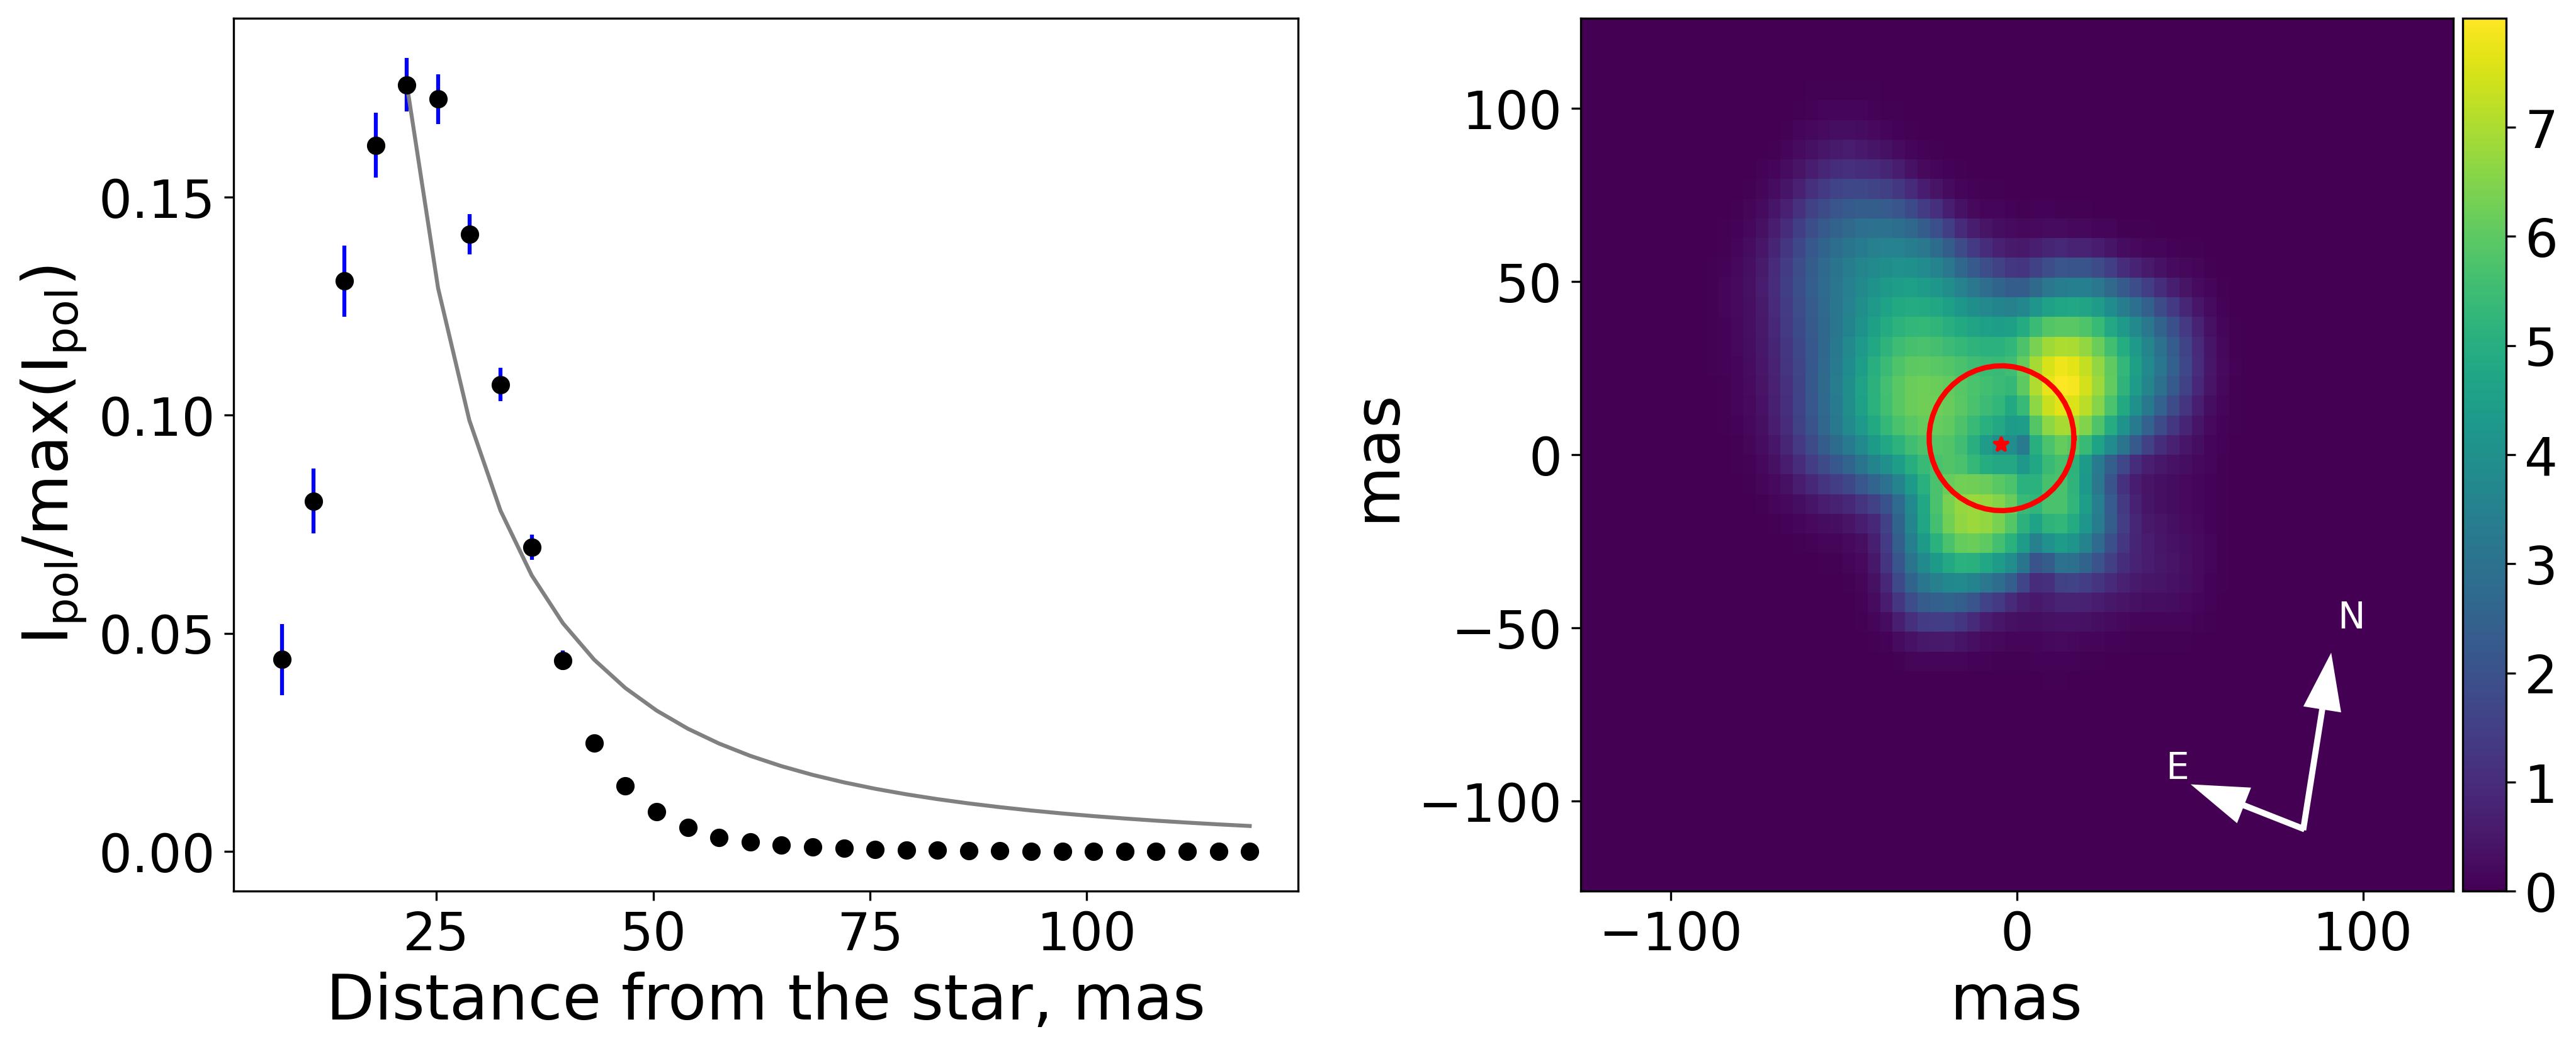
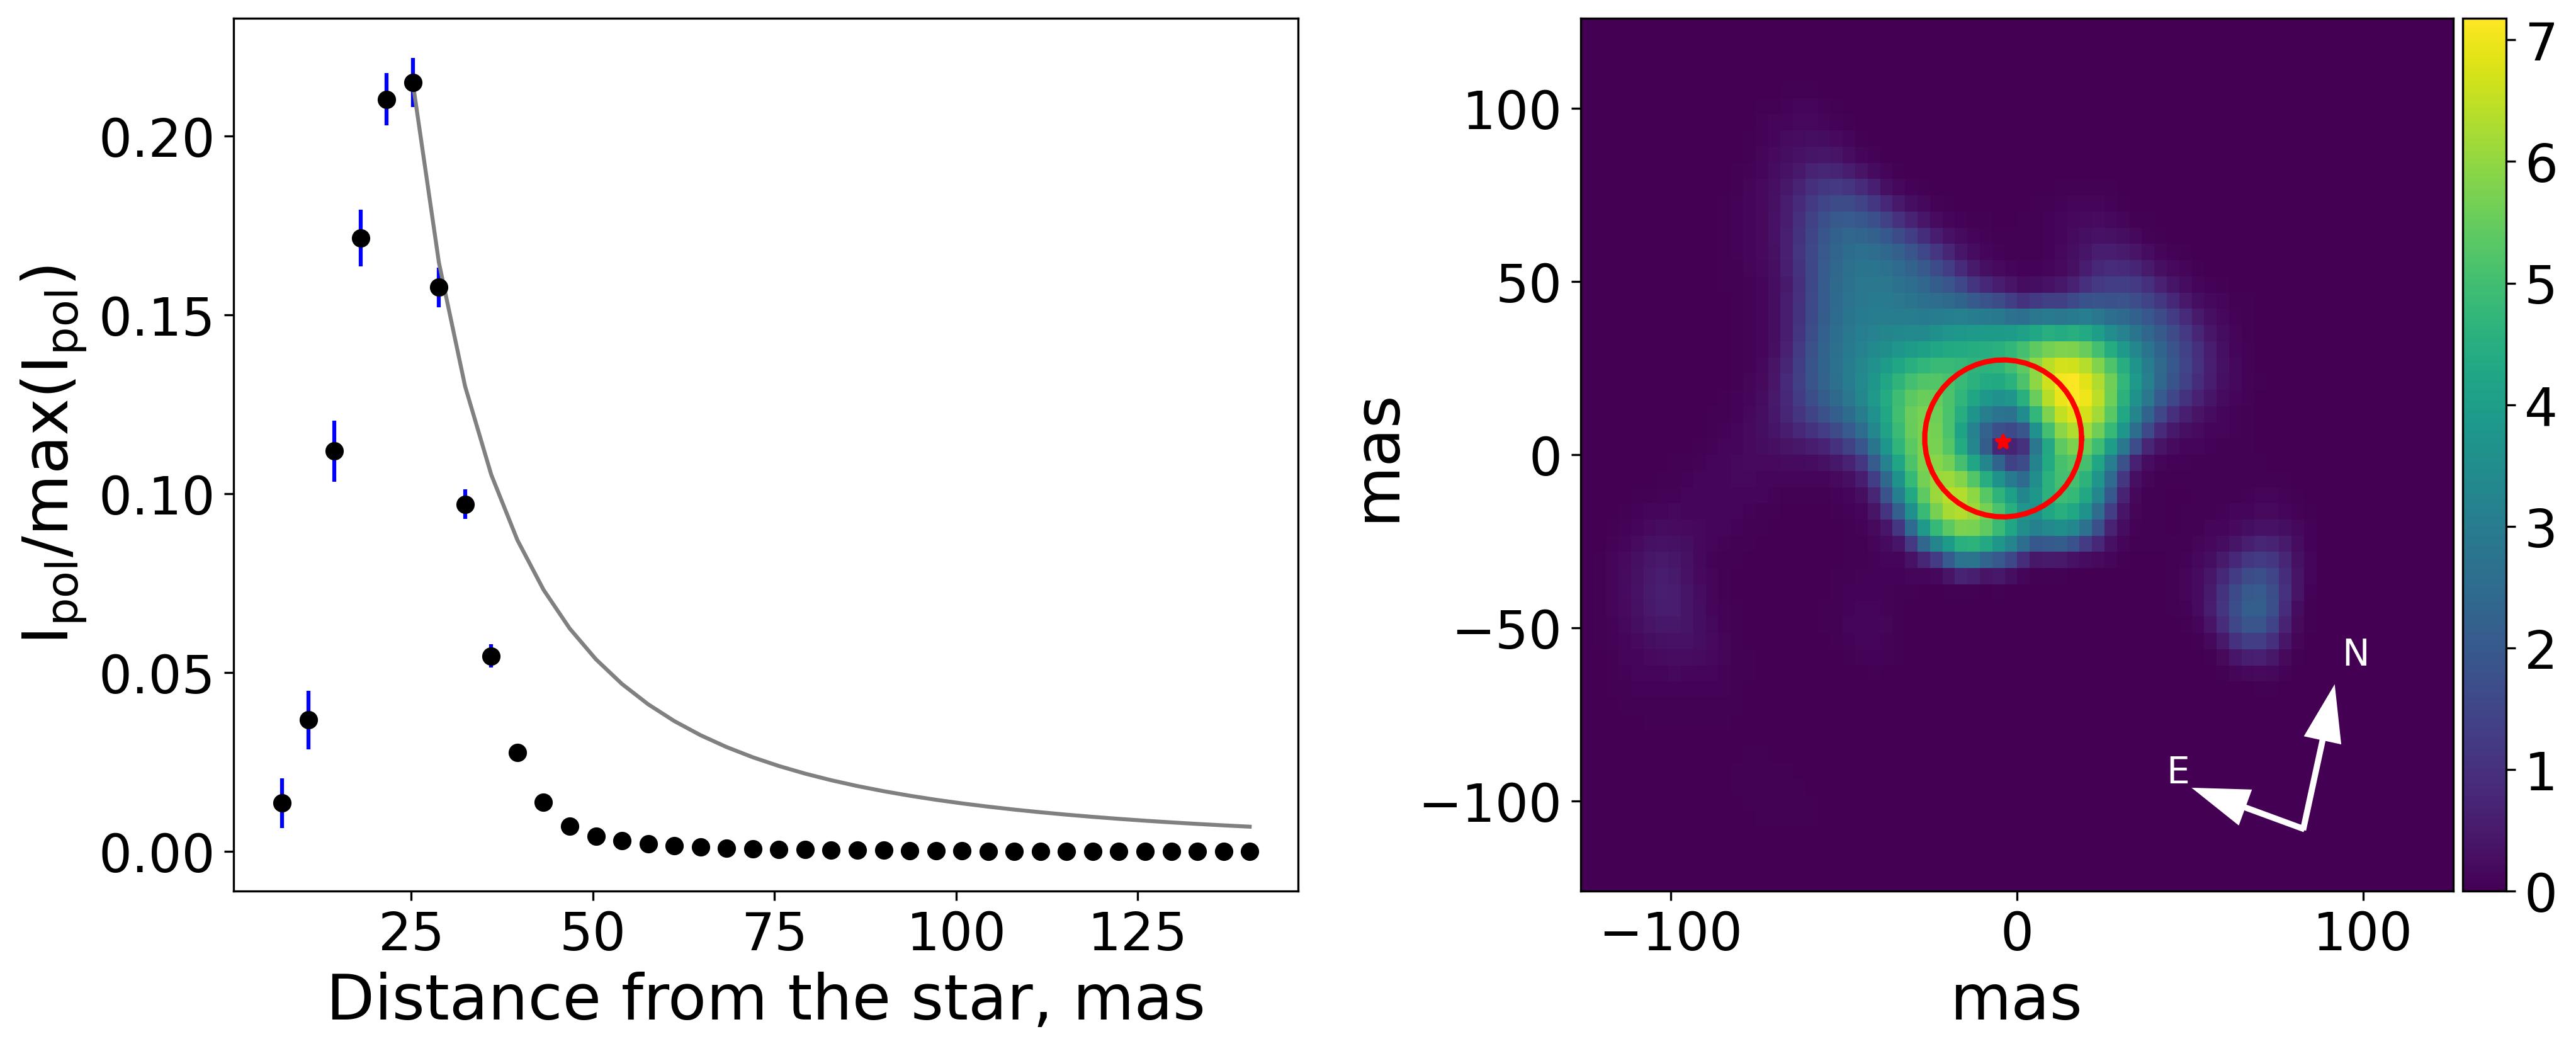
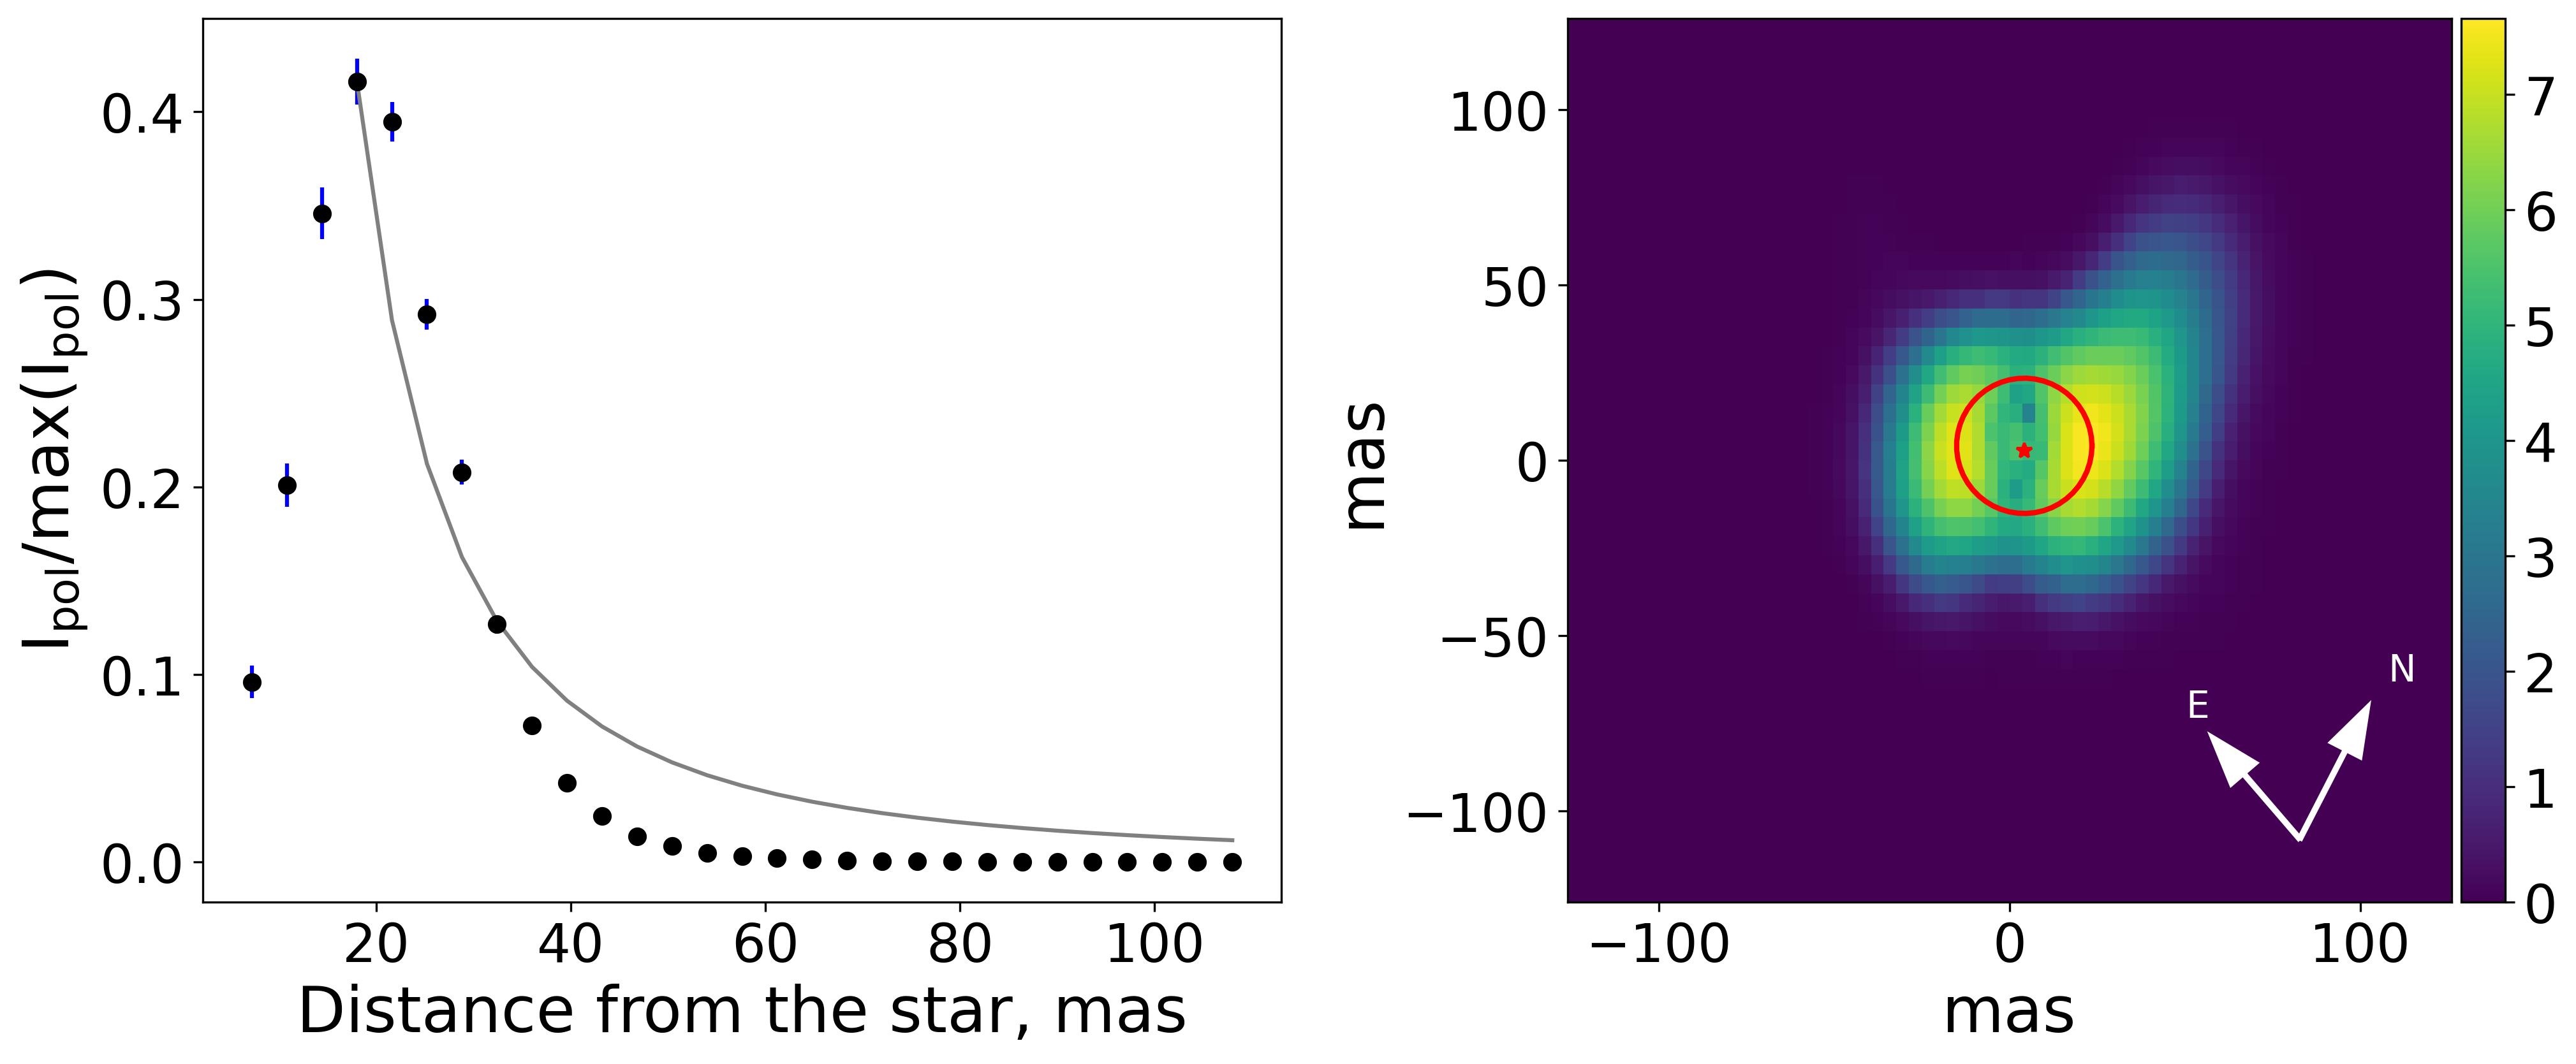
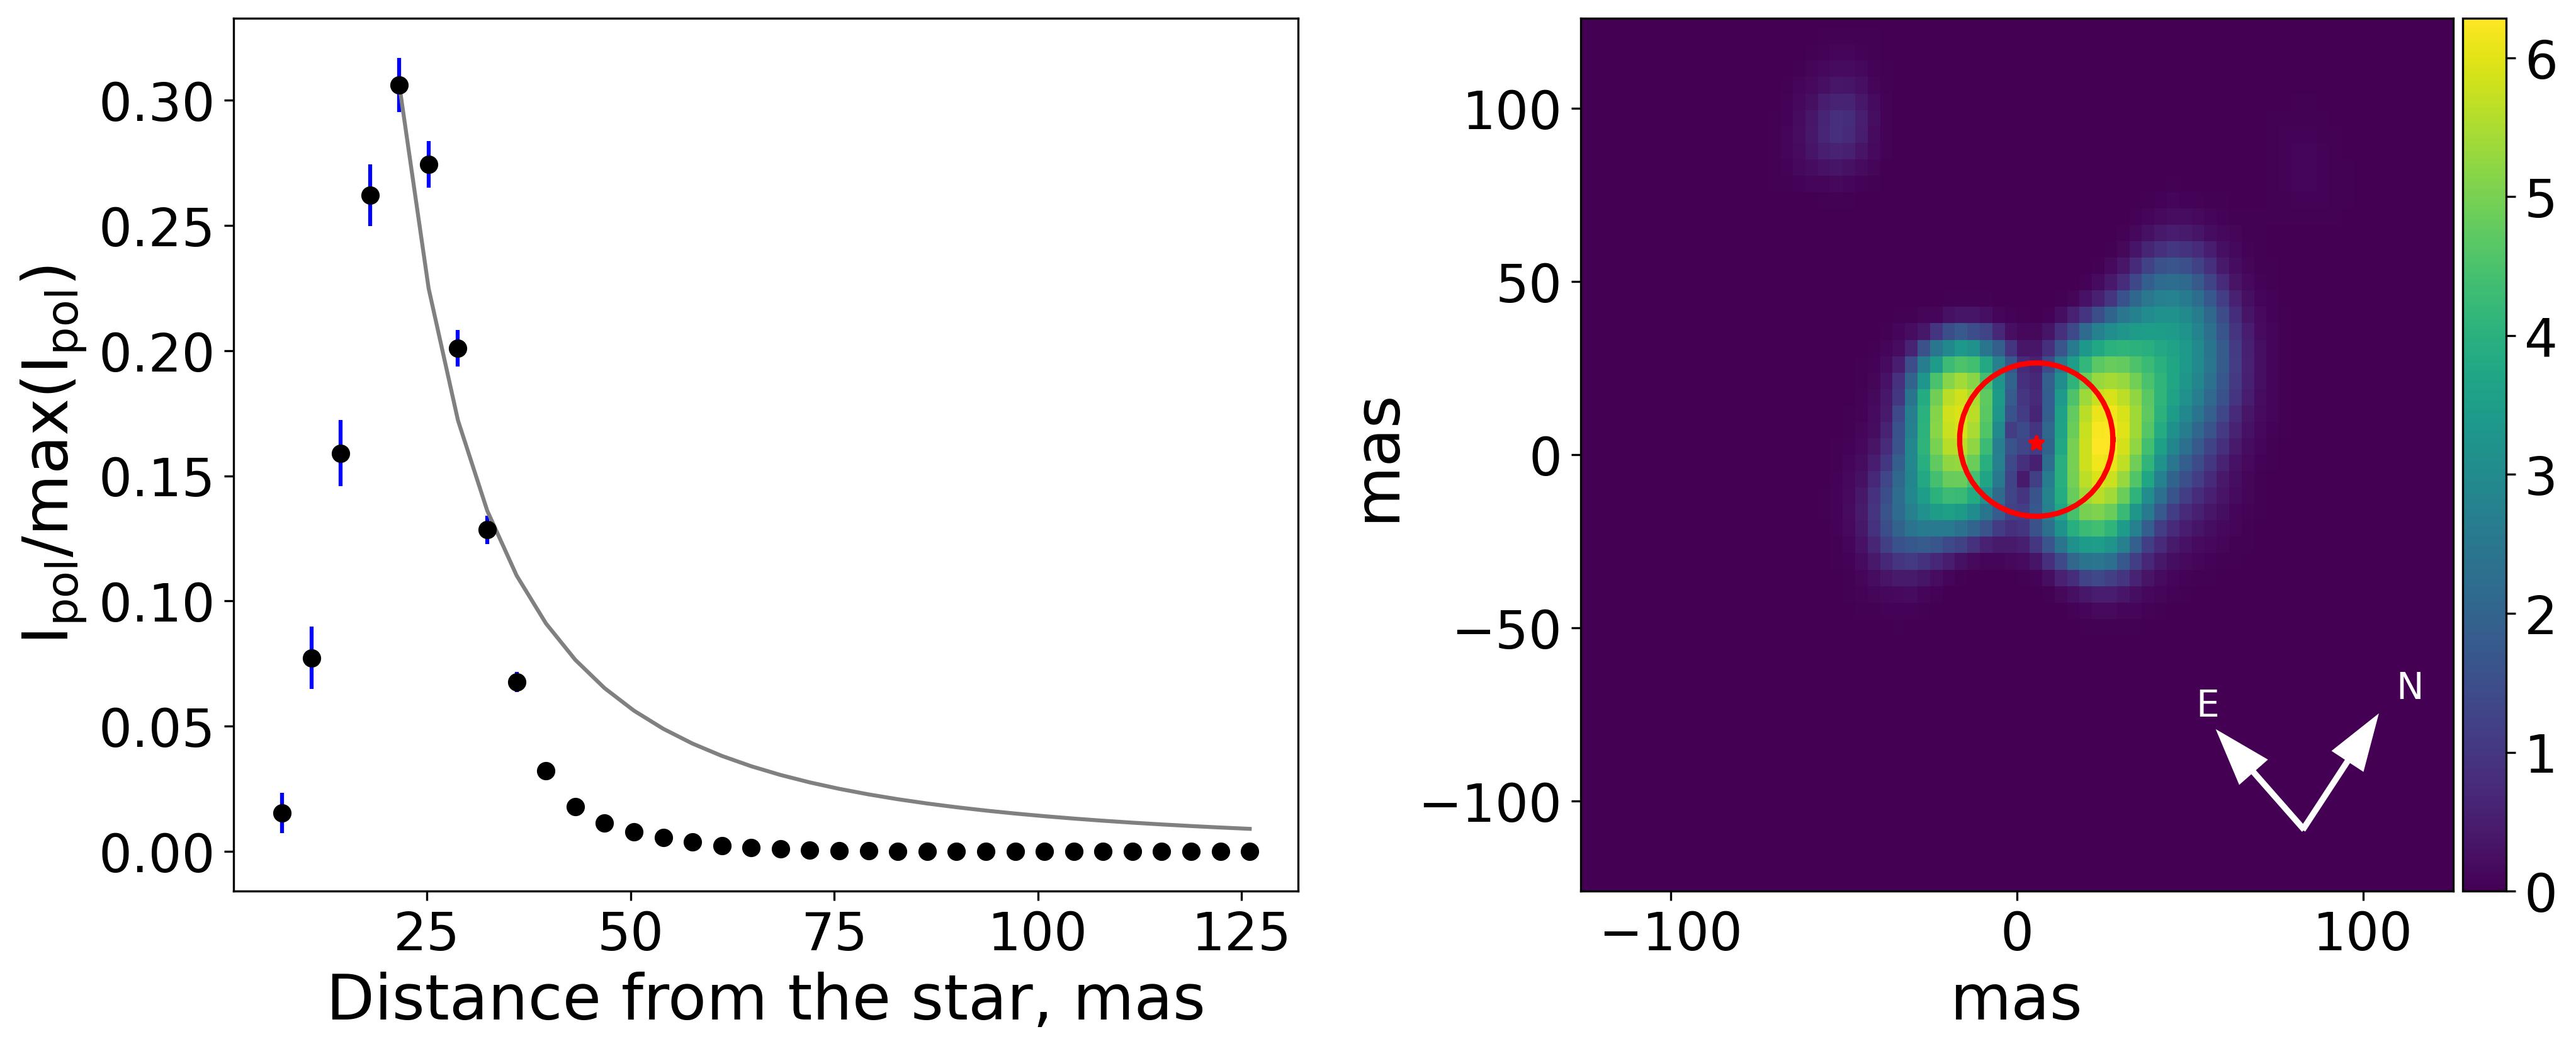
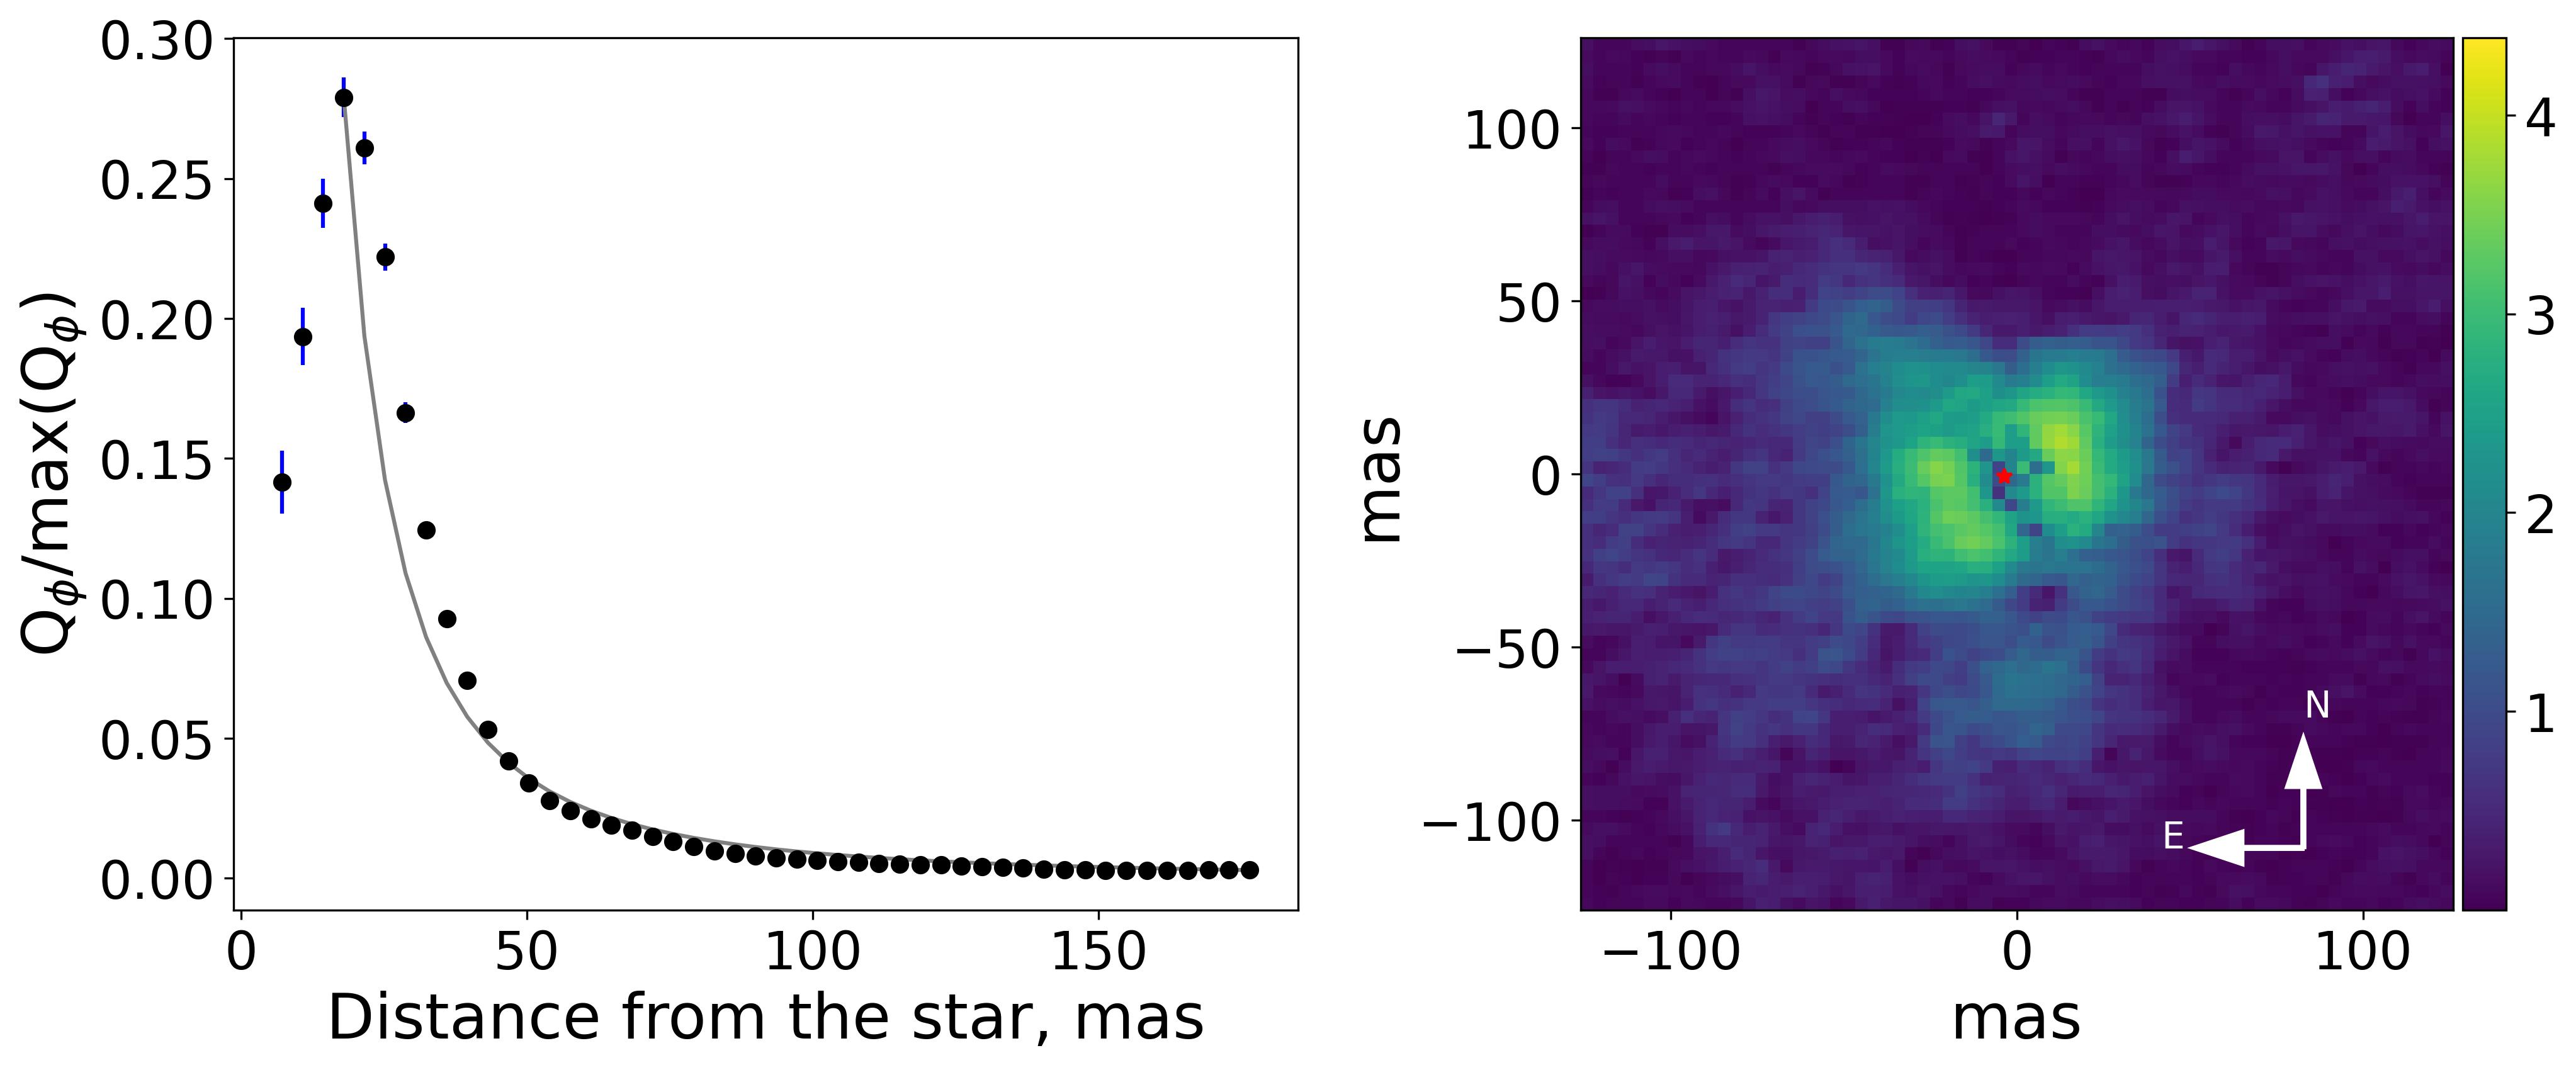
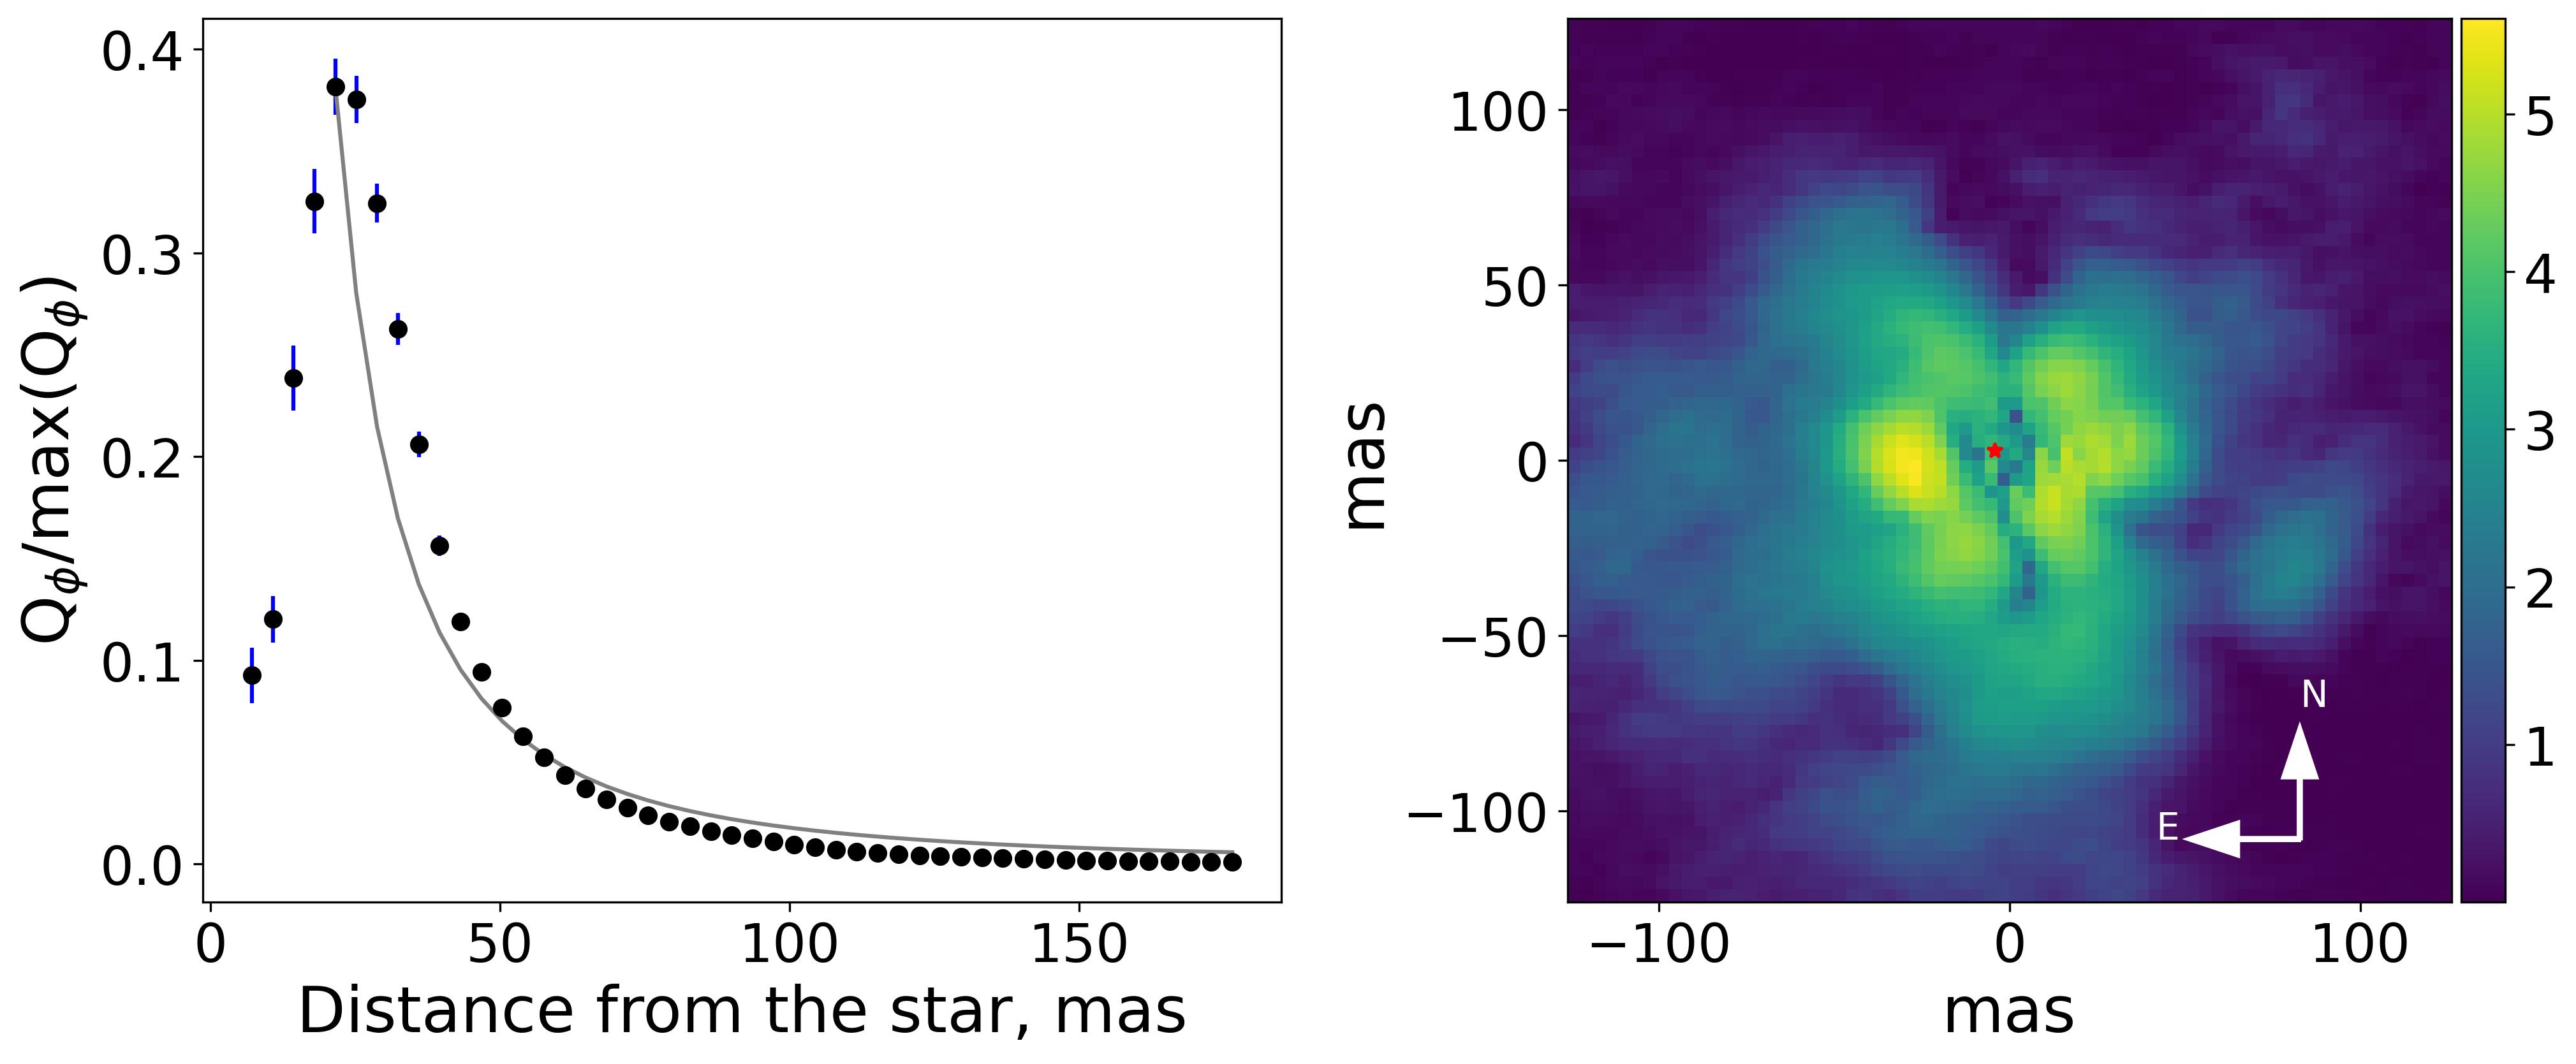
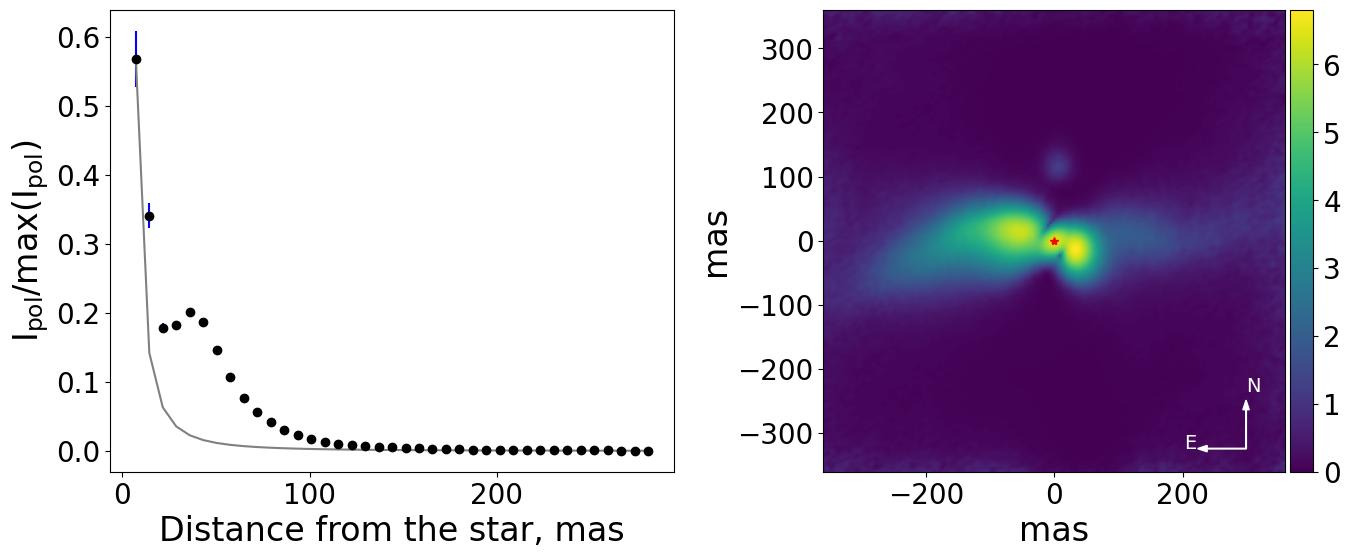
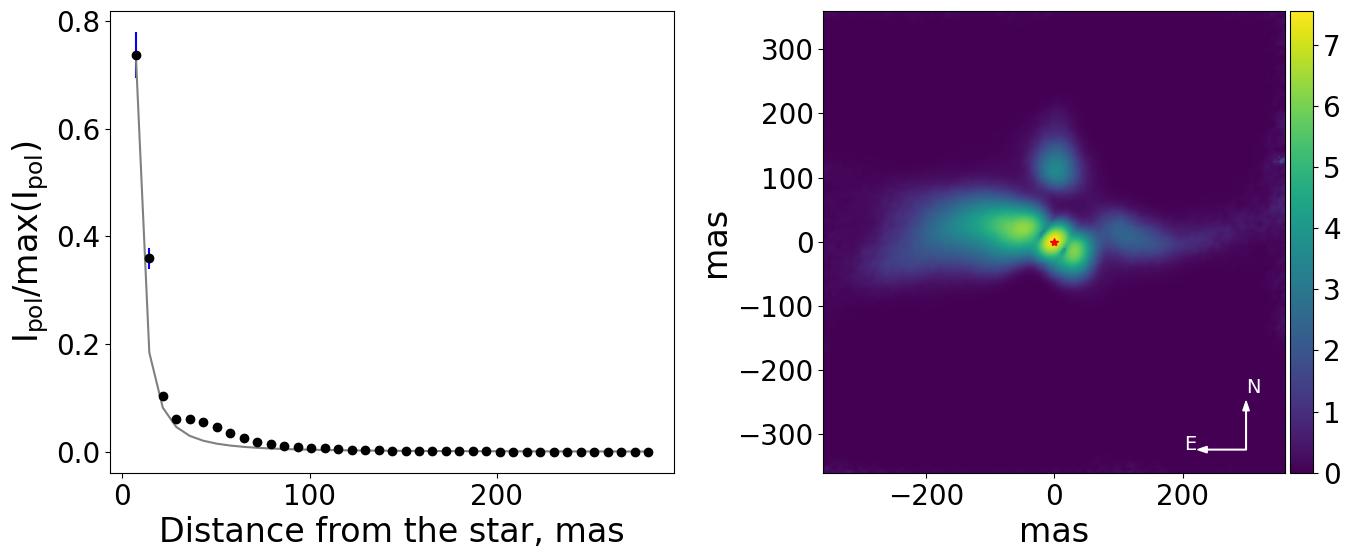
We also compared the radial brightness profiles to the expected illumination drop-off, typical of scattered light emission, to determine whether the extent of the observed emission is influenced by disc morphology or limited by observational sensitivity (see bottom row of Fig. 17, 18, 19, 20, 21 in D). For HR 4049, HR 4226, and U Mon, we found that beyond , the radial brightness profiles drop off more steeply than the trend in both the and bands, suggesting a significant reduction in surface dust density or a shadowing effect beyond this region at the observed wavelengths (Perez2018ApJ...869L..50P, e.g.,). In contrast, V709 Car profile follows the illumination, indicating sensitivity limitations in fully resolving the disc’s surface. For AR Pup, the orientation of the system significantly impacts the radial brightness profile, accounting for the deviation from the trend.
4.4.2 Detection of substructures
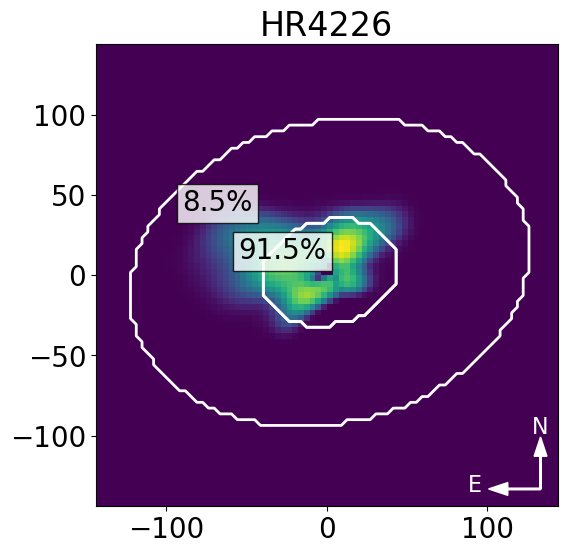
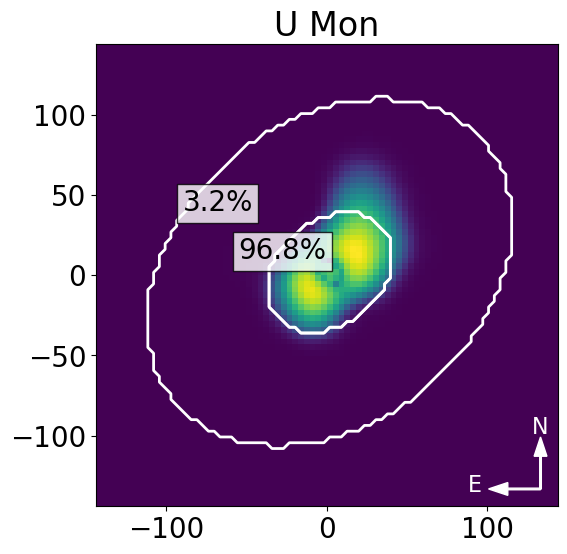
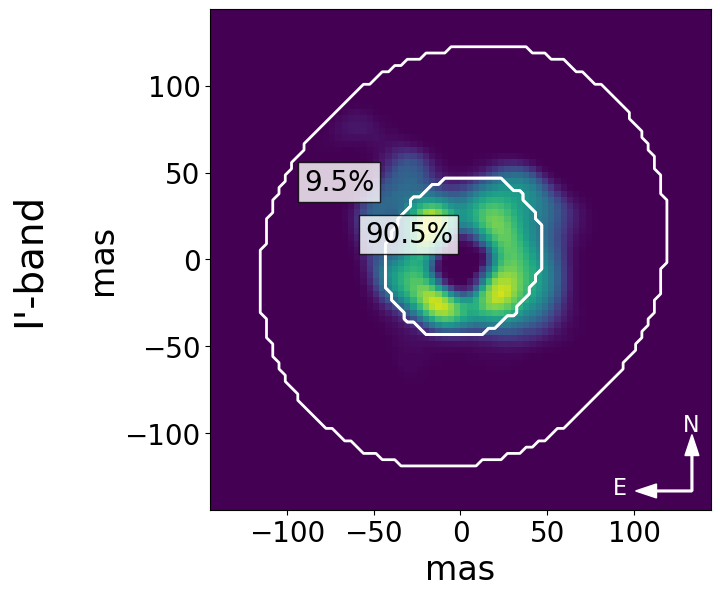
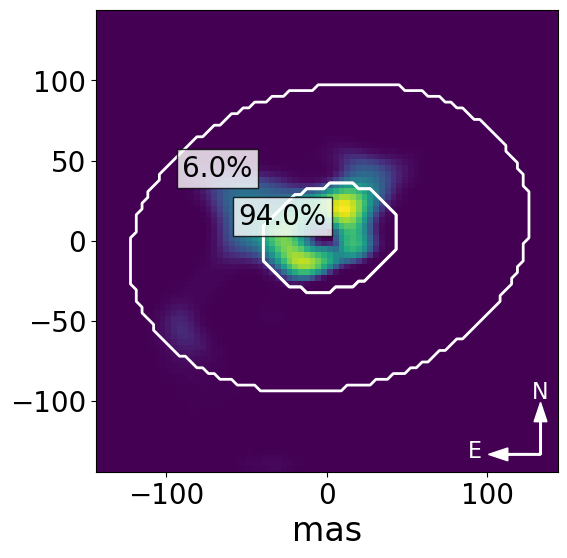
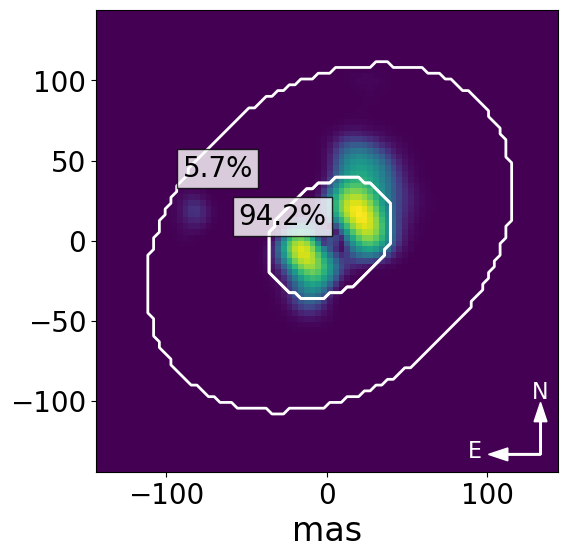
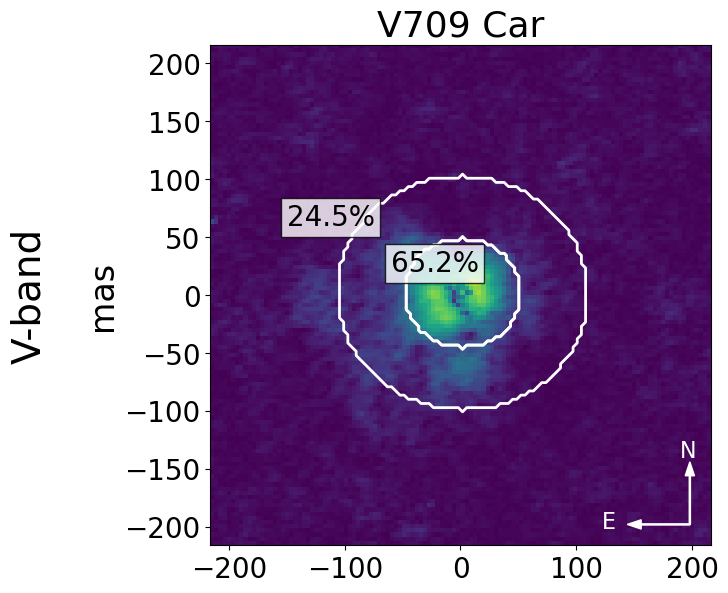
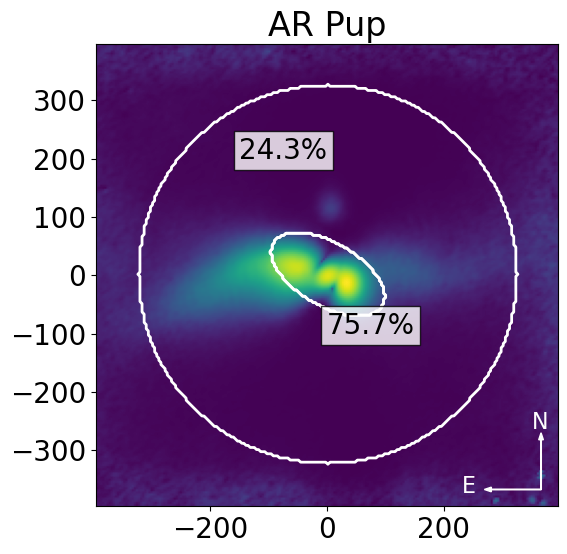
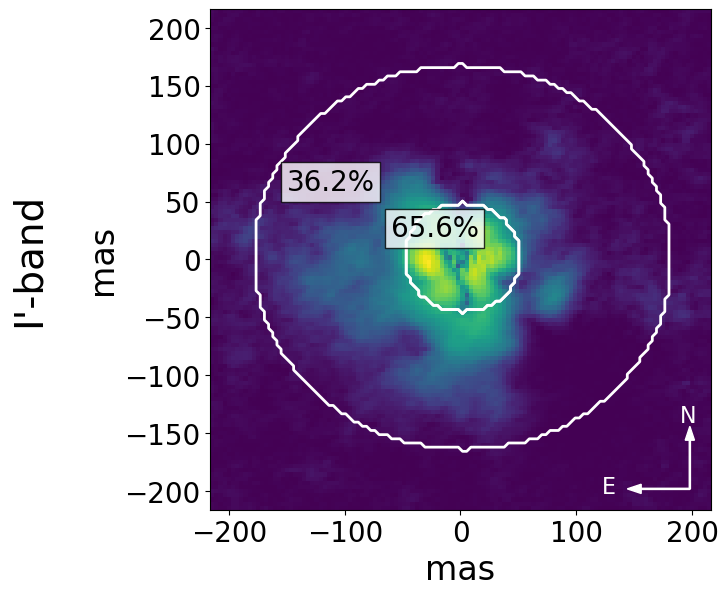
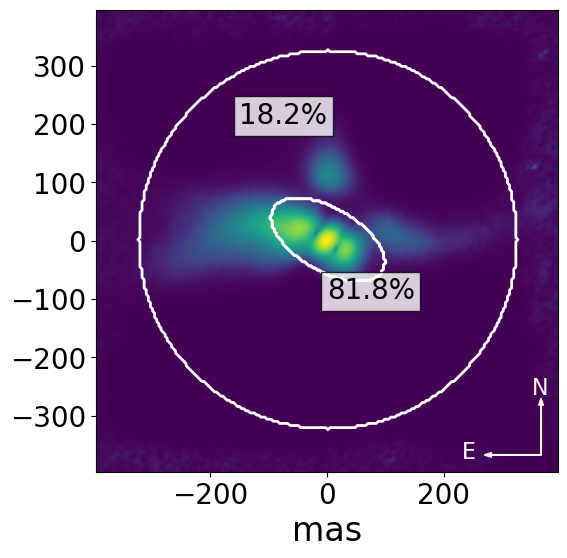
To identify real features in the linearly polarized images (such as arcs or gaps) we used two criteria: i) the estimated SNR for the final deconvolved polarimetric images, and ii) the centrosymmetric orientation of the polarization vector (AoLP, see Fig. 22 of E). Using these criteria, we identified reliable substructures, in addition to the bright elliptic ‘ring’, in the polarimetric images of the circumbinary disc for all targets in both the and bands. To quantify the brightness of these substructures, we calculated the percentage of total polarized intensity corresponding to the extended disc substructures and the central ring, excluding the unresolved central polarization (as shown in Fig. 4). Notably, the substructures appear more pronounced in the band compared to the band for all targets.

4.5 Disc scattering morphology
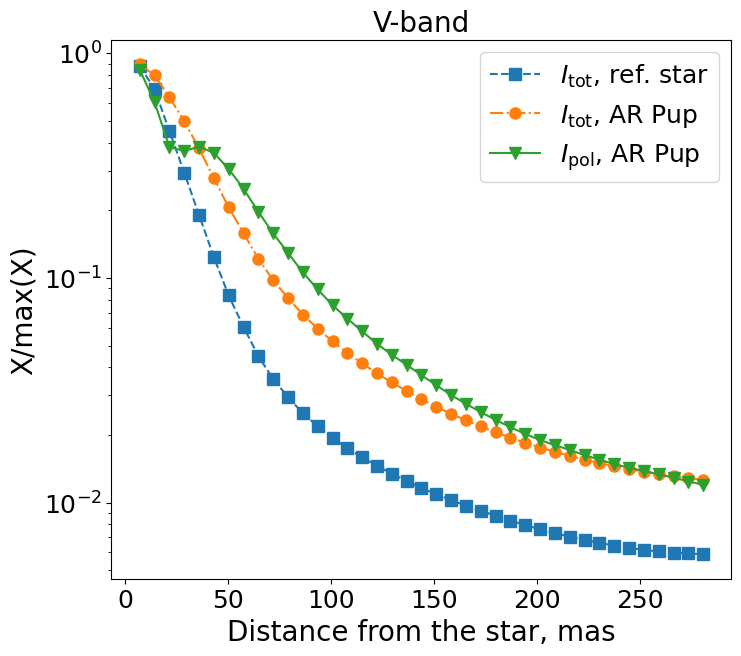
The total intensity frames () for each target in the sample include both the stellar intensity and scattered light from the disc. Tschudi2021A&A...655A..37T proposed a method to disentangle the direct stellar light from the scattered disc component, which requires a clearly resolved separation between the bright inner disc rim and the central star. However, this condition is not met for any of our systems due to the small angular size of the disc inner rim. To assess whether disentangling of stellar intensity and scattered light is feasible for our binary systems, we computed radial brightness profiles for the total intensity of each post-AGB system and its corresponding reference single star (see Section 4.4.1 for methodology details). The resulting profiles were normalized to the maximum intensity of each target. For four out of five targets (HR 4049, HR 4226, U Mon, and V709 Car), the radial intensity profiles closely match those of the reference star, indicating that the image is strongly dominated by the variable PSF of the star. The small angular size of the resolved discs makes their intensity too weak to detect. However, this is not the case for AR Pup. The radial brightness profile for of AR Pup is less steep than that of the reference star (see Fig. 5). In this system, the disc obscures the central binary (see Section 3 and Fig. 2), improving the contrast and allowing the disc to be resolved in total intensity.
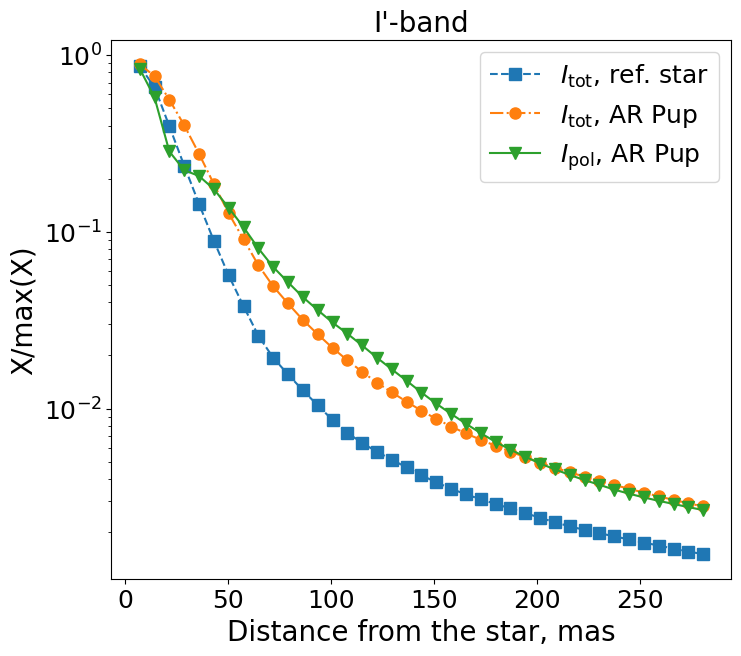
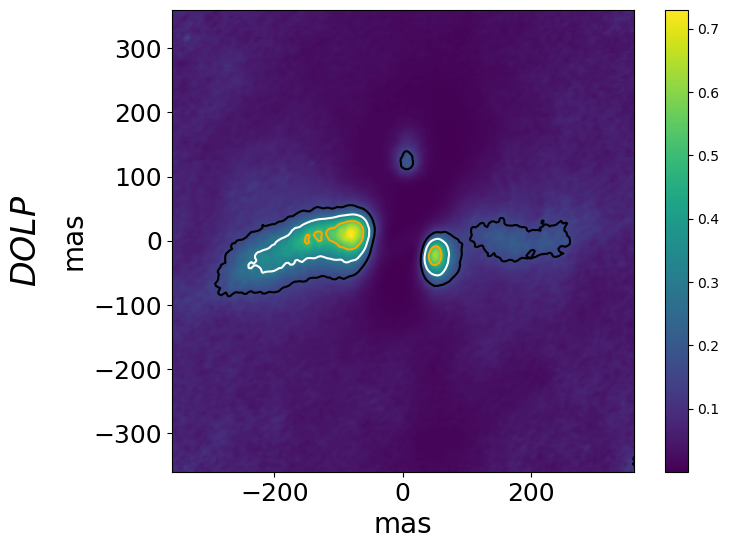
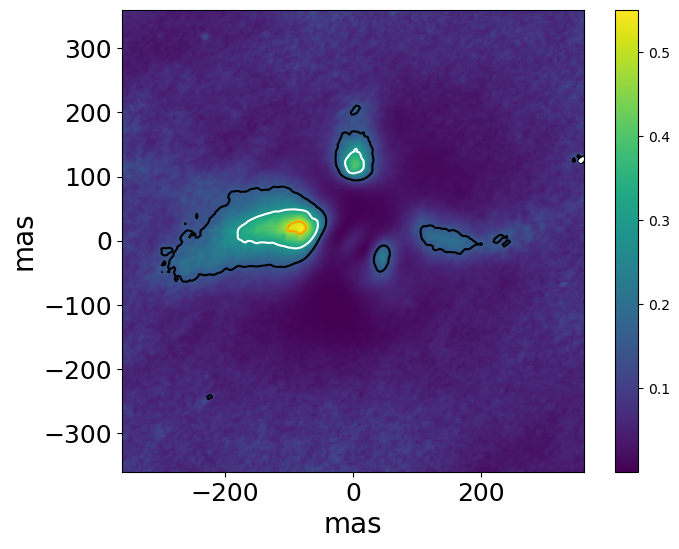
Moreover, we computed the degree of linear polarization (DoLP) map of the resolved scattered emission by calculating the pixel-to-pixel ratio of polarized intensity to the total intensity of the system (). While the total intensity () of AR Pup is dominated by direct stellar light close to the central binary, we were able to analyse dust polarization efficiency at larger separations from the stars. To carefully retrieve the scattered morphology of the disc we also deconvolve the resulting and DoLP map of AR Pup with the observational PSF (see Section 3.2 for details). The final deconvolved total intensity image and DoLP map of AR Pup in and bands are presented in Fig. 8. From the deconvolved DoLP map, we directly measured the maximum DoLP of the resolved disc structures (fractional polarization of the scattered light), finding values of in the band and in the band. These results are further discussed in Section 4.7.1.
4.6 Wavelength-dependent polarized intensity and structure of circumbinary disc
Polarimetric observations provide an estimate of the amount of light polarized by the disc surface layers, thereby offering a lower limit for the reflected light from the disc surface (Benisty2022arXiv220309991B, e.g.,). However, accurately characterizing dust in distant post-AGB circumbinary discs through polarimetry is challenging due to their small angular disc size, instrumental limitations, and uncertainties in the disc’s geometry. Despite these challenges, we can measure the total polarized brightness of the disc across different wavelengths. Assuming similar scattering geometries across these wavelengths, the observed differences in the polarized signal are primarily caused by the scattering and absorption properties of the dust in the disc. Therefore, the wavelength dependence of the polarized brightness is a valuable indicator for studying the dust properties (Ma2023A&A...676A...6M; Ma2024A&A...683A..18M, e.g.,).
| Target | ||
|---|---|---|
| AR Pup | 0.4 0.3 | - |
| HR 4049 | -0.4 1 | 0.6 0.5 |
| HR 4226 | -0.3 0.2 | - |
| U Mon | -0.6 0.4 | -0.9 0.3 |
| V709 Car | -0.5 0.7 | - |
Notes: quantifies the polarimetric color between the - and -bands, while represents the polarimetric color between the - and -bands. We note that is classified as grey colour, as blue and as red Tazaki2019MNRAS.485.4951T; Ma2023A&A...676A...6M. See Section 4.6 for more details.
To establish the wavelength dependence of the disc polarized intensity, we combined results from this SPHERE/ZIMPOL study in the and bands with SPHERE/IRDIS band observations where available Andrych2023MNRAS.524.4168A. The disc polarized brightness presented in Andrych2023MNRAS.524.4168A was not corrected for PSF smearing effects (see Section 3.2). Therefore, while adopting SPHERE/IRDIS band polarimetric results, we applied a PSF smearing correction to ensure a consistent comparison of the disc polarized brightness across available wavelengths. The wavelength dependence of the disc total () and azimuthal () polarized intensity for each target system is shown in Fig. 6. We note that for U Mon, decreases more steeply with wavelength than , though this does not affect the overall trend for the target. For all other systems, and overlap within the uncertainties.
To quantitatively assess the wavelength dependence of the polarized disc brightness, we calculate the logarithmic gradient of the polarized intensity using either two optical or optical and IR bands. This gradient serves as a measure of the disc’s polarimetric colour:
| (1) |
where , and is classified as grey colour, as blue and as red Tazaki2019MNRAS.485.4951T; Ma2023A&A...676A...6M.
The resulting optical () and optical-IR () polarimetric colour for each target binary system are presented in Table 5. Notably, three out of the five post-AGB systems (HR 4226, V709 Car, and AR Pup) exhibit results consistent with a grey disc colour, while U Mon and HR 4049 display borderline blue colour.
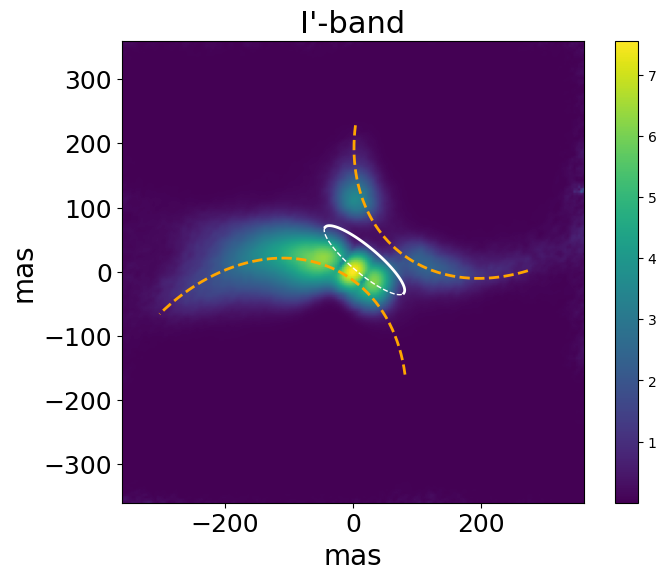
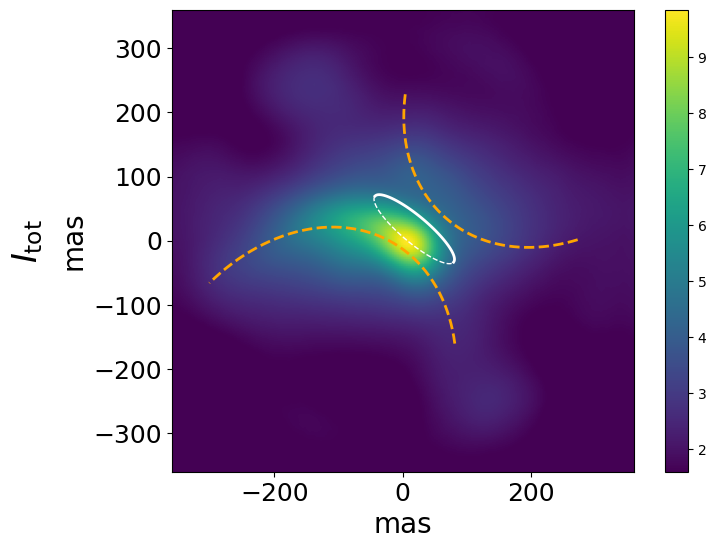
A multi-wavelength polarimetric imaging study of the post-AGB system IRAS 08544-4431 revealed variations in disc size and morphology across different wavelengths Andrych2024IRAS08. To investigate whether similar effects are present in our targets, we first compared the morphology of the smallest resolved section of the circumbinary disc close to the central binary (the bright ‘ring’). Unlike the results for IRAS 08544-4431, we did not find any significant variation (beyond the uncertainty) in the apparent inclination of the discs with wavelength (see Fig.3 and Table 4).
We also combined polarimetric images of all our targets in the and band data (from this study), along with band data for HR 4049 and U Mon (Andrych2023MNRAS.524.4168A, adapted from). The images ( for HR 4049, see Section 3.2) were normalized to the corresponding total intensity of the target. In Fig. 7 we present the final combined polarimetric images of all target systems in the , , and bands (when available). To emphasize the intensity changes along the disc, we applied an inverse hyperbolic scale and a discrete colour map. We note that substructures are more pronounced in the band compared to the band for HR 4049, AR Pup, and HR 4226, but a noticeable difference in disc size is observed only for V709 Car, where the disc appears more extended in the band. Additionally, while comparing SPHERE/ZIMPOL optical results with SPHERE/IRDIS near-IR images, we found that U Mon shows a more extended disc in the near-IR, whereas HR 4049 does not exhibit any change in size. We further discuss the results for each binary system individually in Section 4.7.

4.7 Individual case studies
In this section, we provide a comprehensive analysis of the SPHERE/ZIMPOL polarimetric imaging results for each evolved binary system in our sample. For each target, we present detailed observational findings, including the resolved disc structures and their scattering and polarization properties, which are also summarized in Tables 4, 5. We also compare our results, where possible, with previous studies based on high-resolution imaging data, IR and radio interferometry. While this section focuses on presenting the results, their broader implications are discussed in Section 5.
4.7.1 AR Pup
AR Pup was the first post-AGB binary for which the extended disc structure was resolved with SPHERE Ertel2019AJ....157..110E. However, that study lacked polarimetric data, as the SPHERE polarimetric mode was not available at the time. Here, we present the first multi-wavelength polarimetric results for this target.
Similar to other targets in the sample, the polarimetric images of AR Pup include contributions from unresolved central polarization, which arises from both the unresolved portion of the disc and interstellar polarization (see Section 3.2). Although we estimated the degree and orientation of the unresolved component (see Table 3), the orientation of the disc leads to a significant overestimation of the unresolved polarized signal. This complicates the subtraction of unresolved polarization without affecting the resolved disc structure. Therefore, we did not apply the correction for unresolved polarization for this data. We note that both the radial and linear brightness profiles of AR Pup polarimetric images () exhibit clear peaks at the position of the central binary, corresponding to the unresolved polarization, as well as additional peaks associated with the extended disc polarimetric emission (see Fig. 21, D).
AR Pup displays the highest polarimetric disc brightness in our sample (4.40.3% in the -band and 5.10.2% in the band, see Table 4), likely due to its disc orientation, which partially obscures the host binary and leads to an underestimation of the stellar intensity. This aligns with AR Pup’s known RVb phenomenon, a long-term periodic variation in mean magnitude (Kiss2017, period of 1194 days,), typically explained by an inclined circumbinary disc that periodically obscures the pulsating primary star Vega2017ApJ...839...48V; Manick2017. AR Pup is the only target in the sample for which the polarimetric disc brightness slightly increases with wavelength. However, this increase may be attributed to the greater number of scattered photons reaching the observer due to the decrease in dust absorption at longer wavelengths Kirchschlager2014A&A...568A.103K; Tazaki2018ApJ...860...79T, rather than an increase in polarimetric efficiency. Investigating the deconvolved DoLP map of the resolved scattered emission of AR Pup (see bottom panel of Fig. 8 and Section 4.5 for the details) we found a maximum degree of resolved polarization to be in band and in band, in both cases peak was located to the east from the position of the binary. For the northwestern disc surface, the polarization achieves in band and in band.
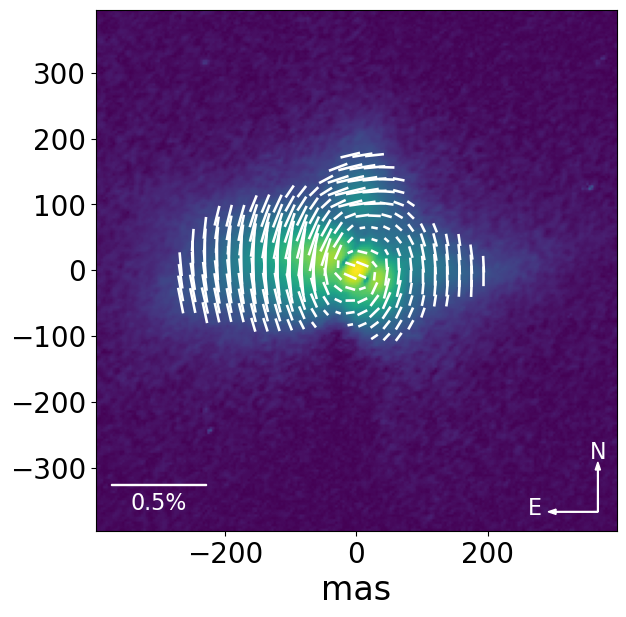
Ertel2019AJ....157..110E presented the first SPHERE high-resolution imaging of AR Pup, revealing a distinct ‘double-bowl’ structure separated by a dark band. They interpreted this resolved morphology as an edge-on flared disc with an optically thick mid-plane, where the two ‘bowls’ correspond to the disc surfaces scattering stellar light. Their study also found that the southeastern disc surface appears brighter than the northwestern one, suggesting that the southeastern side is oriented toward us, allowing starlight to scatter directly into our line of sight, while the northwestern surface is partially obscured by the disc itself. Our results support these findings and interpretations, as AR Pup exhibits the same ‘double-bowl’ structure in both and band polarimetric images as well as in total intensity frames (see Fig. 8). From the location of the disc mid-plane in our polarimetric images, we estimate its size to be approximately 80 mas, with an inclination of and a PA of , consistent with the values reported by (Ertel2019AJ....157..110E, and , ). In addition to confirming the disc geometry, our observations provide further insight into the polarization properties of the system. We argue that the disc orientation proposed by Ertel2019AJ....157..110E explains why the northwestern ’bowl’ appears significantly dimmer in azimuthally polarized images compared to total polarized intensity frames, whereas the southeastern ‘bowl’ remains consistently bright. If the northwestern surface is oriented away from us, the stellar light scattered there likely undergoes multiple scattering through the disc material, disrupting the polarization orientation and reducing the expected azimuthal signal typically seen after single scattering. The suggested disc orientation is further supported by the fact that the northwestern ‘bowl’ is brighter in the band than in the band. This pattern is consistent with the behaviour of light as it passes through the disc, where dust absorption decreases with increasing wavelength, allowing more light to penetrate.
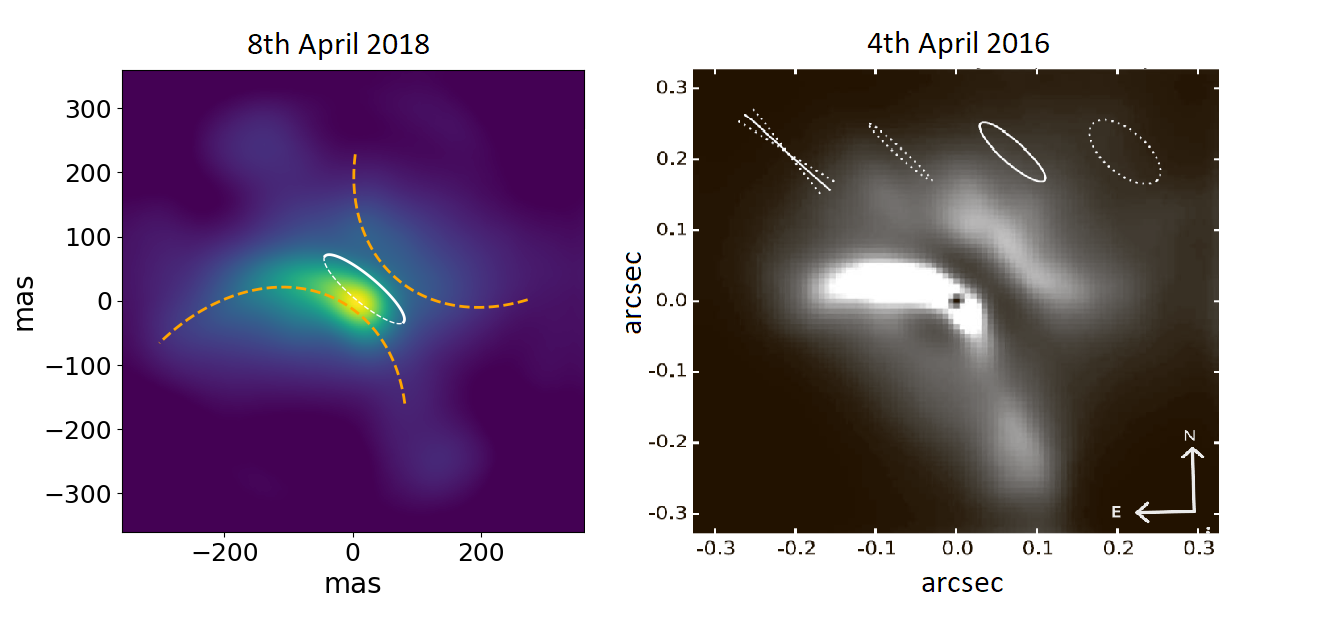
We also note, that the brightness asymmetry within the southeastern disc surface differs between our 2018 observations and those from 2016 presented in Ertel2019AJ....157..110E (see Fig. 23 in F). In the earlier observations, the brighter arc extended along the southern side of the ‘bowl’, whereas in our data, it appears more prominent on the eastern side. This change is consistent with the binary’s orbital motion, which, over the two-year interval between observations, would have moved the post-AGB star by approximately 60% of its orbit (orbital period of days; see Table 1). This result highlights the potential for high-resolution imaging to trace the dynamic response of the circumbinary disc to stellar motion.


4.7.2 HR 4049
HR 4049 was observed twice, on January 7 and 8, 2019, due to not ideal weather conditions during the first observation. To increase the signal-to-noise ratio, we initially reduced the polarimetric cycles from each observation separately, selecting the highest-quality images before combining them. We then mean-combined all frames after reduction and performed the analysis on the combined set.
We found that HR 4049 shows the smallest unresolved polarisation component in the sample (see Table 3, Section 3.2). This can be attributed to HR 4049’s position above the Galactic midplane, which reduces polarization from the diffuse interstellar medium along the line of sight. Additionally, geometrical modelling of near-IR interferometric data for HR 4049 revealed a binary and Gaussian ring with inner rim of mas Kluska2019A&A...631A.108K, suggesting that the unresolved portion of the disc is relatively small. Moreover, the unresolved central polarization we measured for HR 4049 falls within the uncertainty range of the total polarization detected from the reference star (HD96314), both in value and orientation (see Fig. 1). Therefore, we conclude that the unresolved central polarization observed for HR 4049 is predominantly caused by interstellar polarization rather than the unresolved portion of the circumbinary disc.
We measured a borderline blueish polarimetric colour index of resolved disc brightness for the system ( and ). The unusually large uncertainty in is primarily due to a ‘cross-shaped’ observational artefact in polarimetric intensity observed in the and (to less extent) bands (see Section 3.2.7). This intensity drop also disrupts the azimuthal brightness profiles in both and bands (see Fig. 17, D).
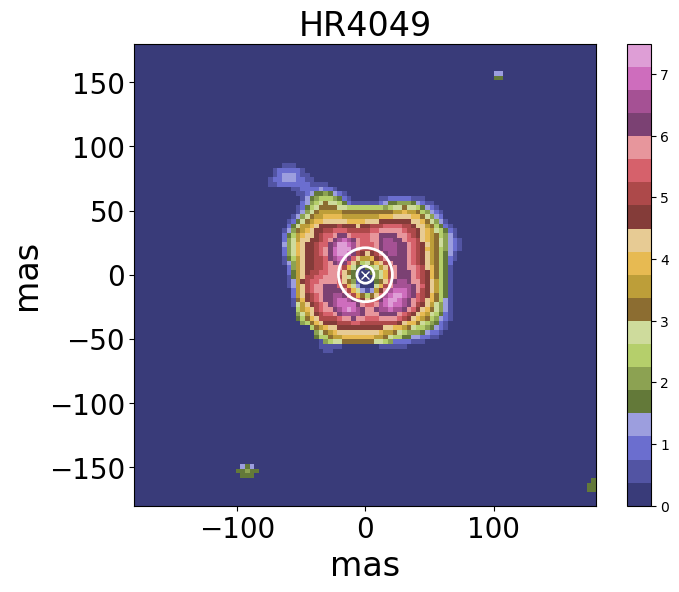
HR 4049 shows a bright resolved disc surface in both and bands. We obtained a disc inclination of and , with PA of and in and bands, respectively (see Section 4.3). These values align with previously identified disc orientations in near-IR -band polarimetric imaging (Andrych2023MNRAS.524.4168A, inclination of and PA of ,), suggesting a nearly face-on disc orientation. However, this low inclination contradicts the observed RVb phenomenon of HR 4049 Waelkens1991A&A...242..433W and also differs from the results of IR interferometric studies (Kluska2019A&A...631A.108K, inclination of 49∘, PA of 63∘,). While we cannot fully explain this discrepancy, we suggest that the RVb phenomenon may be caused by a high disc scale-height, a potentially misaligned inner part of the disc, or other unresolved dynamical processes closer to the central binary. We did not detect any significant change in the size of the resolved disc of HR 4049 across the , , and -band polarimetric data, with extended resolved emission observed up to mas from the central star (see Fig. 7). Although the and band polarimetric images do not reveal any significant substructures, the band images display an arc-like feature to the northeast of the binary position. To determine whether this substructure might be an observational artefact, we compared separately reduced observations from January 7 and 8, 2019, and found that this structure is consistently visible in both datasets. While additional observations of the disc midplane, such as dust continuum observations with ALMA, are necessary to draw definitive conclusions about the physics of this feature, we speculate that it may be part of a spiral structure.
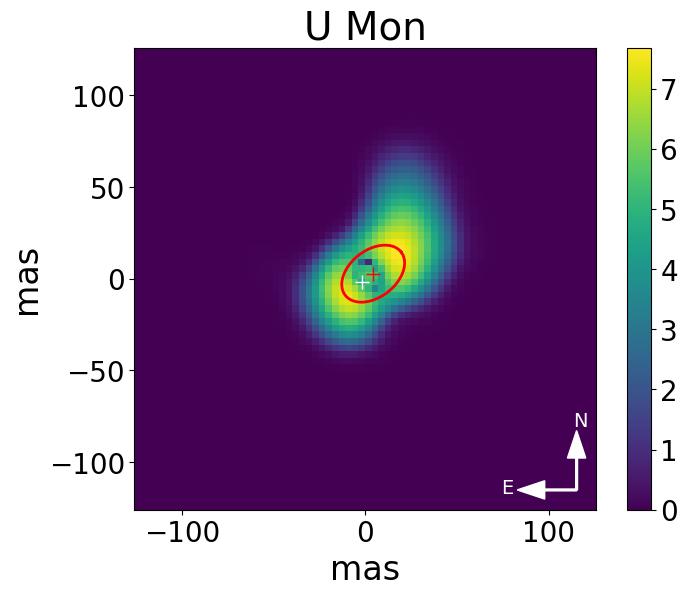
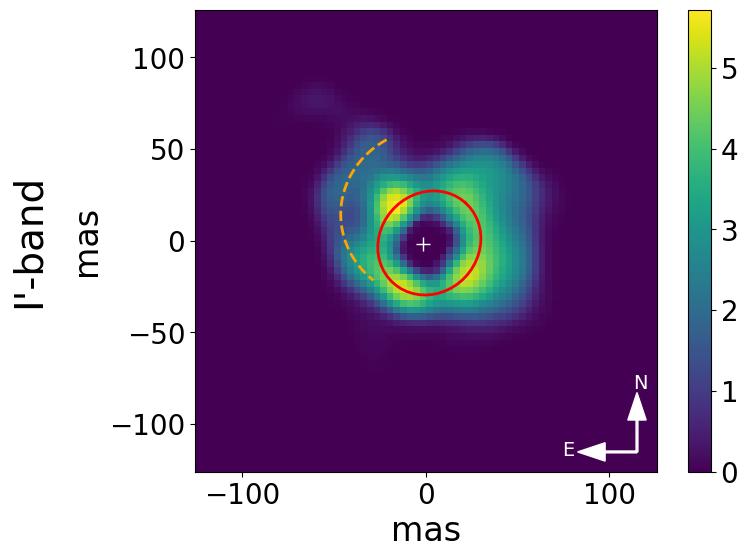
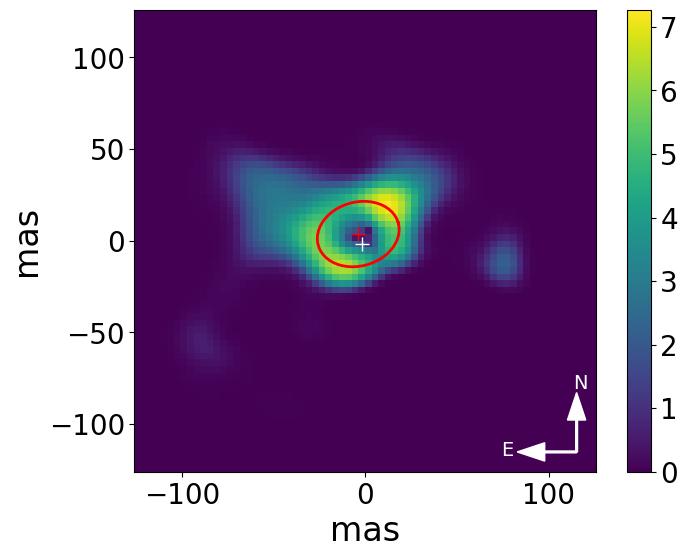
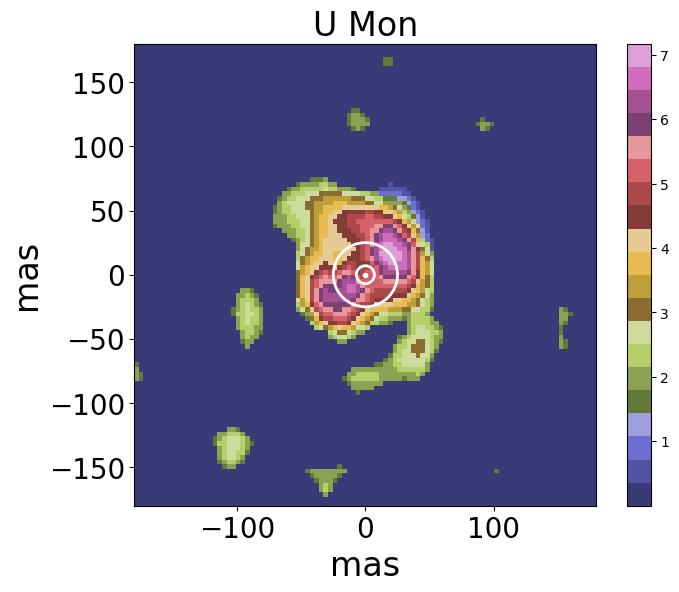
4.7.3 U Mon
For U Mon, we measured an unresolved polarization degree of % in the -band and % in the -band, both of which exceed the polarized intensity measured for the reference star (see Fig. 1). Since U Mon is located in the Galactic plane, we expect a quite significant effect of interstellar polarization for this system (see Section 3.2). However, the reference star HD71253 lies above the Galactic midplane and, therefore, cannot serve as a reliable estimate of interstellar polarization for U Mon. Thus, we cannot determine the relative contributions of the unresolved circumbinary disc polarization and interstellar polarization for U Mon.
We measured polarized disc brightness of U Mon to be 1.80.2% of the total intensity in the -band and 1.40.07% in the band, resulting in a blueish polarimetric colour index of and .
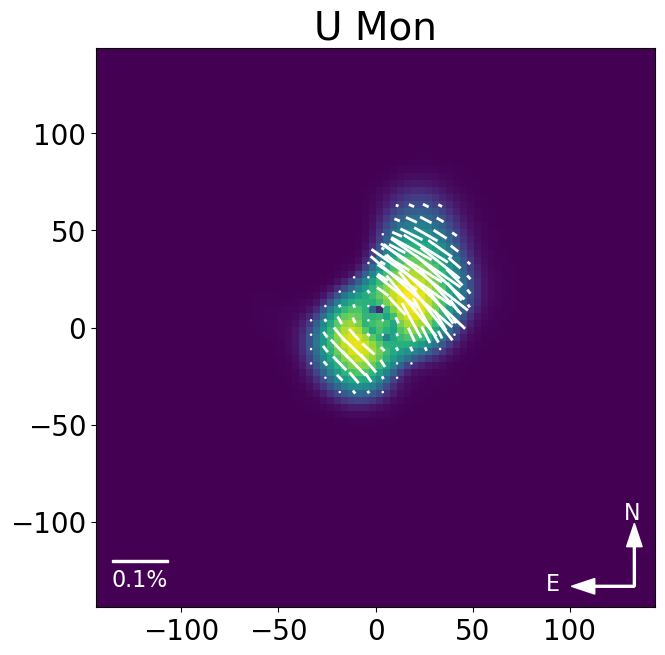
U Mon shows a clear bright ‘ring’ in band and two arcs separated by a dark strip in band. However, we note that this dark strip is an artefact from the subtraction of unresolved central polarization, including some polarized emission from the disc. We estimated a disc inclination of and PA of in both and bands (see Section 4.3). While the PA of the disc aligns with the previously identified value from near-IR -band polarimetric imaging (), our inclination estimate is significantly higher (Andrych2023MNRAS.524.4168A, previously estimated at in the -band,). However, the higher inclination value based on and band data is consistent with values obtained from geometric modelling using near-IR interferometric observations (Kluska2019A&A...631A.108K, ) and with the observed RVb phenomenon Kiss2017. We note that the north-western side of the disc appears brighter than other areas in both the - and -bands (see Fig. 19). We suggest that this brightness peak is likely caused by the forward scattering of stellar light on dust grains that are comparable in size to the observational wavelength (Ginski2023ApJ...953...92G, e.g.,). This effect also indicates that the northern part of the disc is inclined toward the observer.
While we do not observe any significant change in the resolved disc size or morphology across the - and -band polarimetric data, we note that the near-IR -band polarimetric image reveals a more extended disc (see Fig. 7). A similar effect has been reported for the post-AGB system IRAS 08544-4431 Andrych2024IRAS08. As suggested for IRAS 08544-4431, we propose that the larger apparent disc size and lower estimated inclination in -band polarimetric images may result from SPHERE probing slightly deeper disc layers at longer wavelengths, as dust opacity decreases from optical to near-IR Kirchschlager2014A&A...568A.103K; Tazaki2018ApJ...860...79T.
4.7.4 HR 4226
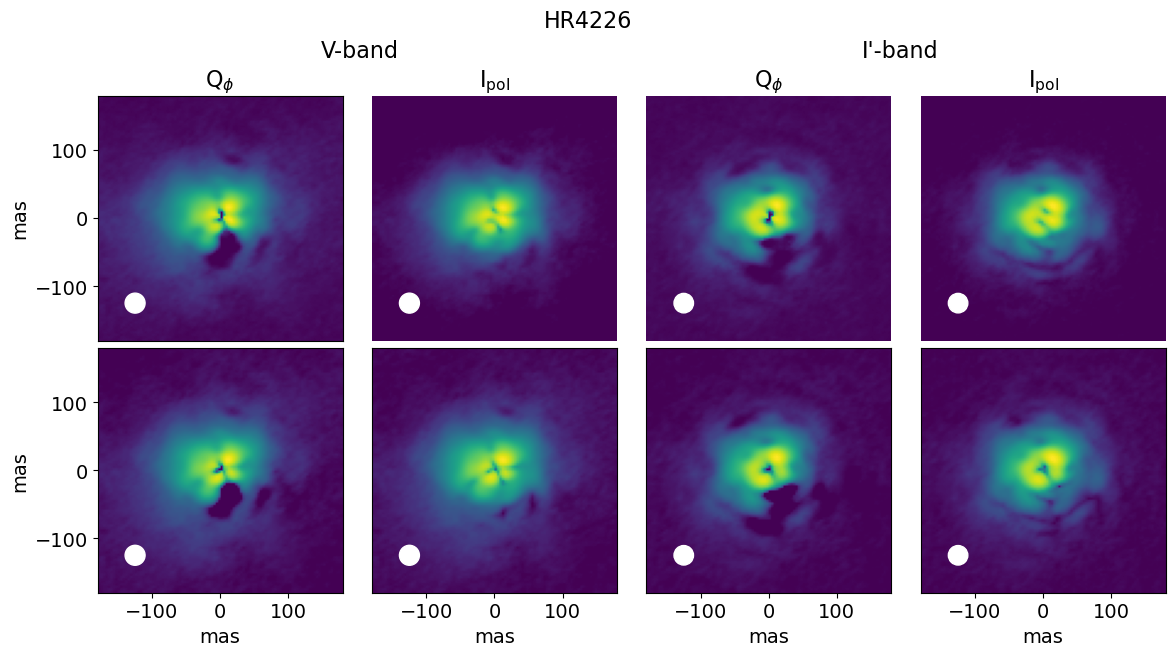
HR 4226 is located in the Galactic plane, however, we measured a relatively low degree of unresolved polarization for this target, with DoLP of % in band and % in band (see Section 3.2). Although the degree of unresolved polarization is similar to that detected from the reference star (HD98025), the orientation differs (see Fig. 1). Thus, we cannot determine the relative contribution of the unresolved circumbinary disc polarization and interstellar polarization for HR 4226.
For the resolved disc brightness in polarized light of HR 4226, we measured 1.90.1% of the total intensity in the -band and 1.750.06% in the band, resulting in a grey polarimetric colour index of . We also note that similarly to HR 4049, the -band polarimetric observations of HR 4226 suffer from a reduction artefact. Although the effect is less pronounced, it causes a ‘cross-shaped’ intensity decrease that disrupts the azimuthal brightness profile of the disc (see Fig. 17 and Section 3.2).
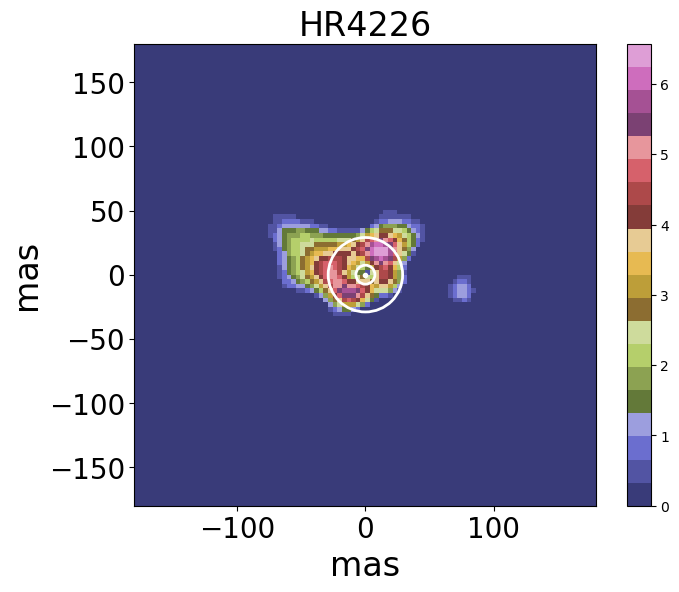
HR 4226 shows a clear bright ‘ring’ in both and bands. We estimated a disc inclination of and , with PA of and in and bands, respectively (see Section 4.3). We did not detect any significant change in the size of the resolved disc of HR 4226 across the -, band polarimetric data with the extended emission of up to mas from the central star (see Fig. 7). We also note that azimuthal brightness profiles of the disc show two distinct peaks along the major axis (see middle panel of Fig. 18, D), commonly attributed to the projection of an inclined circular disc onto the sky. These findings complement geometric modelling results based on IR interferometric data, which trace emission from warm dust closer to the central binary. A near-IR interferometric study with VLTI/PIONIER found that the circumbinary material was over-resolved, resulting in a binary model without a detectable ring Kluska2019A&A...631A.108K. Geometric modelling of mid-IR interferometric data from VLT/MIDI revealed a ring-like structure, with a half-light radius of mas and an outer diameter of mas Hillen2017. To develop a more complete understanding of this system, we conducted a thorough literature review, including spectroscopic studies and radial velocity (RV) monitoring results. While no elemental abundance studies are currently available for HR 4226, RV monitoring indicates an orbital period of days with small velocity variations ( km/s), leading to an exceptionally low mass function of Maas2003PhDT.......265M. These results combined with the results of our SPHERE study raise doubt on the nature of HR 4226, which is further explored in Section 5.
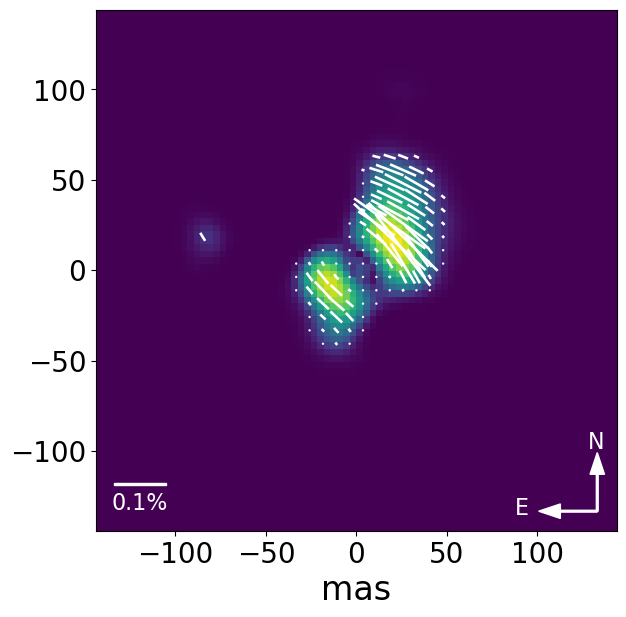
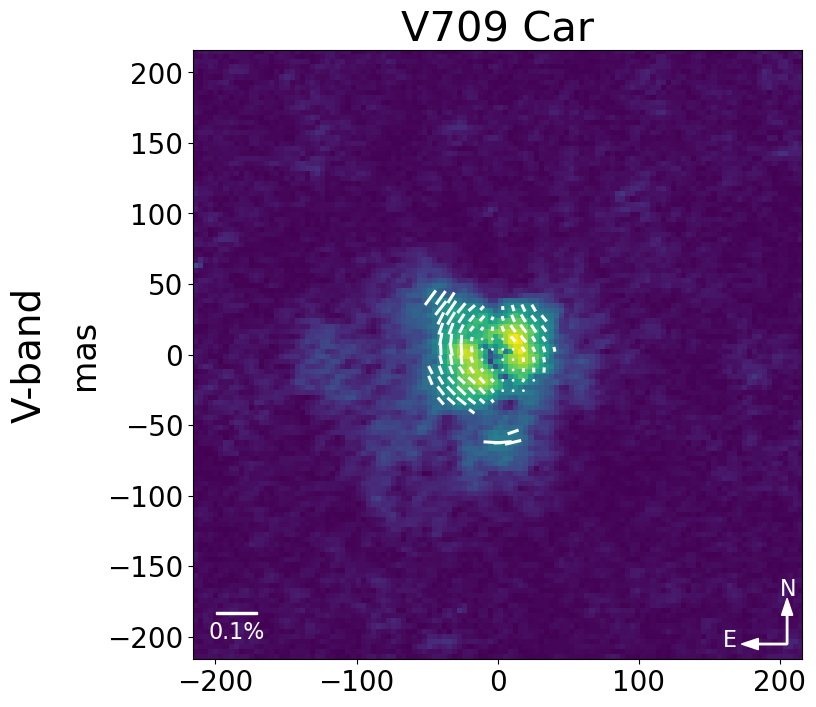
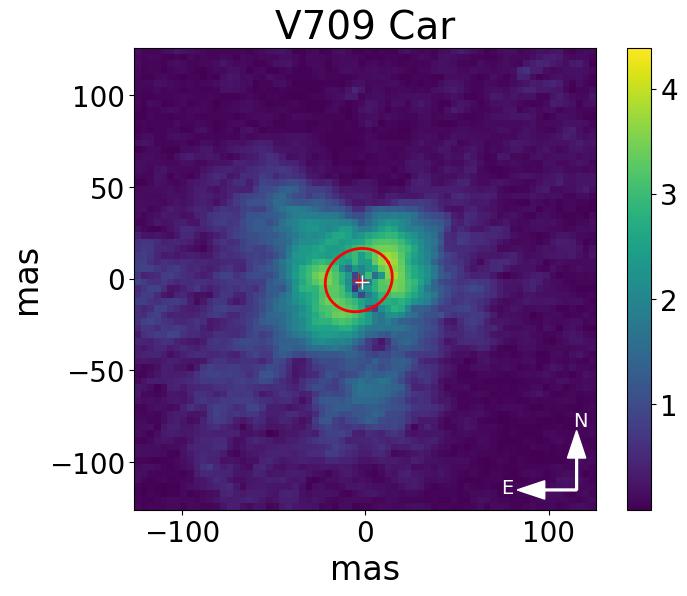
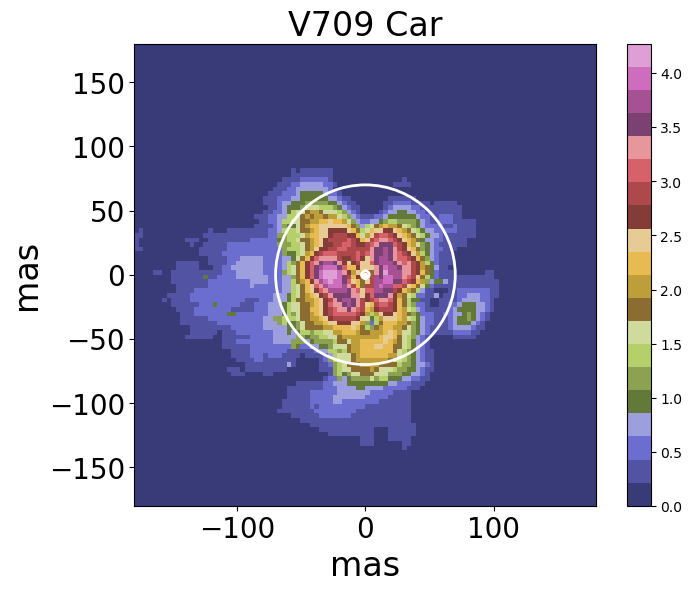
4.7.5 V709 Car
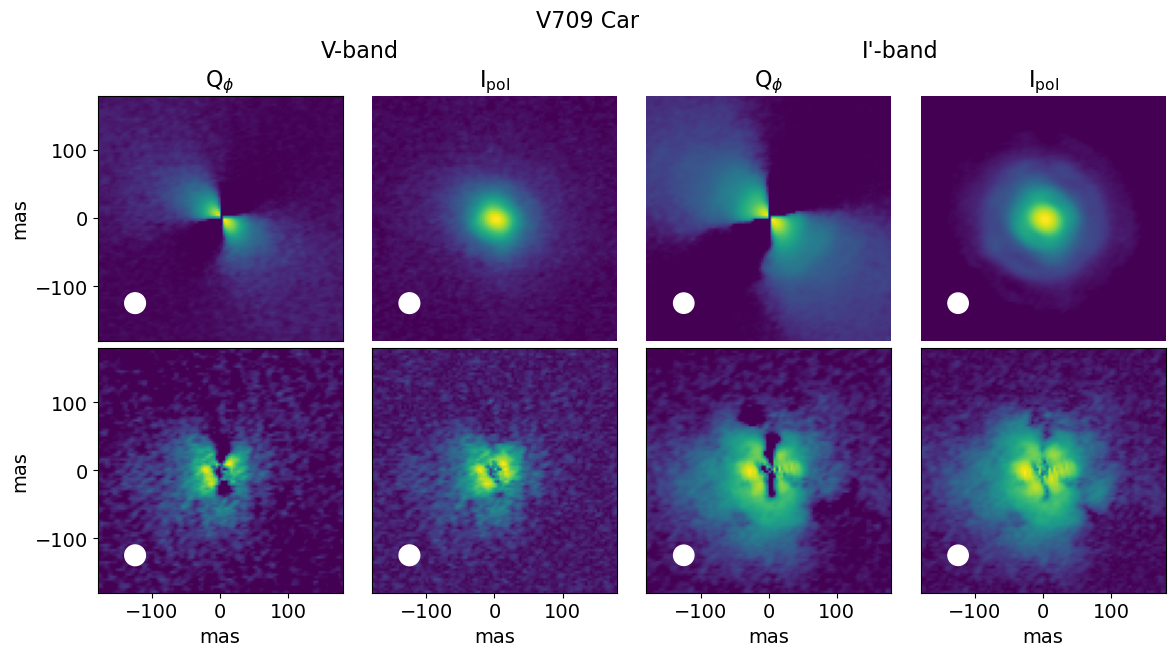
For V709 Car, we measured a high degree of unresolved polarization with DoLP of % in band and % in band (see Section 3.2). These values are much higher than polarization detected from the reference star HD94680, located closely in the Galactic plane. Therefore, we suggest that the unresolved central polarization measured for V709 Car is predominantly caused by the unresolved part of the circumbinary disc rather than polarization in the diffuse interstellar medium along the line of sight.
We measured the resolved disc brightness in polarized light of V709 Car to be the smallest in the sample (0.60.09% in the -band and 0.490.07% in the band, see Table 4), resulting in a borderline blueish polarimetric colour index of . We also note that the polarimetric observations of V709 Car suffer from instrumental artefacts that disrupt the azimuthal brightness profile of the disc (see Fig. 20 and Section 3.2.7). However, this effect is visible only in -band data.
Similar to other targets in the sample, V709 Car also shows a ‘ring’ structure in both and bands, which we interpret as a circumbinary disc surface. We estimated a disc inclination of and PA of in both and bands (see Section 4.3). We also note that band azimuthal brightness profile of the disc shows two distinct peaks along the major axis (see middle panel of Fig. 20, D), commonly attributed to the projection of an inclined circular disc onto the sky. V709 Car is the only target in our sample that shows a significant difference in the size of the resolved extended emission in reaching mas from the central star in -band polarimetric image, while appearing much smaller in band (see Fig. 4). However, we note that due to the low level of resolved signal and alignment of the radial brightness profiles with the expected r-2 illumination drop-off (see bottom panel of Fig. 18, D), these values have to be treated with caution. The resolved disc size is likely constrained by the telescope’s sensitivity, as the scattered emission farther from the central star may be too faint to detect, rather than being limited by the disc’s true extent or shadowing effects.
Geometric modelling of near-IR interferometric data reveals a structure dominated by the primary star and a circumbinary ring with remarkably high temperature of and outer radius of mas Kluska2018A&A...616A.153K. Geometric modelling of mid-IR interferometric data with VLT/MIDI indicates a ring with a half-light radius of mas, times larger than its near-IR size Hillen2017. The Spitzer survey of Gielen2011A&A...533A..99G indicates that the spectrum of this source is dominated by amorphous silicates with no crystalline dust features. These literature results combined with outcomes of this study raise questions about the evolutionary stage of a primary star. We have explored this further in Section 5.
5 Discussion
In this section, we interpret the obtained results to better understand the morphology and dust characteristics in post-AGB circumbinary discs. We accomplish this by: i) characterizing the dust properties on the disc surfaces within our sample, ii) comparing the circumstellar environments of AGB and post-AGB systems, iii) examining the similarities between circumbinary discs around post-AGB binaries and PPDs around YSOs and iv) investigating two targets whose evolutionary nature is unclear.
5.1 Dust properties and disc morphology of post-AGB binaries
The appearance of circumstellar discs in scattered light depends on their geometry and the optical properties of the dust particles within them. These characteristics can be inferred by analyzing the intensity and polarization degree of reflected stellar light, as well as its brightness distribution and wavelength dependencies (Tazaki2023ApJ...944L..43T; Garufi2018A&A...620A..94G, e.g.,).
Four of five evolved systems in our sample (AR Pup, HR 4049, HR 4226, and U Mon) exhibit high polarimetric disc brightness, with more than 1% of the total intensity of the system in optical wavelengths ( and -bands). For AR Pup, we also directly measured the maximum degree of resolved polarization of in the band and in the band (see Section 4.5). We note that U Mon shows a forward scattering peak, which mirrors similar findings for the post-AGB system IRAS 08544-4431 Andrych2024IRAS08 and is indicative of anisotropic scattering. However, forward scattering signatures are less evident for HR 4049 and HR 4226, likely due to their orientation, instrumental artefacts, and limited spatial resolution. The polarimetric colour across the sample tends toward grey or slightly blue, except for AR Pup, which exhibits a borderline grey-red colour. In AR Pup, total polarimetric brightness slightly increases with wavelength, likely due to dominant dust absorption effects caused by the high inclination of the system and significant disc flaring (see Fig 8).
Numerical models by Tazaki2019MNRAS.485.4951T suggest that high degree of polarization, presence of forward scattering, and grey or blue polarimetric disc colours arise from porous aggregates composed of small monomers. Furthermore, radiative transfer (RT) models by Min2012A&A...537A..75M illustrate that polarimetric intensity distributions in inclined discs with porous dust grains align well with the polarimetric morphology observed in AR Pup’s disc. Based on these findings, we suggest the presence of large (submicron-sized) porous dust aggregates on the surfaces of the studied post-AGB circumbinary discs. However, our conclusions are based on qualitative comparisons rather than direct constraints on dust grain properties. A definitive determination of dust grain sizes requires detailed radiative transfer modelling, which is beyond the scope of this study.
Polarimetric imaging of all observed post-AGB systems reveals a bright central disc region and more extended emission with resolved substructures in both and bands. We note that substructures appear brighter in the band. A comparison with SPHERE/IRDIS near-IR imaging results shows that U Mon shows a larger disc size in near-IR compared to optical, similar to IRAS 08544-4431 Andrych2024IRAS08. In contrast, HR 4049’s disc size remains consistent across studied wavelengths. These variations and a range of resolved substructures in the post-AGB discs indicate a diversity in disc geometries, orientation and potentially dust composition within our sample. Additionally, we note that all targets studied to date with SPHERE in multi-wavelength polarimetric imaging belong to the ‘full disc candidate’ category (with dust inner rims likely located at the theoretical dust sublimation radius based on the IR excess of SED, see Section 1). To thoroughly investigate the dust properties and geometry of post-AGB circumbinary discs, future multi-wavelength polarimetric imaging observations should also include ‘transition’ discs, which contain large inner cavities Corporaal2023A&A...674A.151C.
5.2 Post-AGB discs in the broader context of circumstellar evolution
Advances in high-contrast imaging over the last decade have enabled direct observations of dusty circumstellar environments across various evolutionary stages. These include eruptive stars (Zurlo2024A&A...686A.309Z, e.g.,), planet-forming discs around YSOs (Garufi2024A&A...685A..53G, e.g.,), debris discs (Esposito2020AJ....160...24E; Crotts2024ApJ...961..245C, e.g.,), as well as environments around AGB stars (Khouri2020A&A...635A.200K, e.g.,), and post-AGB binary systems Ertel2019AJ....157..110E. These studies provide critical insights into the complex processes of dust formation, evolution, and the dynamical interactions between the star and its circumstellar material throughout stellar evolution. While systematic observational studies have extensively explored the circumstellar environments of YSOs (Avenhaus2018ApJ...863...44A; Garufi2020A&A...633A..82G; Ginski2021ApJ...908L..25G, e.g.,), fewer high-resolution polarimetric studies have focused on the later evolutionary stages. To bridge this gap, we compare polarimetric observations of post-AGB circumbinary discs with those of AGB stars and YSOs, providing new insights into the evolution of dust and scattering properties in these environments.
5.2.1 Parallels with circumstellar environments around YSOs
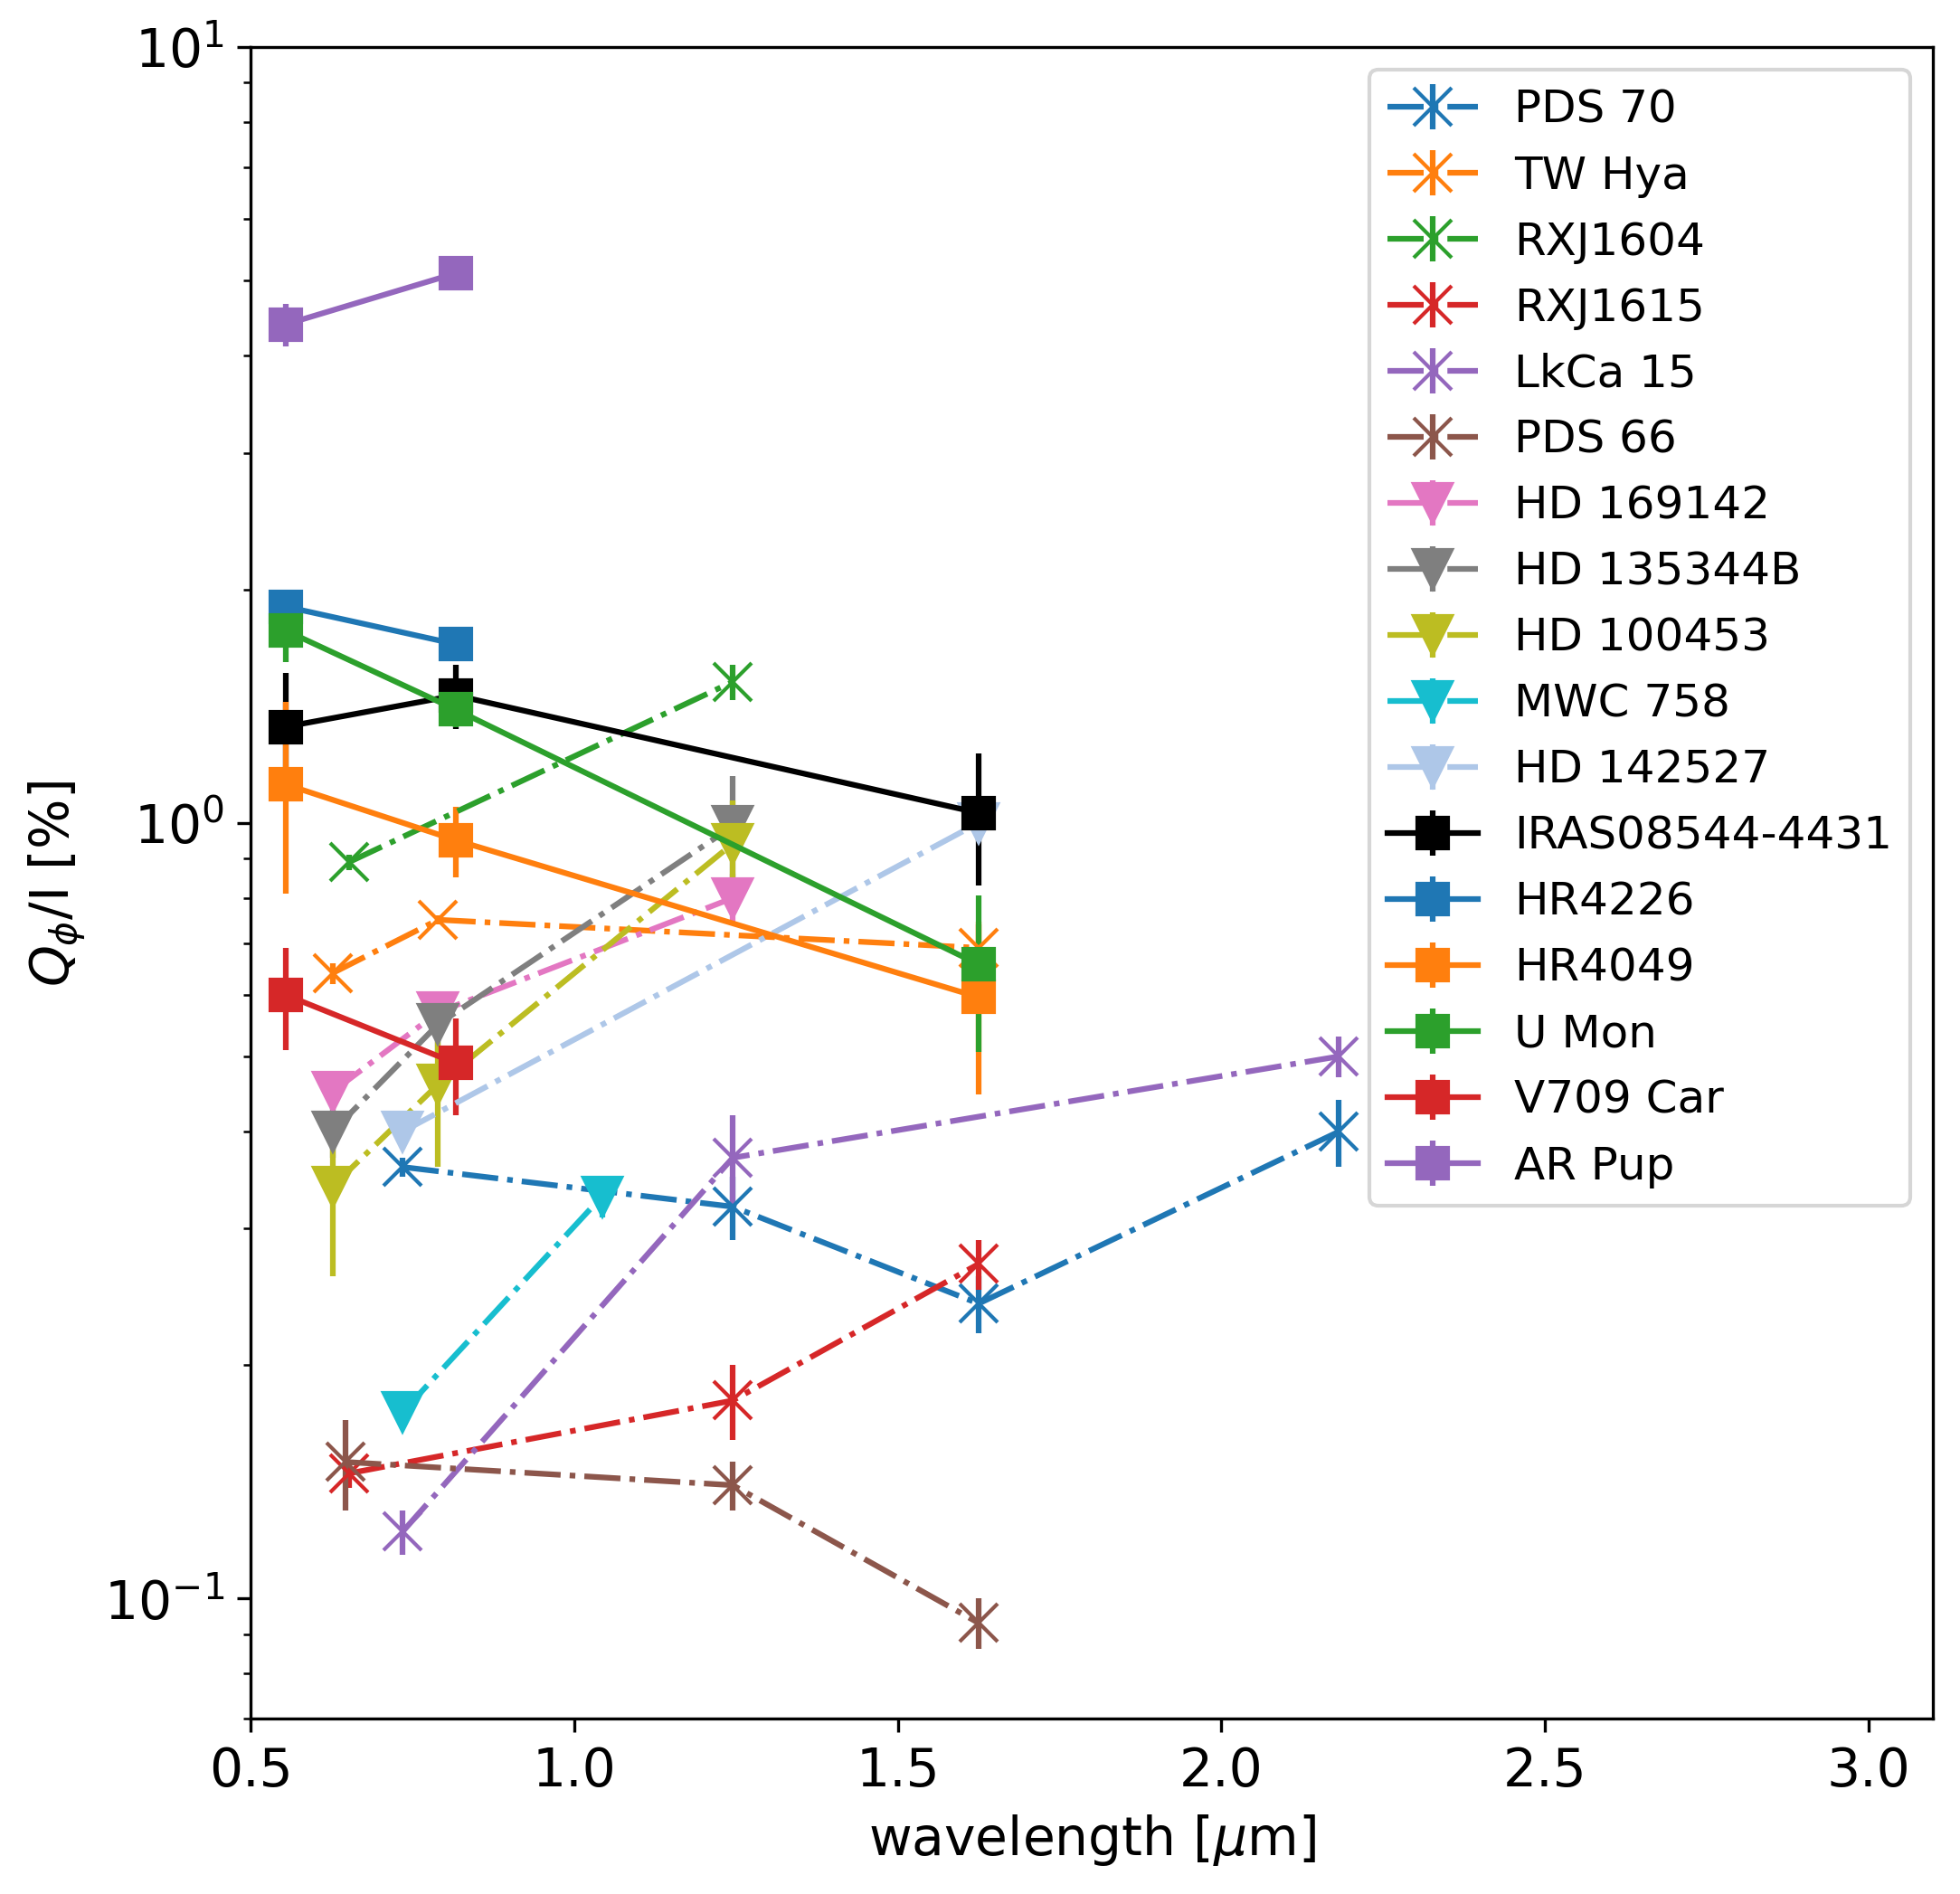
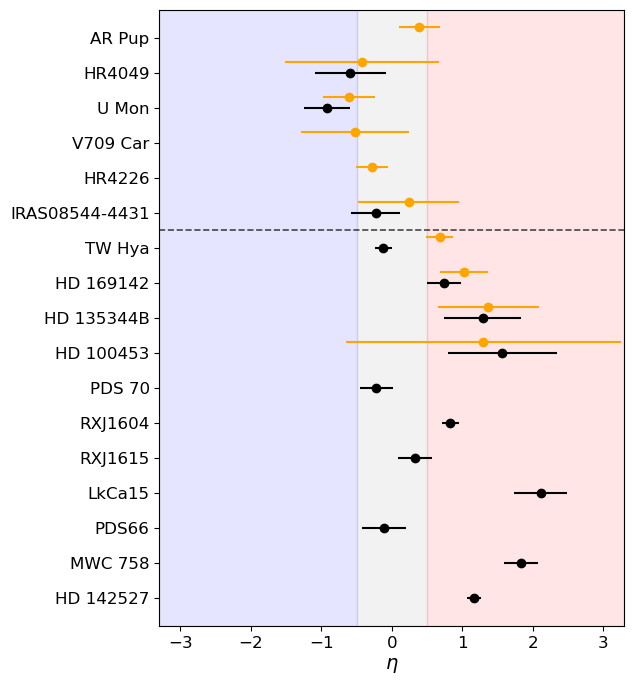
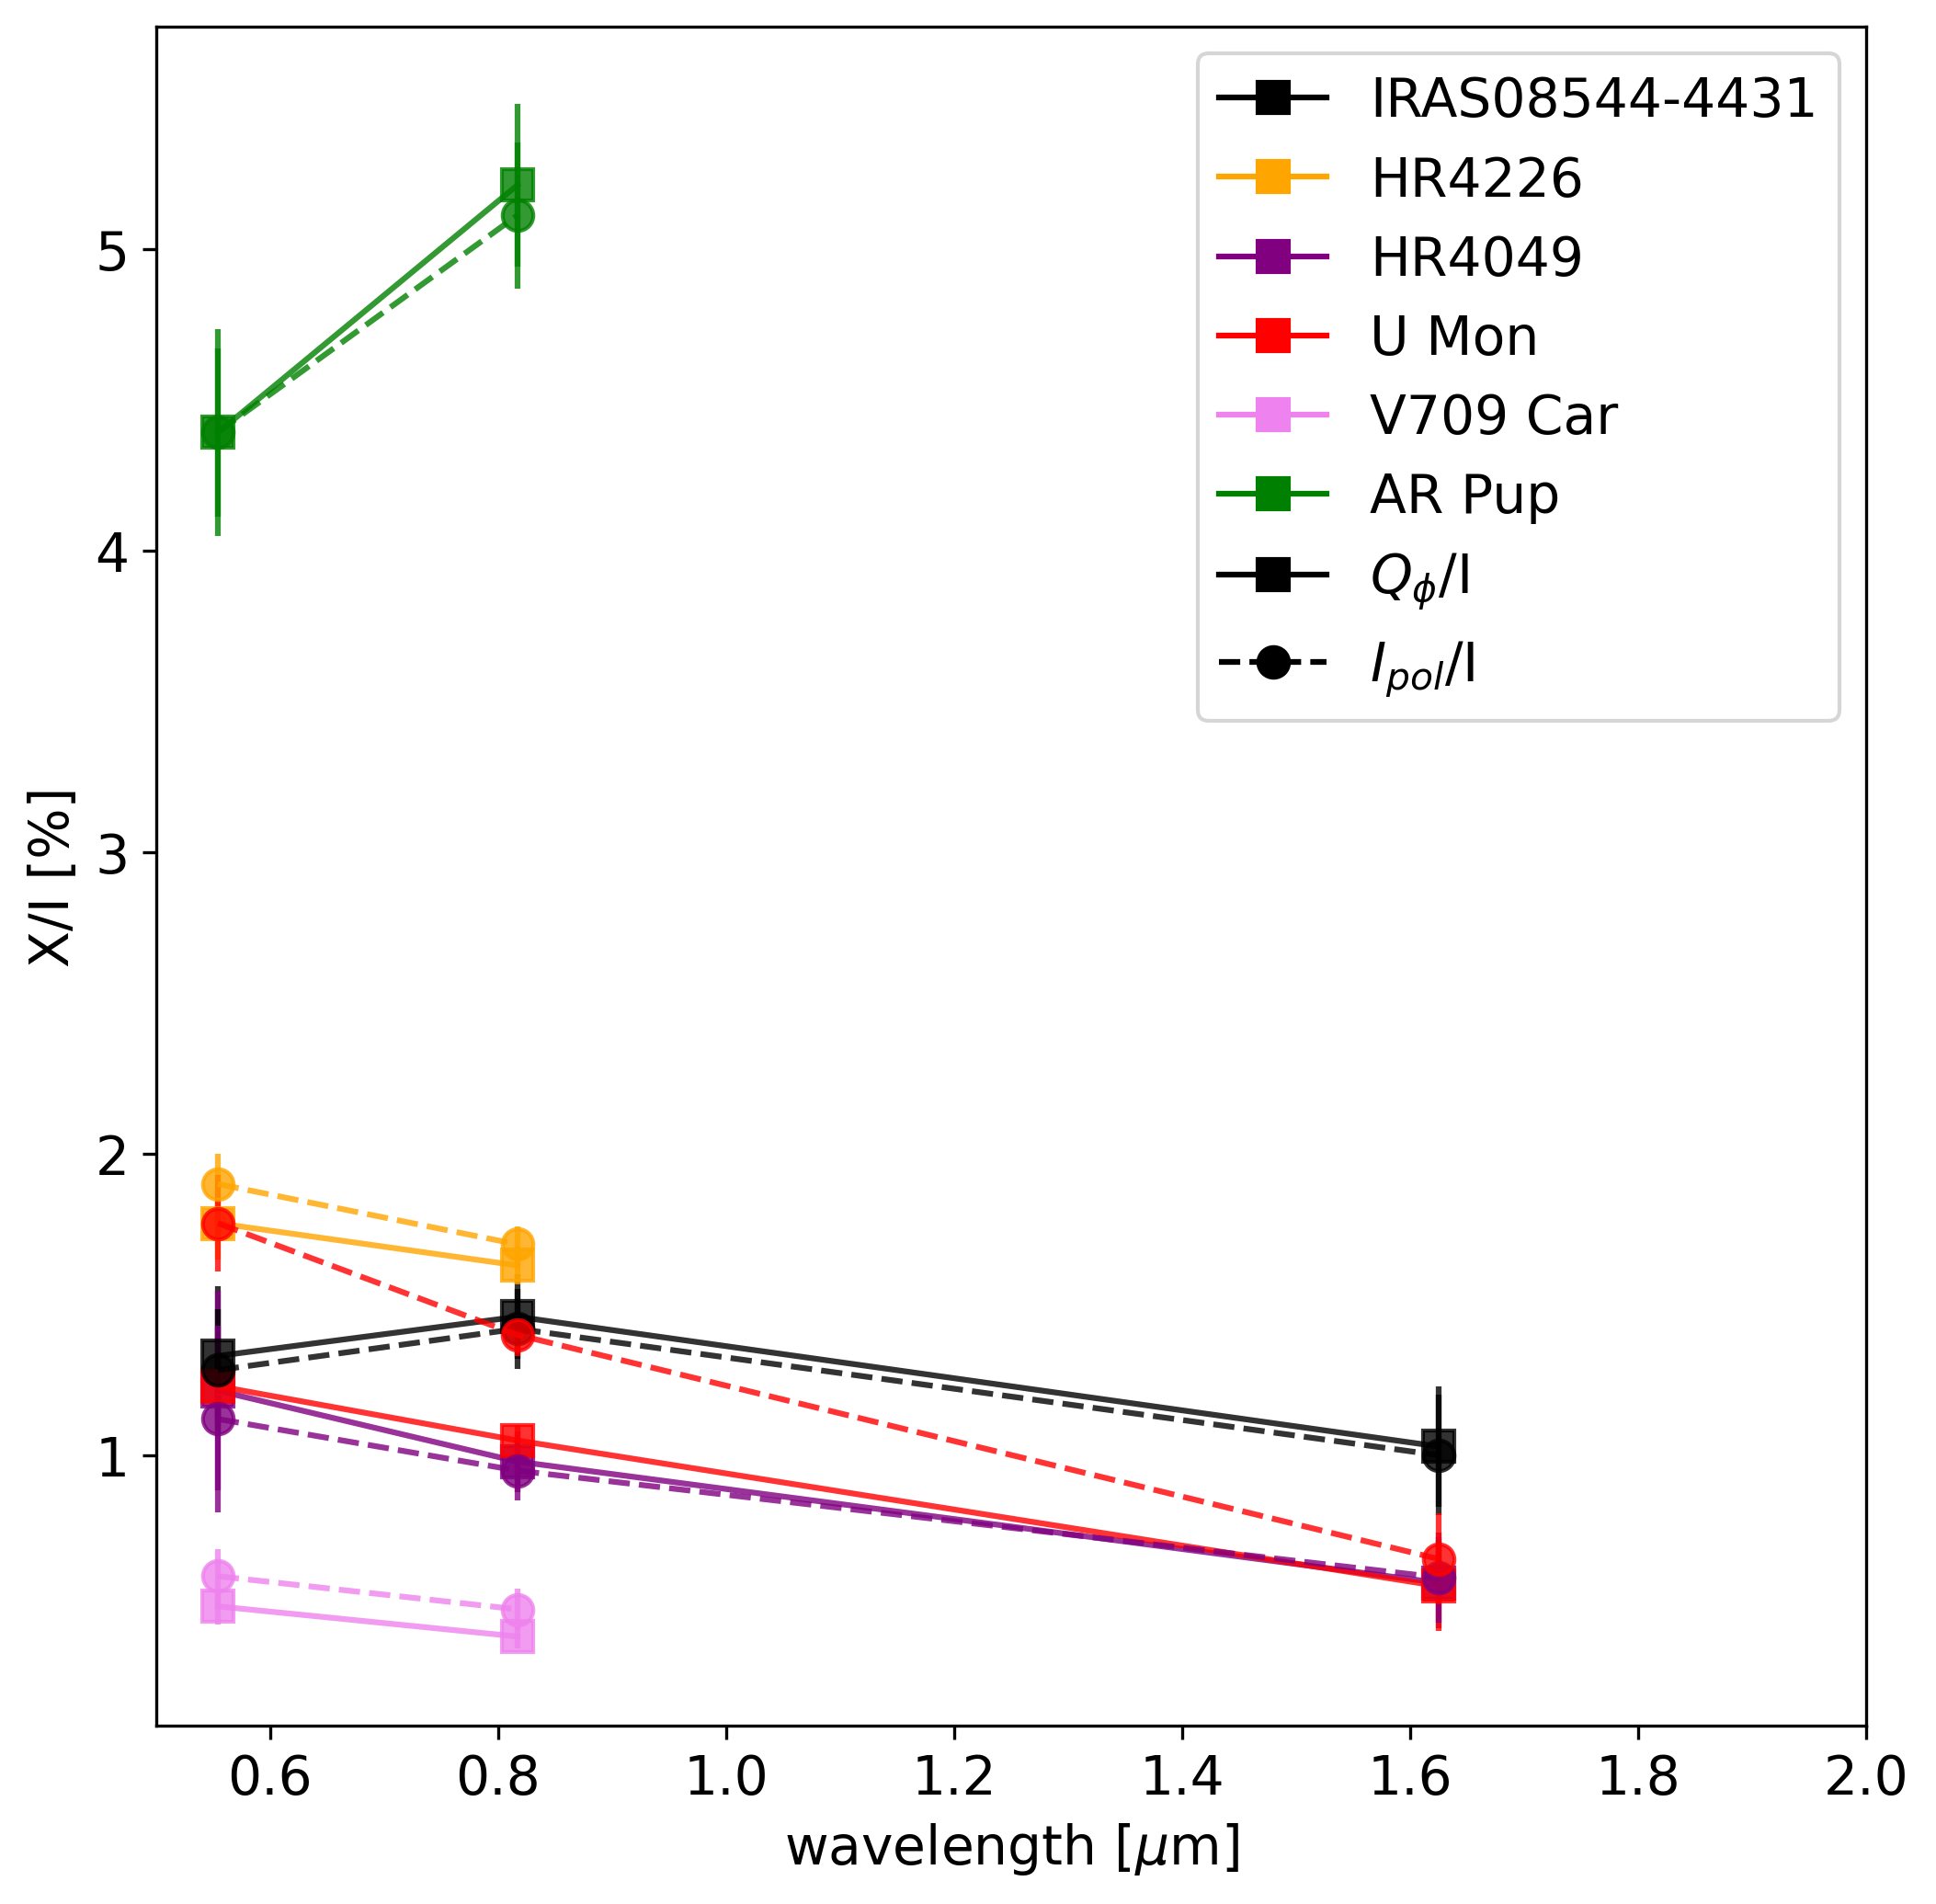
To facilitate a direct comparison between post-AGB circumbinary discs and well-characterized PPDs, we refer to the results of Ma2024A&A...683A..18M, who conducted a precise quantitative polarimetric analysis of T Tauri and Herbig stars. Their study accounted for the same instrumental effects as ours, ensuring consistency in the assessment of disc-polarized brightness (see Section 3.2). In Fig. 9, we present the polarized brightness and polarimetric colour of post-AGB systems from this study, alongside post-AGB binary IRAS 08544-4431 Andrych2024IRAS08 and a sample of T Tauri and Herbig stars. Despite the smaller angular sizes of post-AGB discs, they exhibit significant polarimetric brightness at optical and near-IR wavelengths, often exceeding 1% of the system’s total intensity. This places post-AGB discs among the brightest PPDs in terms of relative polarized flux.
While PPDs around YSOs typically display grey to red polarimetric colours, post-AGB discs show slightly blue to grey. However, our observations reveal comparable wavelength-dependent polarimetric behaviour between post-AGB circumbinary discs and certain PPDs, such as those surrounding T Tauri stars like TW Hya, PDS 70, and PDS 66 Ma2024A&A...683A..18M. This resemblance suggests that similar dust-scattering processes play in both environments, even though the dust in post-AGB systems has never undergone the icy (10 K) conditions of a molecular cloud, potentially leading to fundamentally different dust properties.
The complex morphologies observed in some post-AGB circumbinary discs, including arcs, cavities, and flared disc surfaces (Ertel2019AJ....157..110E; Andrych2023MNRAS.524.4168A; Andrych2024IRAS08, this study; see also), resemble those commonly found in protoplanetary discs Benisty2022arXiv220309991B. These structural similarities, along with their shared polarimetric properties, suggest post-AGB circumbinary discs as valuable analogues for studying disc evolution across stellar evolutionary stages. However, the greater distances towards post-AGB binaries limit the achievable spatial resolution.
5.2.2 Parallels with circumstellar environments around AGBs
Polarimetric studies of AGB and post-AGB systems provide crucial insights into the evolution of circumstellar dust and the role of binarity in shaping these environments. A recent SPHERE/ZIMPOL study by Montarges2023A&A...671A..96M, which examined 14 single AGB stars, revealed that their dusty circumstellar environments are clumpy, with isolated dust features. The observed maximum degree of polarization does not exceed 0.4 and decreases with wavelength, suggesting the presence of small (0.01–0.1 m) or possibly intermediate-sized (0.01–1 m) grains.
Our study finds that post-AGB circumbinary discs exhibit higher maximum degree of resolved polarisation (0.7 in the -band and 0.55 in the -band) compared to single AGB stars. Additionally, these discs show nearly constant or slightly decreasing polarized brightness with wavelength, in contrast to the steep decline seen in single AGB stars. These differences suggest that post-AGB circumbinary discs host larger or more porous dust aggregates, likely due to the different thermal structure of the gas that condenses into dust grains. Unlike in single AGB stars, dust growth processes in post-AGB binary systems are influenced by binary interactions, which play a key role in shaping disc formation.
The presence of a companion during the AGB phase can also lead to disc formation, as observed in the highly inclined AGB binary system L2 Pup Kervella2015EAS....71..211K. L2 Pup hosts a dusty disc with a maximum degree of polarization of 0.46 in the -band and 0.61 in the -band. We note that disc configuration of L2 Pup is remarkably similar to that of post-AGB binary AR Pup in this study, with both targets displaying extremely flared disc surfaces. However, AR Pup shows a maximum degree of polarization that decreases with wavelength, whereas L2 Pup exhibits the opposite trend, increasing with wavelength. This contrast may reflect differences between AGB and post-AGB discs in dust properties (such as size and porosity of dust grains) or disc characteristics (such as optical depth).
Similarities between binary AGB and post-AGB systems emphasize a key open question: how quickly can a stable circumbinary disc be formed in evolved binary systems? Understanding the transition from an AGB wind-driven environment to a structured post-AGB disc is critical for constraining disc formation timescales and the role of binary interactions. A broader, systematic study of circumstellar environments across AGB, post-AGB, and planetary nebulae evolutionary stages is essential to address these questions. By probing dust formation, processing, and the influence of characteristics of the host star (such as stellar parameters and binarity), such research will provide a more complete picture of the life cycle of circumstellar discs and their role in late stellar evolution.
5.2.3 Investigating targets whose post-AGB nature is unclear
As noted in Sections 4.7.4 and 4.7.5, the two objects HR 4226 and V709 Car are unlikely to be post-AGB candidates. In this subsection, we investigate the two unusual candidates in detail.
HR 4226 was initially classified as a post-AGB star based on its SED, which exhibits a near-IR excess. SED fitting yielded an effective temperature of 4275 K Hillen2017, falling within the typical range for post-AGB systems (Kamath2014MNRAS.439.2211K; Kamath2015MNRAS.454.1468K, K). Although near-IR interferometric observations showed only over-resolved circumbinary material Kluska2019A&A...631A.108K, geometric modelling of mid-IR interferometric data revealed a resolved ring-like structure Hillen2017. Our polarimetric imaging reveals a well-defined disc structure with a high degree of azimuthally polarized brightness (>1.5%; see Table 4 and Section 4.7.4). This level of azimuthally polarized signal is consistent with single scattering off circumstellar dust and suggests an optically thick disc, similar to those found around confirmed post-AGB binaries. However, upon closer examination, we found significant deviations from the expected post-AGB evolutionary characteristics. To begin with, its exceptionally low radial velocity amplitude (km/s) and mass function suggest a very low-mass companion (Maas2003PhDT.......265M, Jupiter masses, assuming a 0.6 M primary;). This is significantly lower than the typical companion masses observed in post-AGB binary systems, which generally peak around 1 M with a standard deviation of 0.62 M Oomen2018. While the HR 4226 period of 572 days Maas2003PhDT.......265M could, in principle, be associated with Mira-like pulsations, its radial velocity amplitude is significantly weaker than that of classical Mira variables (Nowotny2010A&A...514A..35N, 10 km/s;), suggesting that the observed variability is unlikely to be associated with Mira-like stellar pulsations. Additionally, Kiss2007MNRAS.375.1338K conducted a photometric analysis, revealing that the -band light curves exhibit considerable scatter, with two distinct minima occurring approximately 260 days apart. Due to the atypical orbital parameters, uncertain effective temperature, and lack of detailed spectroscopic analysis of HR 4226, it remains unclear whether the primary star in the binary is truly a post-AGB star or an object at another evolutionary stage. Therefore, we need a comprehensive spectroscopic analysis to accurately determine the stellar atmospheric parameters and elemental abundances, providing a definitive conclusion on the target’s evolutionary nature.
Similar to HR 4226, V709 Car was initially classified as a post-AGB star based on the near-IR excess in its SED. However, its effective temperature, derived from SED fitting, is lower than typical value for post-AGB system (Hillen2017; Kluska2022, K,). Moreover, spectroscopic analysis using Spitzer survey indicates a lack of crystalline dust features in the circumstellar environment of V709 Car Gielen2011A&A...533A..99G, which is an unusual composition for post-AGB discs. The radial velocity curve of V709 Car indicates an orbital period of days, but it is affected by significant scatter, which limits further analysis Maas2003PhDT.......265M. Further near-IR interferometric study of the target reveals a high circumstellar temperature ( K), indicating that the observed emission is not thermal radiation from dust Kluska2019A&A...631A.108K. Geometrical modelling of mid-IR interferometric observations results in a ring with a half-light radius of mas Hillen2017, times larger than the near-IR size, revealing a striking discrepancy in spatial scales. Our polarimetric imaging shows that V709 Car exhibits notably lower resolved polarized brightness and more diffuse polarized emission compared to other targets in our sample (see Section 4.7). However, polarimetric observations alone do not definitively distinguish this target from the rest of the sample. Results of IR interferometric studies, combined with the relatively low effective temperature of the primary star and a lack of crystalline dust features in the circumstellar environment, suggest that V709 Car may still be in the AGB phase. If this is the case, the observed polarimetric brightness and disc morphology of V709 Car may be shaped by ongoing stellar wind-driven mass loss rather than a well-defined, dense disc. However, a definitive conclusion on the nature of V709 Car requires a comprehensive spectroscopic analysis to accurately determine stellar atmospheric parameters and elemental abundances, as well as optical photometry and radial velocity measurements to better constrain its orbital properties.
6 Conclusions
We present a multi-wavelength polarimetric imaging study of five evolved binary systems (AR Pup, HR 4049, HR 4226, U Mon, and V709 Car) using the VLT/SPHERE instrument. Our study aimed to i) assess whether the polarimetric properties and surface morphologies of circumbinary discs are consistent across the post-AGB sample, ii) explore the dust properties inferred from both the intensity and degree of polarization of the scattered light and iii) compare our findings with known observations for AGB and YSO systems. This multiwavelength study of post-AGB binary systems leads to several key conclusions:
-
•
All studied post-AGB systems exhibit high polarimetric disc brightness of more than 1% of the total intensity in optical and bands. For the post-AGB binary AR Pup, we also resolved circumbinary disc in non-polarized scattered light and directly measured the maximum fractional polarization of the scattered light of in the band and in the band.
-
•
The polarimetric colour across the sample tends toward grey or slightly blue.
-
•
The observed high polarimetric brightness, colour, and intensity distribution in post-AGB circumbinary discs align with theoretical models of porous aggregates composed of small monomers as the dominant surface dust composition. However, a definitive determination of dust grain sizes requires detailed radiative transfer modelling, which is beyond the scope of this study.
-
•
We reveal complex resolved disc morphologies for all evolved binary targets in polarized light, including arcs and asymmetries.
-
•
Comparing our results with SPHERE/IRDIS near-IR imaging, we find that U Mon exhibits a larger disc size in the near-IR compared to the optical, similar to IRAS,08544-4431 Andrych2024IRAS08. In contrast, HR 4049 maintains a consistent disc size across wavelengths. These variations, along with the diverse resolved substructures in post-AGB discs, indicate a range of disc geometries, orientations, and potentially different dust compositions within our sample.
-
•
The resolved size of the polarimetric emission for one system in our sample (V709 Car) appears significantly larger in the -band compared to the -band, potentially resulting from self-shadowing effects due to higher dust absorption at shorter wavelengths.
-
•
Post-AGB discs show higher degree of polarization compared to single AGB stars, suggesting the presence of larger or more porous dust aggregates likely due to dust growth in dense, long-lived discs. However, binary AGB stars, such as L2 Pup, also show dusty discs remarkably similar to those observed around post-AGB binaries.
-
•
Our findings further support the similarities between post-AGB circumbinary discs and PPDs around YSOs, including complex disc morphologies, high polarimetric brightness, comparable wavelength dependence of polarized emission, and similar dust sizes and compositions.
-
•
Combining our findings with existing literature studies, we question the classification of two systems in our sample, HR 4226 and V709 Car, as post-AGB binaries. Our polarimetric observations alone are insufficient to confirm their evolutionary stage, highlighting the need for detailed spectroscopic analysis to accurately determine their stellar atmospheric parameters and elemental abundances.
A comprehensive approach that integrates multi-wavelength and multi-technique observations with advanced radiative-transfer modelling will provide deeper insights into disc dynamics and evolution. This will further clarify the influence of stellar parameters and binarity in shaping the dusty circumstellar environment, potentially facilitating planet formation in evolved systems. Ultimately, this approach will enhance our understanding of disc evolution across the Hertzsprung-Russell diagram.
DK and KA acknowledge the support of the Australian Research Council (ARC) Discovery Early Career Research Award (DECRA) grant (DE190100813). KA and DK, HVW acknowledge the support from the Australian Research Council Discovery Project DP240101150. This study is based on observations collected at the European Southern Observatory under ESO programmes 101.D-0752(A), 0102.D-0696(A), and 0101.D-0807(B). This work has made use of the High Contrast Data Centre, jointly operated by OSUG/IPAG (Grenoble), PYTHEAS/LAM/CeSAM (Marseille), OCA/Lagrange (Nice), Observatoire de Paris/LESIA (Paris), and Observatoire de Lyon/CRAL, and supported by a grant from Labex OSUG@2020 (Investissements d’avenir – ANR10 LABX56).
Data Availability Statement
The data underlying this article are stored online in the ESO Science Archive Facility at http://archive.eso.org, and can be accessed by program IDs. \printendnotes
Appendix A Telescope correction
Appendix B Data reduction results for all targets
Appendix C Aperture polarimetry of fractional polarization
In Fig. 16 we present total fractional polarization () as a function of distance from the central binary. The total fractional polarization was measured using circular apertures with radii gradually increasing from 0.004” to 0.11” (0.25” for AR Pup), with a step size of 0.0036” (1 pixel). Further details on the methodology and results are provided in Section4.1.
Appendix D Brightness profiles
In Fig.17, 18, 19, 20, 21, we present three types of brightness profiles in the and bands for each applicable target in our sample: top panels represent the linear profiles along the major and minor axes of the visible ‘ring’ structure, middle panels represent the azimuthal brightness profiles along the ‘ring’ surface, and bottom panels represent the radial profiles of the polarized disc intensity deprojected to a face-on orientation.
The linear brightness profiles were calculated for all 5 sample post-AGB systems. However, we note that for AR Pup we use the estimation of the disc midplane orientation to define the position of major and minor axes (see Section 4.7.1 for details).
The azimuthal brightness profiles were computed using bi-linear interpolation of the intensity from the four nearest pixels along the fitted ellipse in the linearly polarized image (see Section 4.3). These profiles trace variations in azimuthal brightness starting from the eastern end of the major axis and proceeding counterclockwise. We note that we do not calculate azimuthal brightness profiles for AR Pup because it does not show an elliptical ‘ring’ due to the orientation of the system (see Section 4.3 for more details).
The radial brightness profiles reflect variations in the observed radial intensity distribution and are therefore affected by disc orientation. To correct for this, we first reconstructed a ’face-on’ view of the disc based on the estimated inclination of the resolved disc surface for both the and bands before calculating the radial brightness profile (see Section 4.3 for details on the inclination). The deprojected polarized images were then subdivided into annuli, with widths increasing proportionally to , where is the corresponding radius. Finally, to plot the radial brightness profile, we calculated the mean brightness per pixel for these radially tabulated annuli, focusing only on statistically significant regions based on the SNR (see Section 3.2). To estimate the uncertainty, we used the variance of the pixel values in the same annuli of the image. Although this method overestimates the noise if any astrophysical signal is present in the image (which is the case for all targets in our sample, see Section3.2), it still allows us to establish an upper limit. The resulting deprojected polarized images are presented alongside corresponding radial brightness profiles in the bottom row of Fig. 17, 18, 19 for HR 4049, HR 4226 and U Mon respectively. We also plot similar profiles for AR Pup and V709 Car; however, we do not perform the deprojection for these targets (Fig. 20, 21).
Further details on the methodology are provided in Andrych2023MNRAS.524.4168A and each target’s profile are discussed in Section 4.7.
Appendix E Angle of Linear polarization (AoLP)
Appendix F Comparison of AR Pup total intensity images
In Fig.22, we present SPHERE/ZIMPOL total intensity images of AR Pup from this study and Ertel2019AJ....157..110E, both taken in the -band with a consistent orientation (North up, East to the left). These observations, separated by a two-year timespan, are further discussed in Section 4.7.1.