The optimum mix of storage and backup in a highly renewable, highly reliable
European electricity grid
Abstract
We estimate the variability of solar and wind energy generation potential in Europe over a 43 year period between 1980–2022 with the MERRA-2 reanalysis datasets. We compare the estimated supply potential to hourly demand data from 36 European countries to calculate the reliability of a highly renewable electricity grid in Europe. We find that in cost-optimised scenarios with onshore wind, solar and storage, but no natural gas, reliably meeting the last 1% of demand represents 36% of the entire system cost. Including small amounts of dispatchable natural gas drastically reduces the cost of a renewable, highly reliable grid: overall system costs fall by 31% when just 1% of total generation is permitted to come from natural gas. Large renewable overbuild factors (greater than 4 peak demand) are required to meet modern grid reliability standards in all scenarios, and wind, rather than solar, dominates the generation mix.
Europe has some of the most aggressive CO2-reduction targets in the world, with the EU pursuing net zero carbon emissions by 2050 across its 27 member states [1] and several individual countries setting legally binding targets to reach the same milestone [2, 3, 4].
It is expected that most of the decarbonisation of the electricity sector will be achieved using wind and solar energy. To date, wind and solar have been incorporated into the European electricity grid with little effect on reliability, but maintaining modern reliability standards of 99.97% (meaning that demand exceeds supply for fewer than 3 hours per year on average) will be a major challenge for system operators as the share of weather-dependent generation grows [5].
.1 Modelling the European Electricity Grid
While no country-scale or continental-scale grid has ever operated with such high penetrations of wind and solar energy, there have been recent attempts to investigate the feasibility of a 100% renewable grid in Europe. Two prominent 2019 studies reported annual 2050 system costs of €276 billion [8] and €530 billion [9] respectively for a 100% renewable grid. Such studies generally estimate wind and solar generation potential across the European continent using climate reanalysis datasets, and feed this into an integrated power system model to optimise for the minimum-cost system that meets demand given constraints on generator capacity, transmission capacity, generator ramp-time and other factors. These models are computationally expensive and, as a result, are often limited in their temporal scope. The PLEXOS simulation in [9] cycled through one week of weather data per month for a single year,111In the PLEXOS study [9], the authors did attempt to ensure that the year they analysed was the ‘worst’ weather year between 1979–2015 in terms of renewable generation. while the LUT model used in [8] also relied on a single year of weather data and assumed perfect foresight of supply and demand [10].
These steps are necessary to make the simulations tractable, but preclude a detailed study of grid reliability over multi-decadal time periods. Recent work by Ruggles et. al. has found that almost 40 years of weather data are required to ensure a reliable grid in systems without dispatchable backup [11]. Even when dispatchable generation is allowed to supply 5% of all electricity, 15 years of weather data are still required.
Computationally expensive models have other limitations. Previous studies have looked at the effects of carbon-intensity and individual technology costs on the future grid [12, 13], but understanding how these factors combine to affect the overall system cost requires searching a high-dimensional space. For complex models, this can be prohibitively expensive.
In this paper, we give results from a simplified model for the European power sector able to resolve some of these more difficult questions. Inspired by the work of Shaner et. al. [14] and Tong et. al. [15], we use the MERRA-2 reanalysis datasets to estimate solar and onshore-wind generation potential in Europe over a 43-year period from 1980–2022. We model Europe as a single node, averaging supply and demand across the continent and assuming perfect, lossless transmission. We then simulate this idealised grid with hourly resolution from 1980–2022, varying the installed capacities of solar, onshore wind, storage and dispatchable backup as exogenous inputs. With this single-node, four-technology grid model, we can investigate how three parameters—the permitted carbon intensity of the system, the cost of electricity storage, and the grid reliability target—interact to affect the overall system cost. These constraints are highly interdependent, and must be studied together in order to fully capture their impact on the system cost. To estimate the costs of storage and dispatchable backup, we assume lithium-ion batteries, due to their widespread adoption, and natural gas, due to its low capital cost. The model is described in further detail in the Methods section.
.2 Limitations of Our Model
This model allows new questions to be answered, but it has limitations. Because we do not consider transmission and only model four technologies, the total system costs reported here are not realistic estimates for true European system costs. Specifically, including transmission costs would increase costs while including alternative and existing sources of generation would decrease the overall system cost.
Furthermore, while the model uses 43 years of supply data, a lack of data availability means that we only include electricity demand data for the year 2022. The consequences of this are discussed in detail in the Supplementary Information, including an analysis of potential correlations between renewable-energy generation and electricity demand that are not captured by our analysis.
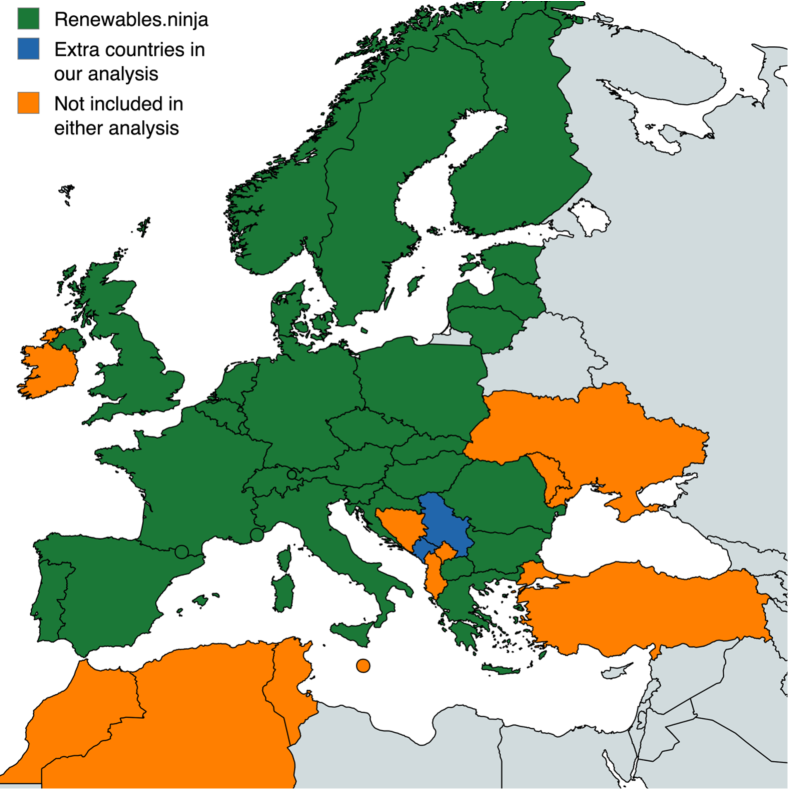
Finally, there is an extensive discussion in the literature surrounding the validity of reanalysis datasets like MERRA-2 for renewable generation studies [6, 7, 16, 17]. Staffell and Pfenninger found discrepancies between wind and solar generation estimates from MERRA-2 and real-world generation data for European countries [6, 7]. To validate the conclusions of this paper, we have performed our analysis using both uncorrected MERRA-2 data as well as renormalised datasets for wind and solar published by Staffell and Pfenninger on the renewables.ninja platform [6, 7]. The countries covered in our original analysis and the countries covered in our validation analysis with the renewables.ninja dataset are shown in Fig. 1. Full details of the differences between the datasets are included in Appendix A, and a direct comparison of the results between the two datasets is included in the Supplementary Information. The results and conclusions presented in this paper were found to be robust to the choice of dataset used.
I Required Overbuild & Storage to Meet Reliability Targets
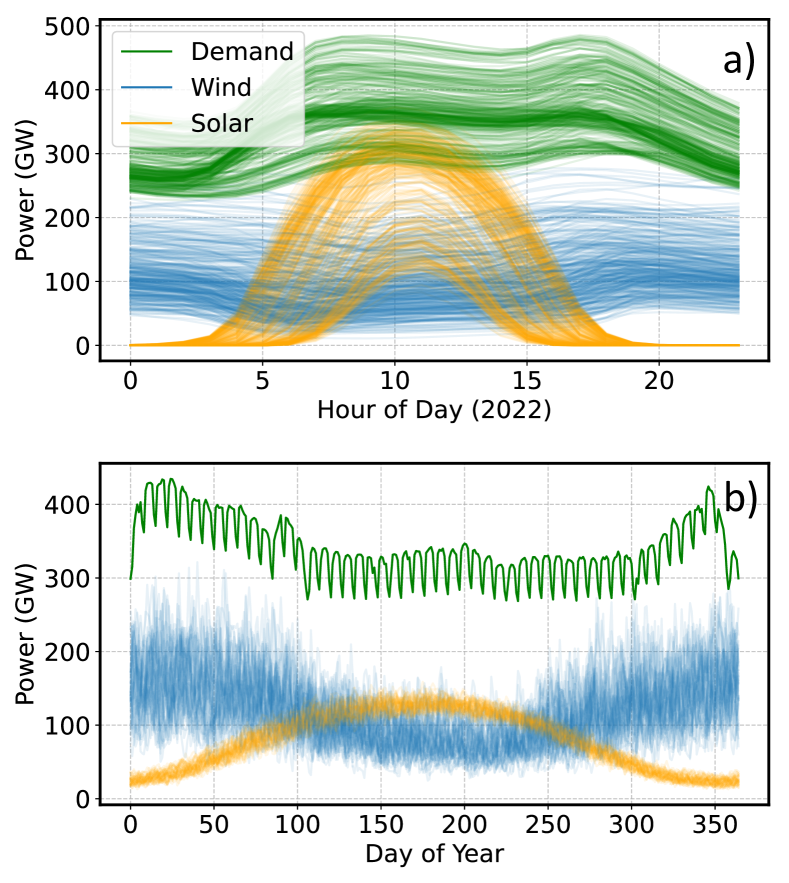
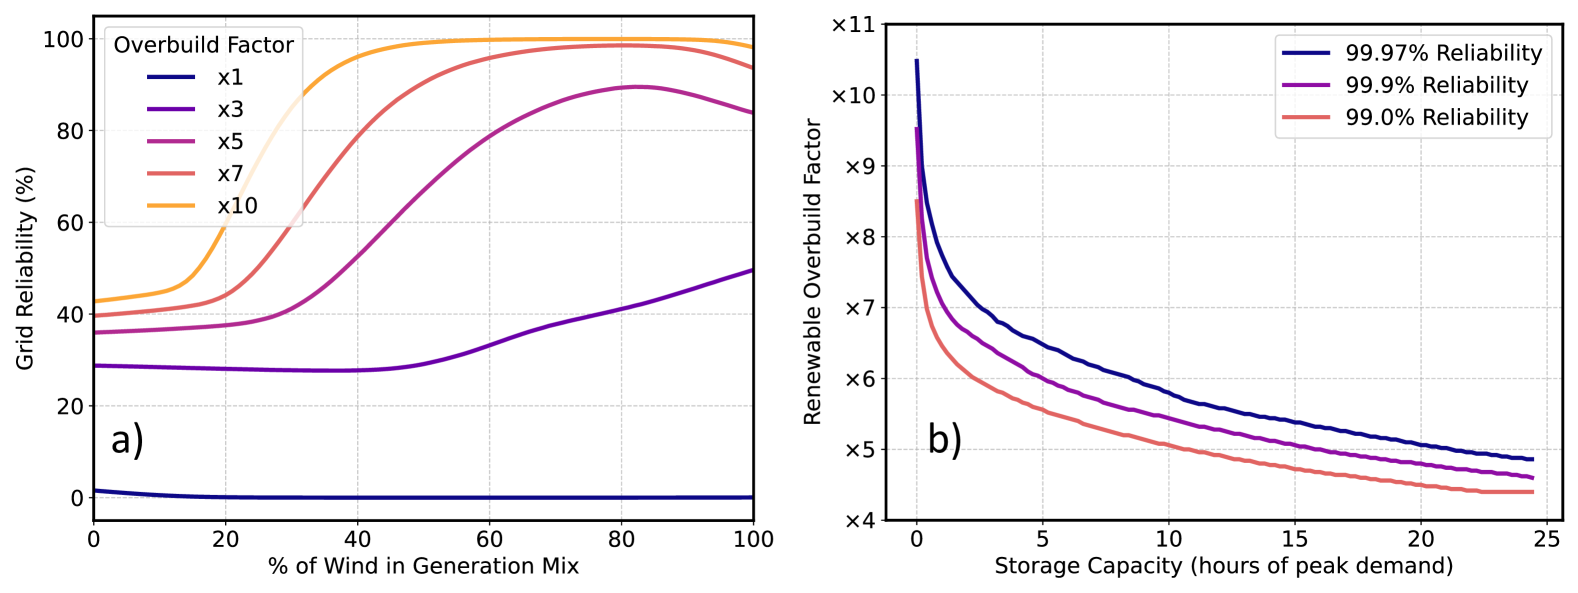
Figure 2 shows the daily and seasonal variation in renewable generation over the 43-year period. Solar output is more predictable than wind output, but experiences much larger variation over the course of a day (Fig. 2a) and over the course of a year (Fig. 2b). Figure 2b also highlights the complementarity between wind and solar when averaged across the European continent, since solar is strongly peaked in summer and wind is peaked in winter. This supports previous studies, which have found complementarity between seasonal wind and solar generation in Europe [18, 19].
Fig. 2 also indicates that, without any overbuild, solar and wind rarely meet demand at any hour of the year. This is unsurprising, because current European capacity factors are between 10%–20% for solar and 10%–30% for onshore wind [18]. In Fig. 3a, we quantify this by plotting the obtained grid reliability over the 43-year period for different renewable overbuild factors as a function of the percentage of wind power in the generation mix. For overbuild factors of 1, meaning that the combined nameplate capacity of wind and solar equals peak demand, demand is almost never met for any mix of wind and solar. Even when the installed wind and solar capacity is 4860 GW—ten times the peak electricity demand—the resulting grid reliability of 99.94% still falls short of modern 99.97% reliability targets. Diminishing returns are also observed at high overbuild factors: increasing the overbuild factor from 7 to 10 of peak demand only boosts grid reliability 1.4% from 98.54% to 99.94%.222It should be noted that the interpretation of the renewable overbuild factors presented here is different from the interpretation in Shaner et. al. [14] and Tong et. al. [15]. In these papers, 1 overbuild is defined as ‘average renewable generation = average demand’, whereas in our analysis 1 overbuild is defined as ‘installed renewable capacity = peak demand’, which we believe is a more useful metric in helping to size the system.
Adding energy storage into the mix, operated according to the rules specified in the Methods section, rapidly reduces the required overbuild factors to reach target levels of grid reliability. Fig. 3b plots the renewable overbuild factor required to meet different reliability targets as a function of the storage capacity in the system. For a 99.97% reliability target, 1458 GWh of storage (equivalent to 3 hours at peak demand) is sufficient to reduce the required overbuild factor from 10.6 to 7. However, once storage capacity extends beyond a few hours of peak demand, it has less of an effect on the required overbuild factor. A full 24 hours of storage (11,664 GWh) only reduces the required overbuild factor for 99.97% reliability to 5.
Installed battery storage capacity in Europe currently sits at about 17.2 GWh [20], which corresponds to two minutes of peak demand. However, this number has doubled every year since 2020, and significant additional storage capacity is planned. Our results suggest that the first 1000 GWh of storage yield the greatest benefits to the system, with diminishing returns after this. Interestingly, pumped hydropower storage already provides 2000 GWh in Europe—although 38% of this is located in Norway alone and a further 17% is in Switzerland [21]. Geopolitical issues notwithstanding, the large-scale storage provided by pumped hydropower will be a crucial component in a future, highly renewable European electricity grid.
We also observe in the high (99.9%) reliability scenarios that reliability issues are generally caused by a small number of extreme events: in the 99.97% reliable case with 24 hours of energy storage, only 3 years out of 43 see any outages at all. This highlights the need for multi-decadal analyses when considering the reliability of highly-renewable electricity grids.
| Overnight Capital Cost ($/kW) | O&M Costs ($/kW-year) | Lifetime (years) | |
|---|---|---|---|
| Solar | 790 [22] | 10 [23] | 25 [22] |
| Wind | 1540 [22] | 40 [23] | 25 [22] |
| Storage | 200 ($/kWh) [24] | 10 ($/kWh-year) [24] | 15 [24] |
| Natural Gas | 1000 [22] | 20 [25] | 30 [26] |
II Cost-optimised scenarios
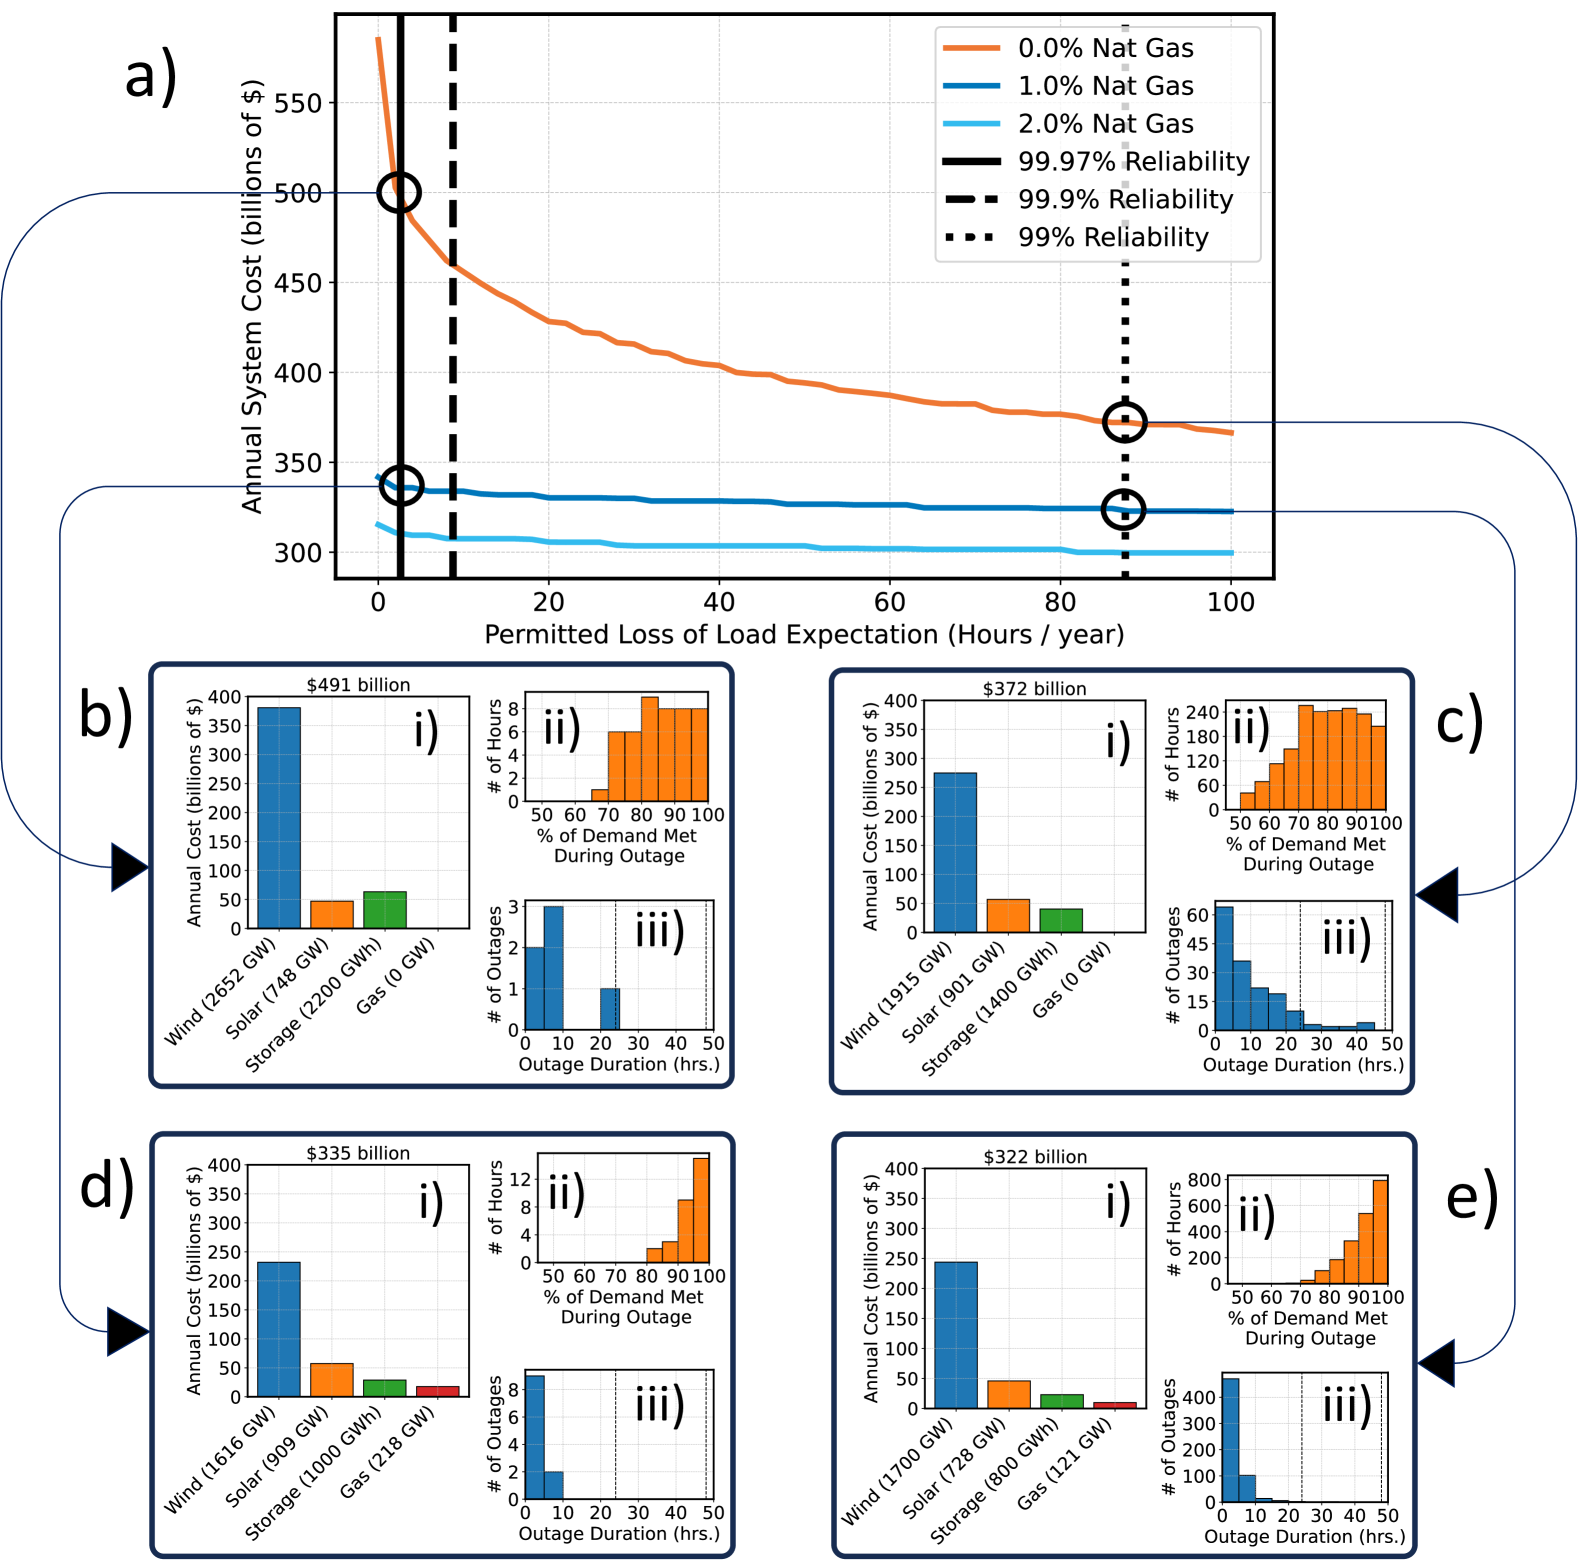
Figure 3 makes clear that some form of dispatchable generation will likely be needed to avoid prohibitively high renewable overbuild factors in a wind/solar dominated grid. In this section, we add natural gas into the simulations and find the cost-optimised mix for solar, wind, gas and storage under different constraints on carbon intensity, grid reliability, and storage cost.
Previous studies examining the interplay of storage and dispatchable backup in Europe [27] and the United States [28] only dispatched backup generation when storage levels fell to zero. However, it is plausible that deploying dispatchable backup before the storage levels reach zero could improve grid reliability or reduce the backup capacity required. To allow for this possibility, we adopt a threshold model for the use of natural gas backup (described in the Methods section), wherein natural gas is dispatched once storage levels drop below a pre-specified threshold.
For a given grid configuration, the simulation returns the average grid reliability over the 43-year period and the percentage of electricity that was produced by natural gas.
We combine this with a cost model for the system (see Table 1 and the Methods section), and find the minimum-cost blend given constraints on grid reliability and natural-gas usage (a proxy for carbon intensity if not paired with carbon capture and storage). We do not include transmission in our cost estimates, since we do not model transmission, but achieving the perfect levels of interconnectivity assumed here would require major upgrades to the European transmission grid.
II.1 System costs vs. grid reliability
Figure 4 shows how the annual system cost varies as a function of the reliability target for 3 different constraints on natural gas usage, with the different colours in Fig. 4a representing different levels of permitted natural gas generation. Figs. 4b–e contain further details about the cost-optimised results for the four circled cases in 4a.
The red line in Figure 4a indicates that, in a European energy system containing only wind, solar and storage, the cost difference between a 99% reliable grid and a 100% reliable grid is about $200 billion annually—or 36% of the entire system cost. As soon as natural gas backup is added into the mix, not only are major cost savings achieved, but the cost savings associated with relaxed grid reliability targets are also reduced. If 1% of total electricity generation is permitted to come from natural gas, then the optimal cost of a 99.97% reliable grid falls from $491 billion annually to $335 billion annually. Furthermore, with 1% of electricity from natural gas, this 99.97% reliable grid can be achieved at relatively little additional cost compared with a 99% reliable grid (just $13 billion extra per year). These conclusions are consistent with the results in [12], which found that the costs of decarbonising the power sector in the absence of firm resources grow rapidly for the last few percent of generation.
From the cost breakdowns in Figure 4di and Figure 4ei, it is clear that the $13 billion cost of increasing the reliability from 99% to 99.97% is the result of a doubling of natural gas capacity (not usage)—from 121 GW to 218 GW—while the rest of the infrastructure required in the cost-optimised case remains largely the same. When natural gas is allowed into the system, the installed natural gas capacity becomes the primary lever for increasing grid reliability.
The other difference between Figure 4di and Figure 4ei is an increase in the optimum threshold level determined by the simulation—from 0% to 5%. To reach very high reliability levels, the backup capacity must start being deployed before the storage levels fall to zero. We would expect the optimum threshold level to rise further under stricter reliability targets or weaker carbon constraints.
It is also interesting to note that wind significantly dominates the overall cost in all scenarios, and that all scenarios rely on large renewable overbuild factors (7 for Fig. 4b, 5.8 for Fig. 4c, 5.2 for Fig. 4d and 5 for Fig. 4e, defined as nameplate capacity over peak demand), even with storage and natural gas backup in the system. At the end of 2023, total installed wind capacity in Europe was 272 GW, with annual additions of 20 GW in 2022 and 18 GW in 2023 [29, 30]. At a build-rate of 20 GW per year, total installed capacity would be 812 GW in 2050, which is at least a factor of two lower than the wind capacity required to achieve a reliable grid in all our scenarios.
European installed solar capacity in Europe in 2023 was similar (263 GW), but annual additions in 2023 were much higher than for wind at 56 GW [31]. At this build-rate, there would easily be enough solar capacity to cover all of our scenarios in Figs. 4 and 5. This highlights a fundamental tension in the deployment of renewable energy in Europe: solar projects are more profitable than wind at an individual level (hence the rapid roll-out), but the overall system costs are reduced when wind is prioritised.
Our results also show that the addition of natural gas into the mix affects the nature of the system outages. Comparing like-reliability cases (4b with 4d and 4c with 4e), it is clear that for cases in which 1% of electricity is allowed to come from natural gas, the typical duration of an outage is shorter and the percentage of demand met during each outage is higher. Indeed, it is possible that many of the outages in which greater than 90% of demand is met could be effectively managed in the future with suitable demand-response measures.
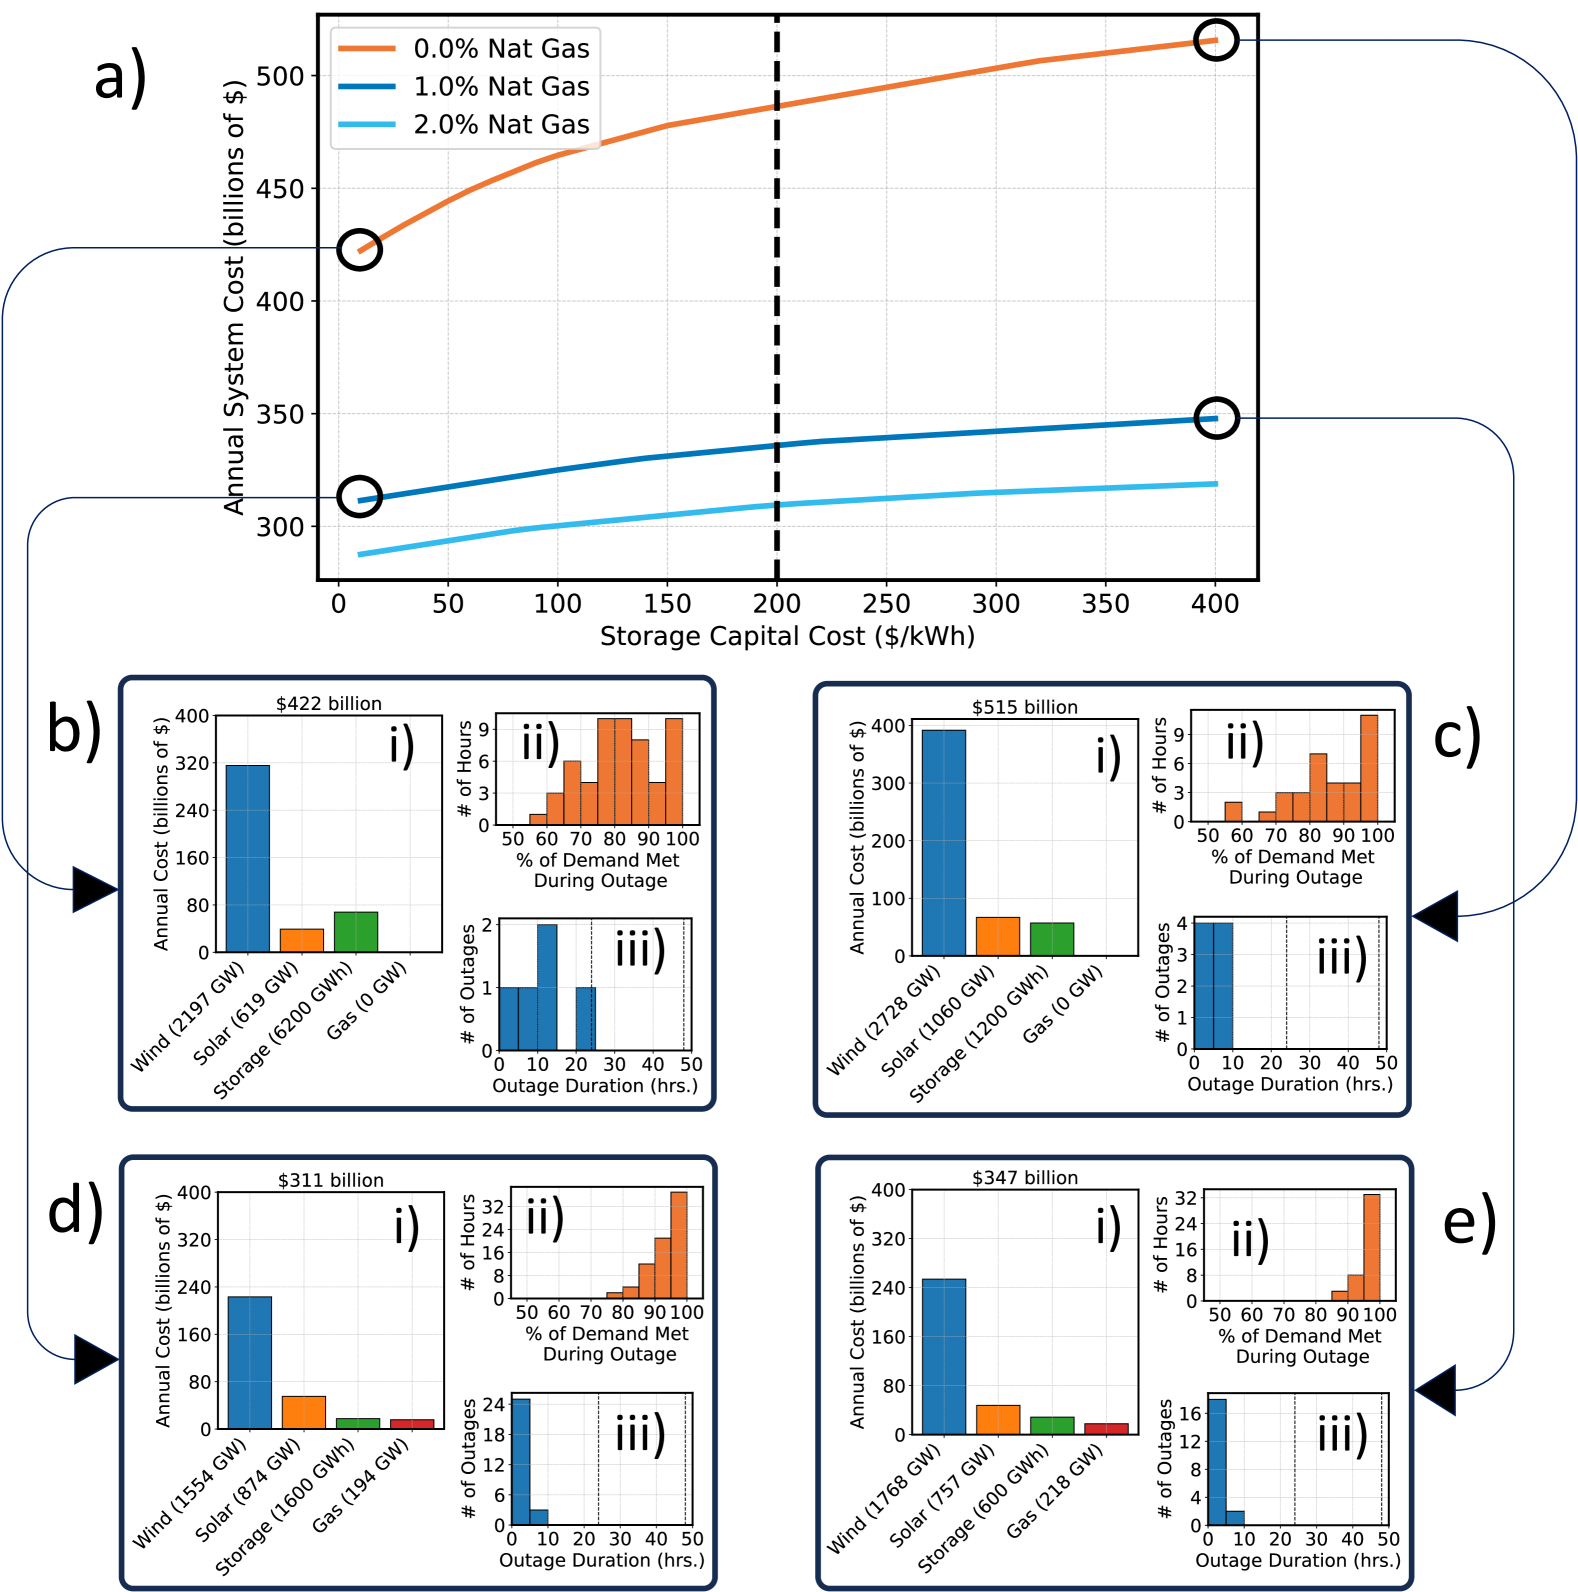
II.2 System costs vs. storage capital costs
Figure 5 shows instead how the optimised system cost for a 99.97% reliable grid varies as a function of the storage capital cost. In the results shown in Fig. 4, we assumed $200 per kWh(following [24]), but there is a large uncertainty in this estimate for 2050 battery storage costs. We explore here how the total system cost is affected by the value chosen for the storage capital cost. Again, we include details for four specific example cases in Figs. 5b-e.
These results show that the cost reductions arising from the inclusion of natural gas as a firm and flexible backup generator significantly outweigh the cost reductions from any decrease in storage cost. For a 0% natural gas grid, reducing the capital cost of storage from $400 per kWh down to $10 per kWh results in annual system cost savings of $93 billion ($515 billion to $422 billion). Allowing 1% of electricity to come from natural gas leads to annual system cost savings of $168 billion ($515 billion to $347 billion), even when storage costs are kept fixed at $400 per kWh. Indeed the cost savings that result from a further 1% increase in allowed natural gas generation are comparable to the cost savings from reducing the storage capital costs from $400 per kWh to $10 /kWh again.
The overall system costs become less sensitive to storage capital costs when natural gas is allowed in the system. Without gas, increasing storage capital costs from $10 per kWh to $400 per kWh increases system costs by 22%, compared to a 12% increase with 1% gas in the system.
It is worth noting that significant storage capacity is still included in the cost-optimised scenario at $400 per kWh, even when natural gas backup is permitted. This suggests that some storage is crucial to a low-cost system and supports the conclusions of [27], which found that adding small amounts of storage to the grid dramatically reduces the energy that must be covered by dispatchable backup resources.
The patterns of outages under varying storage costs are similar to those seen in Fig. 4. For cases 5d and 5e with natural gas permitted, there are no outages over the entire 43-year period in which less than 70% of demand is met. Without natural gas, however, cases 5b and 5c show that hours where less than 70% of demand is met do occur. Furthermore, Fig. 5biii shows one outage in which supply falls short of demand for over 24 hours continuously. When natural gas is added to the system, no outage lasts longer than 10 hours.
Counter-intuitively, in cases with equal natural gas constraints (5b/5c and 5d/5e), reducing the cost of storage causes the intensity of outages to worsen. The case shown in 5c (high storage cost) has both a higher proportion of demand met during outages and fewer long-duration outages relative to 5b (low storage cost). This is because more wind and solar capacity is deployed in the high-storage-cost case to compensate for the reduced storage capacity. When storage levels fall to zero and an outage occurs, the greater wind/solar in the high-storage-cost case means that a greater proportion of demand can be met.
III Conclusions
Using a simplified model, we have explored the trade-offs required to achieve a highly reliable, low-carbon electricity grid in Europe. Our findings indicate that a reliable renewables-dominated European grid will require high levels of overbuild, with installed peak generating capacity greater than four times the peak demand. Even so, we find that cost-minimised systems require both storage and dispatchable backup generation to achieve reliability targets. A large quantity of one cannot fully compensate for the complete absence of the other without incurring extreme penalties in system costs.
While backup generation could be provided by a variety of technologies, natural gas is likely to be the preferred choice in the short-to-medium term due to its low capital cost. Our results show that natural gas backup can yield large (30%) reductions in the system cost even at extremely low utilisation rates (producing just 1–2% of all electricity).
Our study suggests a number of important policy findings. First, grid optimisation studies that force a zero-emissions target are likely to produce conclusions in terms of technology mix, cost, and feasibility that deviate significantly from the true social optimum, as disallowing very small emissions has a major impact on cost and social welfare. As such, finding ways to preserve some legacy generators as backup capacity may be valuable if a renewables-dominated grid is to be pursued.
Second, high-storage scenarios may not be the right approach to coping with renewable variability. Not only were high-storage scenarios expensive, they also resulted in longer outage durations and lower fractions of load being served during outage conditions (e.g., through rolling blackouts). In contrast, scenarios with lower storage capacity and thus greater reliance on excess and/or backup generation give significantly better outage performance. The corollary is that that a simple grid-reliability factor is not sufficient for optimising the technology mix. A more appropriate approach might be to consider the cost of unserved load, perhaps increasing that cost with outage duration.
Third, we find that wind substantially dominates all cost-optimised scenarios that we analysed, with the grid needing approximately twice the amount of wind capacity relative to solar capacity. This has important near-term implications for grid planning in Europe, given that solar generation is currently being installed at a much faster rate.
Finally, it is important to note that the cost estimates presented in this study are illustrative. While they provide insight into cost differentials across different technology scenarios, they do not represent total system costs. A comprehensive estimate would need to account for sunk infrastructure costs, transmission expansion, and a broader range of generation technologies. Technology-rich studies, albeit with shorter temporal coverage and poorer reliability insight, can be found elsewhere in the literature.
IV Methods
The simulations in this analysis rely on hourly time series data for solar generation and wind generation over a 43-year period (1980–2022), which were generated using raw weather data from the MERRA-2 reanalysis dataset [32, 33]. Hourly electricity demand data for the year 2022 was collated from the ENTSO-E Transparency Platform [34].
MERRA-2 contains wind speed and solar surface flux measurements from 1980 onwards, at a temporal resolution of one hour and a spatial resolution of 0.5° 0.625°, which translates to about one grid point every 50 km at European latitudes. For context, a total of 208 MERRA-2 grid points are located within France, while the entirety of the analysis area contains 2044 grid points.
IV.1 Calculating solar generating potential
In order to calculate solar generation at every grid point, we used the incident short-wave radiation at ground level to compute direct illumination (variable name: SWGDN) and the incident radiation at the top of the atmosphere to compute diffusion illumination (variable name: SWTDN) from the Radiation Diagnostics dataset [32]. We use the 2-metre ambient air temperature (variable name: T2M) from the Single-Level Diagnostics dataset [33] to adjust cell efficiency. 333Note that SWGDN from the Radiation Diagnostics dataset differs from the SWGDN values in the Land Surface Forcings dataset [35] as the incident radiation is averaged over the total area of each grid cell in the Radiation Diagnostics dataset, while it is only averaged over the land area in each grid cell in the Land Surface Forcings dataset.
To convert these variables to a solar output, we assumed non-tracking solar panels and followed a similar method to Pfenninger and Staffell [7] and Sandia National Laboratory [36]. First, we calculated the in-plane solar irradiation of the panel
| (1) |
where the total in-plane irradiation is simply the sum of direct, diffuse and ground-reflected contributions. The in-plane component of ground-reflected radiation can be estimated as
| (2) |
where GHI is the Global Horizontal Irradiance (equivalent to SWGDN from MERRA-2), is the albedo, assumed to be a constant 0.3, and is the panel-tilt angle. We assumed that all panels were placed with the optimal tilt of = 0.76 lat + 3.1 [7].
The diffuse fraction of the total GHI was estimated using the logistic model proposed in [37] as
| (3) |
where is the clearness index, which we estimate as the ratio of the ground-level radiation (SWGDN) to extraterrestrial radiation (SWTDN), and DHI is the Diffuse Horizontal Irradiation—the diffuse irradiation measured normal to the Earth’s surface. This was converted to an in-plane value via
| (4) |
We calculated the direct component of the solar radiation using
| (5) |
where is the solar altitude angle and DNI is the Direct Normal Irradiance (the solar irradiance along the direct path of the Sun’s rays).
The in-plane component of the direct radiation, , is then given by
| (6) |
where the angle of incidence, AOI, is the angle between the Sun’s rays and the normal vector to the panel. It is defined as
| (7) |
where is the panel-azimuth angle and is the solar-azimuth angle. We assumed that all panels were south facing with °.
We accounted for the temperature dependence of solar panel efficiency following Huld, [38] assuming crystalline silicon solar cells and a relationship between panel temperature and ambient air temperature of , with ambient air temperature from the MERRA-2 T2M variable.
We assumed a standard efficiency (at = 1000 and = 25 °C) of 21% [39] for all solar panels. The power output of the panel in can then be calculated as
| (8) |
where the relative efficiency is the temperature-dependent effect from [38].
IV.2 Calculating wind generating potential
We calculated the wind power generated over the 43-year period from a typical modern wind turbine placed in each grid cell. We assumed a turbine rotor diameter of 110 m, a hub-height of 100 m, a maximum rated power of 4.1 MW and cut-in and cut-out speeds of 3 m/s and 25 m/s respectively.
The power output of a single wind turbine is given by
| (9) |
where is the density of air, is the area swept out by the wind turbine blades, is the wind speed in metres per second and is the performance coefficient of the turbine—which we assume to be 40% in this analysis [40].
To estimate at the hub height of 100 m, we used the 10-metre wind speeds (variable names V10M and U10M) and the 50-metre wind speeds (V50M and U50M) from the MERRA-2 Single-Level Diagnostics dataset [33]. We used a power law relationship of the form
| (10) |
to extrapolate these wind speeds to the hub height of 100 m [41]. In Eq. 10, and are the wind speeds at heights and , and is a constant that depends on site-specific geography. We estimated the atmospheric density at ground level from the the 2-metre air temperature (variable name T2M) and the surface pressure (variable name PS), and extrapolated to the hub height of 100 m using the barometric equation [42]. We combined Eq. 9 with the constraints on turbine operation (cut-in speed, cut-out speed, and maximum output) to create a piece-wise model for wind output at every grid square:
| (11) |
We used these expressions to obtain a ‘wind power per turbine’ and a ‘solar power per unit area’ at every point on the MERRA-2 grid. We then averaged over all 2044 points in the grid to obtain a Europe-wide ‘wind power per turbine’ and ‘solar power per unit area’ for every hour in the dataset.
IV.3 Estimating electricity demand
The European Network of Transmission System Operators for Electricity (ENTSO-E), which operates the synchronous grid in Europe, requires its members to publish hourly electricity demand data every year, and makes this information publicly available [34]. However, not all countries connected to the synchronous European grid (CESA) are members of ENTSO-E, and the UK, Turkey and the North African states in particular do not publish hourly demand data on the ENTSO-E platform. Data for the UK are available elsewhere [43], but Turkey and the North African states were excluded from our analysis due to data being unavailable. Some countries, such as Ukraine and Albania, use the ENTSO-E platform but do not reliably publish data. We only included in our analysis the 36 countries that provided demand data for more than 8700 hours of the year (out of 8760) in 2022—see Appendix B. The borders of these countries define the locations of the MERRA-2 grid points used to calculate solar and wind generating potential.
We augmented demand data for missing hourly demand values with linear interpolation. To model demand over the full 43-year period of the MERRA-2 dataset, we duplicated the 2022 demand data for each year 1980–2022, as demand data is not available over the full period covered by MERRA-2. For a detailed discussion of this point, and further analysis of the consequences of using a single year of demand data, see the Supplementary Information.
IV.4 Storage & Backup
In order to analyse the effects of adding storage and dispatchable backup to a highly renewable electricity grid, we had to choose technologies to capture these characteristics. For storage, we chose lithium-ion batteries, since this is currently the lowest cost battery technology and has been widely studied in the context of future grid-scale electricity storage [44, 45]. We followed the cost estimates in [24] for a 4-hour Li-ion storage system, and assumed that maintenance covered under the fixed annual O&M costs ensures no degradation of the battery over its life cycle [24]. For simplicity, we have assumed perfect round-trip efficiency and no self-discharge for the batteries. We would not expect any significant changes to our results if these terms were included since, in our threshold-based model, storage inefficiencies would lead to natural gas backup being deployed slightly earlier. This would increase fossil fuel emissions for each scenario slightly, but would likely not affect the system cost or the reliability of the grid.
We chose natural gas as the dispatchable resource in this analysis. Ideally, this dispatchable backup would be provided by a carbon-free source, but no current carbon-free electricity source has the low capital cost and flexibility required to be a suitable low-utilisation backup to a grid with high penetrations of wind and solar. Using natural gas also allows us to investigate the trade-offs between carbon intensity, system cost, and reliability in a future electricity grid.
IV.5 Running the simulation
The simulation works as follows. At the start of each run, we specify five parameters:
-
1.
The renewables overbuild factor
-
2.
The relative proportion of wind and solar in the generation mix
-
3.
The total system storage capacity in GWh
-
4.
The total natural gas capacity capacity in GW
-
5.
A threshold to indicate when natural gas should start being used (expressed as a percentage of the total system storage capacity)
At each hour, we calculate solar and wind generation based on the overbuild factor (where a 1 overbuild factor means the installed capacity for wind and solar equals peak demand) and the respective proportions of wind and solar in the generation mix. If residual load (demand minus renewable generation) is less than zero, then the excess renewable generation is used to replenish the storage up to its maximum value. If residual load is greater than zero and storage levels are greater than the threshold, then storage is called first to help meet demand. If residual load is greater than zero and storage levels are below the threshold, then the natural gas generators are turned on to meet demand and to restore the storage levels back to the threshold.
This threshold condition for dispatchable backup ensures that the model operates without a perfect foresight assumption, since the system operator’s direction is simply to:
1) Never use natural gas unless storage levels are below the threshold.
2) Restore storage levels to the threshold as quickly as possible if they fall below the threshold.
This logic is expressed in a flow diagram in the Supplementary Information.
The simulation cycles through each hour in the 43-year period and returns the total Loss of Load Expectation (LOLE) in hours per year, as well as the percentage of total electricity that was generated by natural gas.
IV.6 System cost calculations
For each set of generation capacity inputs, a total annual system cost is calculated—neglecting transmission costs.
To do this we take the overnight costs from Table 1, and calculate the total investment cost per kW of capacity in the year the construction is assumed to start . We account for the fact that construction happens over a finite period of time , and assume a parabolic spending pattern
| (12) |
The total construction time is assumed to be 2 years for all technologies, is the inflation rate (assumed to be 4%) and is the nominal interest rate (assumed to be 8%).
Then the annual payment (capital recovery factor) per kW of capacity is
| (13) |
where is the real interest rate. This loan repayment in $/kW-year can be added to the fixed O&M costs in $/kW-year and multiplied by the installed capacity to give a total annual cost for each technology. Variable costs are assumed to be negligible, since wind and solar have no fuel costs and natural gas generates less than 2% of all electricity for every scenario considered in this paper.
To calculate total annual system costs, the costs from the individual technologies (solar, wind, storage and natural gas) are summed together.
References
- Commission and for Climate Action [2019] European Commission and Directorate-General for Climate Action. Going climate-neutral by 2050 – A strategic long-term vision for a prosperous, modern, competitive and climate-neutral EU economy. Publications Office, 2019. DOI: 10.2834/02074.
- O’Beirne et al. [2020] Patricia O’Beirne, Francesca Battersby, Amy Mallett, Miriam Aczel, Karen Makuch, Mark Workman, and Richard Heap. The uk net-zero target: Insights into procedural justice for greenhouse gas removal. Environmental Science & Policy, 112:264–274, 2020.
- Nash and Steurer [2021] Sarah Louise Nash and Reinhard Steurer. Climate change acts in scotland, austria, denmark and sweden: The role of discourse and deliberation. Climate Policy, 21(9):1120–1131, 2021.
- BEIS [2017] UK BEIS. The clean growth strategy: leading the way to a low carbon future, 2017. URL https://www.gov.uk/government/publications/clean-growth-strategy. Date Accessed: 2025-03-19.
- ACER [2022] ACER. Security of eu electricity supply in 2021: Report on member states approaches to assess and ensure adequacy, 2022. URL https://acer.europa.eu/sites/default/files/documents/Publications/ACER_Security_of_EU_Electricity_Supply_2021.pdf. Date Accessed: 2025-03-19.
- Staffell and Pfenninger [2016] Iain Staffell and Stefan Pfenninger. Using bias-corrected reanalysis to simulate current and future wind power output. Energy, 114:1224–1239, 2016.
- Pfenninger and Staffell [2016] Stefan Pfenninger and Iain Staffell. Long-term patterns of european pv output using 30 years of validated hourly reanalysis and satellite data. Energy, 114:1251–1265, 2016.
- Child et al. [2019] Michael Child, Claudia Kemfert, Dmitrii Bogdanov, and Christian Breyer. Flexible electricity generation, grid exchange and storage for the transition to a 100% renewable energy system in europe. Renewable energy, 139:80–101, 2019.
- Zappa et al. [2019] William Zappa, Martin Junginger, and Machteld Van Den Broek. Is a 100% renewable european power system feasible by 2050? Applied energy, 233:1027–1050, 2019.
- Bogdanov and Breyer [2016] Dmitrii Bogdanov and Christian Breyer. North-east asian super grid for 100% renewable energy supply: Optimal mix of energy technologies for electricity, gas and heat supply options. Energy Conversion and Management, 112:176–190, 2016.
- Ruggles et al. [2024] Tyler H Ruggles, Edgar Virgüez, Natasha Reich, Jacqueline Dowling, Hannah Bloomfield, Enrico GA Antonini, Steven J Davis, Nathan S Lewis, and Ken Caldeira. Planning reliable wind-and solar-based electricity systems. Advances in Applied Energy, 15:100185, 2024.
- Sepulveda et al. [2018] Nestor A Sepulveda, Jesse D Jenkins, Fernando J De Sisternes, and Richard K Lester. The role of firm low-carbon electricity resources in deep decarbonization of power generation. Joule, 2(11):2403–2420, 2018.
- Schlachtberger et al. [2018] David P Schlachtberger, Tom Brown, Mirko Schäfer, Stefan Schramm, and Martin Greiner. Cost optimal scenarios of a future highly renewable european electricity system: Exploring the influence of weather data, cost parameters and policy constraints. Energy, 163:100–114, 2018.
- Shaner et al. [2018] Matthew R Shaner, Steven J Davis, Nathan S Lewis, and Ken Caldeira. Geophysical constraints on the reliability of solar and wind power in the united states. Energy & Environmental Science, 11(4):914–925, 2018.
- Tong et al. [2021] Dan Tong, David J Farnham, Lei Duan, Qiang Zhang, Nathan S Lewis, Ken Caldeira, and Steven J Davis. Geophysical constraints on the reliability of solar and wind power worldwide. Nature communications, 12(1):6146, 2021.
- Boilley and Wald [2015] Alexandre Boilley and Lucien Wald. Comparison between meteorological re-analyses from era-interim and merra and measurements of daily solar irradiation at surface. Renewable Energy, 75:135–143, 2015.
- Decker et al. [2012] Mark Decker, Michael A Brunke, Zhuo Wang, Koichi Sakaguchi, Xubin Zeng, and Michael G Bosilovich. Evaluation of the reanalysis products from gsfc, ncep, and ecmwf using flux tower observations. Journal of Climate, 25(6):1916–1944, 2012.
- Prol et al. [2024] Javier López Prol, Fernando de Llano Paz, Anxo Calvo-Silvosa, Stefan Pfenninger, and Iain Staffell. Wind-solar technological, spatial and temporal complementarities in europe: A portfolio approach. Energy, 292:130348, 2024.
- Heide et al. [2010] Dominik Heide, Lueder Von Bremen, Martin Greiner, Clemens Hoffmann, Markus Speckmann, and Stefan Bofinger. Seasonal optimal mix of wind and solar power in a future, highly renewable europe. Renewable Energy, 35(11):2483–2489, 2010.
- Europe [2024] SolarPower Europe. European market outlook for battery storage 2024-2028, 2024. URL https://www.solarpowereurope.org/insights/thematic-reports/european-market-outlook-for-battery-storage-2024-2028. Date Accessed: 2025-03-19.
- Agency [2021a] International Energy Agency. Pumped storage hydropower storage capability by countries, 2020-2026, 2021a. URL https://www.iea.org/data-and-statistics/charts/pumped-storage-hydropower-storage-capability-by-countries-2020-2026. Date Accessed: 2025-03-19.
- Agency [2021b] International Energy Agency. Net zero by 2050: A roadmap for the global energy sector, 2021b. URL https://iea.blob.core.windows.net/assets/deebef5d-0c34-4539-9d0c-10b13d840027/NetZeroby2050-ARoadmapfortheGlobalEnergySector_CORR.pdf. Date Accessed: 2025-03-19.
- Agency [2020] International Renewable Energy Agency. Renewable power generation costs in 2020, 2020. URL https://www.irena.org/-/media/Files/IRENA/Agency/Publication/2021/Jun/IRENA_Power_Generation_Costs_2020.pdf. Date Accessed: 2025-03-19.
- Cole and Karmakar [2023] Wesley Cole and Akash Karmakar. Cost projections for utility-scale battery storage: 2023 update. Technical report, National Renewable Energy Laboratory (NREL), Golden, CO (United States), 2023.
- Administration [2024] US Energy Information Administration. Capital cost and performance characteristic estimates for utility scale electric power generating technologies, 2024. URL https://www.eia.gov/analysis/studies/powerplants/capitalcost/pdf/capital_cost_AEO2025.pdf. Date Accessed: 2025-03-19.
- Spath and Mann [2000] Pamela L Spath and Margaret K Mann. Life cycle assessment of a natural gas combined cycle power generation system. Technical report, National Renewable Energy Lab.(NREL), Golden, CO (United States), 2000.
- Rasmussen et al. [2012] Morten Grud Rasmussen, Gorm Bruun Andresen, and Martin Greiner. Storage and balancing synergies in a fully or highly renewable pan-european power system. Energy policy, 51:642–651, 2012.
- Budischak et al. [2013] Cory Budischak, DeAnna Sewell, Heather Thomson, Leon Mach, Dana E Veron, and Willett Kempton. Cost-minimized combinations of wind power, solar power and electrochemical storage, powering the grid up to 99.9% of the time. journal of power sources, 225:60–74, 2013.
- Europe [2023a] Wind Europe. Wind energy in europe: 2023 statistics and the outlook for 2024-2030, 2023a. URL https://windeurope.org/intelligence-platform/product/wind-energy-in-europe-2023-statistics-and-the-outlook-for-2024-2030/. Date Accessed: 2025-03-19.
- Europe [2023b] Wind Europe. Wind energy in europe: 2022 statistics and the outlook for 2023-2027, 2023b. URL https://windeurope.org/intelligence-platform/product/wind-energy-in-europe-2022-statistics-and-the-outlook-for-2023-2027/. Date Accessed: 2025-03-19.
- Europe [2023c] SolarPower Europe. Eu market outlook for solar power 2023-2027, 2023c. URL https://www.solarpowereurope.org/insights/outlooks/eu-market-outlook-for-solar-power-2023-2027/detail. Date Accessed: 2025-03-19.
- Data and DISC) [a] Goddard Earth Sciences Data and Information Services Center (GES DISC). Merra-2 tavg1 2d rad nx: Radiation diagnostics v5.12.4, a. Date Accessed: 2024-10-01. DOI: 10.5067/VJAFPLI1CSIV.
- Data and DISC) [b] Goddard Earth Sciences Data and Information Services Center (GES DISC). Merra-2 tavg1 2d slv nx: Single-level diagnostics v5.12.4, b. Date Accessed: 2024-10-01. DOI: 10.5067/VJAFPLI1CSIV.
- [34] entsoe transparency platform. URL https://transparency.entsoe.eu. Date Accessed: 2025-03-19.
- Data and DISC) [c] Goddard Earth Sciences Data and Information Services Center (GES DISC). Merra-2 tavg1 2d lfo nx: Land surface forcings v5.12.4, c. Date Accessed: 2024-10-01. DOI: 10.5067/L0T5GEG1NYFA.
- Anderson et al. [2023] Kevin S Anderson, Clifford W Hansen, William F Holmgren, Adam R Jensen, Mark A Mikofski, and Anton Driesse. pvlib python: 2023 project update. Journal of Open Source Software, 8(92):5994, 2023.
- Ridley et al. [2010] Barbara Ridley, John Boland, and Philippe Lauret. Modelling of diffuse solar fraction with multiple predictors. Renewable Energy, 35(2):478–483, 2010.
- Huld et al. [2010] Thomas Huld, Ralph Gottschalg, Hans Georg Beyer, and Marko Topič. Mapping the performance of pv modules, effects of module type and data averaging. Solar Energy, 84(2):324–338, 2010.
- Comission [2022] European Comission. Photovoltaics in the european union, 2022. URL https://setis.ec.europa.eu/photovoltaics-european-union_en. Date Accessed: 2025-03-19.
- Ryberg et al. [2019] David Severin Ryberg, Dilara Gulcin Caglayan, Sabrina Schmitt, Jochen Linßen, Detlef Stolten, and Martin Robinius. The future of european onshore wind energy potential: Detailed distribution and simulation of advanced turbine designs. Energy, 182:1222–1238, 2019.
- Heier [2014] Siegfried Heier. Grid integration of wind energy: onshore and offshore conversion systems. John Wiley & Sons, 2014.
- Lente and Ősz [2020] Gábor Lente and Katalin Ősz. Barometric formulas: various derivations and comparisons to environmentally relevant observations. ChemTexts, 6:1–14, 2020.
- [43] Neso historic demand data. URL https://www.neso.energy/data-portal/historic-demand-data. Date Accessed: 2025-03-19.
- Chen et al. [2020] Tianmei Chen, Yi Jin, Hanyu Lv, Antao Yang, Meiyi Liu, Bing Chen, Ying Xie, and Qiang Chen. Applications of lithium-ion batteries in grid-scale energy storage systems. Transactions of Tianjin University, 26(3):208–217, 2020.
- Kebede et al. [2022] Abraham Alem Kebede, Theodoros Kalogiannis, Joeri Van Mierlo, and Maitane Berecibar. A comprehensive review of stationary energy storage devices for large scale renewable energy sources grid integration. Renewable and sustainable energy reviews, 159:112213, 2022.
- Group [2021] World Bank Group. All countries and economies by surface area, 2021. URL https://data.worldbank.org/indicator/AG.SRF.TOTL.K2.
Appendix A Our method vs. renewables.ninja
While reanalysis datasets are routinely used to estimate solar and wind generation in power systems models, there are questions surrounding the extent to which these datasets can be relied upon to accurately predict wind and solar electrical output at a given location. This is the problem discussed by Pfenninger and Staffell in [7] and [6]. Using similar methods to the ones described here in the Methods section, they map weather data onto the locations of existing renewables fleets around Europe to estimate the total renewable output in each European country over time. They then derive national calibration factors by comparing these to the reported national wind/solar output in each country.
We note that biases in the underlying weather data are one of a number of potential causes of this discrepancy between estimated national output and reported national output. Other possible contributions to the discrepancy could be imperfect interpolation of MERRA-2 data (which only represents an average over a wide area) onto specific generation sites, imperfect models for calculating wind and solar output from the underlying weather data, 100% availability factors for wind and solar generation facilities in real life, and sampling effects due to the distribution of generation sites.
To address concerns about biases in the underlying weather data affecting the validity of our conclusions, we have repeated our analysis using a dataset made available by Pfenninger and Staffell on the renewables.ninja site [7, 6]. The dataset contains calibrated, hourly capacity factors for most European countries over a 32-year period between 1985–2016. This includes every country in our dataset apart from Montenegro and Serbia. We performed a weighted average of these national capacity factors (weighted by national installed capacity in 2022 [46]) to arrive at an average European generation figure for each hour.
The major differences between our dataset and the renewables.ninja datset can be summarised as follows:
1) The renewables.ninja dataset applies country-wide calibration factors to the underlying MERRA-2 data.
2) The renewables.ninja dataset uses the 2016 operating fleet to calculate the capacity factors, rather than assuming that the entire fleet consists of modern wind turbines and solar panels as we have done in the paper.
3) When calculating capacity factors for each country, the renewables.ninja dataset uses the locations of the 2016 operating fleet rather than an area-average across the country.
4) When calculating European-average capacity factors for the renewables.ninja dataset, we weight each country by 2022 installed capacity rather than by area (as is done in the main text).
5) The renewbales.ninja dataset runs for 32 years rather than 43 years.
We repeated the entire analysis of the paper using the renewables.ninja dataset and generated equivalent plots to the ones shown in the paper using the new dataset. These plots are shown in the Supplementary Information. While neither dataset is perfect, we find that our results are insensitive to the choice of dataset used. This gives us confidence that the results presented here reflect the characteristics of a highly renewable, interconnected European grid, and not the idiosyncrasies of the underlying weather data.
Appendix B List of Countries Included in the Analysis
-
•
Andorra (microstate)
-
•
Austria
-
•
Belgium
-
•
Bulgaria
-
•
Croatia
-
•
Czech Republic
-
•
Denmark
-
•
Estonia
-
•
Finland
-
•
France
-
•
Germany
-
•
Greece
-
•
Hungary
-
•
Italy
-
•
Latvia
-
•
Liechtenstein (microstate)
-
•
Lithuania
-
•
Luxembourg
-
•
Monaco (microstate)
-
•
Montenegro
-
•
Netherlands
-
•
North Macedonia
-
•
Norway
-
•
Poland
-
•
Portugal
-
•
Romania
-
•
San Marino (microstate)
-
•
Serbia
-
•
Slovakia
-
•
Slovenia
-
•
Spain
-
•
Sweden
-
•
Switzerland
-
•
United Kingdom
-
•
Vatican City (microstate)
NB: microstates have no published demand data on the ENTSO-E platform, but we assume demand data for these countries is included in the reported numbers for surrounding countries (e.g it is assumed that Monaco demand data is included in reported French data).