Understanding Visual Saliency of Outlier Items in Product Search
Abstract.
In two-sided marketplaces, items compete for user attention, which translates to revenue for suppliers. Item exposure, indicated by the amount of attention items receive in a ranking, can be influenced by factors like position bias. Recent work suggests that inter-item dependencies, such as outlier items in a ranking, also affect item exposure. Outlier items are items that observably deviate from the other items in a ranked list w.r.t. task-specific, presentational features. Understanding outlier items is crucial for determining an item’s exposure distribution.
In our previous work, we investigated the impact of different presentational features on users’ perception of outlierness in e-commerce search result pages. By modeling the problem as visual search tasks, we compared the observability of three main features: price, star rating, and discount tag. We found that participants perceive these features differently in terms of attention and reaction times. Various factors, such as visual complexity (e.g., shape, color), discriminative item features (e.g., a solitary discount tag), and value range, affect item outlierness. These factors can be categorized into two main classes: bottom-up and top-down. Bottom-up factors are driven by visual properties such as color, contrast, and brightness, while top-down factors are influenced by cognitive processes such as expectations and prior knowledge.
In this extension of our previous work, we deepen our analysis of user perceptions of outliers. In particular, we focus on two key questions left unanswered by our previous work: (i) What is the effect of isolated bottom-up visual factors on item outlierness in product lists? (ii) How do top-down factors influence users’ perception of item outlierness in a realistic online shopping scenario?
We start with bottom-up factors and employ visual saliency models to evaluate their ability to detect outlier items in product lists purely based on visual attributes. Then, to examine top-down factors, we conduct eye-tracking experiments on the same task as our previous visual search experiment: online shopping. This time, we design the task as a simulated e-commerce environment, mimicking a popular European online shopping platform to be more representative of real-world scenarios. Moreover, we employ eye-tracking to not only be closer to the real-world case but also to address the accuracy problem of reaction time in the visual search task. In our experiments, participants interact with realistic product lists, some containing outliers w.r.t. different presentational features, such as image, price, and discount tag, at different positions.
Our experiments show the ability of visual saliency models to detect bottom-up factors, consistently highlighting areas with strong visual contrasts and attention hotspots. While the well-known Itti & Koch model detects general visual attention patterns in an image, a graph-based visual saliency model (GBVS) identifies visual anomalies more effectively. However, one should be cautious about the limitations of these models. Visual saliency models only rely on bottom-up factors, making them naive in that they do not distinguish between separate product features or compare them against each other.
The results of our eye-tracking experiment for lists without outliers show that despite being less visually attractive, product descriptions captured attention the fastest, indicating the importance of top-down factors and user knowledge of the task. Our observations in lists with visual outliers suggest that outliers and their immediate neighbors attracted attention faster (in terms of time to first fixation), which is in line with our findings from the visual search task. However, in our eye-tracking experiments, we observed that outlier items engaged users for longer durations (in terms of fixation count and time spent) compared to non-outlier items. This effect was consistent across different outlier features (image, price, discount tag) and various positions within the list.
1. Introduction
In two-sided marketplaces, items compete for attention from users since attention translates to revenue for suppliers. Item exposure is an indication of how much attention each item receives from users. Effective estimation of item exposure is crucial for challenges such as item fairness (Biega et al., 2018; Mehrotra et al., 2018; Morik et al., 2020; Sapiezynski et al., 2019; Singh and Joachims, 2018, 2019; Yadav et al., 2019; Diaz et al., 2020) and bias in counterfactual learning to rank (Joachims et al., 2005; Joachims et al., 2017; Ovaisi et al., 2020; Agarwal et al., 2019; Vardasbi et al., 2020; Novin and Meyers, 2017). Various modeling assumptions have been proposed for item exposure estimation in ranking. Widely used modeling assumptions made to estimate item exposure include inter-item independence and definitions of exposure as a function of an item’s position in a ranking. However, recent research has introduced different types of inter-item dependencies that influence exposure distribution on a ranked list, such as attractiveness bias (Yue et al., 2010), context bias (Wu et al., 2021) and outlier bias (Sarvi et al., 2022a, 2023).
In this work, we focus on a phenomenon that accounts for a specific type of inter-item dependency (Sarvi et al., 2022a, 2023): the existence of outlier items in a ranked list may affect the exposure that all items in the list receive. Outlier items are those that observably deviate from the rest of the items in a ranked list w.r.t. task-specific, presentational features. presentational features are item features that are visible to users when examining the result page like the price of a product in product search.
We have previously shown that the presence of outlier items may result in attention being distributed in a different way than on a list without outliers (Sarvi et al., 2022a, 2023). For instance, on an e-commerce search result page, adding a red-colored discount tag as a discriminative feature to only one product can attract more attention to it irrespective of its position or relevance to the query, thereby deviating from the exposure distribution that is estimated only based on position-based assumptions.
The perception and visual search communities have conducted many studies into how the human brain can immediately identify recognizable objects like outliers in an image and how different visual attributes (e.g., color, shape) can add to the complexity of this task (Treisman and Gelade, 1980; Giovannangeli et al., 2022; Wolfe, 1998; Shen et al., 2003). Since presentational features can be composed of multiple visual attributes, the relation between their use as discriminative features and their perception by users is complex.
1.1. Presentational features and attention
To gain a better understanding of the relationship between presentational features and user perception, we have previously compared different presentational features from the e-commerce search domain (Sarvi et al., 2022a, 2023). We have provided insights into how different presentational e-commerce features impact users’ perception of the outlierness of an item on a search result page. Informed by visual search studies, we have previously designed a set of crowdsourcing tasks where we compared the observability of different presentational features. The objective of these tasks is to find a target (i.e., outlier item) among distractors (i.e., non-outlier items), as fast as possible. Following previous work (Treisman and Gelade, 1980; Duncan and Humphreys, 1989), we used reaction time (RT) and accuracy in measuring the effort it takes to detect the target (outlier) among its distractors. We considered three observable features commonly used in e-commerce, viz. price, star rating, and discount tag. Previous work has shown the importance of these features in influencing users’ purchase decisions (Aggarwal and Vaidyanathan, 2016; Kao et al., 2020).
Our observations revealed that participants perceive different presentational features differently in terms of their attention and reaction times. Also, we found that the visual complexity of a feature can make it more observable to users. For example, a bright red background color of a discount tag makes it easier to spot than price tags that are shown as a number with regular font size and color. These factors can be categorized into two main classes: bottom-up and top-down. Bottom-up factors are driven by visual properties such as color, contrast, and brightness, while top-down factors are influenced by cognitive processes such as expectations and prior knowledge.
In this extended study, to better understand the balance between what naturally grabs users’ attention and what users prioritize during online shopping, we analyze these two types of factors separately. In particular, we focus on two key questions left unanswered by our previous work: (i) What is the effect of isolated bottom-up visual factors on item outlierness in product lists? (ii) How do top-down factors influence users’ perception of item outlierness in a realistic online shopping scenario?
1.2. How different features contribute to the outlierness of an item
We start with visual saliency models in Section 4.1 to examine the extent to which outlier products in a list can be detected based solely on bottom-up factors such as color, shape, and contrast. Next, in Section 4.2 we examine the effect of top-down factors by conducting eye-tracking experiments on the same task as our previous visual search experiment, i.e., online shopping. This time we design the task as a simulated e-commerce environment mimicking a popular European online shopping platform to be more representative of real-world scenarios.
Our experiments confirm that visual saliency models are effective in detecting bottom-up factors, consistently emphasizing areas of the image with high visual contrast. While the Itti & Koch model (Itti et al., 1998) captures general patterns of visual attention in an image, the graph-based visual saliency model (GBVS) (Harel et al., 2006) is better at identifying outlier regions of the image. However, it is important to acknowledge the limitations of these models. Visual saliency models depend solely on bottom-up factors, which means they cannot distinguish between different product features or assess them in relation to each other.
Our eye-tracking experiments suggest that product descriptions captured attention quickly, despite being less visually attractive, in lists without outliers. This finding indicates the importance of top-down features and other factors in play like center bias (Tatler, 2007; Buswell, 1935; Foulsham and Underwood, 2008). In lists with outliers, our analyses show that outliers and their immediate neighbors attracted attention faster and for longer durations compared to distant items. This effect was consistent across different outlier features (image, price, discount tag) and various positions within the list. We find that outlier items not only stand out among the list, but also receive more exposure as users spend more time examining them.
1.3. Main contributions
The main contributions of this work are:
-
(1)
We build on our previous work that demonstrated how different presentational features (e.g., price, star rating, discount tags) impact user perception of outlierness in e-commerce search result pages, highlighting the key role of visual complexity in attention distribution;
-
(2)
Through experiments with visual saliency models, we analyze the influence of bottom-up visual factors on item outlierness in product lists, confirming the effectiveness of the graph-based visual saliency model in detecting visual anomalies in ranked lists;
-
(3)
Through eye-tracking experiments, we demonstrate the impact of top-down factors on user attention, showing that these factors can override bottom-up visual signals in online shopping scenarios;
-
(4)
We show that outlier items and their close neighbors in ranked lists attract more attention and receive increased exposure (measured by engagement time), regardless of their position, due to their distinct observable features.
2. Background
2.1. Visual search
Visual search has been a central approach in studying visual attention for many years. It allows researchers to turn everyday search activities, like finding a can opener in the kitchen, into controlled experiments that can be repeated in a lab setting (Wolfe et al., 2010).
In a typical visual search task, individuals scan a visual field to locate a target object among other distracting items. Researchers examine how features such as color, shape, size, or orientation affect the speed and accuracy of finding the target (Treisman and Gelade, 1980). One of the key theories explaining this process is the Feature Integration Theory (FIT) introduced by Treisman and Gelade (1980). FIT proposes that visual search occurs in two stages: the pre-attentive stage and the focused attention stage. In the pre-attentive stage, basic features like color and shape are processed automatically and in parallel across the visual field. However, in the focused attention stage, when these features need to be combined to identify an object, the process becomes slower and requires more cognitive effort. This theory explains why finding a single, distinctive feature (such as a red dot among blue dots) is easier and faster than searching for an object that shares multiple features (like a red circle among red squares). Another important concept in visual search is the difference between the stand-out effect and conjunction search, introduced by Wolfe (1994). When a target differs from all distractors by just one feature (such as color), it stands out, making the search quick and independent of the number of distractors. In contrast, when the target shares features with the distractors (for example, finding a red circle among red squares and green circles), the search becomes slower, and the task duration increases as the number of distractors grows. Visual search tasks are typically assessed using reaction time (RT) and accuracy, which help determine how quickly and efficiently a target can be identified among distractors (Majeed et al., 2023; Wolfe, 2020; Palmer et al., 2011; Müller-Plath and Pollmann, 2003).
2.2. Visual saliency
Visual saliency determines the perceptual selection of objects or regions that stand out and capture attention within a visual field (Itti et al., 1998). It influences the control of visual attention, for example, in determining the next fixation points during visual exploration (Veale et al., 2017; Itti, 2007).
Two types of factors influence the visual saliency of an object in a specific context: bottom-up and top-down factors (Leiva et al., 2020). Bottom-up factors are primary visual attributes such as color, shape, size, and orientation. Objects that are unique with respect to such attributes tend to attain the observer’s attention. For example, in an image mainly filled with green colors and shapes, the sudden appearance of a different color like red often makes people look at the red part (Lu and Lim, 2012; Leiva et al., 2020). Top-down factors come from one’s goals and what you expect to see (Leiva et al., 2020). They are based on one’s previous experience and their knowledge of the context. For example, when searching for something specific, like a red car, one is more likely to notice red cars first.
Saliency effects can vary across different contexts and tasks. While some bottom-up factors like color contrast can be generalizable, top-down factors related to specific tasks can significantly influence what stands out. What is salient in one situation may not be in another. Researchers typically conduct specific experiments and use computational models to understand saliency within particular contexts and tasks rather than making broad generalizations (Leiva et al., 2020).
2.3. Outliers in ranking
Outliers are data points that differ significantly from the rest of the data (Wang et al., 2019). They can represent unusual but important findings or potential errors. In any case, they are often seen as noise that can influence statistical analysis. Various methods have been developed to detect outliers (Schölkopf et al., 2001; Jin et al., 2006; Ramaswamy et al., 2000; EStimator, 1999) as it is essential to detect these anomalies in many research fields (Li et al., 2020; Wang et al., 2019). However, the definition of outlier items can vary across domains (Wang et al., 2019). In this work, we adopt the definition of outliers in rankings from Sarvi et al. (2022b) who describe outliers as items that stand out based on observable features. observable features are visible characteristics that distinguish outlier items from their neighbors (Sarvi et al., 2022b). In this work, we create outlier items in ranking based on this definition and using different product properties as observable features.
3. Preliminary Experiments: Visual Search
Studies in the field of visual search and cognitive science show that different visual attributes are processed differently by the brain (Treisman, 1988). Inspired by these findings, and as the first step, we aim to verify if users notice deviations in different products’ presentational features at different rates. In this section, we describe the details of our crowdsourcing task which is formulated as a visual search experiment.
3.1. Crowdsourcing experiments
We design our tasks as a visual search process (Giovannangeli et al., 2022; Treisman and Gelade, 1980; Wolfe, 1998; Shen et al., 2003), where the objective is to find a target among distractors. We focus on the domain of e-commerce search, where the distractors are non-outlier products in a ranking, and the target is the outlier products that differ in at least one presentational feature. We compare three presentational features, namely, price, star rating, and discount tag. When considering a discount tag, our task is close to a disjunctive search process known from visual search (Treisman and Gelade, 1980) that focuses on detecting a target that differs from the distractors in terms of a unique visual feature, e.g., the discount tag (McElree and Carrasco, 1999). When regarding price and star rating, our task is closer to conjunction search (Treisman and Gelade, 1980), where the distractors exhibit at least one common feature with the target (Shen et al., 2003). However, unlike conjunction search, in our task, the difference between the target and the distractors is in the values of the features, not the features themselves (e.g., the value of the product’s price). In the rest of this paper, we refer to the target item as outlier.
Following previous work (Treisman and Gelade, 1980; Duncan and Humphreys, 1989), we use reaction time (RT) and accuracy to measure the effort it takes to detect the target (outlier) among its distractors. The goal of this task is to examine and determine which presentational features are easier to detect by the workers, i.e., the shorter the RT to find the outlier, the easier it is.
We perform our experiments using two tasks, where we build several synthetic product search result pages and examine how each feature contributes to the outlierness of an item, both separately and simultaneously. Below, we describe the different stages of our two tasks.
3.1.1. Experimental design
In the following, we describe the details of our experimental setup.
Page examination behavior
We record several signals related to participants’ page examination behavior and their interaction data, such as mouse hovering, scrolling, viewed items, clicks, and time spent on the task. To gain a more accurate estimate of RT, we ask the participants to click on a Start button after reading the instructions. The search result page appears only after the Start button has been clicked. We compute the task completion time from the moment the workers click the Start button.
Instructions
In the instructions, we describe the overall goal of the research and the concept of an outlier in a search result page, providing tangible examples. We ask participants to scan and compare all items in a list and flag outliers as fast as they can. We also ask them to fill out a questionnaire after completing the tasks.
Participants
We use Amazon Mechanical Turk as the platform for our crowdsourcing experiments, with workers based only in the U.S., with an approval rate of 95% or greater. After quality control, we are left with 140 assignments (92 for Task I and 48 for Task II), submitted by 80 distinct participants. From the participants, are female, male, and listed other genders. The majority of participants () are between 25 and 44 years old, with younger and older workers.
Post-task questionnaire
We ask participants to fill out a questionnaire after completing the task. To gain more insight into workers’ backgrounds and online shopping behavior, we instruct them to fill out questions on their demographics and familiarity with online shopping. Moreover, to enable more effective results analysis, we ask the workers how much each product feature influences their everyday purchase decisions. To ensure that the workers understand the outlier definition, we ask them to answer a question about the definition of an outlier in search.
Quality control
We follow three strategies for quality control. As part of the post-task questionnaire, we ask a multiple-choice question on the definition of outliers. All participants managed to answer this question correctly. Also, following Kittur et al. (2008), we ask workers to justify their choice in a few keywords. We only remove the responses of those participants who entered random tokens as justifications of their answers. We also remove the responses of those who revisit the instructions more than two times while performing the task, since response time is crucial in this study.
3.1.2. Task I
In the first task, we evaluate how fast any of the three presentational features (price, star rating, discount tag) can be spotted on a search result page. To this end, we explicitly describe and mention the one feature at a time to the participants and ask them to scan the list and find up to two outlier items, only with respect to the given feature. For instance, after providing a definition of outliers in the instruction, we mention that there are one or two outliers in terms of different values for price in the list and that they have to find them as fast as they can. We place one of the outliers at the top of the list and the other at the bottom. To avoid position and randomness bias, we keep the position of the outlier items fixed while other items are randomly placed in the list.
Wolfe (1998) suggests that visual features including luminance, color, and orientation affect the RT in a visual search task. Following this work and inspired by the experiments in (Treisman and Gelade, 1980), we tested two variations of Task I, namely Type I and Type II, where we change the shape, color and value of the presentational features to study different magnitudes of deviation of the outliers from the rest. In Type I, we use features that more strongly discriminate between the outlier and the rest compared to Type II. For example, an outlier w.r.t. price can be 10 or 2 times more expensive than other products. We use the former in Type I and the latter in Type II. The same goes for star rating. Regarding the discount tag feature, we use the suggestions by Wolfe (1998) to distinguish between the outlier items of Type I and Type II. In Type I we use a bright red color as background with a bold white font stating that there is a special deal on the product, whereas, in Type II, we use a light green text without any background stating a discount.
3.1.3. Task II
Unlike Task I, here we aim to examine the relative RT for the three features (price, star rating, discount tag) when presented to the users simultaneously. To better compare the three observable features, we jointly present the different combinations of these features and analyze the behavior of the users. While describing the three target features in this task, we do not mention to participants which features are being examined. Therefore, the workers are supposed to go through the list, examine all items with respect to all the features used in presenting the results, and then decide which items are outliers. Note that there are more than three features used to describe each item, for example, we used image, title and delivery information next to the price, discount tag and star rating. Moreover, we indicate that the workers have to mark a maximum of three items as outliers. Here, we also randomize the position of the outlier items while making sure that they appear both at the top and bottom of the list. We run the task for all combinations of at least two of the three features.
3.2. Results
In this section, we present the results of our crowd-sourcing tasks in terms of the performance and behavior of the workers under different experimental conditions.
| Type | RT out. 1 | RT out. 2 | Acc. | |||||
|---|---|---|---|---|---|---|---|---|
| Avg. | Med. | Avg. | Med. | |||||
|
Type 1 |
Disc. tag | 4.22 | 3.62 | 8.90 | 8.00 | 0.98 | ||
| Star rating | 4.81 | 3.41 | 9.67 | 8.14 | 0.97 | |||
| Price | 8.38 | 5.50 | 12.44 | 11.77 | 1.00 | |||
|
Type 2 |
Disc. tag | 19.84 | 17.88 | 25.57 | 26.88 | 0.99 | ||
| Star rating | 10.96 | 8.11 | 17.36 | 12.42 | 0.99 | |||
| Price | 10.62 | 6.03 | 14.21 | 11.90 | 0.98 | |||
3.2.1. Reaction time and accuracy
Following (Treisman and Gelade, 1980; Duncan and Humphreys, 1989), we use reaction time (RT) and accuracy to measure the effort it takes to detect the outlier among non-outlier distractors. Table 1 summarizes participants’ average responses to Task I in terms of RT and accuracy. Accuracy is high for all variations of Task I with a maximum of for price in Type I and a minimum of for star rating. We conclude from the high accuracy values that the workers grasped the concept of outlier in a ranked list and were able to accurately find them in the list. Next, we compare the time that the workers take to spot the outliers. Table 1 shows that for Type I outliers participants spotted the discount tags faster than the other two features in Task I. This is followed by star rating with a slightly higher recorded RT. As expected, we see that on average it took participants almost twice as long to find the price outliers. We conducted a one-way ANOVA test on RT for first outliers in Type I. Results show that the differences are statistically significant with -value .
Detecting discount tags is similar to a disjunctive visual search process, which has been shown to be easier to solve compared to conjunctive search (i.e., star rating and price) (Treisman and Gelade, 1980). Moreover, users favor simple options when they act under time pressure (Azzopardi, 2021), which can lead to being biased towards easy-to-detect visual features such as discount tag. The higher RT for price can be attributed to the fact that certain visual features, including color and shape, are processed early in the brain using pre-attentive processes (Treisman and Gelade, 1980). Star rating and discount tag have more visual characteristics regarding shapes and colors, however price is more simply presented in the product descriptions.
Another related aspect is the unknown range of the price values. This is less crucial for star rating or discount tag since the former has a range between 1 to 5 and latter is a binary feature.
3.2.2. Type I vs. Type II
Next, we compare the results of Type I and Type II outliers. Our goal is to understand how much changing the magnitude of the deviations in terms of different features affect user performance. One can compare different ranges of deviations on specific features to model the relationship between the the deviations and user performance, but we leave this as future work and only compare two variations. The results in the upper and lower parts of Table 1 suggest that the reduced magnitude of deviations in all features leads to higher RT. Duncan and Humphreys (1989) study the same effect by pointing out that when outlier to non-outlier similarity increases, the task becomes more difficult. Similarly, we see that RT increases for all the features, and for both the first and second outliers.
Moreover, we see in Figure 1 how the RT distribution of the two outlier variants differ for Task I. As expected, the plots show a higher RT for all features, and both outliers. However, it is interesting to note that we observe the lowest relative effect on the price ( increase), compared to star rating () and discount tag (). We relate this to the visual nature of discount tag and star ratings. Reducing the color contrast of discount tag would have a greater impact on the user’s ability to detect it among the distractors, compared to a different price ranges as the user still has to carefully check the prices to detect the outlier. Regarding the accuracy we see no drop, suggesting that even a more subtle deviation in observable feature can be detected by many users.
3.2.3. Feature combinations
Figure 2a shows recall values for combinations of features, where the y-axis indicates recall of a combination of features and the x-axis indicates the value for a specific feature. As expected, detecting the outlier w.r.t. price is more difficult for participants (on average, and lower values than for discount tag and star rating). In terms of RT, Figure 2b confirms our findings in Table 1, except for the combination of discount tag and star rating, where on average participants found star rating seconds faster than discount tag. Perhaps, it is because the average position of the outlier w.r.t. discount tag is lower than star rating ( and , respectively).
4. Extended Experiments: Visual Saliency and User Attention
In the previous section, we investigated how individuals perceive and react to different product features (whether outliers or not) within a list through controlled visual search tasks. We measured participants’ RT and accuracy as they detect outliers among regular items in ranked lists. The findings revealed that various factors, such as visual complexity (e.g., shape, color), discriminative item features (e.g., a solitary discount tag), and value range, affect user perception of item outlierness. These factors can be categorized in two main classes: bottom-up and top-down. To better understand the balance between what naturally grabs users’ attention and what users prioritize during online shopping, in this extended study, we analyze these two types of factors separately. We aim to answer the following research questions:
-
RQ1
What is the effect of isolated bottom-up visual factors on item outlierness in product lists?
-
RQ2
How do top-down factors influence users’ perception of item outlierness in a realistic online shopping scenario?
We start with visual saliency models in Section 4.1 and examine the extent to which outlier products in a list can be detected based solely on bottom-up factors such as color, shape, and contrast. Next, in Section 4.2 we examine the effect of top-down factors by conducting eye-tracking experiments on the same task as our previous visual search experiment, i.e., online shopping. This time we design the task as a simulated e-commerce environment mimicking a popular European online shopping platform to be more representative of real-world scenarios. Formulating the task as a visual search experiment is valuable for gaining initial insights into user behavior and attention patterns, however, it has two main limitations that we aim to address in our new setup:
Representativeness of e-commerce scenarios
Visual search tasks are structured and goal-driven, where participants are explicitly instructed to fulfill a specific goal (in our case: find the outlier item as quickly as possible). However, in real-world online shopping, users engage in more open-ended exploration, distributing their attention across multiple items and features without a clear target in mind. This contrast in task characteristics can lead to variations in user behavior, making it challenging to generalize findings from controlled visual search experiments to the real-world shopping case. In this section, we employ a more realistic experimental design that mimics a popular e-commerce platform in Europe.
Accuracy of RT
Much previous work uses RT as a proxy to estimate user attention in visual search tasks (Majeed et al., 2023; Wolfe, 2020; Palmer et al., 2011; Müller-Plath and Pollmann, 2003), however, it might not always be accurate because it relies on participants’ interpretations of our instruction. While we instructed participants to find the outlier as fast as they could, it is not straightforward to ensure they consistently follow this instruction. Response times can be influenced by factors beyond attention, or individual differences, such as external environmental distractors or lack of focus and motivation. Therefore, RT alone may not provide a precise measure of attention.
In this extended study, we use eye-tracking as the tool for capturing and analyzing user attention. Attention, by its nature, is an internal and subjective experience (Shi et al., 2013; Schwager and Meyer, 2007; Chocarro Eguaras et al., 2022). Declarative methods, like surveys or self-reports, are inadequate when used alone for measuring user attention (Ariely and Berns, 2010). Eye-tracking provides objective and direct measurements of attention, making it a more reliable choice for understanding how users engage with visual stimuli (Ariely and Berns, 2010; Chocarro Eguaras et al., 2022).
4.1. Visual saliency maps
Visual saliency determines the regions that stand out and capture attention within a visual field (Itti et al., 1998). In our task of detecting outlier product feature in search result list, it allows us to predict which product features are expected to attract more attention due to their visual properties, such as color contrast, size, or pattern complexity. Visual saliency can serve as a benchmark or baseline for comparing the inherent attention-grabbing properties of different product features. It can also detect observable outliers purely based on bottom-up factors. In this section we aim to answer RQ1. In the rest of this section we describe the models used for this experiment and our stimuli design.
Models
Visual saliency models create density maps that depict the extent to which individual pixels grab attention relative to others (see Figure 3). These models can be classified into bottom-up and data-driven. Bottom-up models are based on primary visual attributes such as shape and color, while data-driven models are trained using eye movement data together with some architectural assumptions inspired by bottom-up models (Leiva et al., 2020). To answer RQ1 we use two well-known bottom-up models that are often used as baseline models in the literature: Itti & Koch (Itti et al., 1998) model and graph-based visual saliency (GBVS) (Harel et al., 2006) model. Itti et al. (1998) proposed a saliency-based visual attention model to extract visual features as computed via linear center-surrounded operations with Gaussian pyramids for intensity, color, and orientation. The GBVS model is an extension of the Itti & Koch model that forms graph-based activation maps from visual features and normalizes them to highlight conspicuity. The global visual feature extraction and graph-based activation maps enable the model to capture saliency maps at the global level.
Stimuli description
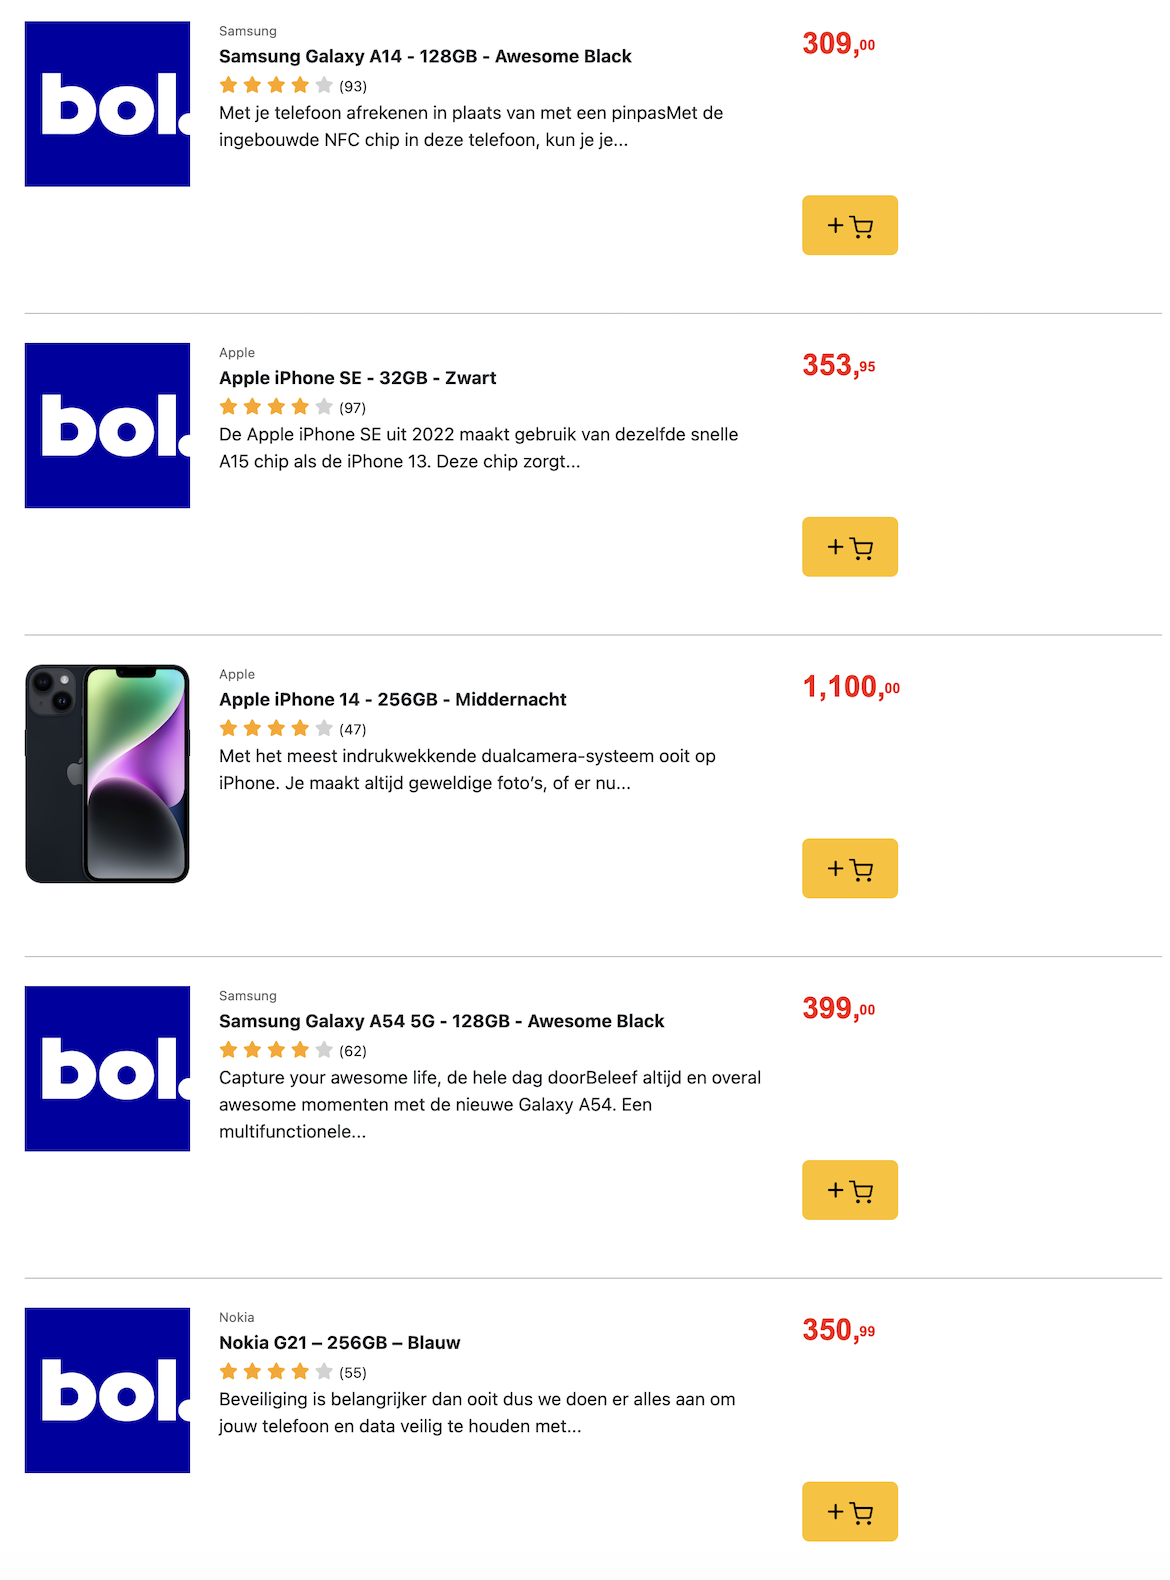
To answer RQ1 we captured high-resolution screenshots of search result pages of Bol.com, a popular European e-commerce platform. Each screenshot is preprocessed to fit the input requirements of the saliency models. We then generated saliency maps using both models to highlight areas predicted to attract the most visual attention.
For the analysis, we selected a subset of variants of product lists that include different product categories, different outlier positions and outlier types:
-
(1)
a list of smartphones with an outlier image at position 3 (see Figure 3a),
-
(2)
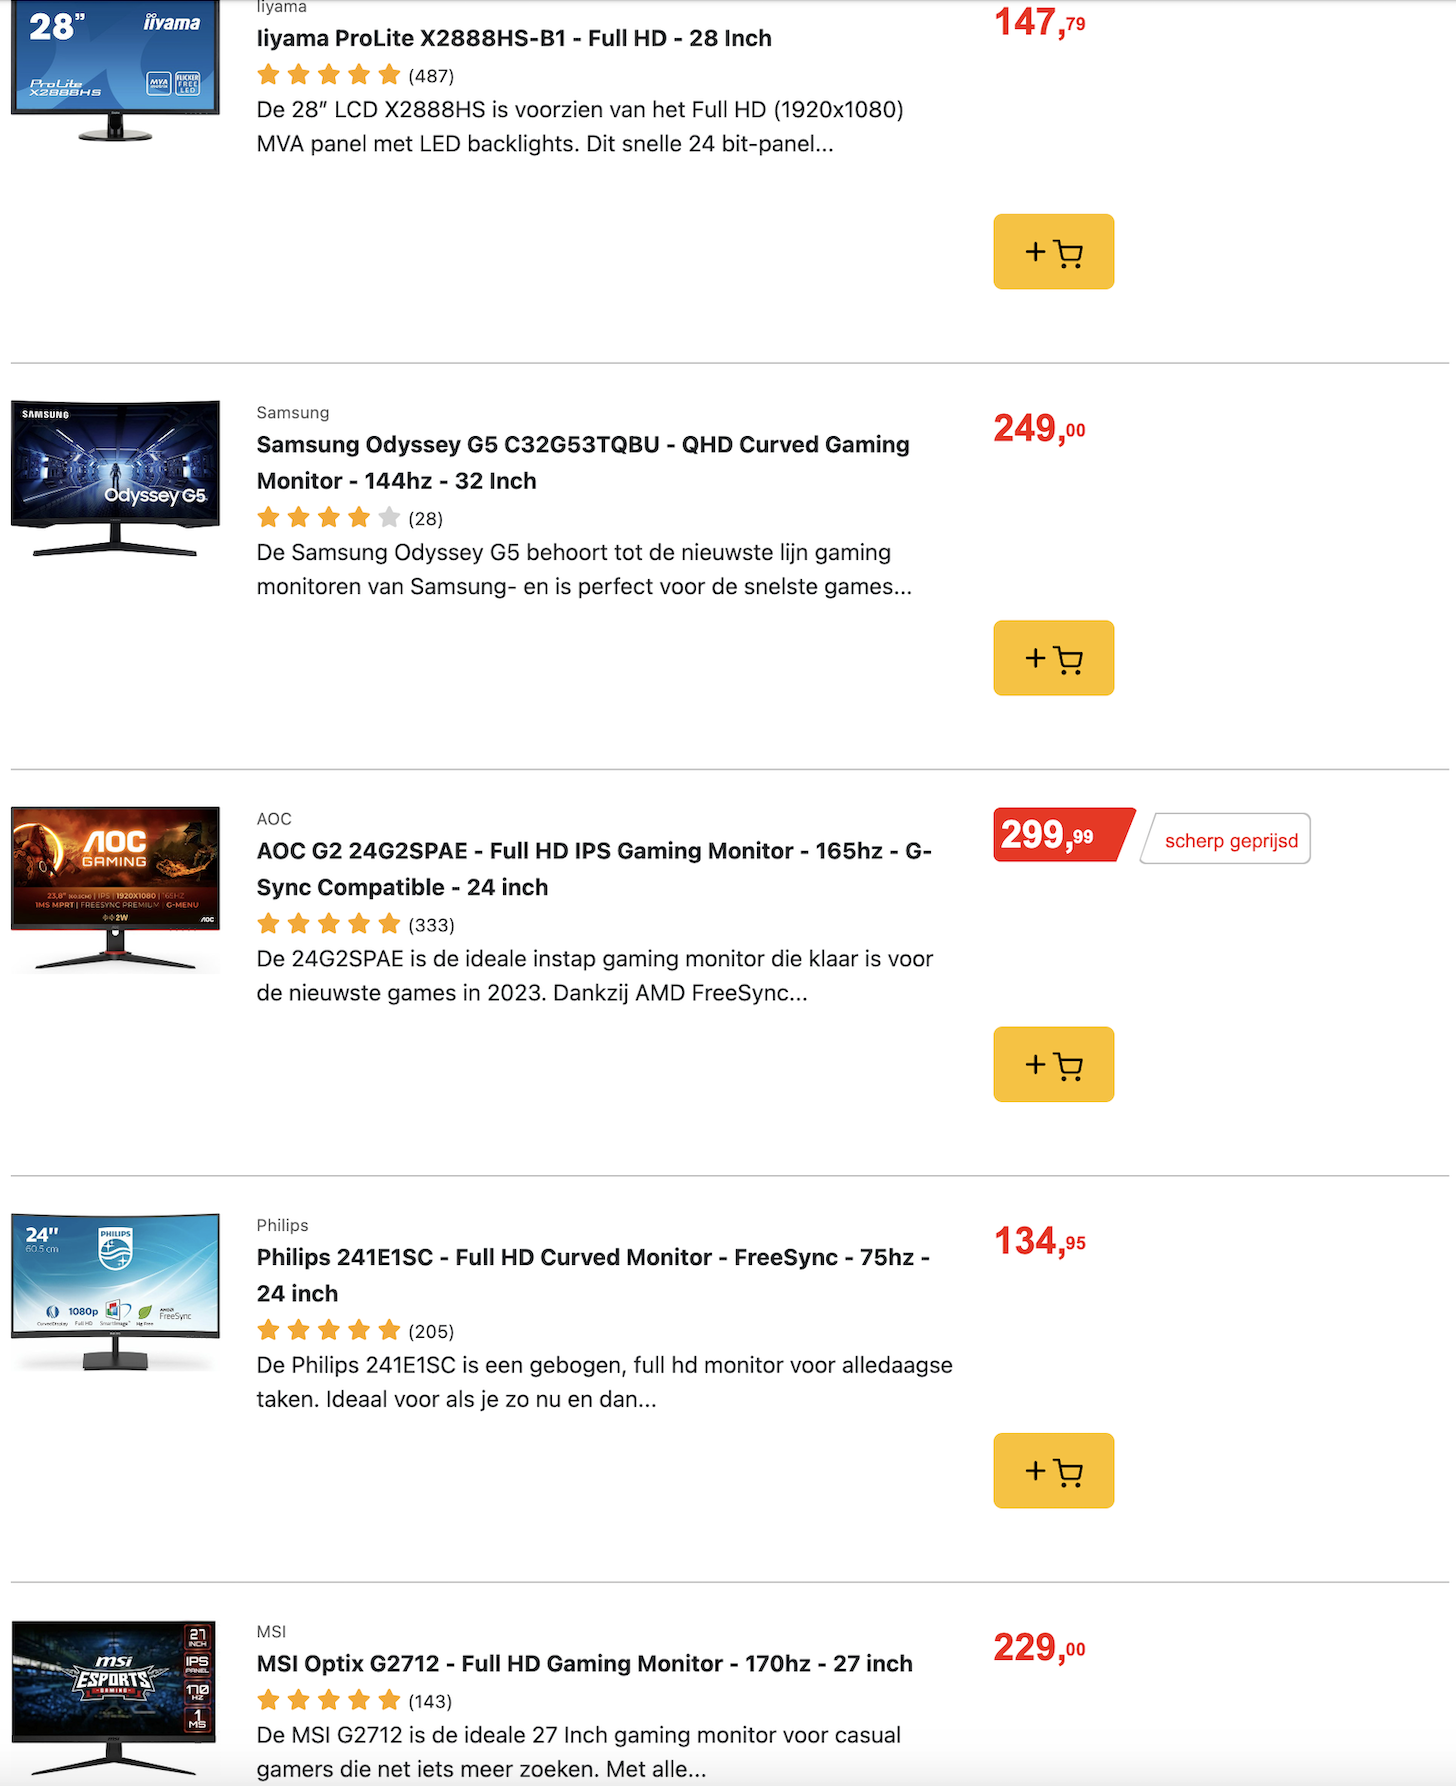
a list of monitors with an outlier discount tag at position 8 (see Figure 3d), and
-
(3)
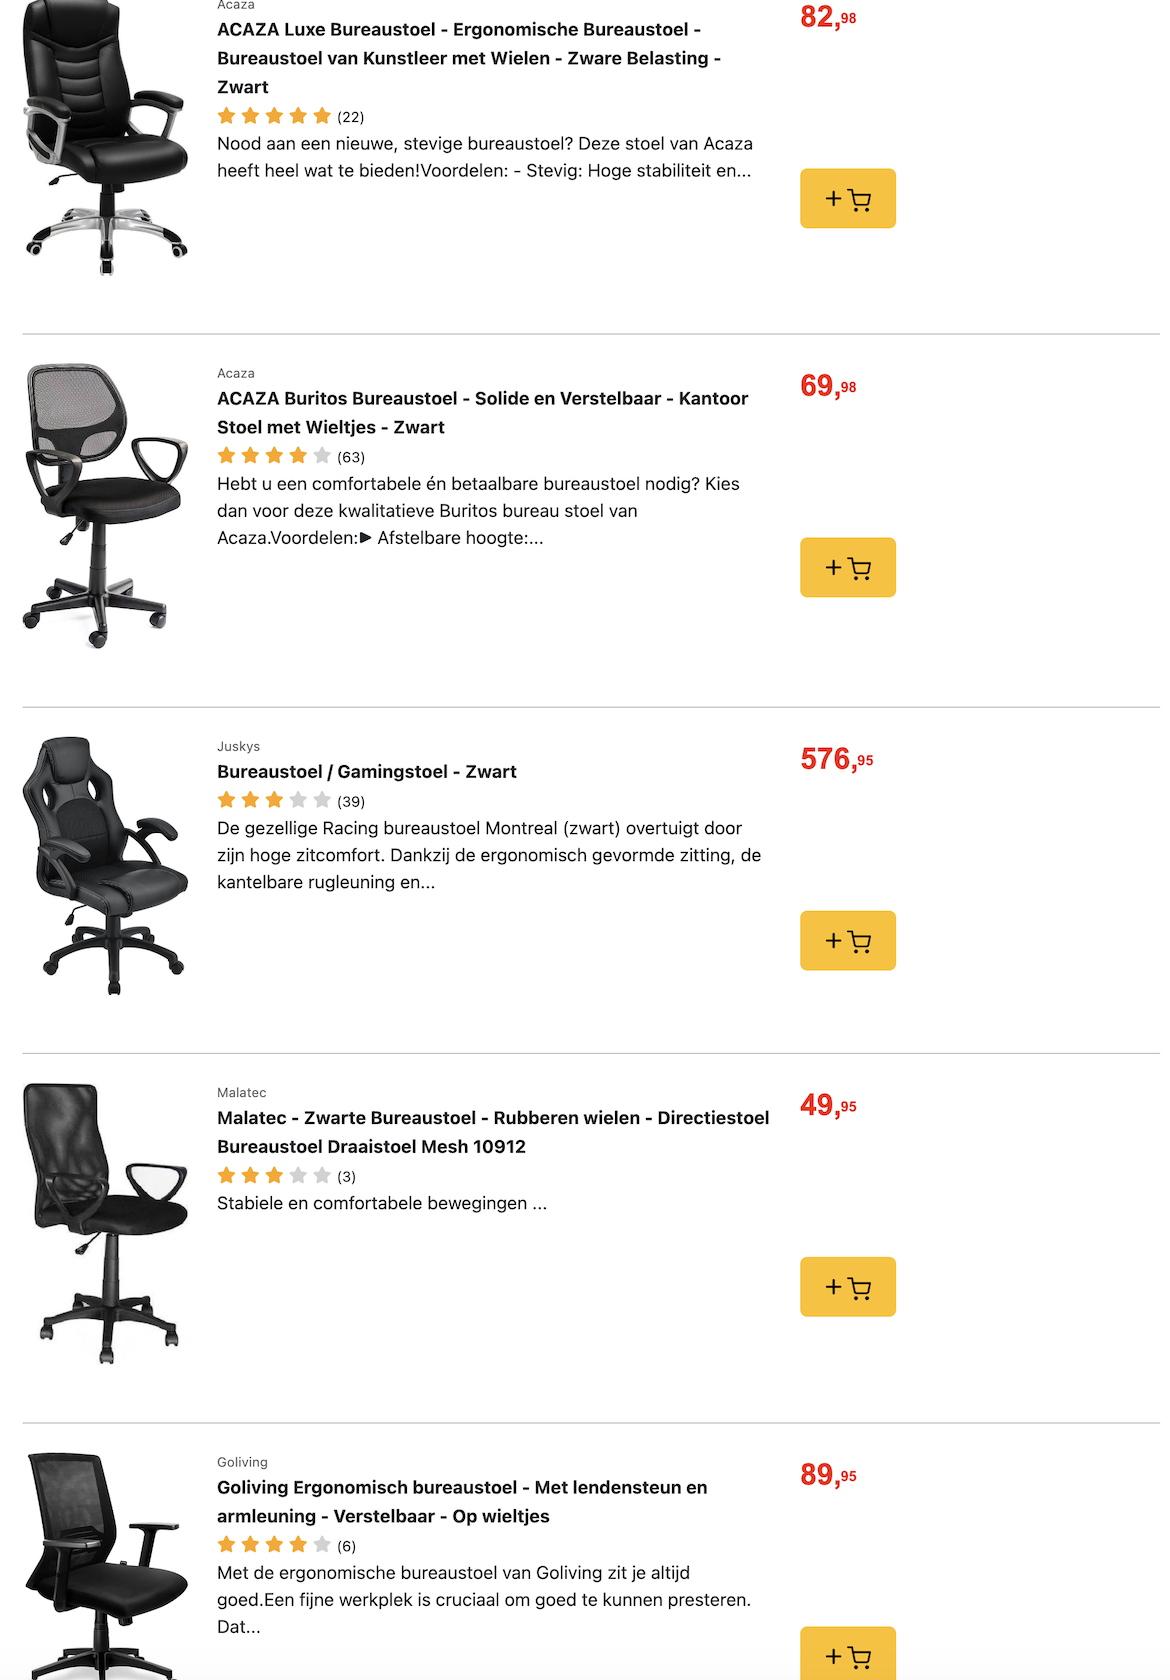
a list of office chairs with an outlier price at position 13 (see Figure 3g).
We generate the visual saliency maps for all these variants, illustrating both the full list (see Figure 3) and a focused view around the outlier and its close neighboring items (see Appendix, Figure 10).
4.2. Eye-tracking experiments
In this section, we describe our experimental design to answer RQ2 through eye-tracking. We detail our methodology, experimental designs, and specific study goals.
4.2.1. Experimental design
In the following, we outline the key aspects of our experimental design.
Online shopping experience
There are two critical factors influencing a customer’s shopping experience: their goal or specific task, and product category (Chocarro Eguaras et al., 2022).
Customer’s goals refer to the different stages of the purchasing process, such as gathering information about products, comparing different options, and understanding delivery choices (Tupikovskaja-Omovie and Tyler, 2021). In this study we focus on the Choice Task as described by Chocarro Eguaras et al. (2022): “Visit the website and select from those offered the product that most appeals to you based on the information provided.”
In addition, the category of the product has been recognized as a significant moderator in e-commerce. Nelson (1970) divides product categories into two classes: search products and experience products. Search products are items that consumers can determine most of their attributes before purchasing. On the other hand, most attributes of experience products are unknown to consumers before the purchase or the consumption. In short, consumers can evaluate search products by their features, brand, or price, while experience items need senses for their evaluation (Nelson, 1970; Chiang and Dholakia, 2003; Weathers et al., 2007).
Previous studies suggest that user attention patterns can be different for different product categories (Lee and Hosanagar, 2021; Luan et al., 2016; Wang et al., 2014). Therefore, following previous work (Chocarro Eguaras et al., 2022; Huang et al., 2014; Kim and Lennon, 2008; Levin et al., 2003; Luan et al., 2016), we select 5 product categories with search and experience attributes:
-
•
experience attribute: backpacks, office chairs, running shoes; and
-
•
search attribute: mobile phones, monitors.
We use the backpacks category also for the calibration stage and the rest for actual analysis.
Stimuli description
The stimuli in this study consist of product search result pages, mimicked after Bol.com (see Figure 3). Each page contains 15 distinct products. These products are characterized by various features, including product images, titles, descriptions, star ratings, review counts, pricing information, and, in some cases, discount tags. To reduce the complexity of the page we removed information about delivery, seller, and offer from the product features.
The products on our simulated search result pages are real items from Bol.com, chosen to match our study queries. However, they may not be exactly the same as the platform’s search results. We made controlled modifications to certain product features for the purpose of our research. For instance, we may have adjusted item prices or added discount tags to items to study their effects. We provide the descriptions of these decisions where they were applied.
Online eye-tracking
We use the RealEye.io online platform to run webcam-based eye-tracking experiments. RealEye.io eye-tracking is based on WebGazer, an eye tracking JavaScript library (Papoutsaki et al., 2016). Webcam-based eye-tracking has become popular in the eye-tracking community due to its ability to capture eye movements in real-world settings, relatively low cost, and high speed of data acquisition (Wisiecka et al., 2022). Several recent studies use webcam-based eye-tracking for their perception and cognitive experiments (Sarvi et al., 2022a; Fazio et al., 2020; Federico and Brandimonte, 2019; Murali and Çöltekin, 2021; Haldar et al., 2024; Brandl et al., 2024). Wisiecka et al. (2022) report that they were able to obtain comparable results from RealEye.io compared to a lab experiment in tasks involving fixation (location-based metrics). The average accuracy for individuals is reported as 113px; however, it is expected that the average error goes to zero in aggregated analysis with several participants.111https://support.realeye.io/realeye-accuracy
Metrics and data collection
In this study, area of interest (AOI) is an analytical tool that provides eye movement metrics for user-defined areas of an image. We defined three AOIs per product in the list that covers a product’s image (on the left), the product’s description (in the middle) and the product’s price information (on the right) including discount tags if any. We consider four eye-tracking measures to report our results based on participants’ eye fixations and for any AOI (Fiedler et al., 2020):
-
(1)
fixation count: the number of fixations within an AOI; more fixation means more visual attention;
-
(2)
time spent: shows the amount of time that participants spent on average looking at an AOI;
-
(3)
time to first fixation (TTFF): the amount of time that it takes participants on average to look at the AOI for the first time; and
-
(4)
revisit count: indicates how many times participants looked back at the AOI on average.
To calculate these metrics, we aggregated eye movements on each AOI on the list.
Instructions
Participants were instructed to interact with the presented product lists as they typically would. While participants were not obligated to click on any items, they were encouraged to explore the entire page thoroughly. It was emphasized that we will ask questions regarding the content of each page after their exploration and we only accept submissions with reasonable answers to the questionnaires. We had 6 product lists each corresponding to a unique query, and participants had 90 seconds for exploring each single page. The first list was for calibration, so that the participants get familiar with the format of the experiment, therefore, we recorded the results only for the next 5 lists.
Post-task questionnaire
Our questionnaire consisted of two sets. The first set was presented after each page was shown, focusing on the page’s content, the products participants observed, their purchase recommendations, and whether they noticed anything unusual or intriguing. The second set of questions was presented upon completion of the task and covered participants’ demographics and online shopping habits.
Procedure and implementation
Participants were recruited through the Prolific platform222https://prolific.io and, after receiving task instructions, were directed to RealEye for the eye-tracking experiments and questionnaires.
The participants were randomly exposed to different sets of lists. Each set contains the same queries and products, but with modifications to place outliers in different positions. We also applied randomization within the set, to present different orders of queries to different participants. The randomization of each set presented to participants was systematically managed through our backend logic, while the randomization of the order of lists within the sets is handled by the RealEye platform.
At the start of the task, each participant would initiate their session with a warm-up step, during which they explored a list of products. The results of this warm-up step are excluded from our subsequent analysis. Upon completion of all sessions and questionnaires, participants received a unique code, allowing Prolific to track their submissions.
Participants and procedure
To ensure the participants’ familiarity with the e-commerce platform, we only hired participants from the Netherlands and Belgium, where our e-commerce platform is active. To ensure data quality, we set a prerequisite that workers must have an approval rate of or greater. After quality control procedures, we are left with a total of 118 distinct participants. of participants identified as female, as male, and selected other genders. In terms of age distribution, the majority of participants () were aged to , were to years old, and the remainder were older than . All participants in our study used desktop computers with a webcam, ensuring a standardized viewing experience among all participants.
4.2.2. Task I
Overview
In the first step of our eye-tracking experiment, we investigate how users examine product search result lists and understand the attention dynamics related to different product features. Specifically, we explore which features are more engaging in terms of time spent and fixation count and which ones capture attention faster in terms of TTFF. While there are studies examining factors that influence users’ viewing behavior on search results pages (Lewandowski and Kammerer, 2021), to the best of our knowledge, no previous research has focused on e-commerce.
Stimuli description
As mentioned in Section 4.2, the product lists used in our study were harvested directly from Bol.com. Each list contained 15 distinct products. To maintain consistency for this step, we ensured that no outlier products were present in the lists. To this end, we identified and replaced products that could potentially be perceived as outliers (see Section 2.3). Several factors were considered during this process, including product images (content, color, background color), prices, discount tags, and user ratings.
Additionally, slight adjustments to item prices are applied in some cases to ensure they match the pricing patterns found in product lists. We used “backpacks” and “running shoes” as the search queries for this experiment. Participants were randomly assigned to one of these lists.
4.2.3. Task II
Overview
In our second eye-tracking study, we aim to investigate how outlier product features influence the observability of products in search result lists. More specifically, we focus on the stand-out effect of different product features when presented as outliers. We aim to answer RQ2 by exploring how the presence of an outlier product feature affects the overall attention distribution among the list and how these effects differ among various product features.
Stimuli description
We selected three product features for examination: price, image, and discount tag.
To maintain an unbiased experimental design, we ensured that product category, position, and relevance do not introduce any bias into the results. To achieve this, we created unique combinations of product queries and product features, each featuring an outlier placed at positions 3, 8, or 13 within the product list.
Each participant viewed each product query only once during the study, ensuring diversity and preventing familiarity from affecting their attention patterns. Furthermore, participants received lists with outliers w.r.t. each product feature only once to prevent repetition bias and learning effects. The position of the outlier within the list was randomly assigned from the available options to address position bias.
4.3. Results
4.3.1. Visual saliency maps
In this section, we present our observations to answer RQ1 using the full list view, however, the patterns are similar for the focused view images (see Figure 10).


For the first list, the GBVS map highlights a very intense spot near the top where the outlier image is located (see Figure 3c). This suggests that the model is highly responsive to the visual characteristics of the outlier, potentially due to its unique color scheme, size, and contrast compared to surrounding items. On the other hand, the Itti & Koch map shows a more evenly distributed pattern of saliency across the product list (see Figure 3b), with less intense focus on any single point. However, there is still a noticeable emphasis on the area around the image outlier, but less pronounced than in the GBVS model.
In the second list, the GBVS map shows several highlighted areas, but there is a particularly intense focus on the upper part of the list, where the initial items are located (see Figure 3f). The model does not distinctly highlight the middle part where the outlier discount tag is at position 8, suggesting that while the GBVS model is sensitive to certain visual cues, it may not consistently emphasize elements like tags unless they are accompanied by other strong visual contrasts. While the Itti & Koch map displays attention points scattered more evenly across the entire list, there are visible highlights around the middle section, closer to where the outlier discount tag is (see Figure 3e). The highlight around the outlier discount tag in the middle of the page might not specifically show the outlier; however, we observe that the Itti & Koch map could better detect this local difference in the map. This can be due to its algorithmic sensitivity to a broader range of visual features beyond mere contrast, such as layout structure.
Lastly, in the list with the price outlier, the GBVS map shows a few distinct areas of high saliency, with notable intensity at the bottom of the list, near where the outlier is located (see Figure 3i). This suggests that the GBVS model is effective in identifying significant deviations in price among this list, while the Itti & Koch model fails to detect this pattern (see Figure 3h).
In conclusion, our observations suggest that the GBVS model is particularly suited for detecting distinct visual anomalies within a cluttered visual field, while the Itti & Koch model offers insights into general visual attention patterns across a product list, by highlighting the more visible parts of the image without focusing on global differences. The GBVS model focuses on global visual features, which means it responds differently based on the complexity and variety of elements in an image. This behavior helps explain why the GBVS model fails to detect the bright red tag in Figure 3d, while it effectively highlights the price outlier in Figure 3g. In the chair list, the uniform dark colors of the product images make even small variations in price patterns more noticeable to the model. Conversely, the diverse colors among the monitor images might distract the model, causing it to overlook the red tag despite its visual prominence.
While the Itti & Koch and GBVS models provide valuable insights into the potential attention-grabbing properties of various product features, they are based on theoretical constructs and may not fully capture real-world user behavior. To address this gap, we now turn to empirical validation through eye-tracking experiments.
4.3.2. Eye-tracking Task I
In this section we present our observations on how users examine a regular product result page without any outliers.
Engagement metrics
Figure 4a shows that TTFF is quite high across all categories, with product description being the fastest (25,393 ms), followed by prices (35,901 ms) and images (36,503 ms). This might indicate that the participants take a significant amount of time before they fixate on any specific element, starting from the middle of the page, confirming center bias (Tatler, 2007; Buswell, 1935; Foulsham and Underwood, 2008). Based on a Kruskal-Wallis test (McKight and Najab, 2010) there are statistically significant differences in the TTFF across the three feature categories (p-value ); however, the difference between TTFF on product description and the two other features is more noticeable which could be due to the complexity of scanning the textual information.333Keep in mind that we instructed users to carefully examine the products.
The average fixation count (see Figure 4b) is also significantly higher (Kruskal-Wallis test, p-value ) for product description (6.55 times) compared to price (1.03 times) and image (0.94 times), suggesting that once users engage with detailed text, they tend to revisit or focus on these areas more frequently, potentially reflecting a deeper cognitive processing or evaluation.
Consistent with the fixation count, users spend significantly more time (Kruskal-Wallis test, p-value ) on product description (1,939 ms) than on price (600 ms) or image (561 ms) (see Figure 4c). This indicates that detailed textual information holds user attention longer.
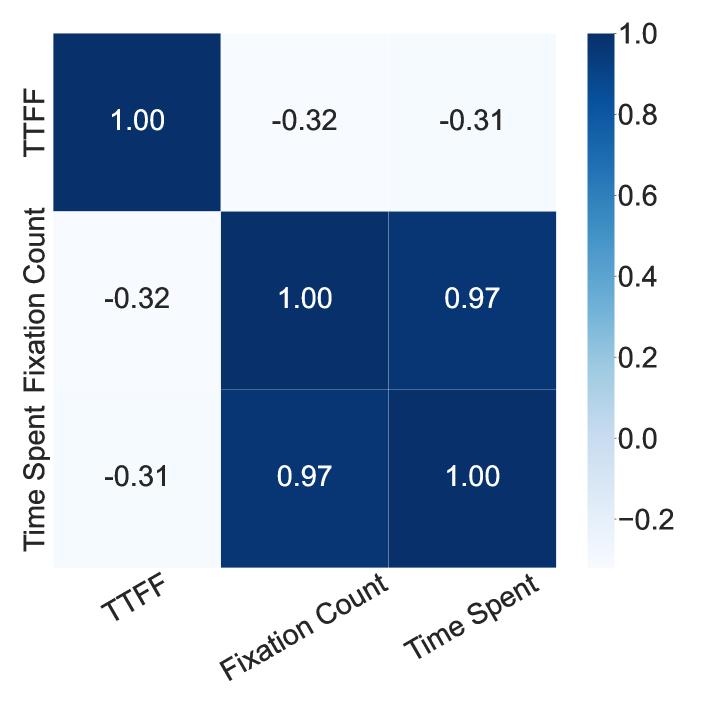
Moreover, we conducted a correlation analysis between different eye-tracking metrics to see if items that capture attention faster also tend to engage users for longer. Figure 5 shows the results. The fixation count and total time spent on different AOIs demonstrated a strong correlation (r = 0.80), suggesting that areas that attract more fixations typically engage users for longer duration. This relationship highlights the engagement potential of product description over image or price.
Positional impact analysis
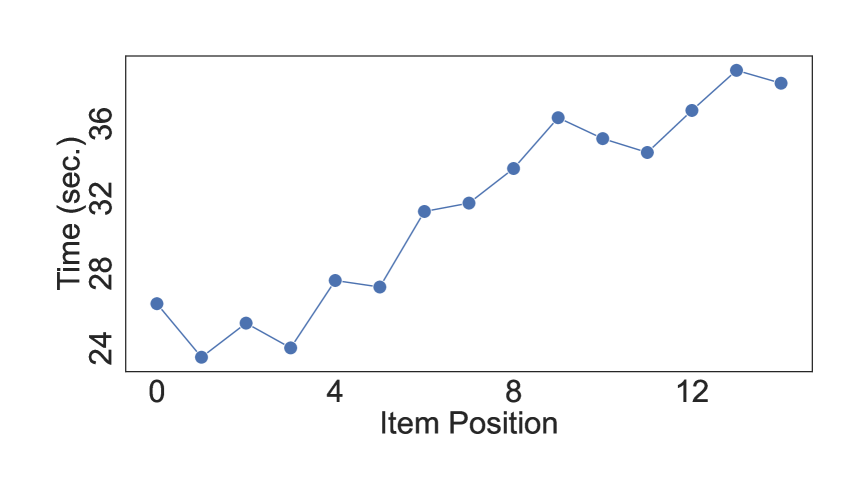
To understand how the position of an item within a product list affects user interaction, we analyzed TTFF, fixation count, and total time spent based on the item’s position in the list. Figure 6a shows that TTFF tends to increase with the position of the item in the list as expected, indicating that users examine the list from top to bottom, and items later in the list take longer to attract the initial fixation.
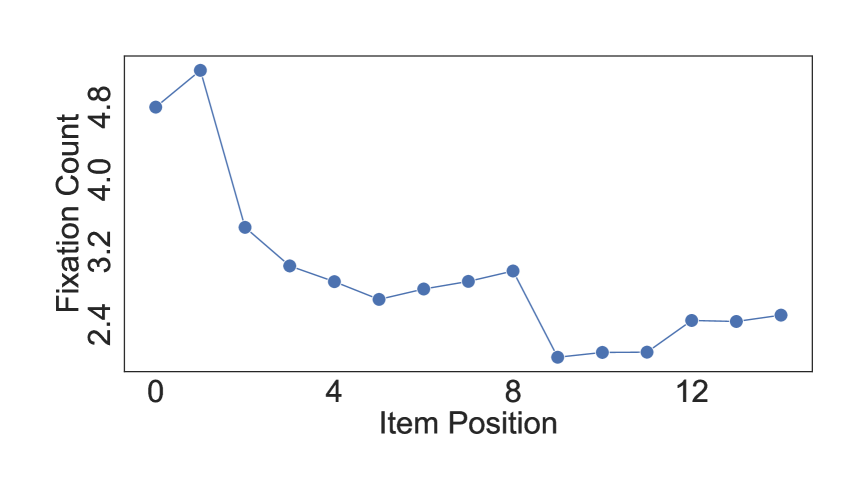
The number of fixations generally decreases from the start towards the middle of the list and slightly increases towards the end (see Figure 6b). This pattern could be influenced by how users scan the page, possibly scanning more quickly through middle items after initially examining the first few items more thoroughly.
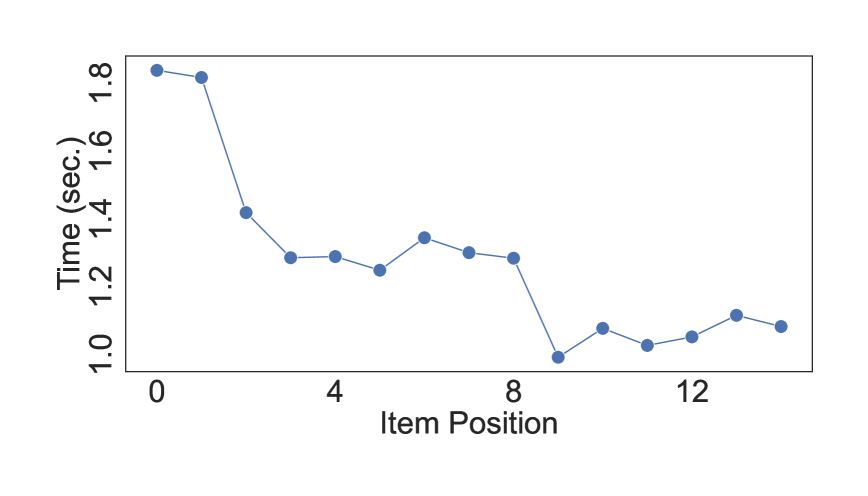
Similar to fixation count, the total time spent also decreases through the list, with the least amount of time spent around the middle of the list (see Figure 6c). This suggests less engagement with items as users move through the list.
In general, these trends indicate that position affects how users interact with items in a product list. Items placed at the beginning of the list are likely to capture attention faster and engage users more than those placed in the middle or bottom of the list.
4.3.3. Eye-tracking Task II
To answer RQ2 we investigate how outlier product features impact the visibility of products in search result lists. This section reports on the findings related to how different features, when presented as outliers, affect visual attention across different list positions. We answer the following sub questions to address RQ2:
-
RQ2-1
How do outlier features in product lists influence the initial user attention?
-
RQ2-2
What is the impact of outlier features on user engagement?
RQ2-1
We examined how the presence of outlier features in product lists affects initial user attention. Specifically, we focus on TTFF to understand whether products with outlier features attract attention faster.
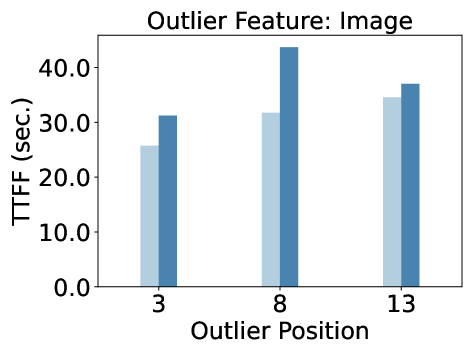
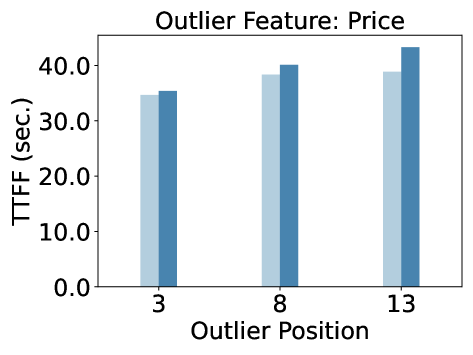
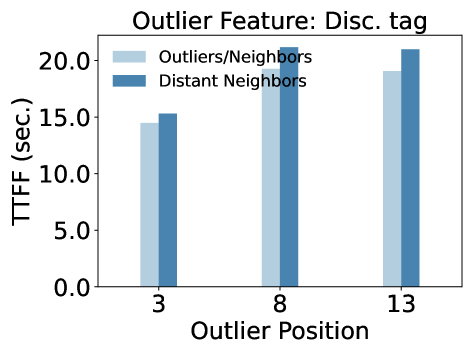
Previous work shows that both outliers and their close neighbors attract user attention faster (Sarvi et al., 2022a); therefore, to answer RQ2-1, we compared TTFF for products with outlier features and their immediate neighbors against more distant neighbors. Immediate neighbors are defined as the products immediately preceding and following the outlier, while distant neighbors are those either before or after the immediate neighbors. We analyzed this setup across the outlier features (image, price, discount tag) and different product positions (3, 8, 13).
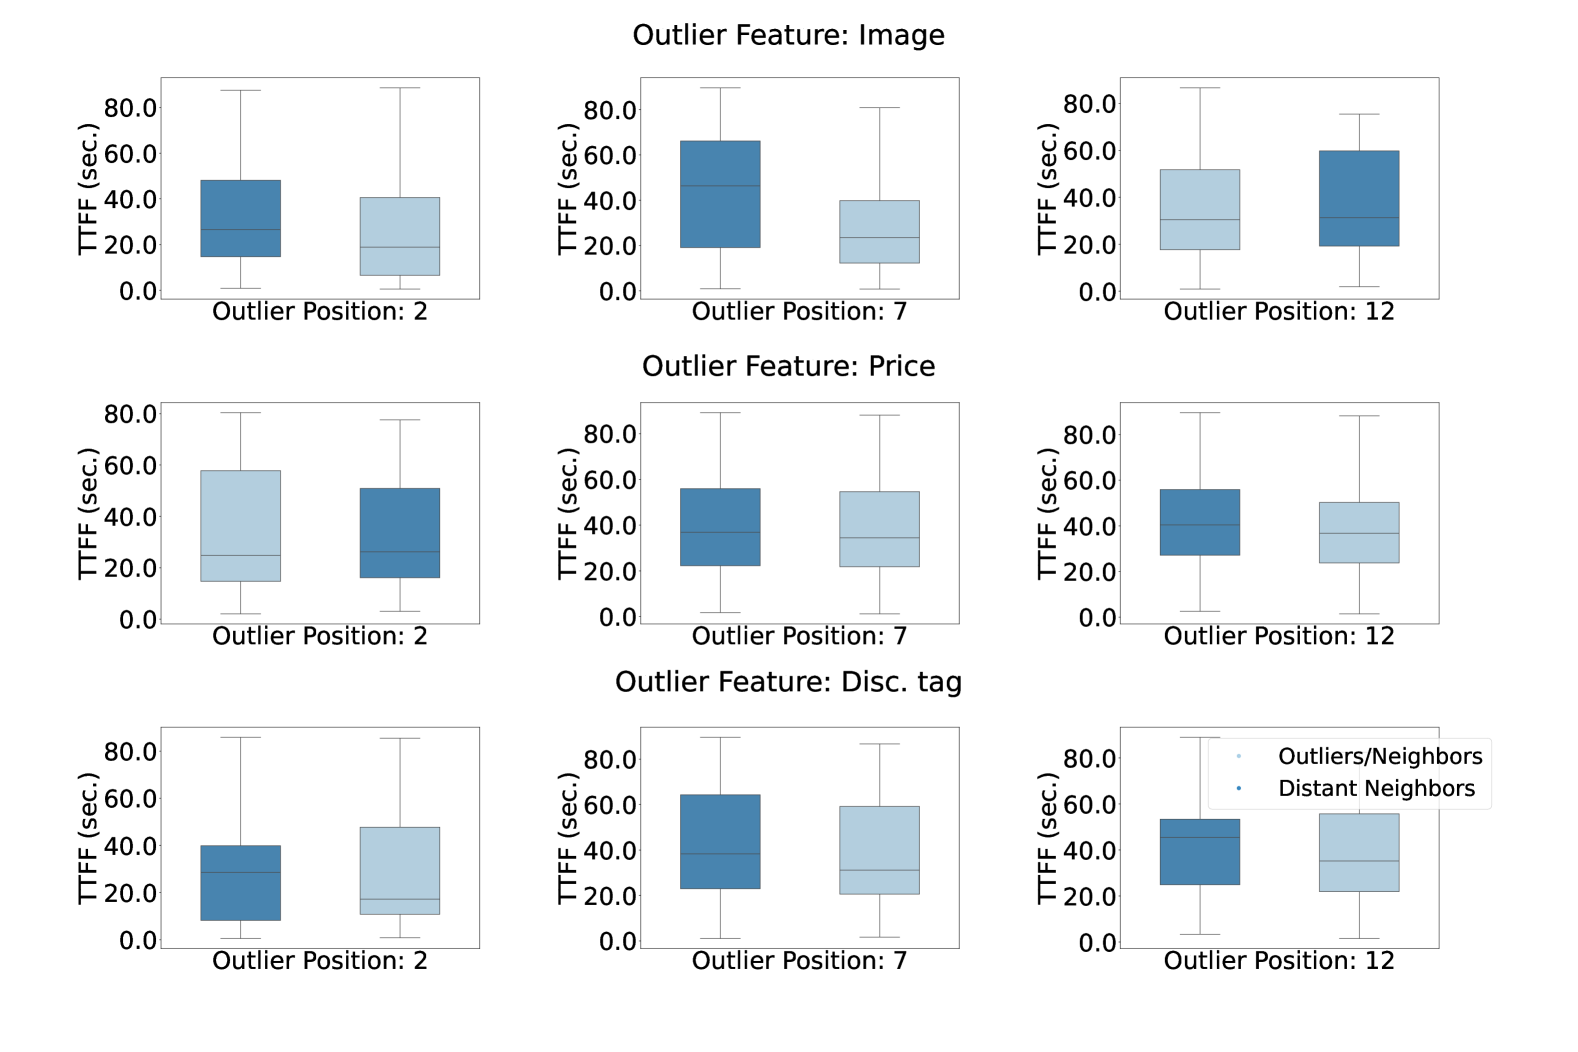
For image outliers, Figure 7a shows that outliers and their immediate neighbors at all positions generally exhibit a lower mean TTFF compared to distant neighbors, indicating quicker attention capture ( vs. for position 3, vs. for position 8 and vs. for position 13). Similar trends are observed with price and discount tag features (see Figure 7b and Figure 7c), where outliers and their immediate neighbors consistently show lower TTFF compared to distant neighbors, although differences were less pronounced compared to image features. A Kruskal-Wallis test shows statistically significant differences between TTFF of the two groups among different outlier features and positions with p-value . Figure 8 details the distribution and range of TTFF values.
Our results confirm that outlier features not only draw attention more quickly but also potentially increase the exposure of their adjacent items. This effect is consistent across different types of features and various positions within the list.
RQ2-2
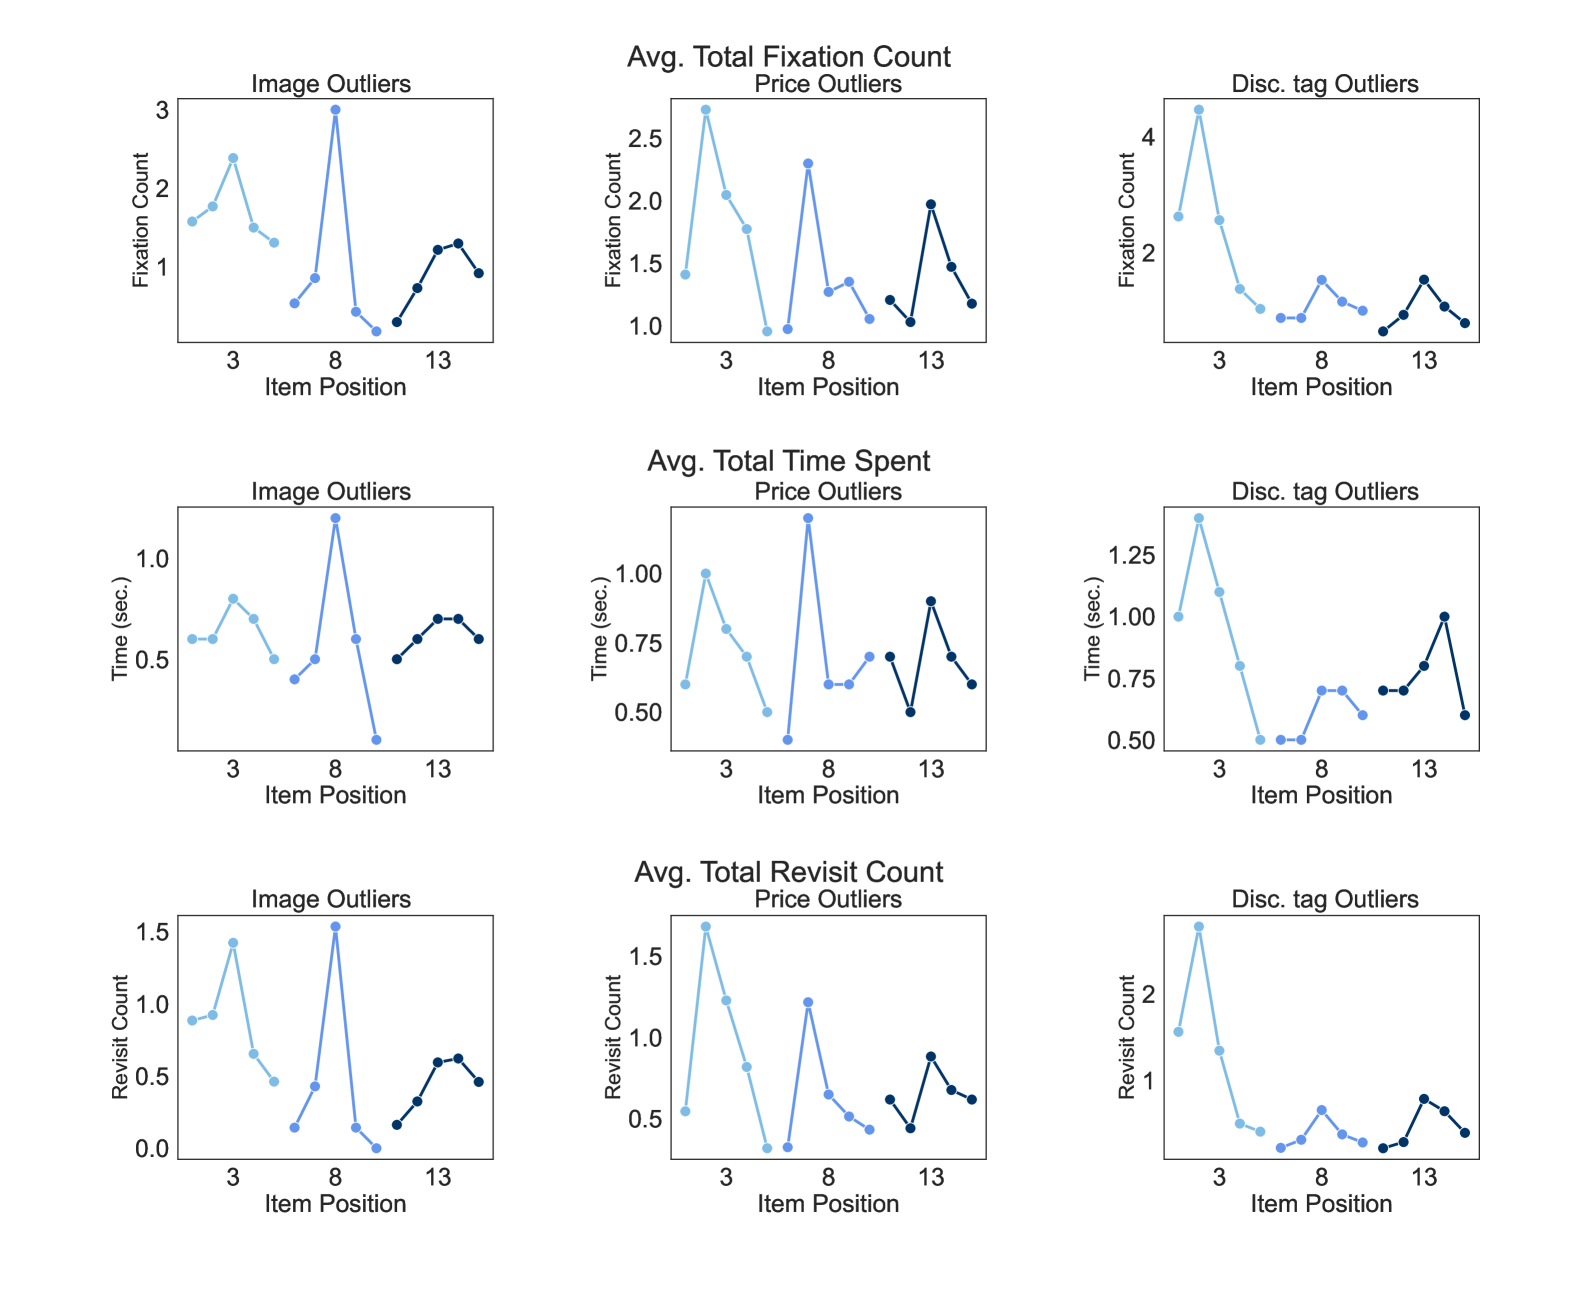
To address RQ2-2, we analyze how outlier features influence user engagement by examining metrics such as total fixation count, time spent and revisit counts. These metrics help us understand not just the initial attention (as explored in RQ2-1) but also the sustained interest and engagement. Figure 9 depicts the average values of these metrics calculated over all users for different features, outlier positions, their immediate and more distant neighbors.
Starting with the total fixation count, we observe peaks at positions 3, 8, and 13 for image outliers, indicating significant engagement at all positions, but particularly strong at position 8 where the average fixation count reaches . This suggests that image outliers, regardless of their position, tend to draw consistent attention, with a focus on the middle of the list.
Price outliers show similar peaks at these positions with the highest at position 3 (), indicating that price outliers at the start of the list may capture slightly more attention than those later, possibly due to immediate price evaluation when beginning the list browsing.
Discount tag outliers exhibit the highest fixation count at the start of the list (position 3 with a count of about 4), with noticeable decreases thereafter. This highlights that discount tags catch the eye quickly, possibly due to the initial scanning behavior of users.
The two other metrics, time spent and revisit counts, follow the same trends for different variants, emphasizing that outlier items and their immediate neighbors not only capture user attention faster than other items in the list, but also receive more exposure and user engagement.
4.3.4. Comparison and upshot
The Itti & Koch and GBVS models predict attention hotspots using visual features like color, contrast, and size. The Itti & Koch model provides a more evenly distributed attention pattern, recognizing areas with notable visual differences without intense focus on a single point. In contrast, the GBVS model highlights prominent anomalies with strong visual contrasts, successfully identifying image, and price outliers due to their unique visual characteristics.
However, these models fail to consistently detect outliers in the product lists. This limitation can be attributed to the fact that the models only rely on the bottom-up factors, which has two main implications. First, the models see the whole list as one picture. For instance, in our experiments, the diverse colors in the monitor list distracted the model from the red tag (see Figure 3f), while the uniform dark colors in the chair list made small price variations more noticeable.
Second, the models ignore the top-down factors such as users’ sensitivity to discounts or their tendency to compare specific features like discount tags across products. The models cannot compare any specific features across different products.
Observations from our eye-tracking Task I support the top-down factors at play. Specifically, users engaged more with product descriptions, which, despite being less visually attractive, held significant attention in terms of both TTFF (that can also be explained by center bias) and sustained engagement (see Figure 4). This engagement with detailed information highlights the importance of user intent, something that visual saliency models do not account for.
The empirical results from our second eye-tracking experiment provide a more comprehensive understanding of user attention and engagement in the presence of outliers. The experiments confirmed that outliers capture attention quickly, as evidenced by lower TTFF for outliers compared to distant neighbors. Eye-tracking data also revealed that users engaged with these outliers for longer durations, providing insights into sustained engagement that visual saliency models fail to capture.
In conclusion, our observations suggest that visual saliency models are effective in predicting initial visual attraction based on basic visual properties. They are useful for quick, preliminary assessments and designing visually appealing interfaces. However, their reliance on the bottom-up factors limits their applicability in fully understanding user behavior in complex, real-world scenarios. In contrast, eye-tracking experiments, while more resource-intensive, provide comprehensive insights into both initial attention and sustained engagement. They account for top-down factors, capturing real-world user interactions more accurately.
5. Discussion & Conclusion
5.1. Research problem and objectives
In this study, we explored how different presentational features influence the perception of outliers in e-commerce search results through a two-stage approach.
We designed the initial visual search experiments to explore how features such as price, star rating, and discount tags affect users’ ability to identify outliers. These experiments provided initial insights into the immediate observability of these features and the impact of visual complexity on user perception.
Building on these preliminary findings, our subsequent eye-tracking experiments aimed to validate and extend our understanding by observing user behavior in a more realistic simulated e-commerce environment. These experiments measured actual user attention and engagement, providing a more comprehensive view of how outlier features capture and sustain attention in real-world-like scenarios. We also incorporated visual saliency analysis to predict which product features would naturally attract attention due to their visual properties. This analysis served as a benchmark to compare with empirical eye-tracking data, allowing us to understand the interplay between bottom-up visual factors and top-down cognitive factors in shaping user attention during online shopping.
5.2. Main findings
Our initial visual search experiments suggest that visual complexity of a feature affects item outlierness. The visual saliency models confirm this observation by consistently highlighting areas with strong visual contrasts, distinct colors, and complex patterns as attention hotspots. This is expected since these algorithms work based on bottom-up visual factors. Moreover, Figure 7 shows that, averaged over all outlier positions, TTFF is the lowest for image outliers, followed by discount tags, and the highest for price outliers (, , and , respectively). Although the product lists used in the eye-tracking experiments were different, the overall trend is in line with our observations from visual search experiments.
Additionally, our observations emphasize that one should be cautious about the limitations of visual saliency models in such contexts. As mentioned, visual saliency models only rely on bottom-up factors, making them naive in that they do not distinguish between separate product features or comparing them against each other, instead they analyze the entire image and highlight areas that stand out based on overall visual complexity. Therefore, in lists with colorful and complex product images, the models might miss an obvious outlier such as a unique discount tag, while detecting a subtle visual difference made by a higher price in a list with uniform dark colors.
Moreover, our eye-tracking Task I suggests that despite being less visually attractive, product descriptions captured attention more quickly, indicating the importance of the top-down factors and other factors in play like center bias. This is evident by a lower TTFF for product descriptions in Figure 4a followed by more revisits and time spent on these areas, reflecting deeper cognitive engagement (see Figures 4b and 4c).
In Task II of our eye-tracking study, we examined how outlier product features influence visibility in search result lists. The results indicated that outliers and their immediate neighbors attracted attention faster (in terms of TTFF) and engaged users for longer durations (in terms of fixation count and time spent) compared to distant items. This effect was consistent across different outlier features (image, price, discount tag) and various positions within the list.
Overall, our findings from visual search, visual saliency models, and eye-tracking experiments emphasize the dual role of visual and cognitive factors in shaping user attention. Visual saliency models effectively predict initial visual attraction based on bottom-up factors, while eye-tracking data provides comprehensive insights into sustained engagement driven by the top-down factors. These insights can inform the design of more effective and engaging e-commerce interfaces by optimizing the presentation of key product features to capture and maintain user attention.
5.3. Limitations and future work
Although our work provides insights into how different features contribute to the outlierness of an item, it does not directly estimate outlier feature exposure, which is influenced by various user behaviors and platform-specific algorithms not covered in this study. We focused on common presentational features, but item presentation can vary significantly among e-commerce platforms. Additionally, we limited our study to list view presentations, while findings might differ in grid views or other layouts. Lastly, our online eye-tracking data collection introduces potential noise from technical and environmental factors that are out of our control.
Future work should focus on quantifying and generalizing the impact of different visual attributes on item outlierness to understand their broader implications. Additionally, developing models that predict areas of attention by integrating both top-down and bottom-up factors could be highly beneficial. Using eye-tracking data as training inputs for visual saliency maps tailored to the e-commerce domain could enhance these models’ accuracy and applicability.
Resources
To facilitate reproducibility of the work in this paper, all code and parameters are shared at https://github.com/arezooSarvi/outlier-visual-saliency.
Acknowledgements.
This research was supported by Ahold Delhaize, the Hybrid Intelligence Center, a 10-year program funded by the Dutch Ministry of Education, Culture and Science through the Netherlands Organisation for Scientific Research, https://hybrid-intelligence-centre.nl, project nr. 024.004.022, project LESSEN with project number NWA.1389.20.183 of the research program NWA ORC 2020/21, which is (partly) financed by the Dutch Research Council (NWO), project ROBUST with project number KICH3.LTP.20.006, which is (partly) financed by the Dutch Research Council (NWO), DPG Media, RTL, and the Dutch Ministry of Economic Affairs and Climate Policy (EZK) under the program LTP KIC 2020-2023, and the FINDHR (Fairness and Intersectional Non-Discrimination in Human Recommendation) project that received funding from the European Union’s Horizon Europe research and innovation program under grant agreement No 101070212, All content represents the opinion of the authors, which is not necessarily shared or endorsed by their respective employers and/or sponsors. We would like to thank Shubha Guha for her valuable contributions to the preparation and execution of the experiments in this work.Appendix A Appendix


A.1. Task instructions
In the following, we provide the instructions that were shared with participants on the Prolific platform for our experiments:
In this task, you’ll review some product lists on an online shopping website (Bol.com). You’ll explore a specific category, like smartphones, shoes, or backpacks, as if you’re planning to make a purchase.
We require access to your webcam to record your eye movements as you review the product lists. Please be assured that we will only record eye movements on the product list pages, and your personal or private data will not be recorded or accessed in any way.
Please carefully examine all the products on the page. We’ll ask questions about your observations afterward, such as:
-
•
Describe what you saw on the list briefly, e.g., price range, item types.
-
•
Note if you observed a specific gender focus or prominent colors.
-
•
List any brands you noticed.
-
•
Recommend one item for purchase and explain why.
-
•
Mention anything that caught your attention.
Your answers can be in English or Dutch. IMPORTANT: You MUST answer the post-task questions about the content of the lists accurately, otherwise we CANNOT ACCEPT your submission.
References
- (1)
- Agarwal et al. (2019) Aman Agarwal, Xuanhui Wang, Cheng Li, Michael Bendersky, and Marc Najork. 2019. Addressing Trust Bias for Unbiased Learning-to-rank. In WWW. 4–14.
- Aggarwal and Vaidyanathan (2016) Praveen Aggarwal and Rajiv Vaidyanathan. 2016. Is Font Size a Big Deal? A Transaction–Acquisition Utility Perspective on Comparative Price Promotions. Journal of Consumer Marketing (2016).
- Ariely and Berns (2010) Dan Ariely and Gregory S Berns. 2010. Neuromarketing: The Hope and Hype of Neuroimaging in Business. Nature Reviews Neuroscience 11, 4 (2010), 284–292.
- Azzopardi (2021) Leif Azzopardi. 2021. Cognitive Biases in Search: A Review and Reflection of Cognitive Biases in Information Retrieval. In CHIIR. ACM, 27–37.
- Biega et al. (2018) Asia J. Biega, Krishna P. Gummadi, and Gerhard Weikum. 2018. Equity of Attention: Amortizing Individual Fairness in Rankings. In SIGIR. 405–414.
- Brandl et al. (2024) Stephanie Brandl, Oliver Eberle, Tiago Ribeiro, Anders Søgaard, and Nora Hollenstein. 2024. Evaluating Webcam-based Gaze Data as an Alternative for Human Rationale Annotations. arXiv preprint arXiv:2402.19133 (2024).
- Buswell (1935) Guy Thomas Buswell. 1935. How People Look at Pictures: A Study of the Psychology and Perception in Art. Univ. Chicago Press.
- Chiang and Dholakia (2003) Kuan-Pin Chiang and Ruby Roy Dholakia. 2003. Factors Driving Consumer Intention to Shop Online: an Empirical Investigation. Journal of Consumer Psychology 13, 1-2 (2003), 177–183.
- Chocarro Eguaras et al. (2022) Raquel Chocarro Eguaras, Mónica Cortiñas Ugalde, and Arantxa Villanueva Larre. 2022. Attention to Product Images in an Online Retailing Store: An Eye-tracking Study Considering Consumer Goals and Type of Product. Journal of Electronic Commerce Research 23 (4), 257-281 (2022).
- Diaz et al. (2020) Fernando Diaz, Bhaskar Mitra, Michael D. Ekstrand, Asia J. Biega, and Ben Carterette. 2020. Evaluating Stochastic Rankings with Expected Exposure. In CIKM. 275–284.
- Duncan and Humphreys (1989) John Duncan and Glyn W. Humphreys. 1989. Visual Search and Stimulus Similarity. Psychological Review 96, 3 (1989), 433.
- EStimator (1999) Determinant EStimator. 1999. A Fast Algorithm for the Minimum Covariance. Technometrics 41, 3 (1999), 212.
- Fazio et al. (2020) Marco Fazio, Antonella Reitano, and Monica Rosa Loizzo. 2020. Consumer Preferences for New Products: Eye Tracking Experiment on Labels and Packaging for Olive Oil based Dressing. In Proceedings, Vol. 70. MDPI.
- Federico and Brandimonte (2019) Giovanni Federico and María A. Brandimonte. 2019. Tool and Object Affordances: An Ecological Eye-tracking Study. Brain and Cognition 135 (2019), 103582.
- Fiedler et al. (2020) Susann Fiedler, Michael Schulte-Mecklenbeck, Frank Renkewitz, and Jacob L. Orquin. 2020. Guideline for Reporting Standards of Eye-tracking Research in Decision Sciences. PsyArXiv (2020).
- Foulsham and Underwood (2008) Tom Foulsham and Geoffrey Underwood. 2008. What Can Saliency Models Predict About Eye Movements? Spatial and Sequential Aspects of Fixations during Encoding and Recognition. Journal of Vision 8, 2 (2008), 6–6.
- Giovannangeli et al. (2022) Loann Giovannangeli, Romain Bourqui, Romain Giot, and David Auber. 2022. Color and Shape Efficiency for Outlier Detection from Automated to User Evaluation. Visual Informatics (2022).
- Haldar et al. (2024) Malay Haldar, Hongwei Zhang, Kedar Bellare, Sherry Chen, Soumyadip Banerjee, Xiaotang Wang, Mustafa Abdool, Huiji Gao, Pavan Tapadia, Liwei He, et al. 2024. Learning to Rank for Maps at Airbnb. arXiv preprint arXiv:2407.00091 (2024).
- Harel et al. (2006) Jonathan Harel, Christof Koch, and Pietro Perona. 2006. Graph-based Visual Saliency. Advances in Neural Information Processing Systems 19 (2006).
- Huang et al. (2014) Liqiang Huang, Chuan-Hoo Tan, Weiling Ke, and Kwok-Kee Wei. 2014. Do We Order Product Review Information Display? How? Information & Management 51, 7 (2014), 883–894.
- Itti (2007) Laurent Itti. 2007. Visual Salience. Scholarpedia 2, 9 (2007), 3327.
- Itti et al. (1998) Laurent Itti, Christof Koch, and Ernst Niebur. 1998. A Model of Saliency-based Visual Attention for Rapid Scene Analysis. IEEE Transactions on Pattern Analysis and Machine Intelligence 20, 11 (1998), 1254–1259.
- Jin et al. (2006) Wen Jin, Anthony KH Tung, Jiawei Han, and Wei Wang. 2006. Ranking outliers using symmetric neighborhood relationship. In Advances in Knowledge Discovery and Data Mining: 10th Pacific-Asia Conference, PAKDD 2006, Singapore, April 9-12, 2006. Proceedings 10. Springer, 577–593.
- Joachims et al. (2005) Thorsten Joachims, Laura Granka, Bing Pan, Helene Hembrooke, and Geri Gay. 2005. Accurately Interpreting Clickthrough Data as Implicit Feedback. In SIGIR. 154–161.
- Joachims et al. (2017) Thorsten Joachims, Adith Swaminathan, and Tobias Schnabel. 2017. Unbiased Learning-to-rank with Biased Feedback. In WSDM. 781–789.
- Kao et al. (2020) Karen C. Kao, Sally Rao Hill, and Indrit Troshani. 2020. Effects of Cue Congruence and Perceived Cue Authenticity in Online Group Buying. Internet Research (2020).
- Kim and Lennon (2008) Minjeong Kim and Sharron Lennon. 2008. The Effects of Visual and Verbal Information on Attitudes and Purchase Intentions in Internet Shopping. Psychology & Marketing 25, 2 (2008), 146–178.
- Kittur et al. (2008) Aniket Kittur, Ed H. Chi, and Bongwon Suh. 2008. Crowdsourcing User Studies with Mechanical Turk. In Proceedings of the 2008 Conference on Human Factors in Computing Systems, CHI. ACM, 453–456.
- Lee and Hosanagar (2021) Dokyun Lee and Kartik Hosanagar. 2021. How Do Product Attributes and Reviews Moderate the Impact of Recommender Systems through Purchase Stages? Management Science 67, 1 (2021), 524–546.
- Leiva et al. (2020) Luis A. Leiva, Yunfei Xue, Avya Bansal, Hamed R. Tavakoli, Tuðçe Köroðlu, Jingzhou Du, Niraj R. Dayama, and Antti Oulasvirta. 2020. Understanding Visual Saliency in Mobile User Interfaces. In 22nd International Conference on Human-Computer Interaction with Mobile Devices and Services. 1–12.
- Levin et al. (2003) Aron M. Levin, Irwin R. Levin, and C. Edward Heath. 2003. Product Category Dependent Consumer Preferences for Online and Offline Shopping Features and their Influence on Multi-channel Retail Alliances. Journal of Electronic Commerce Research 4, 3 (2003), 85–93.
- Lewandowski and Kammerer (2021) Dirk Lewandowski and Yvonne Kammerer. 2021. Factors Influencing Viewing Behaviour on Search Engine Results Pages: A Review of Eye-tracking Research. Behaviour & Information Technology 40, 14 (2021), 1485–1515.
- Li et al. (2020) Zheng Li, Yue Zhao, Nicola Botta, Cezar Ionescu, and Xiyang Hu. 2020. COPOD: copula-based outlier detection. In 2020 IEEE international conference on data mining (ICDM). IEEE, 1118–1123.
- Lu and Lim (2012) Shijian Lu and Joo-Hwee Lim. 2012. Saliency Modeling from Image Histograms. In Computer Vision–ECCV 2012: 12th European Conference on Computer Vision, Florence, Italy, October 7-13, 2012, Proceedings, Part VII 12. Springer, 321–332.
- Luan et al. (2016) Jing Luan, Zhong Yao, FuTao Zhao, and Hao Liu. 2016. Search Product and Experience Product Online Reviews: An Eye-tracking Study on Consumers’ Review Search Behavior. Computers in Human Behavior 65 (2016), 420–430.
- Majeed et al. (2023) Nadyanna M Majeed, Yi Jing Chua, Meenakshi Kothari, Manmeet Kaur, Frosch YX Quek, Matthew HS Ng, Wee Qin Ng, and Andree Hartanto. 2023. Anxiety Disorders and Executive Functions: A Three-level Meta-analysis of Reaction Time and Accuracy. Psychiatry Research Communications 3, 1 (2023), 100100.
- McElree and Carrasco (1999) Brian McElree and Marisa Carrasco. 1999. The Temporal Dynamics of Visual Search: Evidence for Parallel Processing in Feature and Conjunction Searches. Journal of Experimental Psychology: Human Perception and Performance 25, 6 (1999), 1517.
- McKight and Najab (2010) Patrick E McKight and Julius Najab. 2010. Kruskal-wallis test. The Corsini Encyclopedia of Psychology (2010), 1–1.
- Mehrotra et al. (2018) Rishabh Mehrotra, James McInerney, Hugues Bouchard, Mounia Lalmas, and Fernando Diaz. 2018. Towards a Fair Marketplace: Counterfactual Evaluation of the Trade-off between Relevance, Fairness & Satisfaction in Recommendation Systems. In CIKM. 2243–2251.
- Morik et al. (2020) Marco Morik, Ashudeep Singh, Jessica Hong, and Thorsten Joachims. 2020. Controlling Fairness and Bias in Dynamic Learning-to-rank. In SIGIR. 429–438.
- Müller-Plath and Pollmann (2003) Gisela Müller-Plath and Stefan Pollmann. 2003. Determining Subprocesses of Visual Feature Search with Reaction Time Models. Psychological Research 67 (2003), 80–105.
- Murali and Çöltekin (2021) Madhumitha Murali and Arzu Çöltekin. 2021. Conducting Eye Tracking Studies Online. In Proceedings of the Workshop on Adaptable Research Methods for Empirical Research with Map Users, Virtual Workshop, Vol. 6.
- Nelson (1970) Phillip Nelson. 1970. Information and Consumer Behavior. Journal of Political Economy 78, 2 (1970), 311–329.
- Novin and Meyers (2017) Alamir Novin and Eric M. Meyers. 2017. Making Sense of Conflicting Science Information: Exploring Bias in the Search Engine Result Page. In CHIIR. ACM, 175–184.
- Ovaisi et al. (2020) Zohreh Ovaisi, Ragib Ahsan, Yifan Zhang, Kathryn Vasilaky, and Elena Zheleva. 2020. Correcting for Selection Bias in Learning-to-rank Systems. In WWW. 1863–1873.
- Palmer et al. (2011) Evan M. Palmer, Todd S. Horowitz, Antonio Torralba, and Jeremy M. Wolfe. 2011. What Are the Shapes of Response Time Distributions in Visual Search? Journal of Experimental Psychology: Human Perception and Performance 37, 1 (2011), 58.
- Papoutsaki et al. (2016) Alexandra Papoutsaki, Patsorn Sangkloy, James Laskey, Nediyana Daskalova, Jeff Huang, and James Hays. 2016. WebGazer: Scalable Webcam Eye Tracking Using User Interactions. In Proceedings of the Twenty-Fifth International Joint Conference on Artificial Intelligence-IJCAI 2016.
- Ramaswamy et al. (2000) Sridhar Ramaswamy, Rajeev Rastogi, and Kyuseok Shim. 2000. Efficient algorithms for mining outliers from large data sets. In Proceedings of the 2000 ACM SIGMOD international conference on Management of data. 427–438.
- Sapiezynski et al. (2019) Piotr Sapiezynski, Wesley Zeng, Ronald E. Robertson, Alan Mislove, and Christo Wilson. 2019. Quantifying the Impact of User Attention on Fair Group Representation in Ranked Lists. In WWW. 553–562.
- Sarvi et al. (2022a) Fatemeh Sarvi, Maria Heuss, Mohammad Aliannejadi, Sebastian Schelter, and Maarten de Rijke. 2022a. Understanding and Mitigating the Effect of Outliers in Fair Ranking. In WSDM. 861–869.
- Sarvi et al. (2022b) Fatemeh Sarvi, Maria Heuss, Mohammad Aliannejadi, Sebastian Schelter, and Maarten de Rijke. 2022b. Understanding and mitigating the effect of outliers in fair ranking. In Proceedings of the Fifteenth ACM International Conference on Web Search and Data Mining. 861–869.
- Sarvi et al. (2023) Fatemeh Sarvi, Ali Vardasbi, Mohammad Aliannejadi, Sebastian Schelter, and Maarten de Rijke. 2023. On the Impact of Outlier Bias on User Clicks. In SIGIR 2023: 46th international ACM SIGIR Conference on Research and Development in Information Retrieval. ACM, 18–27.
- Schölkopf et al. (2001) Bernhard Schölkopf, John C Platt, John Shawe-Taylor, Alex J Smola, and Robert C Williamson. 2001. Estimating the support of a high-dimensional distribution. Neural computation 13, 7 (2001), 1443–1471.
- Schwager and Meyer (2007) Andre Schwager and Christopher Meyer. 2007. Understanding Customer Experience. Harvard Business Review 85, 2 (2007), 116.
- Shen et al. (2003) Jiye Shen, Eyal M. Reingold, and Marc Pomplun. 2003. Guidance of Eye Movements during Conjunctive Visual Search: The Distractor-ratio Effect. Canadian Journal of Experimental Psychology/Revue Canadienne de Psychologie Expérimentale 57, 2 (2003), 76.
- Shi et al. (2013) Savannah Wei Shi, Michel Wedel, and Rik Pieters. 2013. Information Acquisition During Online Decision Making: A Model-based Exploration Using Eye-tracking Data. Management Science 59, 5 (2013), 1009–1026.
- Singh and Joachims (2018) Ashudeep Singh and Thorsten Joachims. 2018. Fairness of Exposure in Rankings. In KDD. 2219–2228.
- Singh and Joachims (2019) Ashudeep Singh and Thorsten Joachims. 2019. Policy Learning for Fairness in Ranking. In NeurIPS. 5426–5436.
- Tatler (2007) Benjamin W. Tatler. 2007. The Central Fixation Bias in Scene Viewing: Selecting an Optimal Viewing Position Independently of Motor Biases and Image Feature Distributions. Journal of Vision 7, 14 (2007), 4–4.
- Treisman (1988) Anne Treisman. 1988. Features and objects: The fourteenth Bartlett memorial lecture. The Quarterly Journal of Experimental Psychology Section A 40, 2 (1988), 201–237.
- Treisman and Gelade (1980) Anne M. Treisman and Garry Gelade. 1980. A Feature-integration Theory of Attention. Cognitive Psychology 12, 1 (1980), 97–136.
- Tupikovskaja-Omovie and Tyler (2021) Zofija Tupikovskaja-Omovie and David Tyler. 2021. Eye Tracking Technology to Audit Google Analytics: Analysing Digital Consumer Shopping Journey in Fashion M-retail. International Journal of Information Management 59 (2021), 102294.
- Vardasbi et al. (2020) Ali Vardasbi, Harrie Oosterhuis, and Maarten de Rijke. 2020. When Inverse Propensity Scoring does not Work: Affine Corrections for Unbiased Learning to Rank. In CIKM. 1475–1484.
- Veale et al. (2017) Richard Veale, Ziad M. Hafed, and Masatoshi Yoshida. 2017. How is Visual Salience Computed in the Brain? Insights from Behaviour, Neurobiology and Modelling. Philosophical Transactions of the Royal Society B: Biological Sciences 372, 1714 (2017), 20160113.
- Wang et al. (2019) Hongzhi Wang, Mohamed Jaward Bah, and Mohamed Hammad. 2019. Progress in outlier detection techniques: A survey. Ieee Access 7 (2019), 107964–108000.
- Wang et al. (2014) Qiuzhen Wang, Sa Yang, Manlu Liu, Zike Cao, and Qingguo Ma. 2014. An Eye-tracking Study of Website Complexity from Cognitive Load Perspective. Decision Support Systems 62 (2014), 1–10.
- Weathers et al. (2007) Danny Weathers, Subhash Sharma, and Stacy L. Wood. 2007. Effects of Online Communication Practices on Consumer Perceptions of Performance Uncertainty for Search and Experience Goods. Journal of Retailing 83, 4 (2007), 393–401.
- Wisiecka et al. (2022) Katarzyna Wisiecka, Krzysztof Krejtz, Izabela Krejtz, Damian Sromek, Adam Cellary, Beata Lewandowska, and Andrew Duchowski. 2022. Comparison of Webcam and Remote Eye Tracking. In 2022 Symposium on Eye Tracking Research and Applications. 1–7.
- Wolfe (1994) Jeremy M Wolfe. 1994. Guided search 2.0 a revised model of visual search. Psychonomic bulletin & review 1 (1994), 202–238.
- Wolfe (1998) Jeremy M. Wolfe. 1998. What Can 1 Million Trials Tell Us about Visual Search? Psychological Science 9, 1 (1998), 33–39.
- Wolfe (2020) Jeremy M. Wolfe. 2020. Visual Search: How Do We Find What We Are Looking For? Annual Review of Vision Science 6, 1 (2020), 539–562.
- Wolfe et al. (2010) Jeremy M Wolfe, Evan M Palmer, and Todd S Horowitz. 2010. Reaction time distributions constrain models of visual search. Vision research 50, 14 (2010), 1304–1311.
- Wu et al. (2021) Xinwei Wu, Hechang Chen, Jiashu Zhao, Li He, Dawei Yin, and Yi Chang. 2021. Unbiased Learning to Rank in Feeds Recommendation. In Proceedings of the 14th ACM International Conference on Web Search and Data Mining. 490–498.
- Yadav et al. (2019) Himank Yadav, Zhengxiao Du, and Thorsten Joachims. 2019. Policy-Gradient Training of Fair and Unbiased Ranking Functions. arXiv preprint arXiv:1911.08054 (2019).
- Yue et al. (2010) Yisong Yue, Rajan Patel, and Hein Roehrig. 2010. Beyond Position Bias: Examining Result Attractiveness as a Source of Presentation Bias in Clickthrough Data. In WWW. 1011–1018.