Can Visuo-motor Policies Benefit from Random Exploration Data?
A Case Study on Stacking
Abstract
Human demonstrations have been key to recent advancements in robotic manipulation, but their scalability is hampered by the substantial cost of the required human labor. In this paper, we focus on random exploration data—video sequences and actions produced autonomously via motions to randomly sampled positions in the workspace—as an often overlooked resource for training visuo-motor policies in robotic manipulation. Within the scope of imitation learning, we examine random exploration data through two paradigms: (a) by investigating the use of random exploration video frames with three self-supervised learning objectives—reconstruction, contrastive, and distillation losses—and evaluating their applicability to visual pre-training; and (b) by analyzing random motor commands in the context of a staged learning framework to assess their effectiveness in autonomous data collection. Towards this goal, we present a large-scale experimental study based on over 750 hours of robot data collection, comprising 400 successful and 12,000 failed episodes. Our results indicate that: (a) among the three self-supervised learning objectives, contrastive loss appears most effective for visual pre-training while leveraging random exploration video frames; (b) data collected with random motor commands may play a crucial role in balancing the training data distribution and improving success rates in autonomous data collection within this study. The source code and dataset will be made publicly available at https://cloudgripper.org.
I Introduction
Visuo-motor policies for robotic manipulation have long faced scalability challenges in collecting human demonstrations [1]. For example, RT-1 [2] required 17 months of dataset collection with a large dedicated team, and BC-Z [3] involved 7 operators working over 5 months. The high cost of human labor and reliance on teleoperation systems pose substantial barriers to data collection in new environments. This motivates us to focus on a scalable yet often overlooked data source—random exploration data, collected within the target task’s environment, which might be a potential add-on for human demonstrations. However, its lack of task-specific information and the inherent unstructured nature of such data greatly complicates its practical utilization. This leads us to investigate the following question:
Can Visuo-motor Policies Benefit from Random Exploration Data?
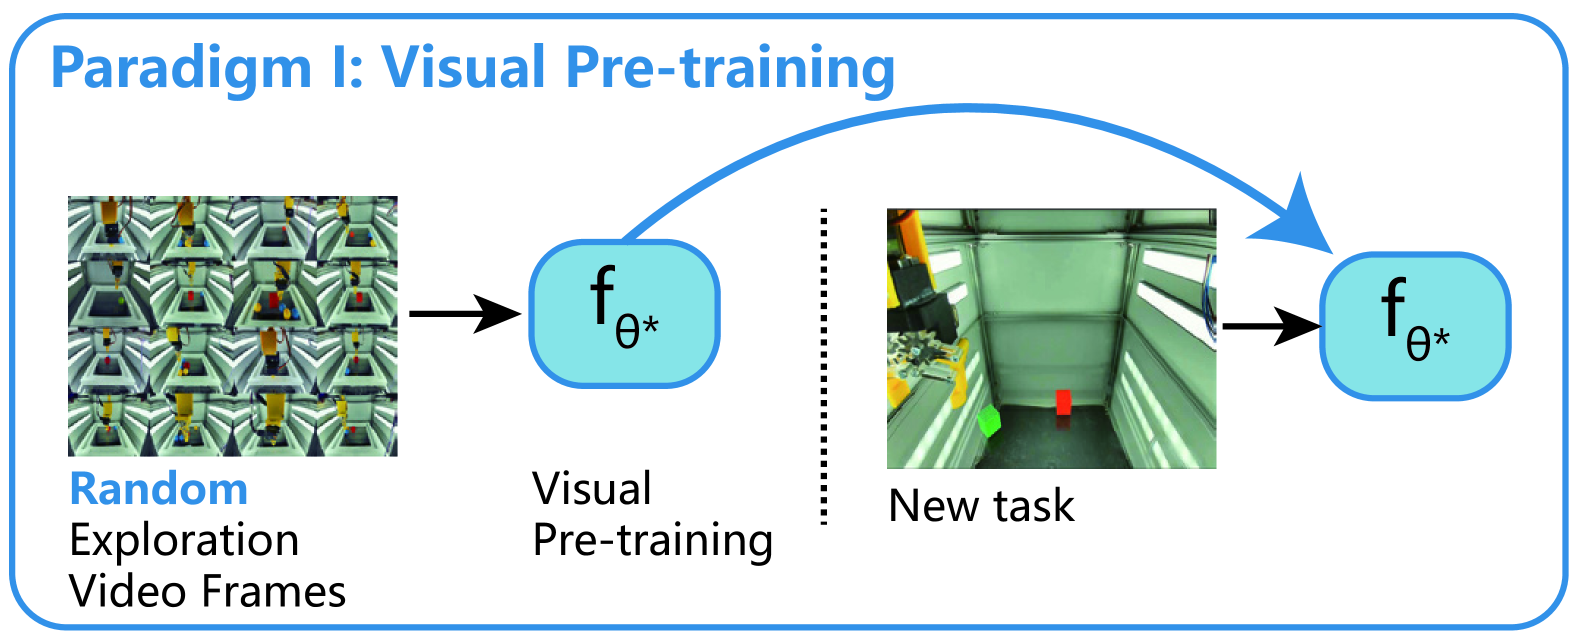
Given the absence of labeled information in random exploration video frames, one may wonder what information can still be learned from such data. One hypothesis is that certain aspects of a world model may remain learnable, including environment-object interaction, the ability to reason about visual similarities and differences, and the understanding of overall scene layout. We empirically investigate this hypothesis by training visual encoders with different objective functions from self-supervised learning, as shown in Fig. 1(a). Specifically, we use the reconstruction loss from MAE [4] to promote learning the relationships between image patches; contrastive loss from MoCo-v3 [5] to encourage the model to pull similar features closer and push dissimilar features further apart; and distillation loss from DINO [6] to encourage local-global correspondence. Random exploration video frames are then used to pre-train Vision Transformer [7] and ResNet [8] encoders with the aforementioned objectives, and their performance is compared to encoders pre-trained on large-scale computer vision datasets.
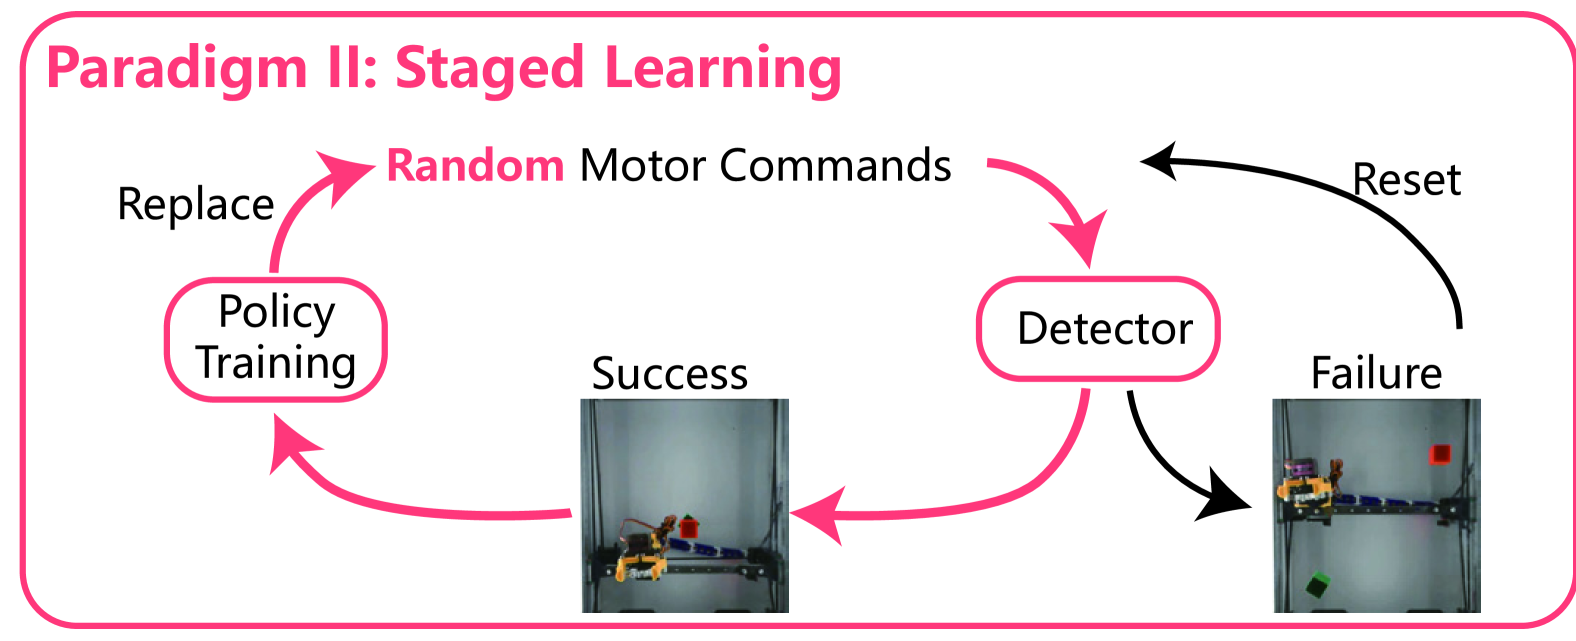
In addition to self-supervised pre-training, we explore the use of action information in random exploration data by adopting a staged learning framework [9], as shown in Fig. 1(b). While executing random motor commands, the robot arm randomly samples pick-up and drop-off positions within the workspace to generate data episodes. Episodes labeled as successful are then used to train a data collection policy for autonomous data collection in subsequent stages. This process is fully automated using CloudGripper-Autograsper [10], an error detection toolkit we designed to leverage real-time sensory data for automatic episode labeling, termination, and task resetting. The dataset, which includes 750 hours of continuous recordings of 400 successful and 12,000 failed episodes, will be open-sourced and released as CloudGripper-Stack-750. The main contributions of this work are:
-
•
We investigate the applicability of random exploration data for visuo-motor policies through two paradigms: I. Self-supervised Pre-training, which evaluates the role of random exploration video frames in visual pre-training. II. Staged Learning, which examines the use of random motor commands for autonomous data collection.
-
•
We propose a fully automated pipeline with automatic episode labeling, termination and task resetting for autonomous data collection. We release CloudGripper-Stack-750, as an MIT licensed open source dataset containing 750 hours of continuous robot activity recordings with binary success labels as a resource that may be valuable for future research in autonomous data collection and continual learning.
-
•
Through over 1,200 real-world policy evaluations, our results indicate that the contrastive objective with a ViT-Small architecture is an effective approach for visual pre-training using random exploration video frames; however, its performance strongly depends on initial object positions. Additionally, we identify that data collected by random motor commands plays a crucial role in balancing the data distribution and may mitigate strong distributional bias in data collected by fully autonomous policies without random exploration.
II Related Work
II-A Pre-trained Representations for Visuo-motor Policies
Self-supervised pre-training has achieved significant success in natural language processing [11] and computer vision [12]. Recent efforts aim to extend this success by finding universal representations for diverse manipulation tasks [13, 14, 15, 16, 17, 18], using large-scale computer vision datasets for efficient scaling of dataset size. For example, MVP [13] pre-trains visual representations using MAE [4] on a variety of datasets [19, 20, 21, 22], showing that a single visual encoder pre-trained on real-world images can generalize to various tasks. In this paper, we focus on a different scalable data source—random exploration data collected autonomously in the same environment as the target task—to examine whether environmental similarity can further enhance performance. Its efficacy for visual pre-training is studied using three prevalent self-supervised learning objective functions [4, 5, 6] and evaluated on a two-layer stacking task via behavior cloning.
II-B Robotic Manipulation Using Random Exploration Data
The use of random exploration data has primarily focused on grasping [9, 23, 24, 25, 26, 27], where a unique optimal label often does not exist due to the multiple ways an object can be grasped. Prominent examples include Pinto et al. [9], who propose a trial-and-error data collection pipeline involving random grasps. Successful grasps detected by force sensors are used to train a Convolutional Neural Network (CNN) [28] to predict grasp locations. Levine et al. [23] perform random grasps and use camera feedback to detect successful episodes, subsequently training a success rate prediction network for servoing mechanisms. Given the low initial success rate of random grasping attempts, both methods leverage a staged learning framework, in which successful outcomes from the initial stage update grasping policies guiding future data collection. This approach has also been validated by recent research employing initial human demonstrations followed by iterative re-training using successful rollouts [29, 30, 31]. Other applications of random exploration data include training a pose regression CNN to initialize the visuo-motor policy’s visual layer [32] and developing inverse dynamics models [33]. In this paper, we extend prior work to establish a second paradigm in which purely random motor commands are used to accomplish a two-layer stacking task organized into multiple subtasks.
III Problem Formulation
This paper investigates random exploration data through two paradigms: Paradigm I (random exploration video frames) and Paradigm II (random motor commands), within the scope of imitation learning.
III-A Paradigm I
III-A1 Definition
In Paradigm I, we define random exploration data as video frames recorded while the same robot arm performs unrelated tasks (planar pushing) within the same environment. Here, “same environment” refers to a visuo-motor deployment setup where the camera maintains a fixed pose, and both the background within the camera’s field of view and the illumination remain constant.
III-A2 Task
A two-layer stacking task, where a red cube and a green cube are randomly placed within the robot’s workspace. The goal is to place the red cube in the center of the workspace and stack the green cube on top of it.
III-A3 Dataset
CloudGripper-Push-1K [34], a large-scale vision-based robot planar pushing dataset, is used as random exploration video frames in visual pre-training. The dataset was collected using CloudGripper [35], a remotely accessible cloud robotics testbed for robotic manipulation, which was also used to collect two-layer stacking demonstrations for the task in Paradigm I and the dataset CloudGripper-Stack-750 for Paradigm II.
III-B Paradigm II
III-B1 Definition
In Paradigm II, random exploration data refers to random motor commands that execute motions towards sampled pick-up and drop-off positions within the workspace using position control APIs.
III-B2 Task
Since it is highly unlikely to complete a two-layer stacking task with purely random motor commands, the task in Paradigm I is first simplified and divided into two subtasks: In Subtask i (grasping), the robot randomly samples a pick-up position within the workspace to attempt to grasp a green cube placed at a random location. In subtask ii (stacking), the robot randomly samples a drop-off position within the workspace to attempt to stack the grasped green cube onto the red cube. In both subtasks, the red cube remains fixed at the center of the workspace. Only 5% and 2% of random executions of Subtask i and Subtask ii, respectively, succeed by chance.
III-B3 Dataset
We collect and categorize the episodes by subtasks and their corresponding stages, as shown in Tab. I. Each recorded episode includes camera frames from two angles, robot joint states and actions, as detailed in Tab. II. We release this dataset, containing over 750 hours of collected data, under the MIT open source license and refer to it as CloudGripper-Stack-750.
| Task | Stage | Symbol | Success | Total |
|---|---|---|---|---|
| Subtask i | Stage 1 | 118 | 2365 | |
| Stage 2 | 210 | 1750 | ||
| Stage 3 | 14 | 100 | ||
| 18 | 100 | |||
| 12 | 100 | |||
| Subtask i + Subtask ii | Stage 4 | 100 | 6663 | |
| Stage 5 | 0 | 100 | ||
| 7 | 100 |
-
•
As detailed in Sec. V-A2, {, , } and {, } are variations differing in data composition for Stage 3 and Stage 5, respectively. Examples can be found in the supplementary video.
| Symbol | Description | Dimension |
|---|---|---|
| Number of frames | 1 | |
| RGB top frames | ||
| RGB bottom frames | ||
| Proprioception states | ||
| Actions | ||
| Success label |
-
•
is a binary label: 1 for success and 0 for failure.
-
•
Only is used during the policy training and evaluation, is used by the automatic error detection toolkit.
IV Method
In this section, we first clarify the visuo-motor policy and task notation shared by Paradigms I and II, and subsequently describe the two paradigms proposed in this paper.
IV-A Preliminary
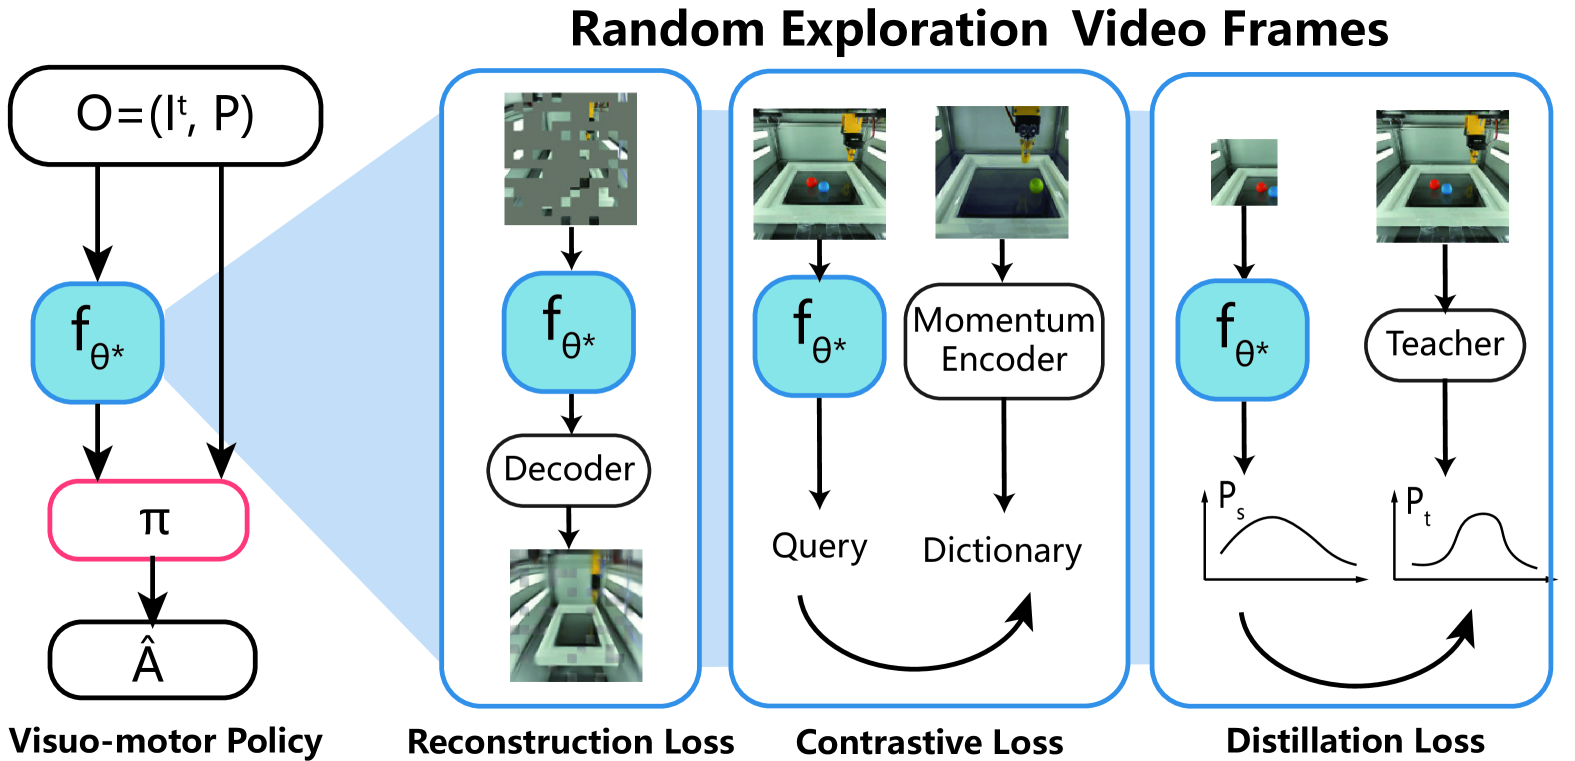
In imitation learning, a visuo-motor policy learns an action distribution from expert demonstration , where denotes RGB images, denotes proprioception states, and represents the actions. The policy maps and to predicted actions , as , where is a visual encoder. The policy is trained by minimizing .
IV-B Paradigm I: Random Exploration Video Frames
Self-supervised Pre-training. As shown in Fig. 2(a), camera frames from the dataset detailed in Sec. III-A3 are used to pre-train a visual encoder . A self-supervised objective function is employed during the visual pre-training:
| (1) |
Three prevalent self-supervised objective functions are studied, namely .
Reconstruction Loss. Masked Autoencoders (MAE) [4] mask random patches of the input frame to create and reconstructs the missing pixels using an asymmetric encoder-decoder architecture. The loss is defined as:
| (2) |
where denotes the set of indices corresponding to masked patches, with representing the number of masked patches; is a lightweight decoder.
Contrastive Loss. Momentum Contrast (MoCo v3) [5] pulls similar examples closer and pushes dissimilar ones apart using a momentum encoder and a dynamic dictionary. The loss based on infoNCE [36] is defined as:
| (3) |
where corresponds to the positive sample (same frame as the query), are negative samples from unrelated frames, and is a temperature hyperparameter [37].
Distillation Loss. Self-distillation with no labels (DINO) [6] trains a student network to match the outputs of a teacher network. For input frames , the student processes global and local croppings of , while the teacher processes only global croppings of . The loss is defined as:
| (4) |
where denotes the teacher network, and and represent the -dimensional distributions produced by the student and teacher networks, respectively.
IV-C Paradigm II: Random Motor Commands
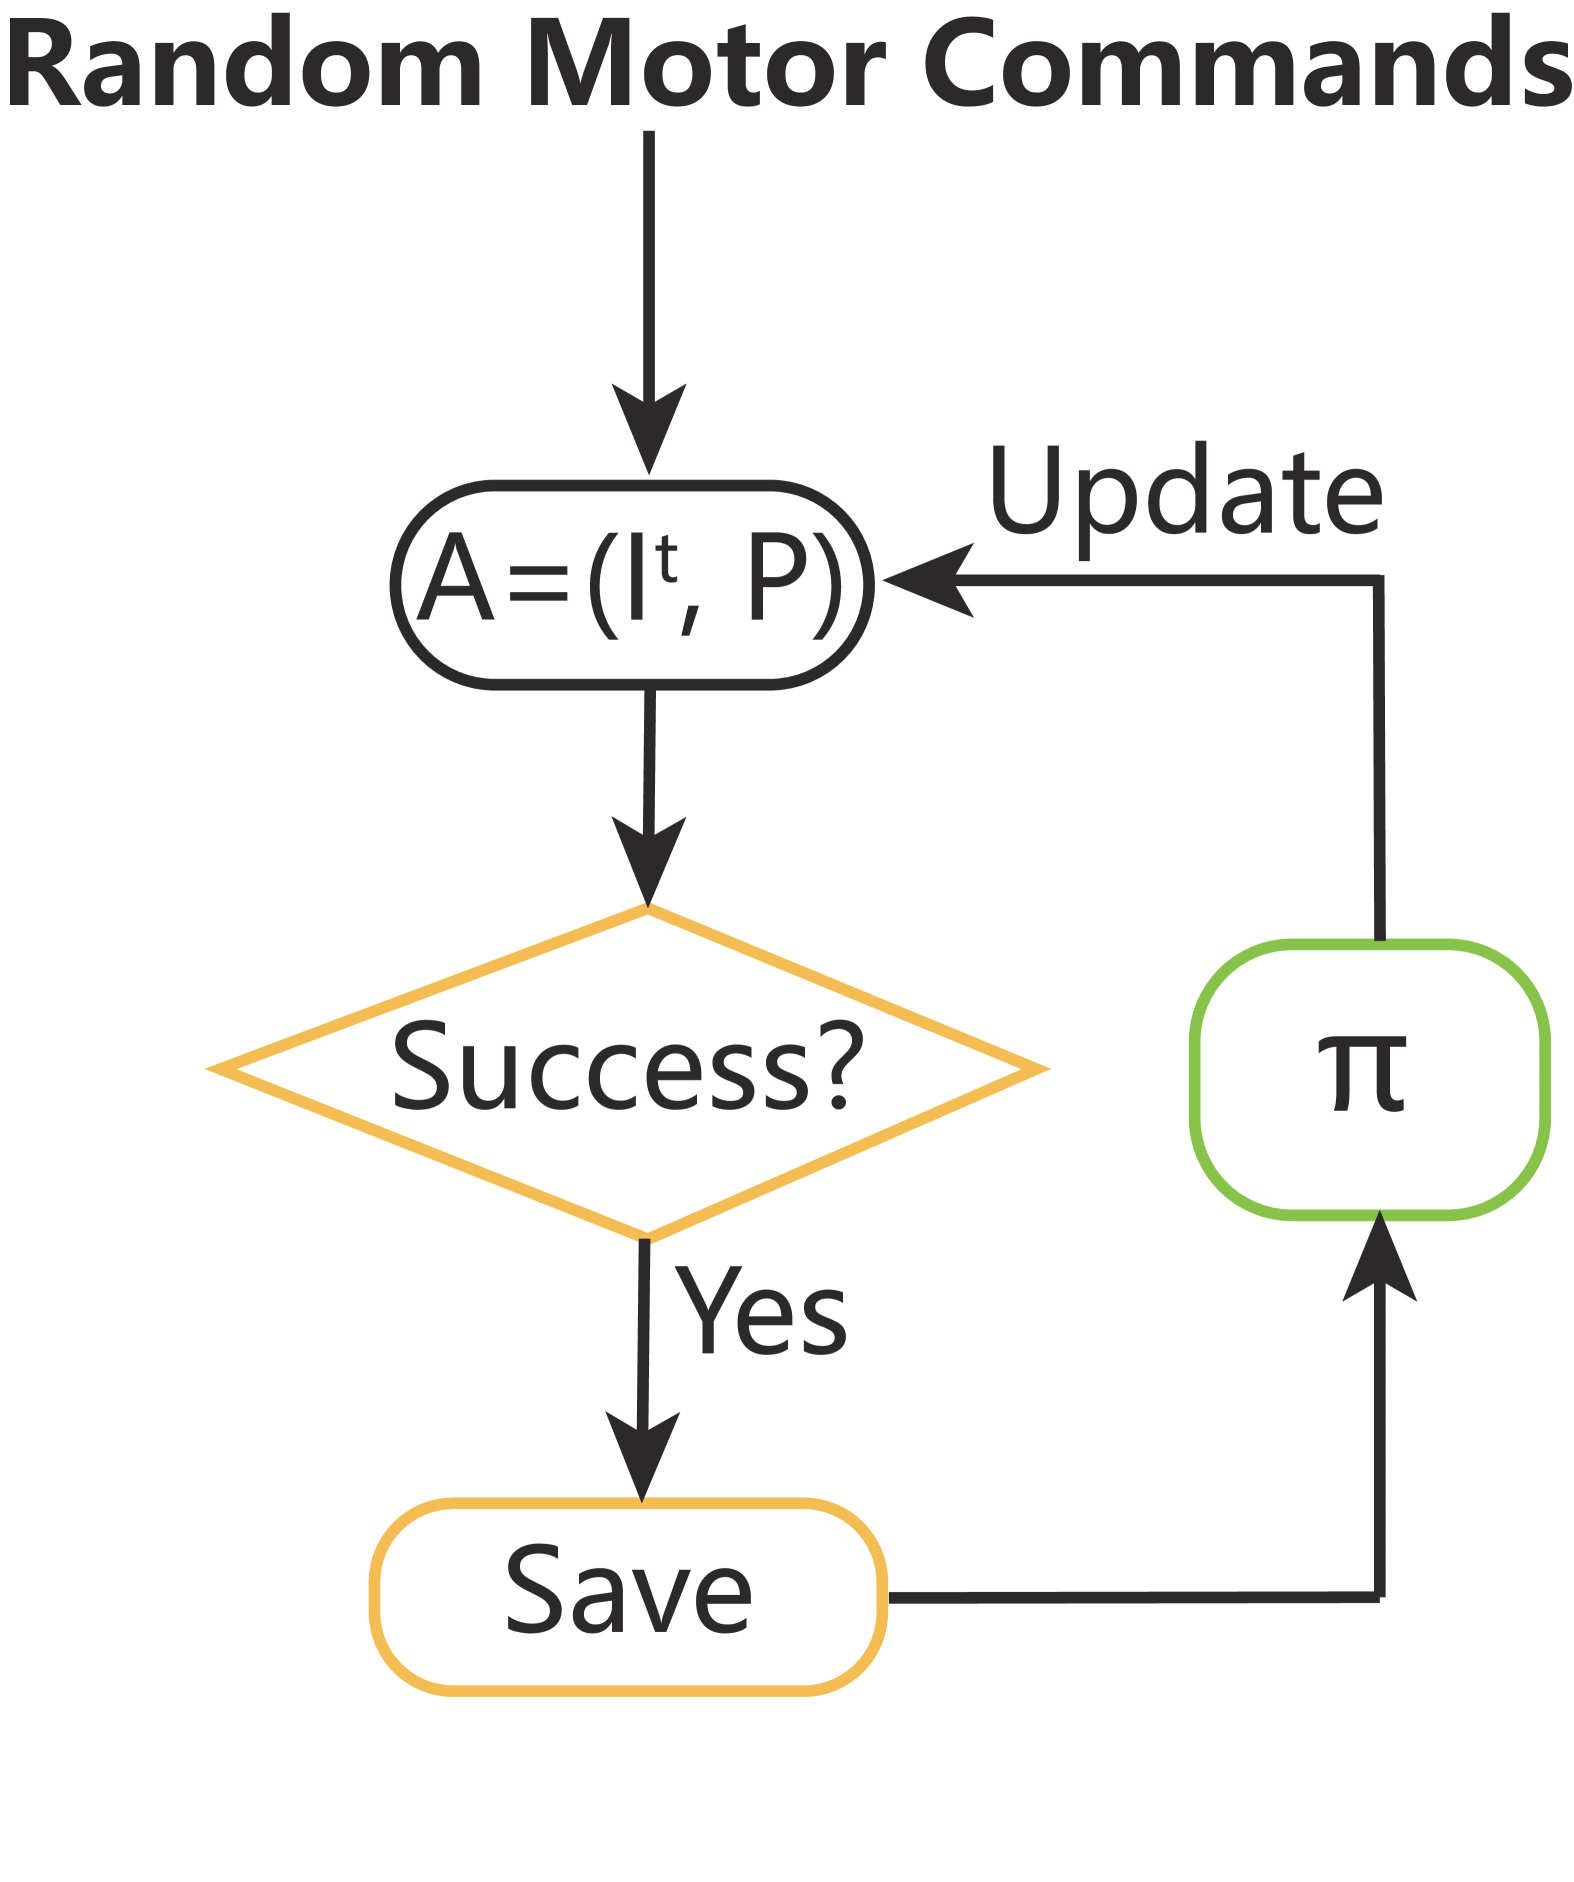
Staged Learning. As shown in Fig. 2(b), Paradigm II explores the use of random motor commands within a staged learning framework to derive actionable information from random data. The policy training for a two-layer stacking task is divided into five stages , as outlined in Tab. I. During , a dataset consisting 100 successful episodes under random motor commands is collected. In subsequent stages (), both the dataset and the policy are updated according to the four steps described below:
-
1.
Policy Update: The policy is trained using the dataset from the previous stage, .
-
2.
Data Collection: The trained policy is used to autonomously generate actions to collect data. A total of 50 successful episodes, identified by an automatic error detection toolkit, are collected and stored as .
-
3.
Data Processing (Optional): A data distribution balancing operation is designed to even out the distribution of successful episodes within the dataset. Specifically, we select episodes from that maximize the average pairwise distance between the initial positions of the green cube in and :
(5) -
4.
Data Composition: The dataset is merged with selected episodes from earlier stages to increase data size:
(6)
and incorporate random motor commands for Subtasks i and Subtask ii, respectively. In , data is collected using random motor commands with predefined patterns. A pick-up position is randomly sampled within a normalized workspace , corresponding to a physical area of . The gripper is first lifted to , then moved to the sampled , lowered to , and finally closed. In is used for Subtask i (grasping), while Subtask ii (stacking) relies on random motor commands to sample a drop-off position for the green cube. Episode labeling, termination, and task resetting are automated via CloudGripper-Autograsper [10].
V Experiments
V-A Experimental Setup
Experiments are conducted on CloudGripper [35], an open-source cloud robotics testbed with 32 robotic arm cells. Each robot has two cameras: the top camera provides frames for policy training, while the bottom camera provides frames for automatic episode labeling, termination, and task resetting. The bottom camera is also used for deriving the ground truth for initial cube positions used in Sec. V-C. Example frames are shown in Fig. 1.
V-A1 Paradigm I
Implementation Details
During training, three self-supervised objectives are applied to Vision Transformer [7] (ViT-Base, ViT-Small) and ResNet [8] (ResNet-50, ResNet-18), using 1M, 700K, 700K, and 300K random exploration video frames, respectively. Most hyperparameters follow the original papers [4, 5, 6], with only the learning rate adjusted (1e-5) to account for differences in image diversity between random exploration video frames and ImageNet [19]. Policy is trained via behavior cloning with Gaussian mixtures, following the same set of hyperparameters used by prior studies [38, 1, 39]: five kernels, a learning rate of 1e-4, L2 weight decay of 1e-4 and 50,000 iterations. Each training uses 200 expert human demonstration episodes.
Metrics
We evaluate policy performance using four metrics: Prediction Error (), the mean absolute difference between predicted actions and ground truth; , the success rate of gripper reaching the red cube’s initial position; , the success rate of picking and placing the red cube at the center; and , the success rate of stacking the green cube on top of the red cube.
Evaluation Protocol
Each policy is evaluated 20 times with varying initial cube positions. Given the binary success labels (1: success, 0: failure), we report the mean values of the four metrics over 20 tests, scaled from 0 to 1.
V-A2 Paradigm II
Implementation Details
Following the notation in Tab. I and Sec. IV-C, Subtask i includes: (1) : is collected using random motor commands (). (2) : is collected autonomously using trained on 50 successful episodes from . (3) includes three variations based on different data compositions: (a) : is collected using , trained on 50 successful episodes from and 50 successful episodes from ; (b) : is collected using , trained on the same combination of data as but with enforced even distribution from using Eq. 5; (c) : collected using , trained on 100 episodes from . The complete task (Subtask i + Subtask ii) includes: (1) : data for Subtask i is collected using , and data for Subtask ii is collected using random motor commands. (2) includes two variations: (a) : is collected using , trained on 50 successful episodes from performing complete task sequence; (b) In , data is collected by sequentially using two policies trained on two separate subtasks, using to perform Subtask i and a policy trained on 50 successful Subtask ii-only episodes extracted from to perform Subtask ii. Policy is implemented using behavior cloning with a ResNet18 encoder trained from scratch. The training hyperparameters are identical to those used in Paradigm I.
Evaluation Protocol
Policies are evaluated over 100 trials, each with a different initial cube position. The success rate for Subtask i and complete task (Subtask i + Subtask ii) are reported separately. Success rates are reported as averages over 100 tests, scaled from 0 to 1.
V-B Results of Paradigm I
V-B1 Can visuo-motor policies benefit from random exploration video frames?
We begin by comparing the performance of models pre-trained on random exploration video frames (Random), ImageNet, Kinetics [40] (KN), 100 Days of Hands [22] (DoH), and RobotNet [41] (RN). We adopt the Vision Transformer (ViT-Base) architecture with the MAE objective (reconstruction loss), denoted as , for this comparison, given the extensive research surrounding this model [16, 17, 18, 38, 42].
| Random | ImageNet | KN | DoH | RN | |
|---|---|---|---|---|---|
| 0.051 | 0.025 | 0.051 | 0.038 | 0.038 | |
| 0.2 | 0.55 | 0.6 | 0.5 | 0.6 | |
| 0.2 | 0.45 | 0.5 | 0.5 | 0.25 | |
| 0 | 0.05 | 0.2 | 0.1 | 0.1 |
-
•
The best-performing policy is in bold, and the second-best is underscored. The pre-trained weights for ImageNet, KN, DoH and RN are adopted from [38].
As shown in Tab. III, we observe that: ImageNet and Kinetics perform better than other pre-training datasets on the two-layer stacking task, aligning with studies [38] indicating that pre-training on datasets with broad image diversity enhances visuo-motor policy effectiveness on the MAE architecture. To our surprise, random exploration proves less effective for visual pre-training than other datasets in the two-layer stacking task, motivating the investigation presented in the next section.
V-B2 Is the pre-training objective a limiting factor for random exploration video frames’ performance?
In this section, we assess whether the comparatively lower performance of random exploration video frames is due to the selection of pre-training objectives. Accordingly, we introduce two additional pre-training objectives, MoCo (contrastive loss) and DINO (distillation loss), applied to random exploration video frames, with ImageNet as a performance comparison baseline. All studies are conducted using the ViT-Small architecture to accommodate computational resource constraints, results can be found in Tab. IV. We adopt this downscaling to explore a more cost-effective use of random frames, as pre-training with ViT-Base architecture requires 1 million frames and over 2,000 NVIDIA A100 GPU hours. We observe that:
-
•
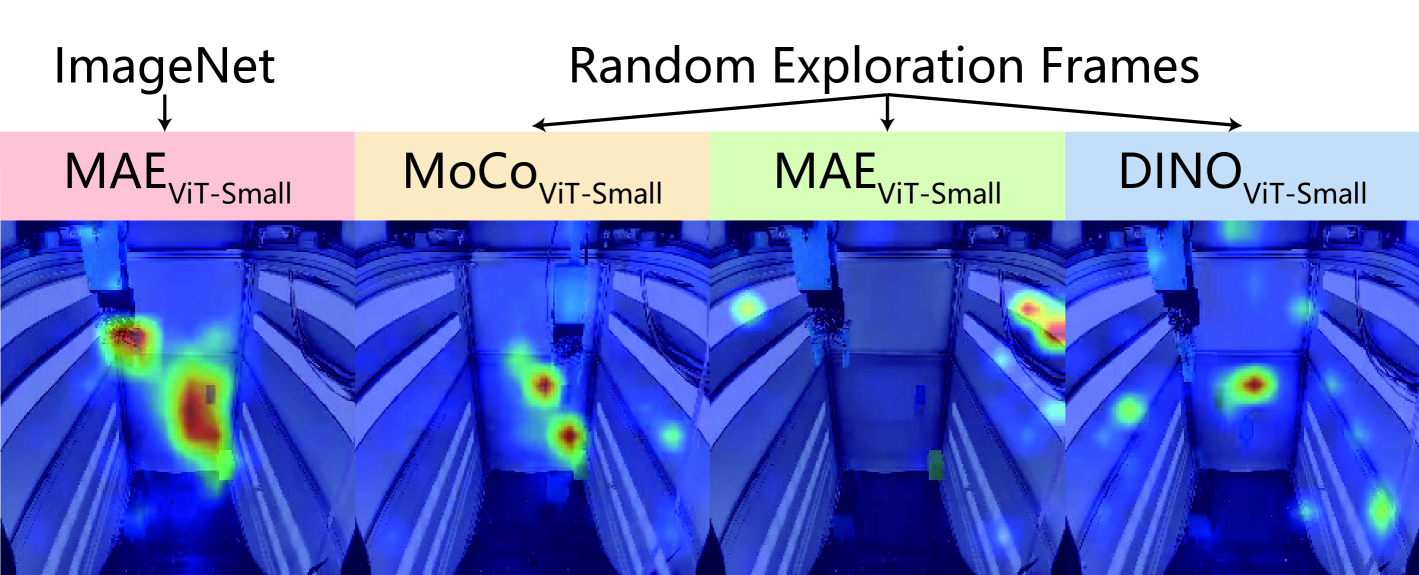
Models pre-trained with MoCo objective outperform both MAE and DINO by a significant margin on Random. To further investigate this, we use FullGrad [43] saliency maps to visualize the impact of different objectives on visual encoders, as shown in Fig. 3. We denote models pre-trained on ImageNet using the MoCo objective with the ViT-Small architecture as . It can be seen that the activations of and , the best- and second-best-performing models, concentrate mainly in the task area. In contrast, the activations of poor-performing and focus on the background and exhibit dispersed activations. This potentially suggests that: (1) MoCo’s better performance may be linked to its task-focused activations; (2) its concentrated activation likely helps with object localization, explaining good results in and ; and (3) this focus might also account for its uneven task performance mentioned in the next point.
-
•
During evaluation, a noticeable uneven distribution of successful episodes was observed, tied to initial cube positions. , consistently failed to reach when the red block was in the top-right, while succeeded in 2-layer stacking only when the green block was in the bottom-left. This is possibly because MoCo, designed for instance discrimination, focuses on distinguishing individual frames, making it sensitive to object positions. This results in a bias favoring lower-positioned objects, as they cover more pixels compared to those higher in the image.
V-B3 How does model size affect performance on random exploration video frames?
Building on the above results, we conducted a third study to examine the impact of model size with the MoCo objective, comparing models from ViT-Base down to ResNet-18 [8], as shown in Tab V. We observe that MoCo’s effectiveness on random exploration video frames is highly dependent on model capacity. shows a sharp performance drop from to , likely due to insufficient parameters for handling longer task sequences. The low performance of ViT-Base may stem from too few training episodes relative to model size. Despite this, remains the best policy.
| Model | ||||
|---|---|---|---|---|
| Params | 16M | 35M | 43M | 108M |
| 0.033 | 0.038 | 0.032 | 0.029 | |
| 0.6 | 0.25 | 0.8 | 0.15 | |
| 0.5 | 0.15 | 0.8 | 0.05 | |
| 0.05 | 0 | 0.25 | 0 |
-
•
The best-performing policy is in bold, and the second-best is underscored. The parameter count for each model is calculated as the sum of its trainable parameters.
V-C Results of Paradigm II
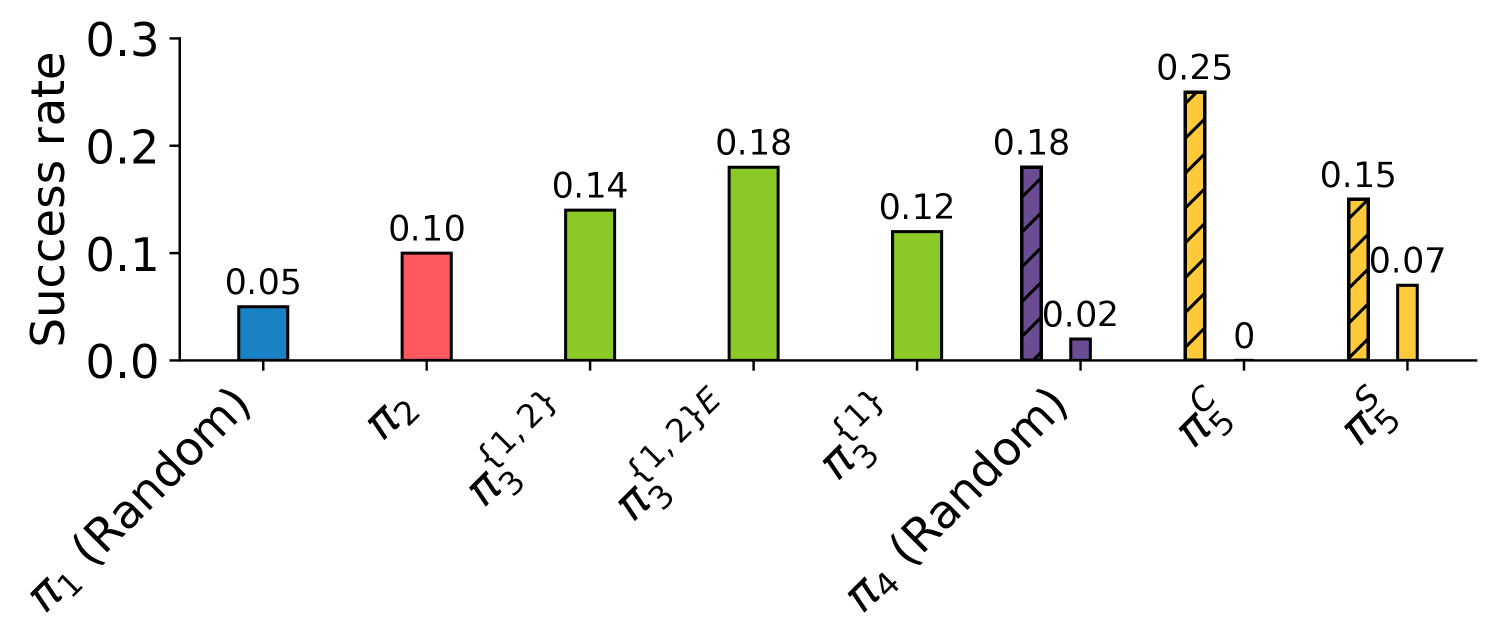
As detailed in Sec. V-A2, data in each stage is collected using a policy . The success rate of each policy is shown in Fig. 4.
V-C1 What trends emerge in data collected by random and autonomous policies?
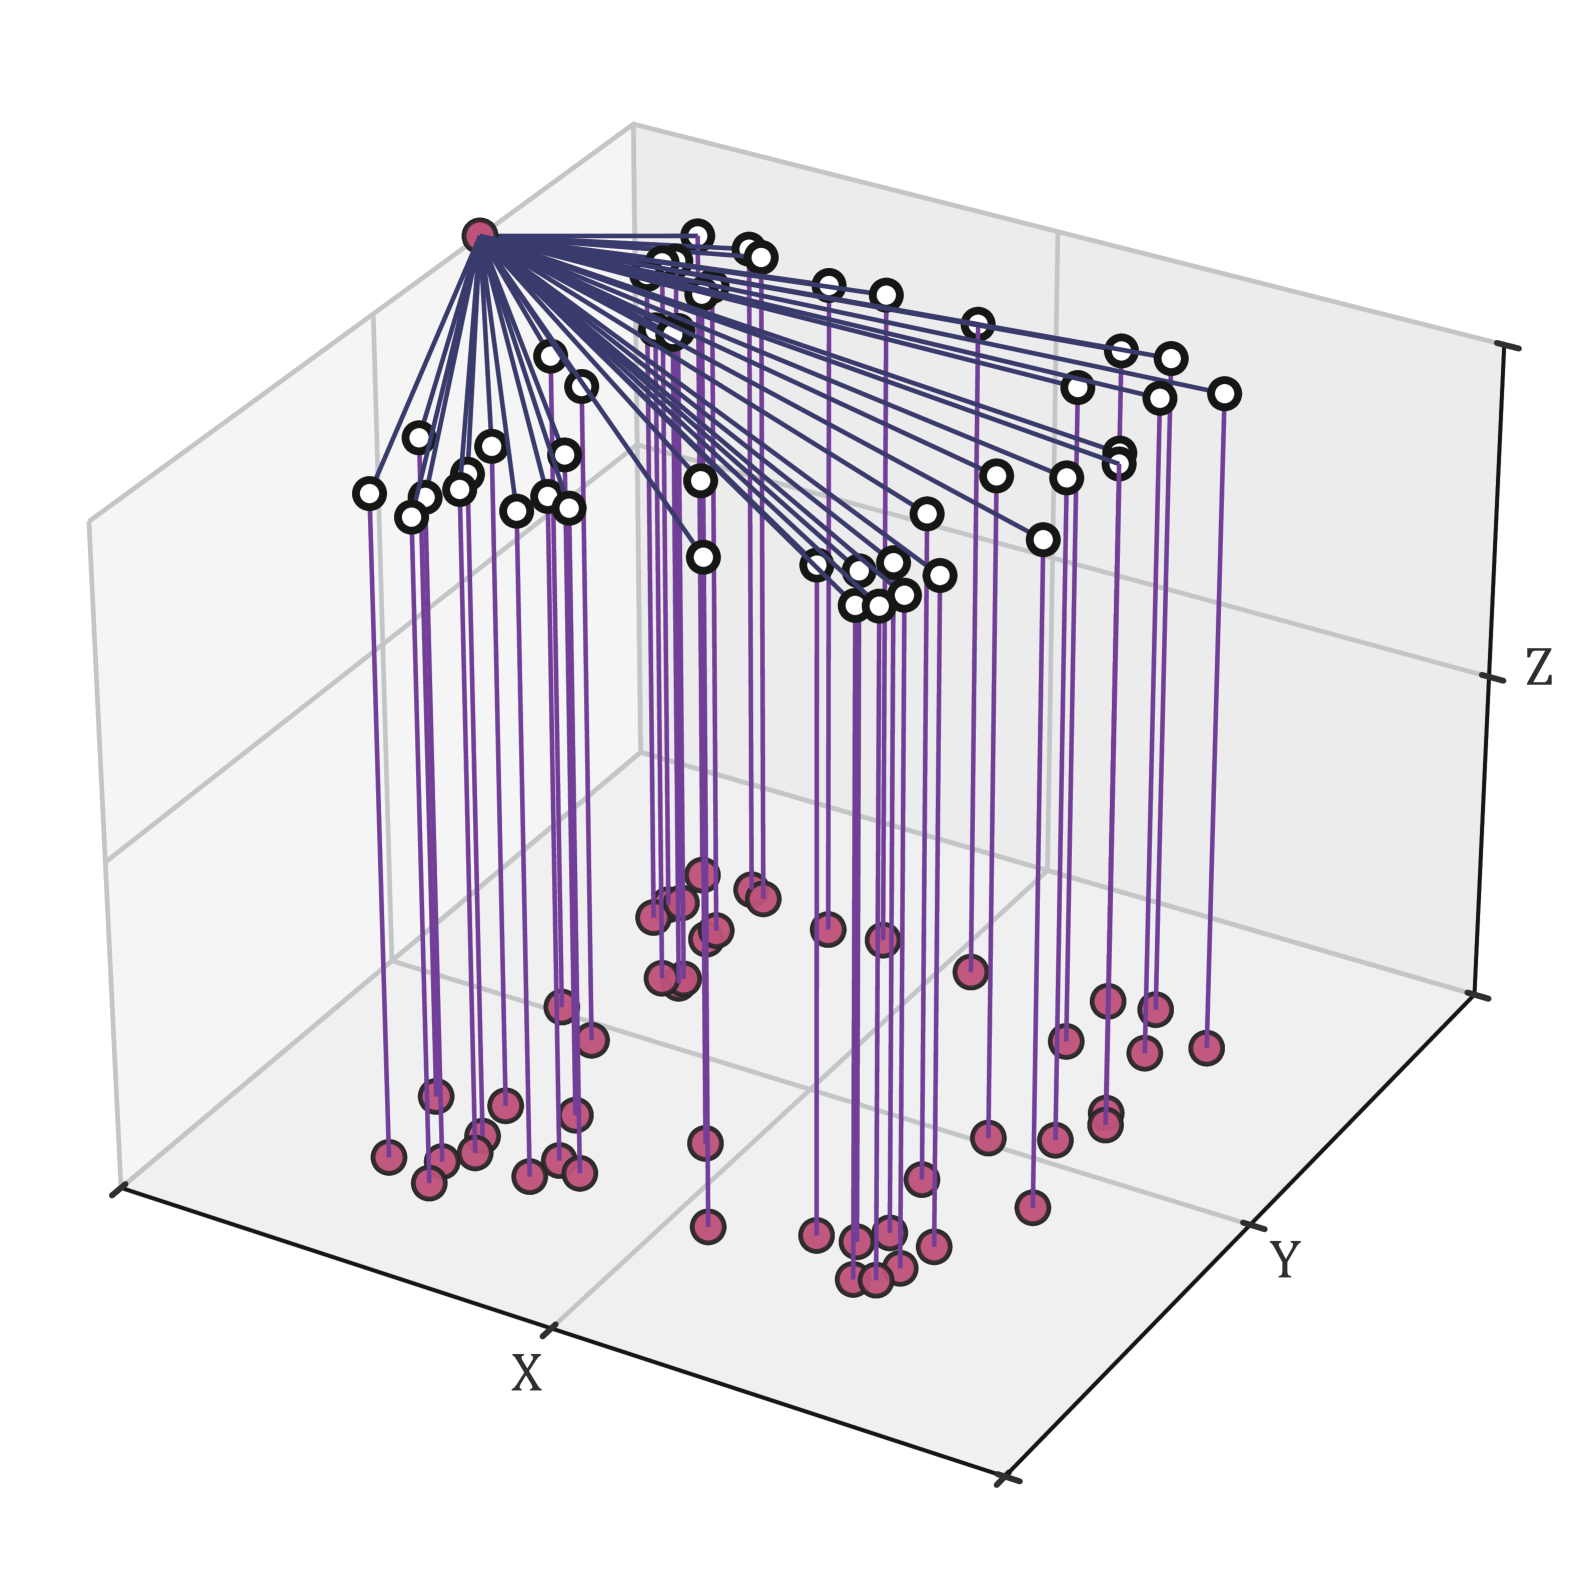
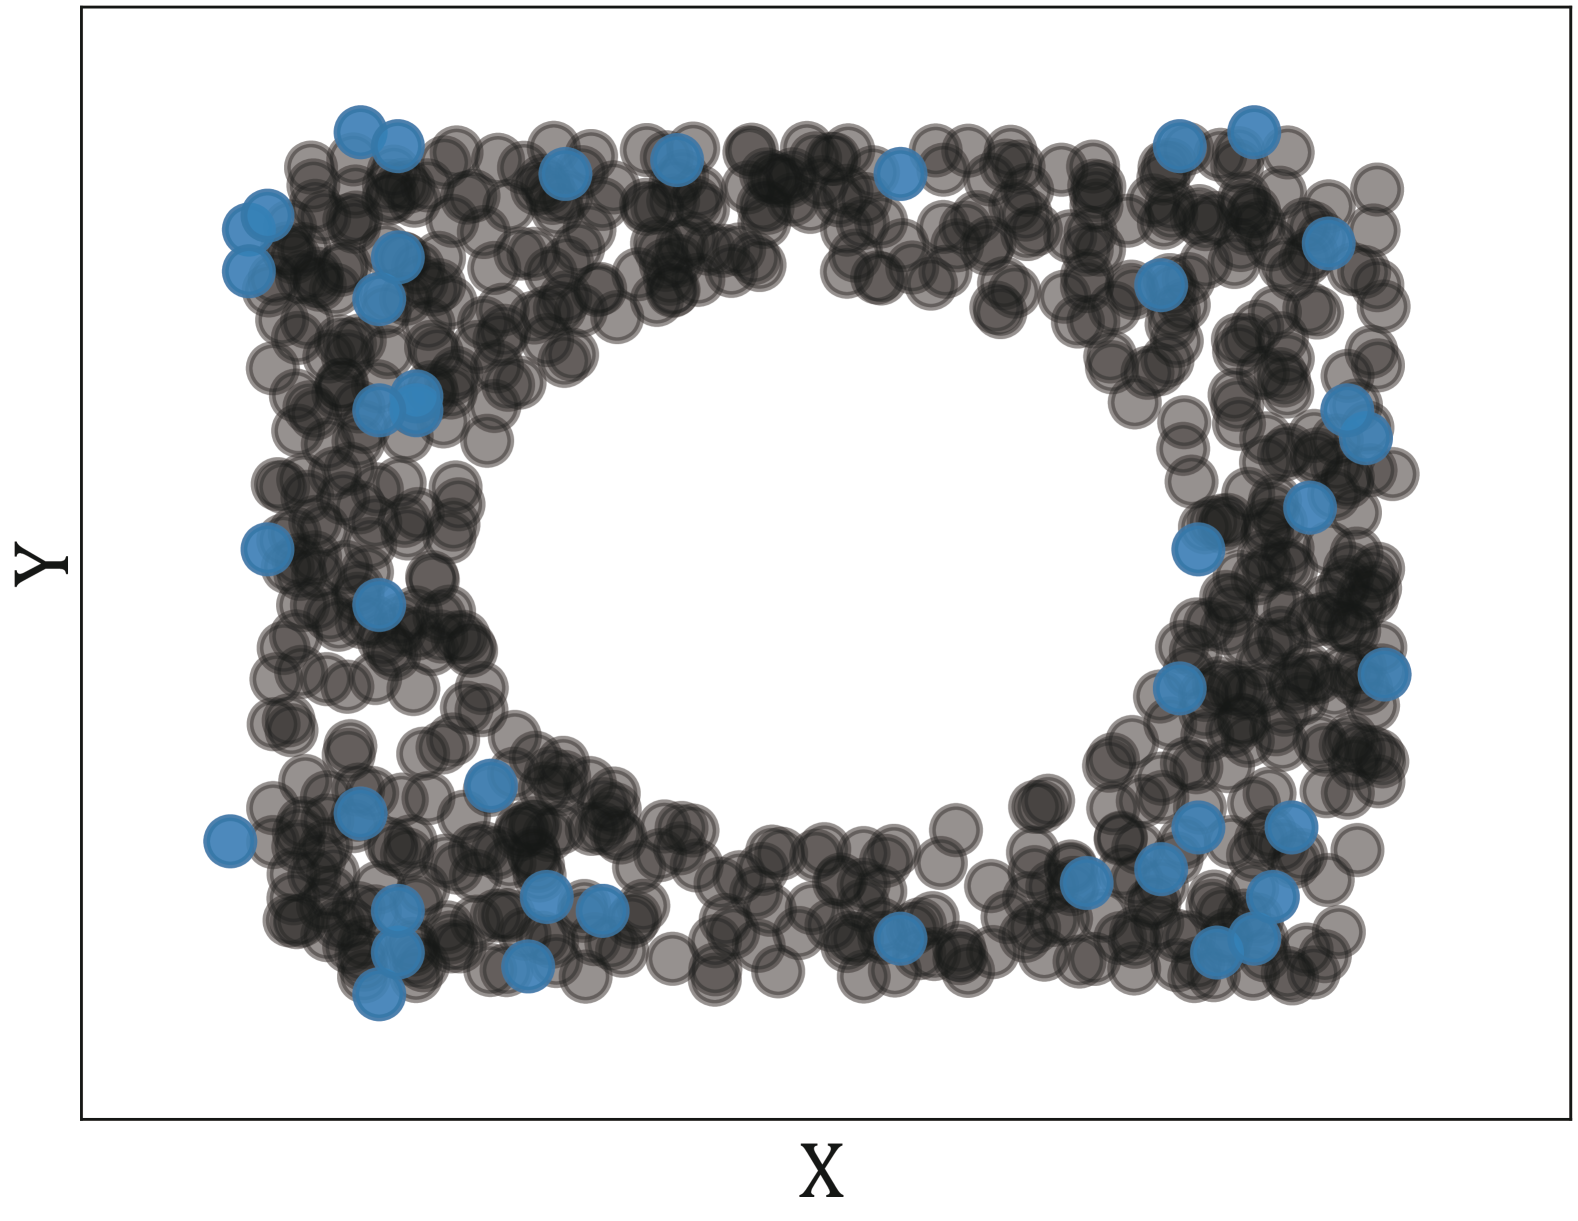
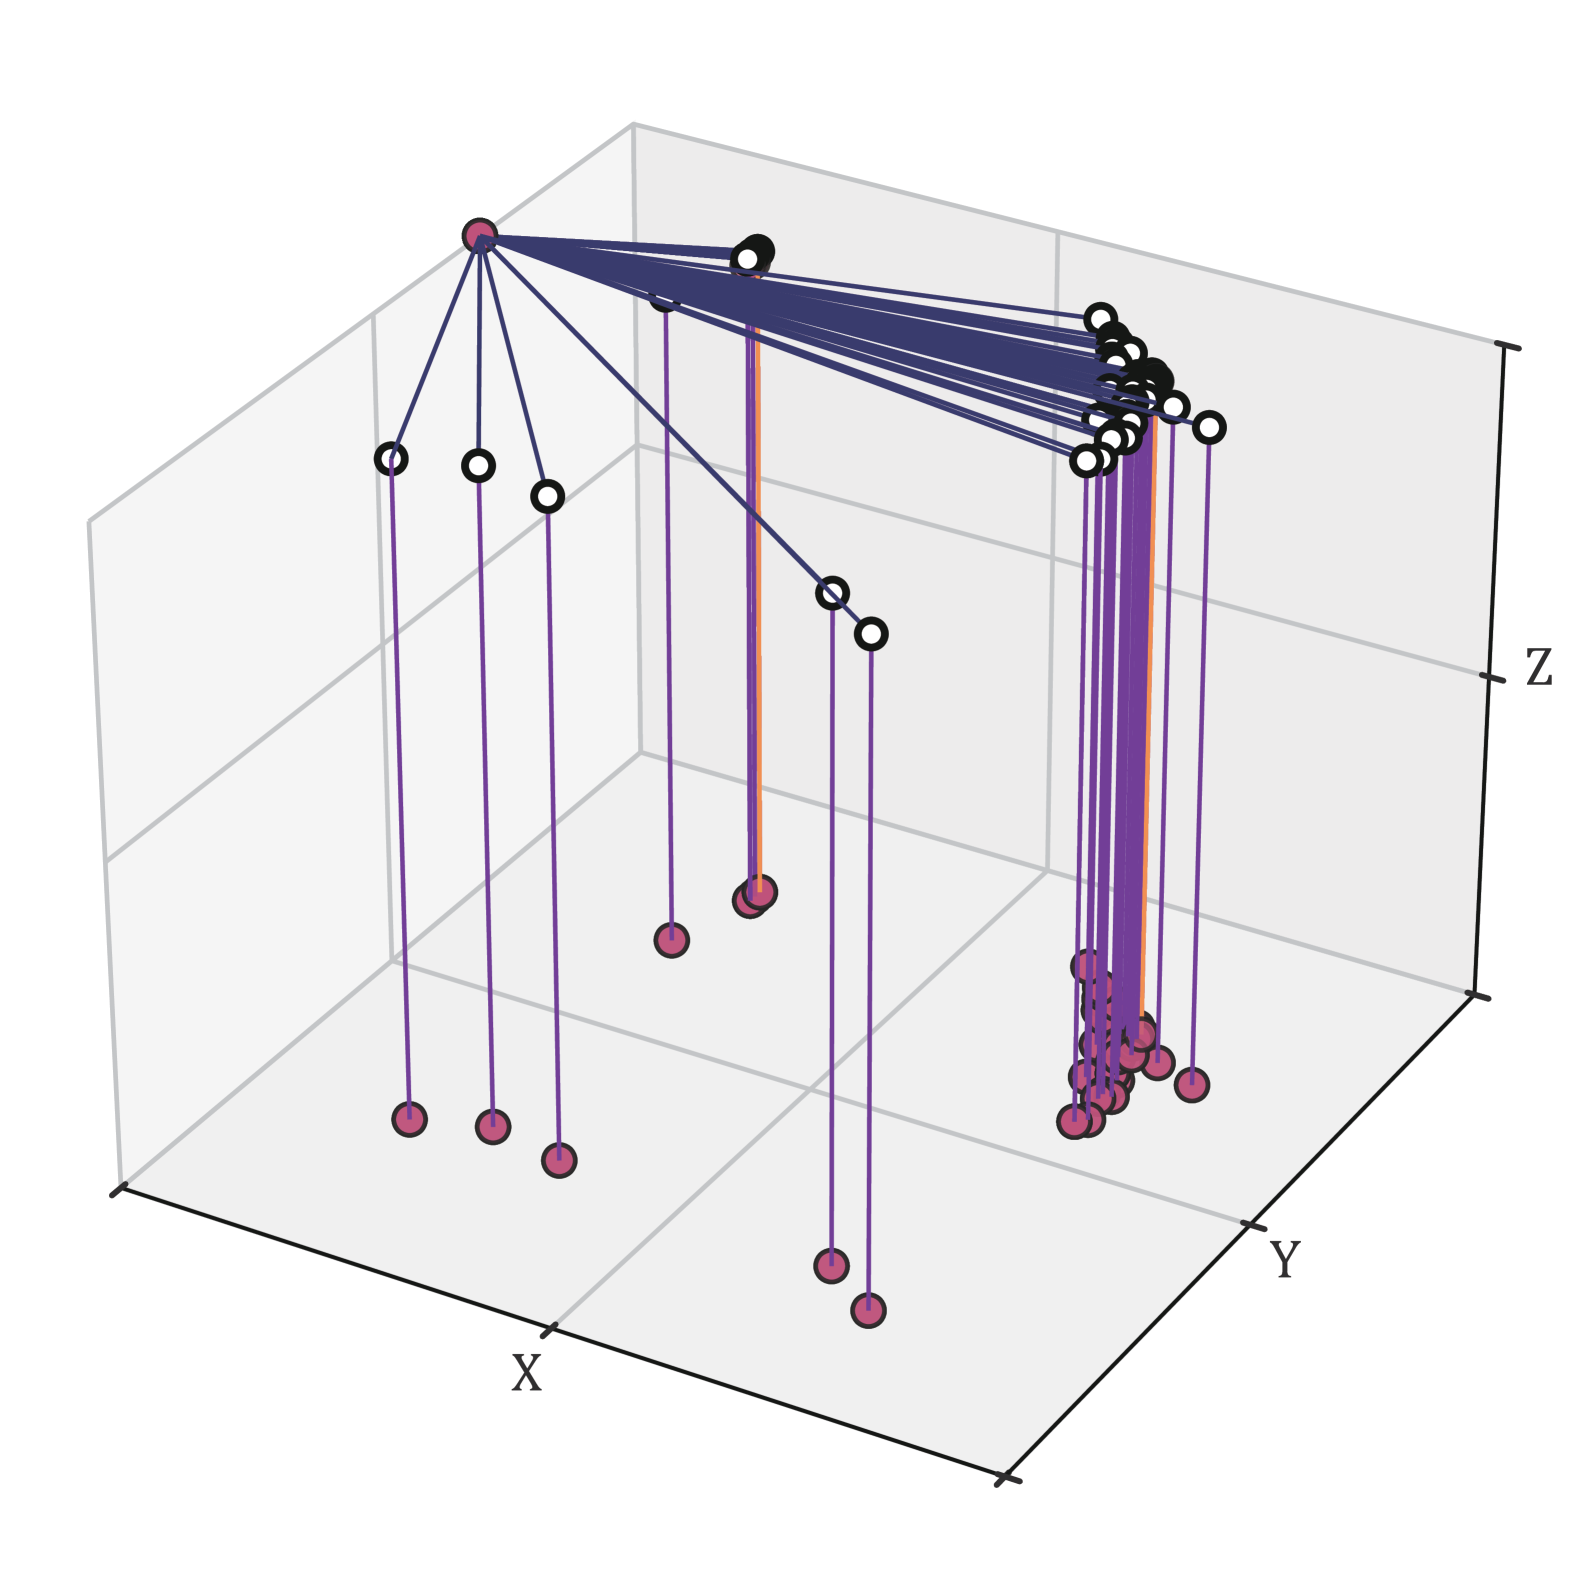
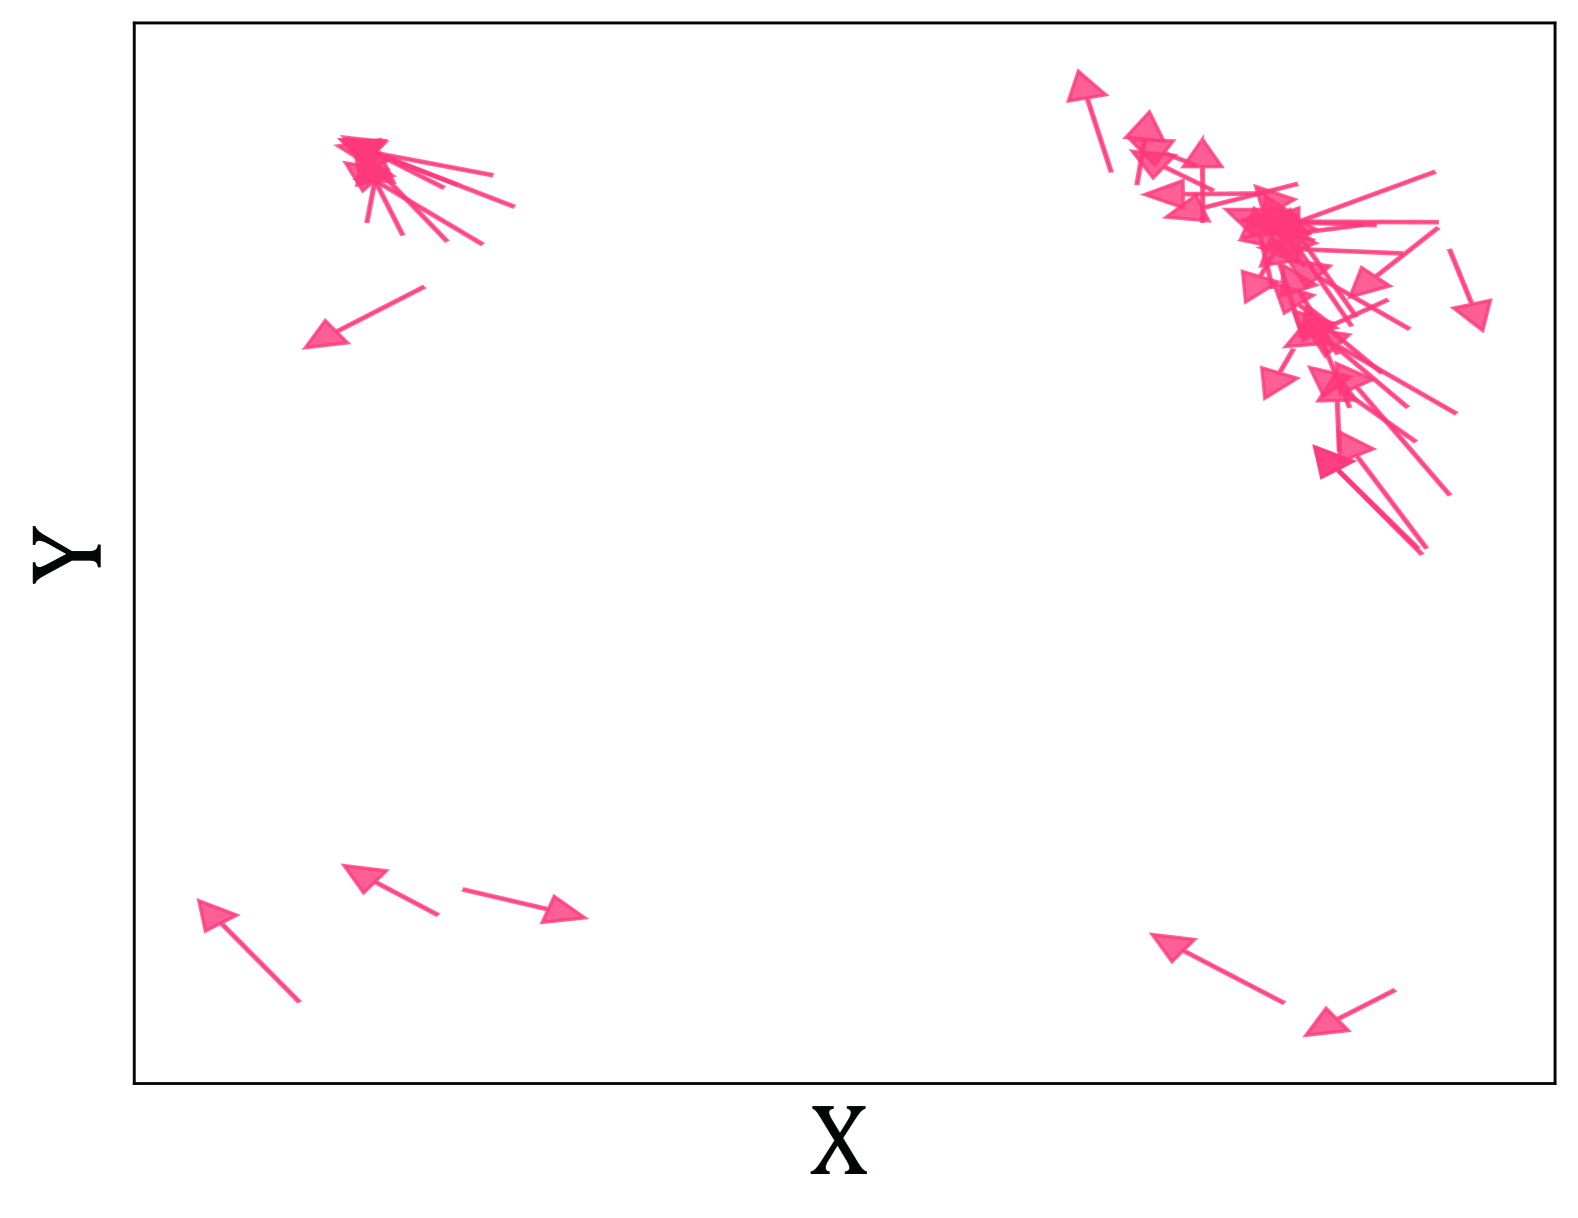
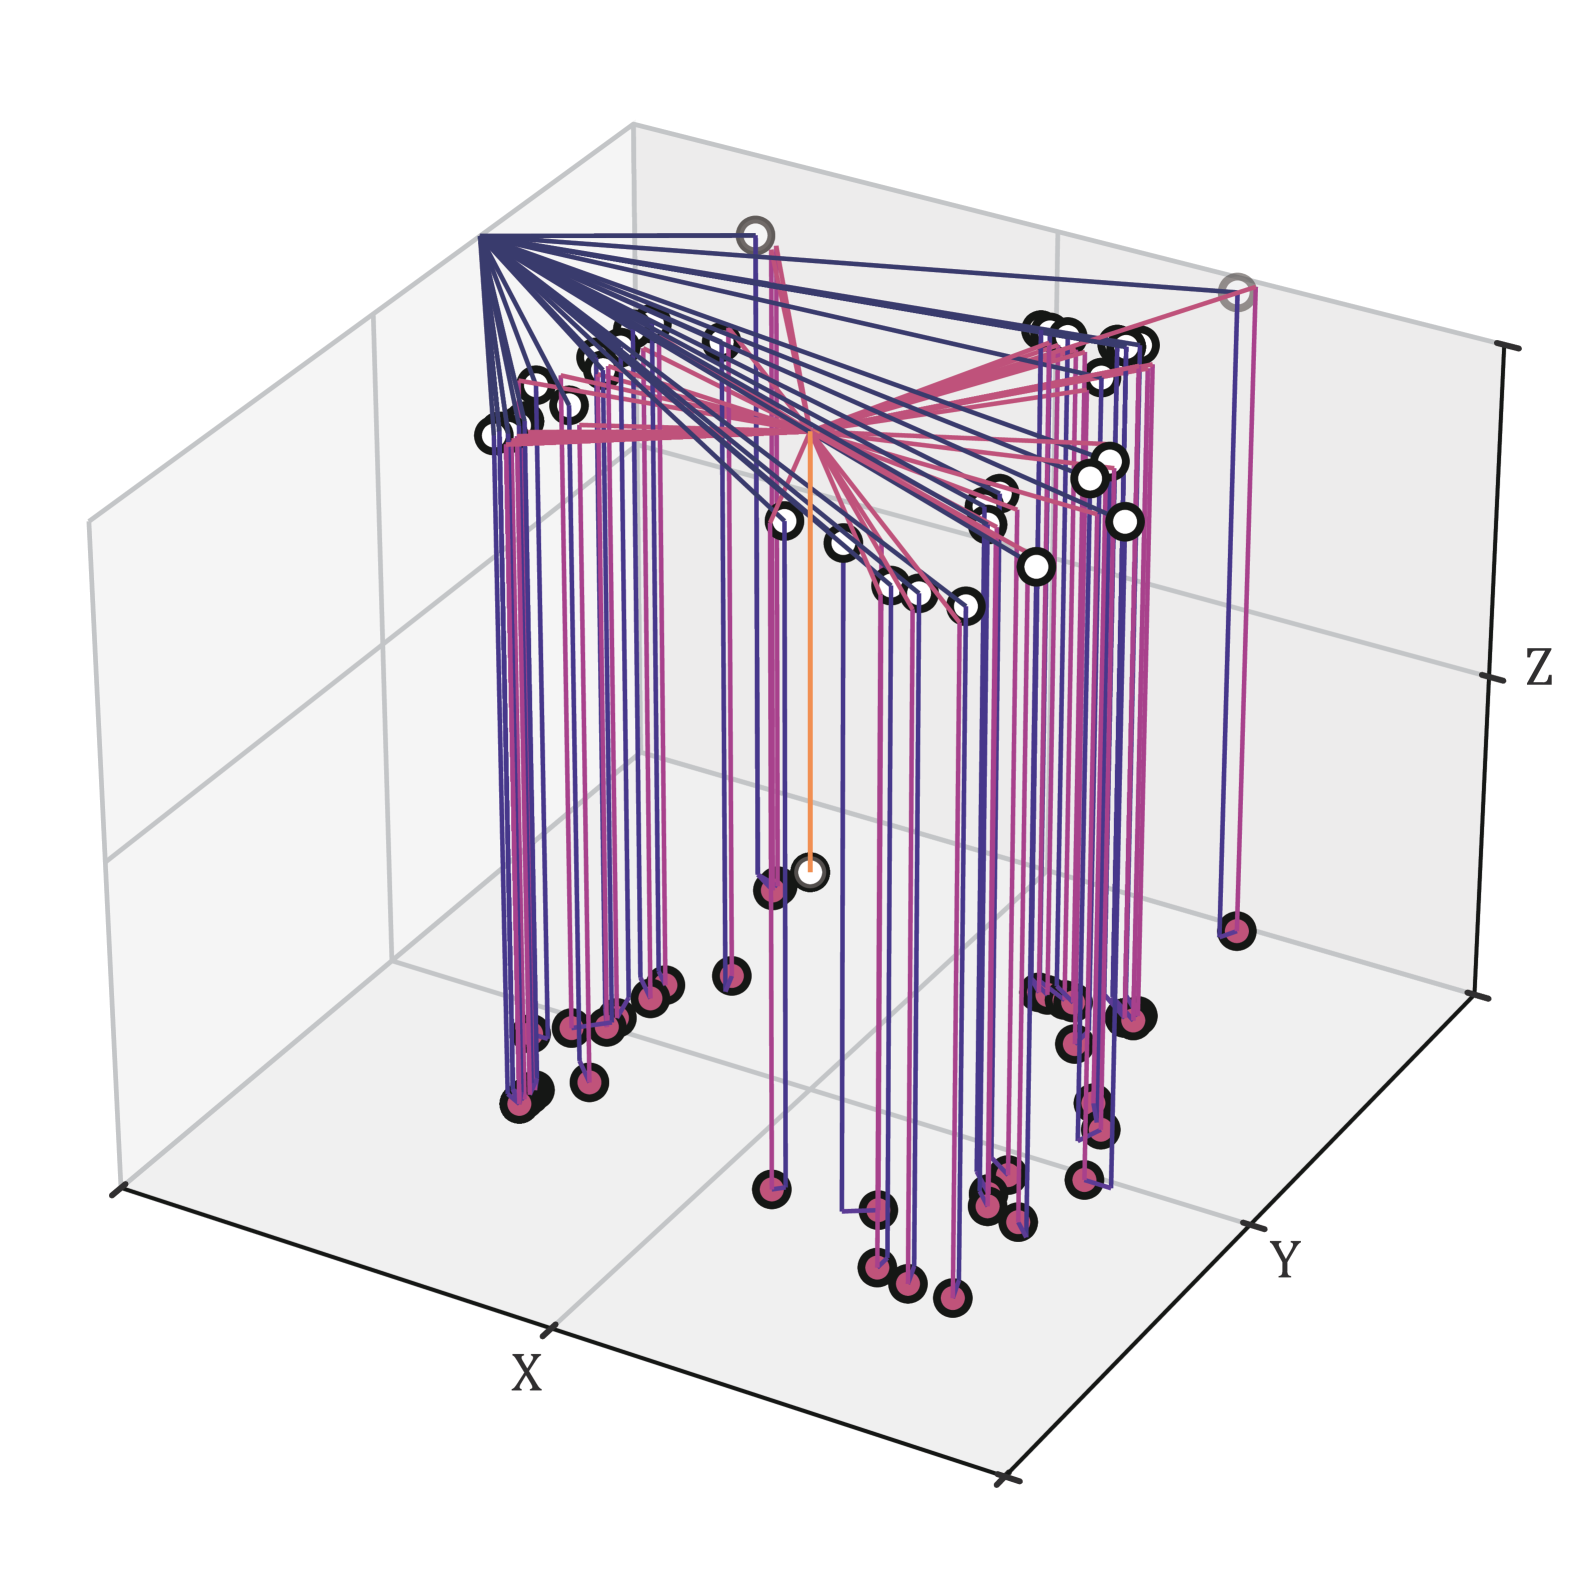
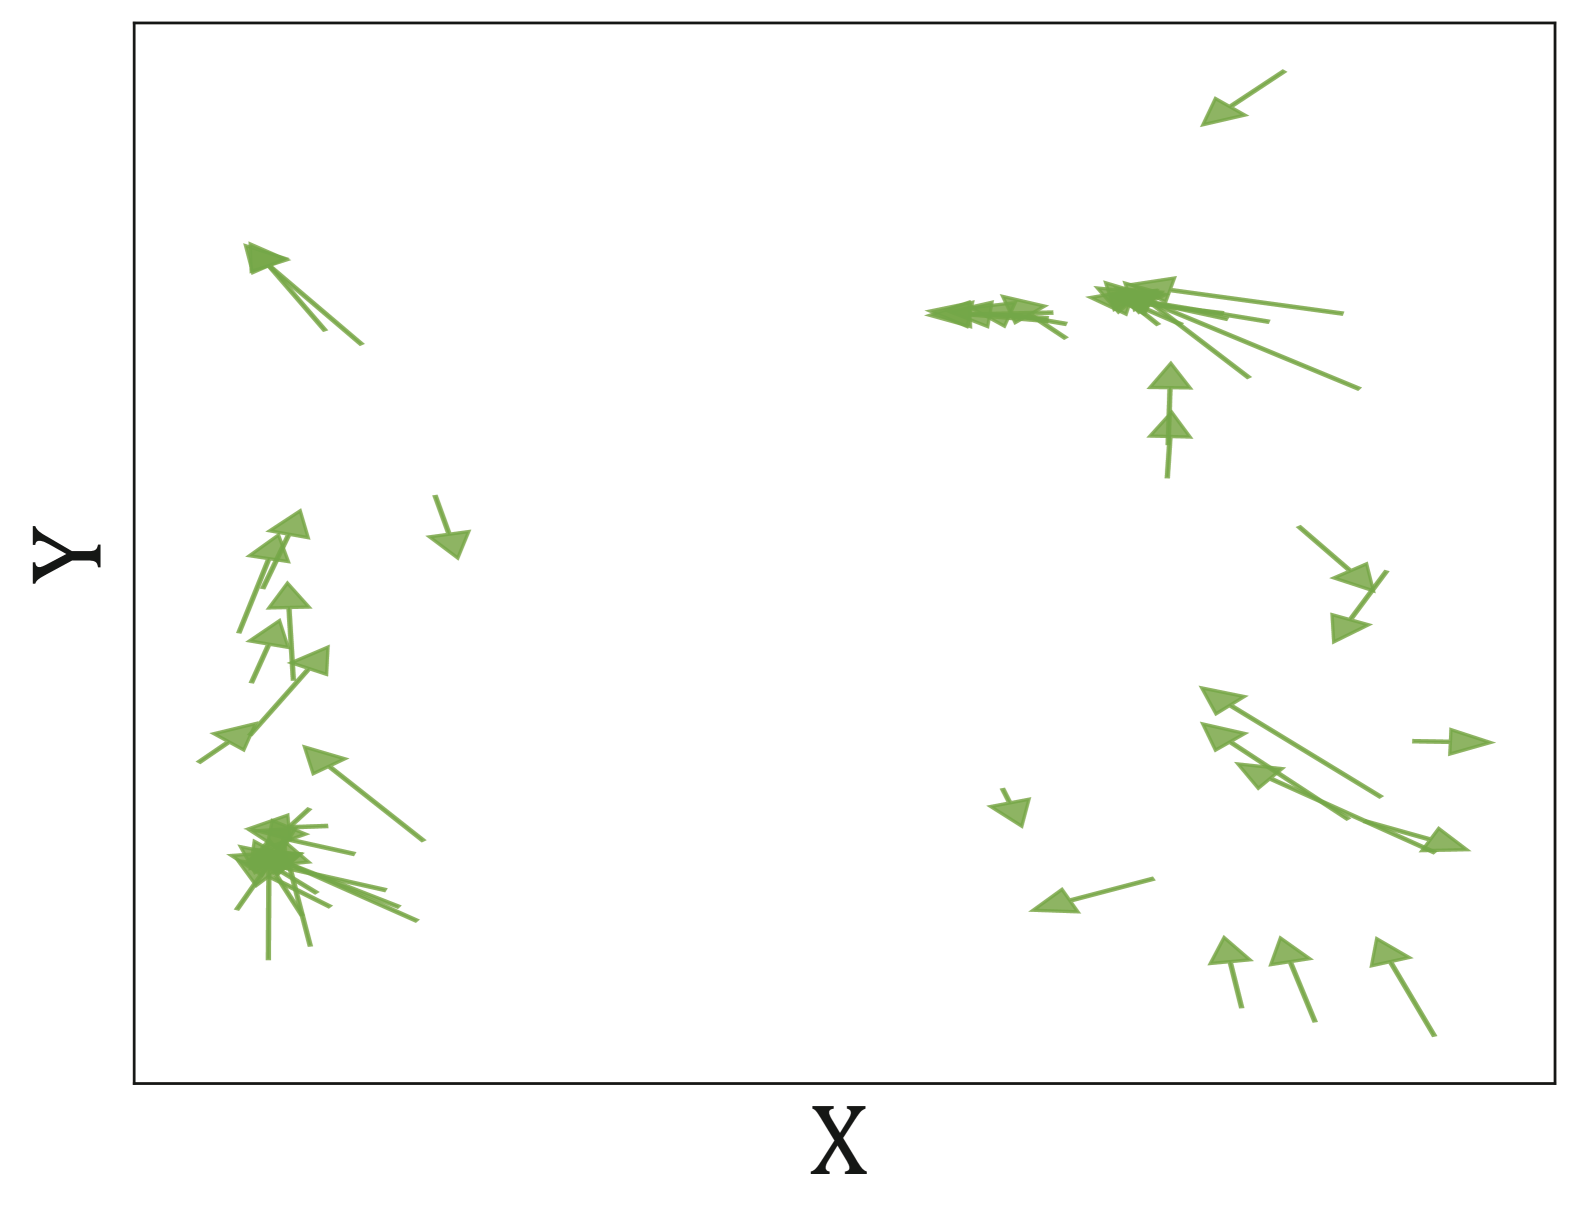
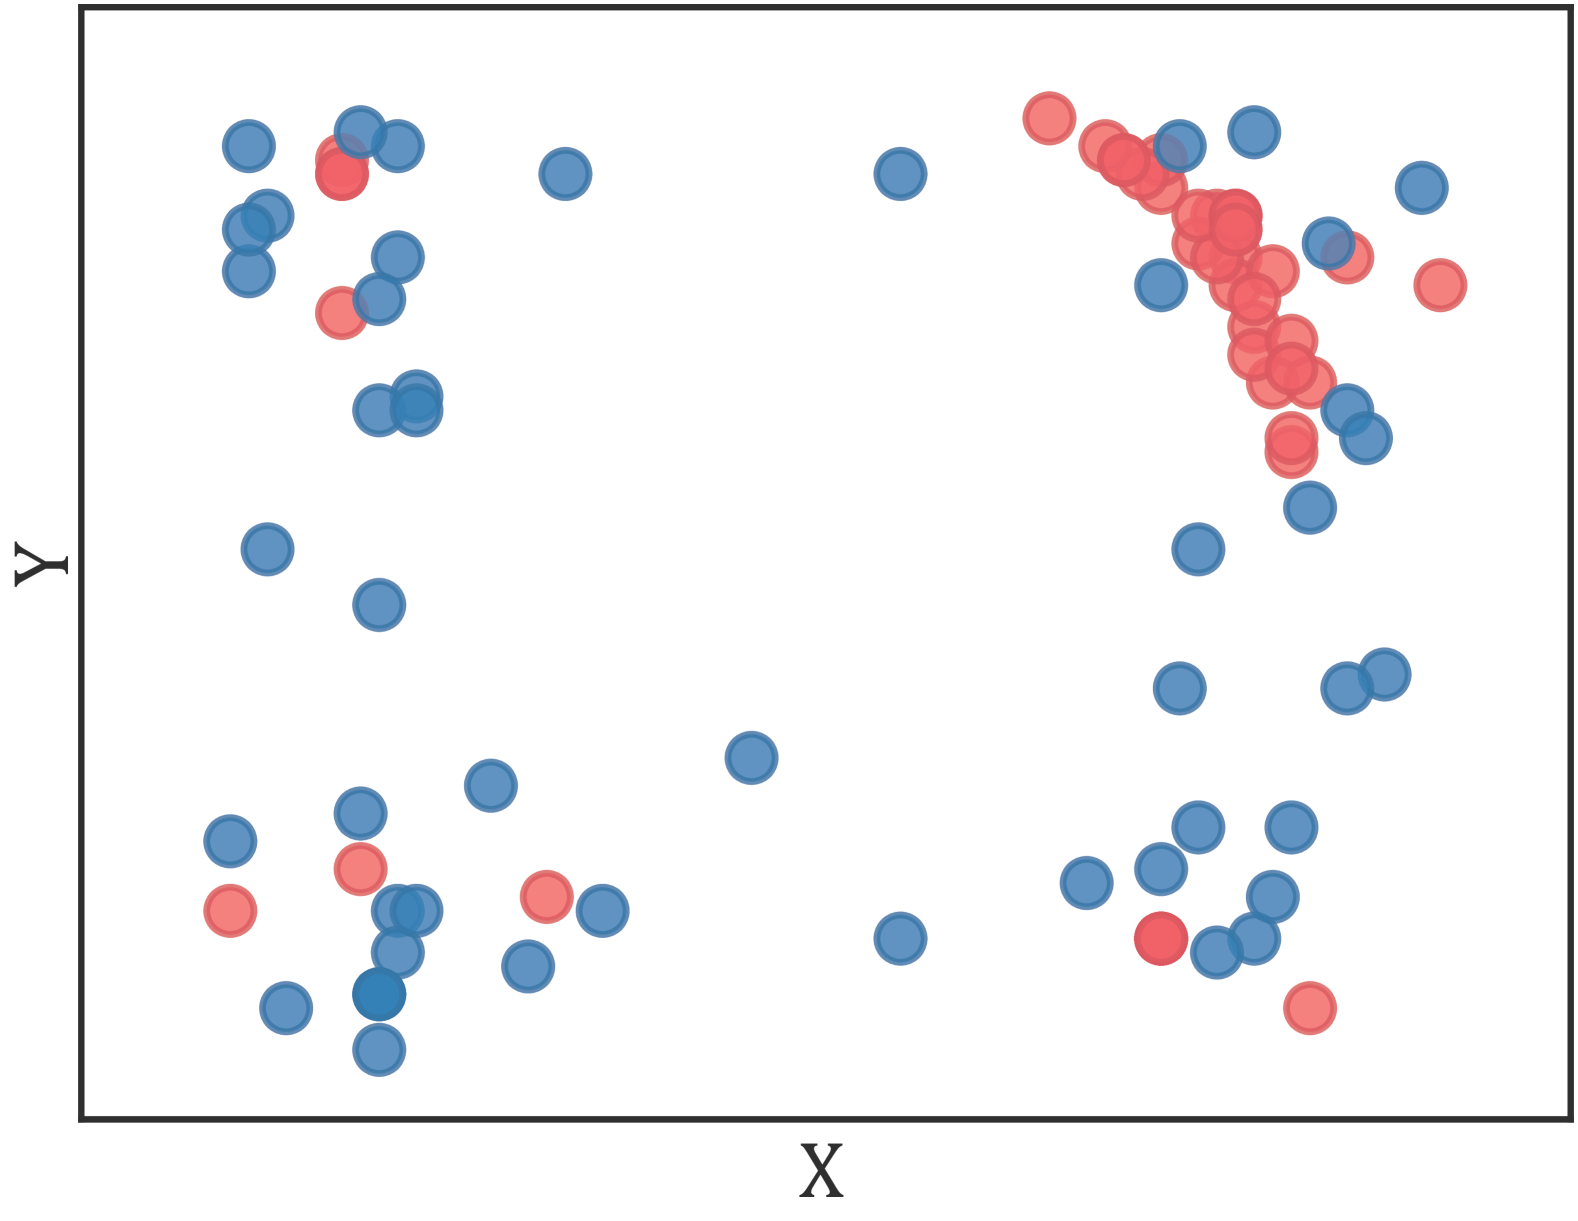
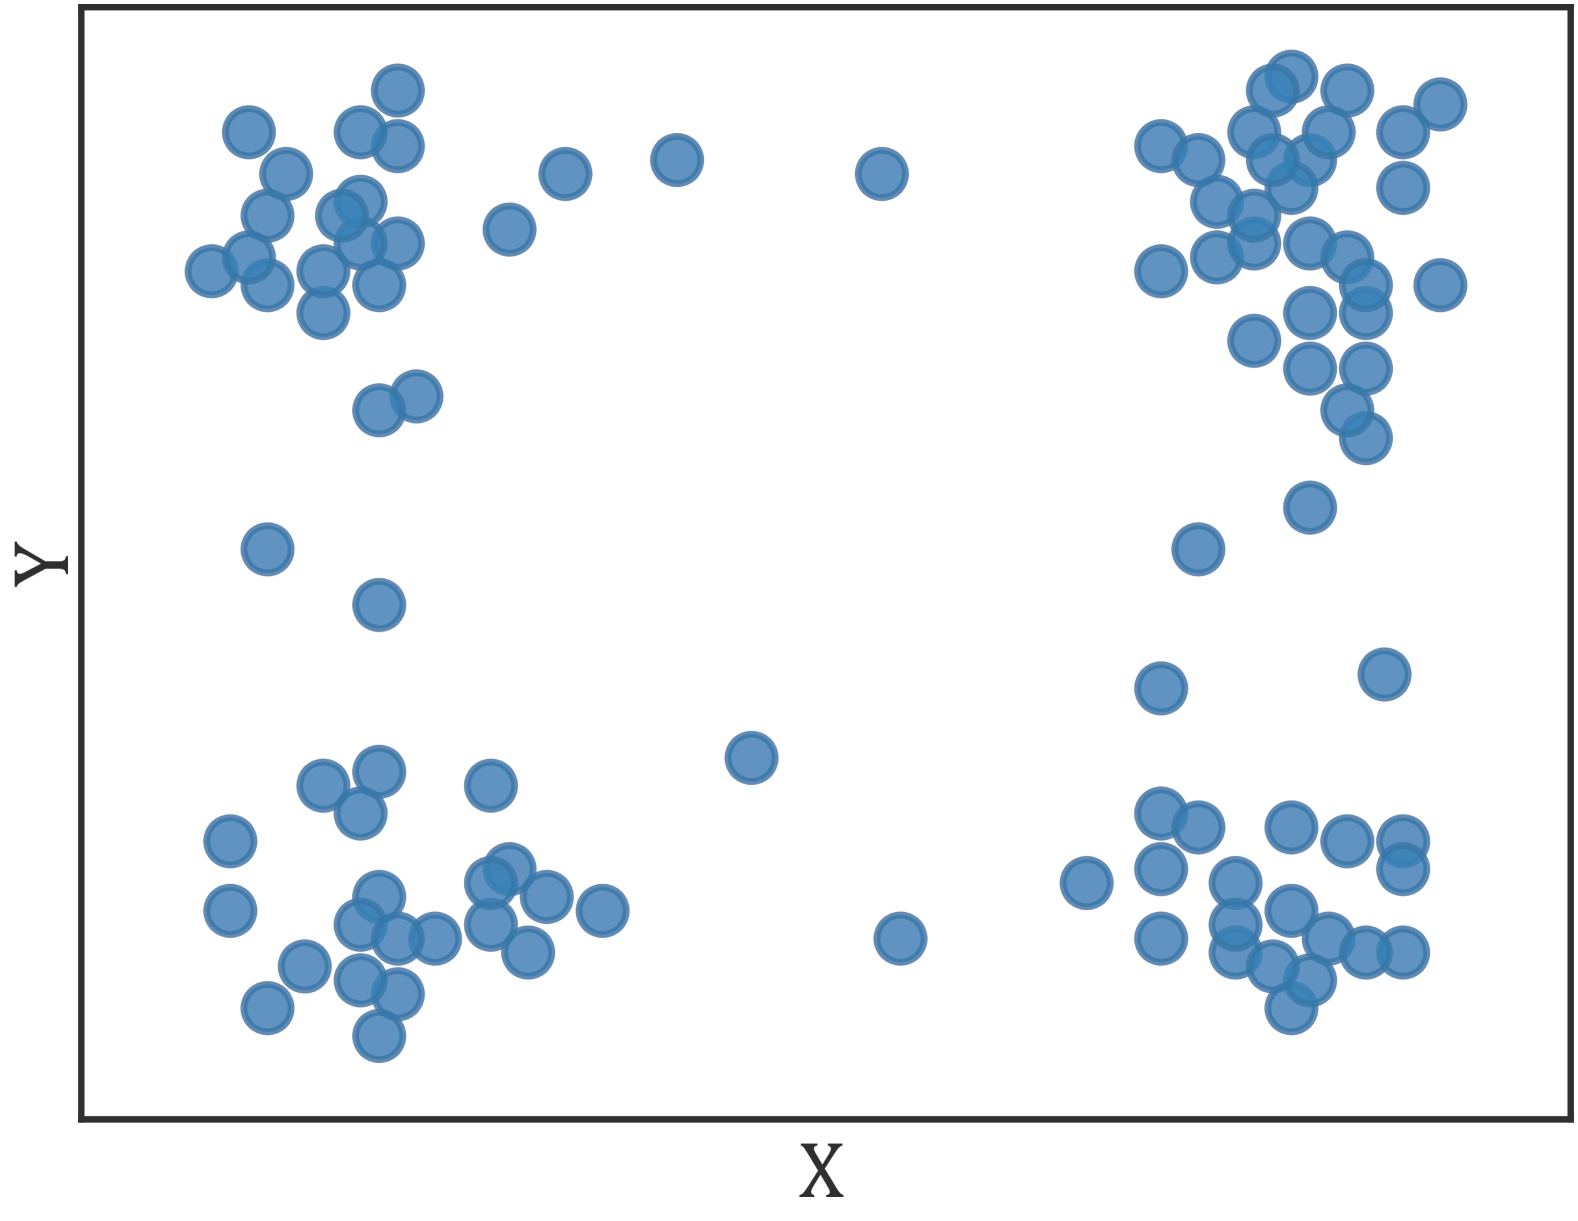
We first analyze the distribution of data collected by random policy , autonomous policy , and Subtask i’s best-performing autonomous policy . The average nearest-neighbor distance is computed to assess distribution evenness, as shown in Fig. 5.
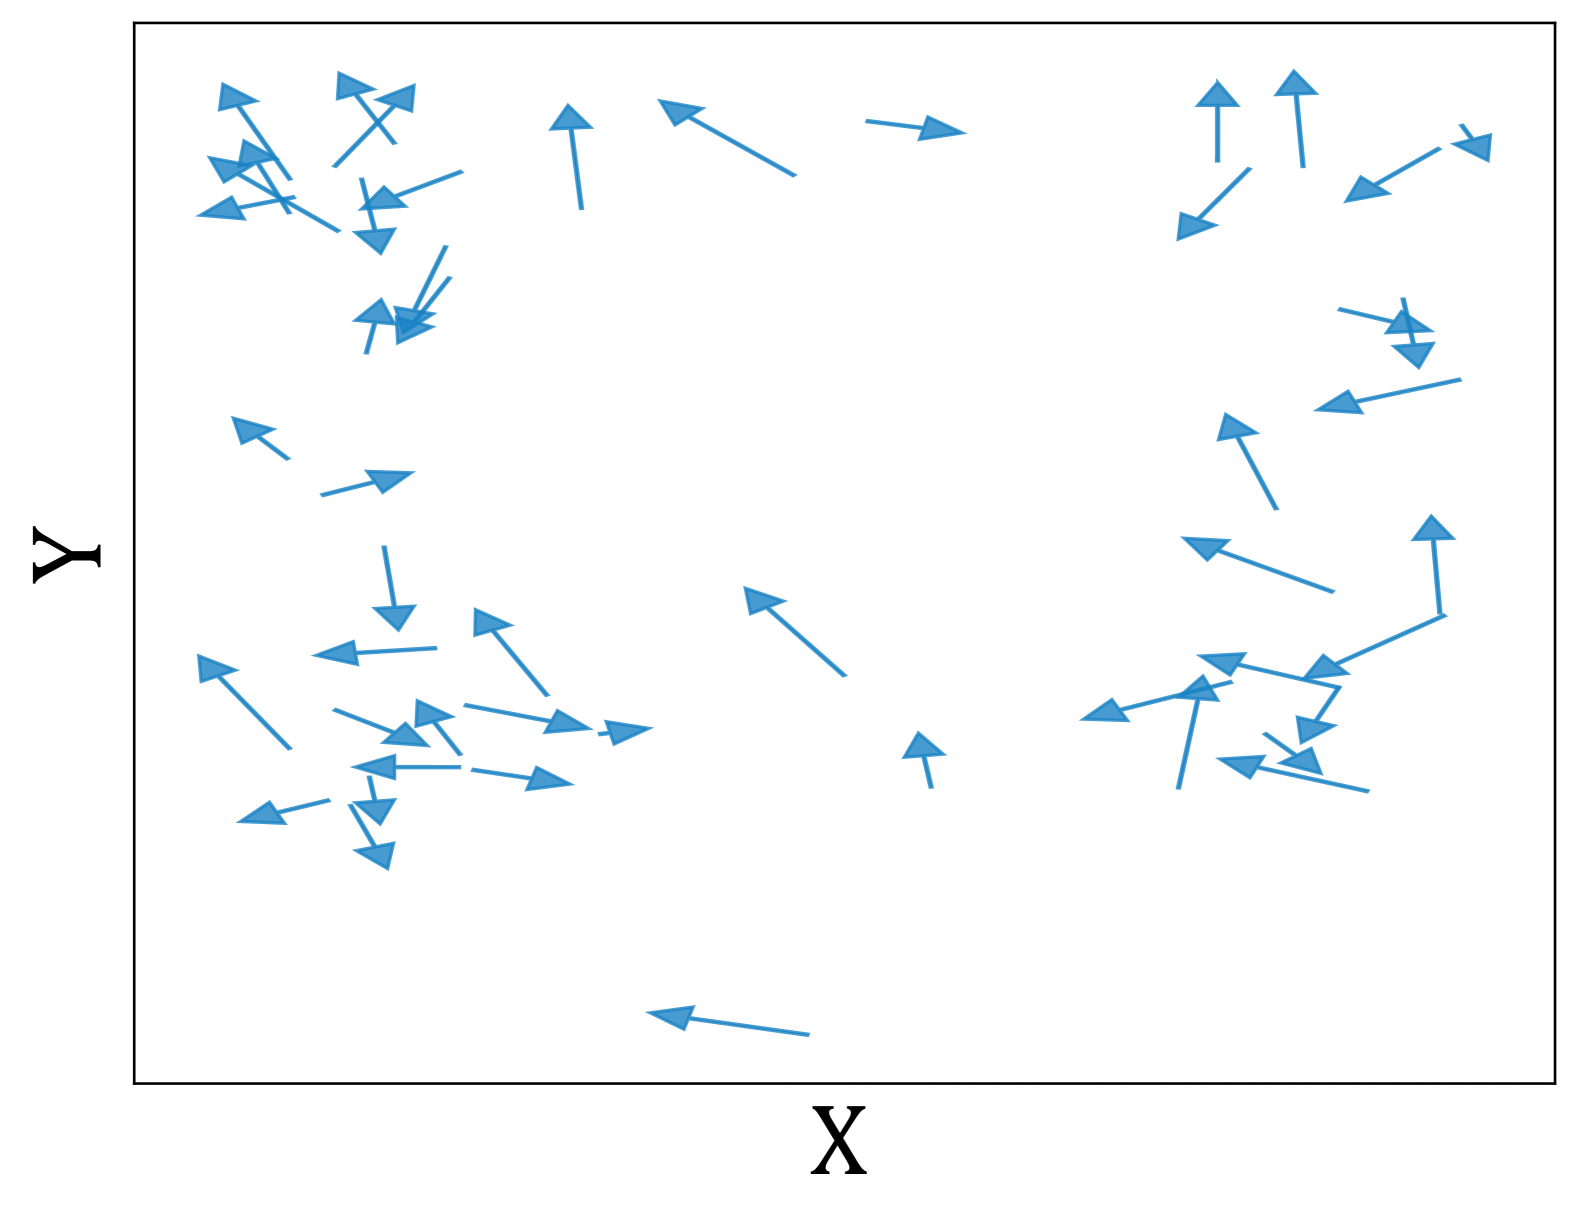
Distinct trends emerge across the collected data:
-
•
has the most even distribution, primarily due to the large volume of collected data. Note that during , no episodes occurred in the center due to a 3 cm limit set around the red cube, preventing accidental disturbances of the red cube from random motor commands.
-
•
shows a strong distributional bias, with most successful episodes occurring when the green cube’s initial position is in the top-right corner. We hypothesize this results from a biased relative position between predicted and ground truth green cube positions. As shown in the third row of Fig. 5(d), predictions are often top-left of the ground truth position, potentially leading to higher success rates in certain regions. This bias is less apparent in data collected by the random policy and the best-performing autonomous policy .
-
•
achieves a more balanced distribution than and attains the highest success rate among all data collection policies in Subtask i. This improvement may result from composing and with enforced even distribution, which increases the amount of training episodes while preserving distributional balance.
V-C2 What composition of random and autonomous data yields better performance?
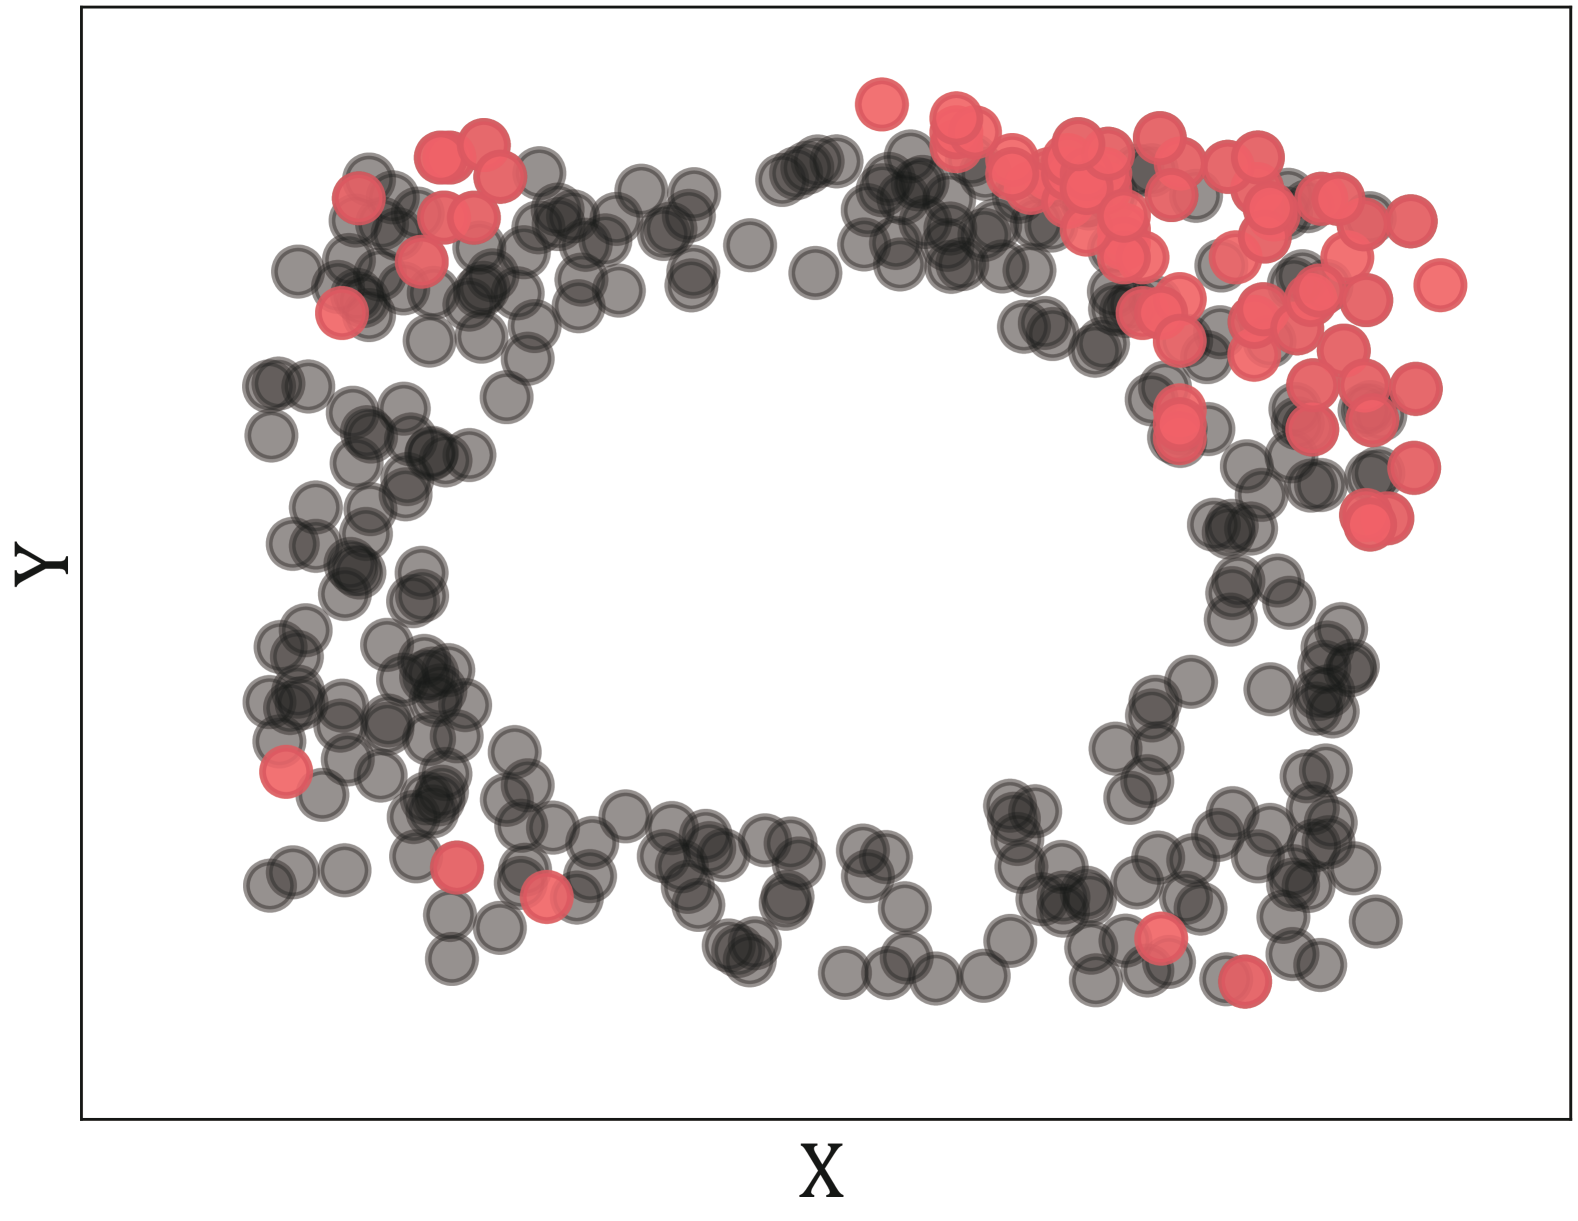
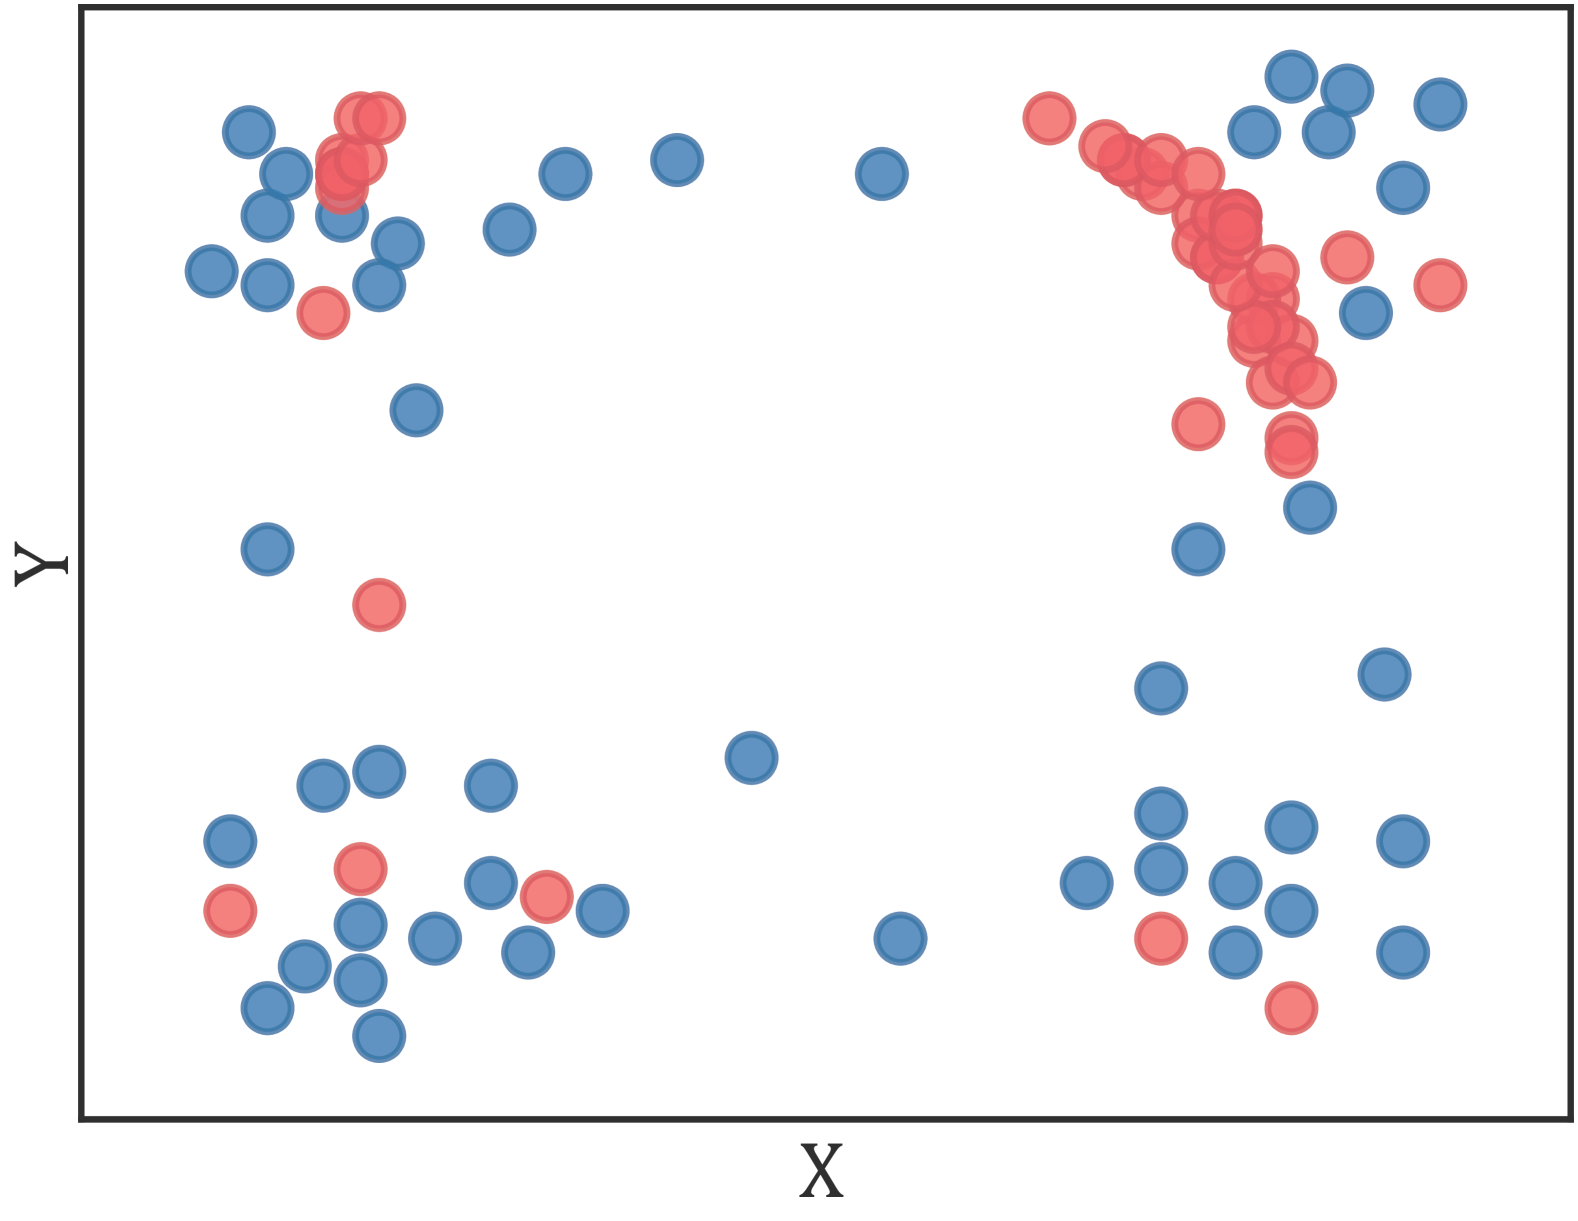
To further investigate the impact of data composition on subsequent policy training, we compare three types of composition: (1) , a direct combination of and ; (2) , a combination of and with enforced even distribution; and (3) , which only consists of successful episodes from . The data distribution and average nearest-neighbor distance between data points are shown in Fig. 6.
Combining Fig. 4, we observe that:
-
•
Policies trained on composed datasets (, ) outperform those trained on single-source data (), highlighting the importance of cross-stage data composition for subsequent training. The gain is mainly due to the larger number of training episodes.
-
•
Enforcing even distribution in data composition () further improves policy success rates over a simple combination (). This highlights the importance of balancing data while merging across stages, as it amplifies the benefits of added episodes.
V-C3 Is one policy enough for multi-stage tasks?
To enable the use of random motor commands, the two-layer stacking task is split into two subtasks: Subtask i (grasping) and Subtask ii (stacking). We design and evaluate two strategies for combining subtask data to complete the full task: (1) , trained on complete-task episodes from ; and (2) , which runs separate policies sequentially for each subtask. From Fig. 4, we observe that:
-
•
performs well on Subtask i but fails entirely on Subtask ii, showing strong subtask overfitting. During evaluation, the policy repeatedly refines the grasp without proceeding to the placing phase, even after multiple successful grasps. This suggests that a single behavior cloning policy with a ResNet18 encoder may struggle with sequential complete-task execution, likely due to limited model capacity—consistent with our findings in Tab. V under Paradigm I. However, scaling to higher-capacity models may require more successful episodes per stage and more stages overall, placing greater demands on automatic labeling and environment resetting.
-
•
demonstrates the effectiveness of using separate policies for each subtask, indicating that small-capacity models, when used independently, may support autonomous collection for long-horizon tasks.
VI Conclusion
Limitations. The current study limits the target task to two-layer stacking, a design compromise made to enable automatic collection in Paradigm II and to report results from large-scale real-world evaluations. At present, the staged learning framework in Paradigm II is studied with a single model—behavior cloning using a ResNet18 encoder—and spans only five stages, most of which consist of 50 successful episodes. This constrains the exploration of tasks with longer horizons and models with larger capacities. Additionally, our analysis focuses on individual frames and motor commands, overlooking the richer information in random exploration videos. These videos capture how random robot actions influence the environment and shape its dynamics under physical constraints, making them valuable for further investigation.
Future Work. Our future work will focus on modeling environmental dynamics from random exploration videos. We also plan to extend the staged learning framework in Paradigm II with increased number of stages to more complex tasks using larger-capacity models, leveraging identified trends to further explore its applicability in fully autonomous data collection.
Conclusion. In this paper, we present a large-scale experimental study using over 750 hours of robot-collected data to investigate the applicability of random exploration data to visuo-motor policies within the scope of imitation learning. Paradigm I evaluates the use of random exploration video frames through three self-supervised pre-training objectives: reconstruction, contrastive, and distillation loss. We identify MoCo with a ViT-Small architecture as an effective approach for visual pre-training leveraging random exploration video frames, though its performance is highly dependent on object initial positions. Paradigm II evaluates the effectiveness of random motor commands for autonomous data collection within a fully automated staged learning framework. We find that autonomous data collection policies exhibit a strong distributional bias regarding the position of successful episodes in the workspace; however, incorporating data collected via random motor commands introduces balancing randomness, mitigating the distributional bias. Furthermore, our findings suggest that enforcing an even data distribution when composing data across stages and employing separate subtask policies may enable fully autonomous collection of sequential tasks. To facilitate continued research, we will release the CloudGripper-Stack-750 dataset, comprising 750 hours of continuous recordings of 400 successful and 12,000 failed episodes. And the fully automated data collection pipeline—including episode labeling, termination, and resetting—will also be open-sourced to facilitate continued exploration of random exploration in complex tasks.
References
- [1] A. Mandlekar, D. Xu, J. Wong, S. Nasiriany, C. Wang, R. Kulkarni, L. Fei-Fei, S. Savarese, Y. Zhu, and R. Martín-Martín, “What matters in learning from offline human demonstrations for robot manipulation,” arXiv preprint arXiv:2108.03298, 2021.
- [2] A. Brohan, N. Brown, J. Carbajal, Y. Chebotar, J. Dabis, C. Finn, K. Gopalakrishnan, K. Hausman, A. Herzog, J. Hsu et al., “Rt-1: Robotics transformer for real-world control at scale,” arXiv preprint arXiv:2212.06817, 2022.
- [3] E. Jang, A. Irpan, M. Khansari, D. Kappler, F. Ebert, C. Lynch, S. Levine, and C. Finn, “Bc-z: Zero-shot task generalization with robotic imitation learning,” in Conference on Robot Learning. PMLR, 2022, pp. 991–1002.
- [4] K. He, X. Chen, S. Xie, Y. Li, P. Dollár, and R. Girshick, “Masked autoencoders are scalable vision learners,” in Proceedings of the IEEE/CVF conference on computer vision and pattern recognition, 2022, pp. 16 000–16 009.
- [5] X. Chen, S. Xie, and K. He, “An empirical study of training self-supervised vision transformers,” in Proceedings of the IEEE/CVF international conference on computer vision, 2021, pp. 9640–9649.
- [6] M. Caron, H. Touvron, I. Misra, H. Jégou, J. Mairal, P. Bojanowski, and A. Joulin, “Emerging properties in self-supervised vision transformers,” in Proceedings of the IEEE/CVF international conference on computer vision, 2021, pp. 9650–9660.
- [7] A. Dosovitskiy, “An image is worth 16x16 words: Transformers for image recognition at scale,” arXiv preprint arXiv:2010.11929, 2020.
- [8] K. He, X. Zhang, S. Ren, and J. Sun, “Deep residual learning for image recognition,” in Proceedings of the IEEE conference on computer vision and pattern recognition, 2016, pp. 770–778.
- [9] L. Pinto and A. Gupta, “Supersizing self-supervision: Learning to grasp from 50k tries and 700 robot hours,” in 2016 IEEE international conference on robotics and automation (ICRA). IEEE, 2016, pp. 3406–3413.
- [10] A. Kaliff, S. Jin, M. Zahid, and F. T. Pokorny, “Cloudgripper-autograsper: A cloud robotics toolkit for automatic data collection,” 2024. [Online]. Available: https://github.com/cloudgripper/autograsper
- [11] A. Radford, J. Wu, R. Child, D. Luan, D. Amodei, I. Sutskever et al., “Language models are unsupervised multitask learners,” OpenAI blog, vol. 1, no. 8, p. 9, 2019.
- [12] A. Radford, J. W. Kim, C. Hallacy, A. Ramesh, G. Goh, S. Agarwal, G. Sastry, A. Askell, P. Mishkin, J. Clark et al., “Learning transferable visual models from natural language supervision,” in International conference on machine learning. PMLR, 2021.
- [13] T. Xiao, I. Radosavovic, T. Darrell, and J. Malik, “Masked visual pre-training for motor control,” arXiv preprint arXiv:2203.06173, 2022.
- [14] Y. J. Ma, S. Sodhani, D. Jayaraman, O. Bastani, V. Kumar, and A. Zhang, “Vip: Towards universal visual reward and representation via value-implicit pre-training,” arXiv preprint arXiv:2210.00030, 2022.
- [15] S. Nair, A. Rajeswaran, V. Kumar, C. Finn, and A. Gupta, “R3m: A universal visual representation for robot manipulation,” arXiv preprint arXiv:2203.12601, 2022.
- [16] A. Majumdar, K. Yadav, S. Arnaud, J. Ma, C. Chen, S. Silwal, A. Jain, V.-P. Berges, T. Wu, J. Vakil et al., “Where are we in the search for an artificial visual cortex for embodied intelligence?” Advances in Neural Information Processing Systems, vol. 36, pp. 655–677, 2023.
- [17] Y. Seo, D. Hafner, H. Liu, F. Liu, S. James, K. Lee, and P. Abbeel, “Masked world models for visual control,” in Conference on Robot Learning. PMLR, 2023, pp. 1332–1344.
- [18] I. Radosavovic, B. Shi, L. Fu, K. Goldberg, T. Darrell, and J. Malik, “Robot learning with sensorimotor pre-training,” in Conference on Robot Learning. PMLR, 2023, pp. 683–693.
- [19] J. Deng, W. Dong, R. Socher, L.-J. Li, K. Li, and L. Fei-Fei, “Imagenet: A large-scale hierarchical image database,” in 2009 IEEE conference on computer vision and pattern recognition. Ieee, 2009, pp. 248–255.
- [20] K. Grauman, A. Westbury, E. Byrne, Z. Chavis, A. Furnari, R. Girdhar, J. Hamburger, H. Jiang, M. Liu, X. Liu et al., “Ego4d: Around the world in 3,000 hours of egocentric video,” in Proceedings of the IEEE/CVF Conference on Computer Vision and Pattern Recognition, 2022, pp. 18 995–19 012.
- [21] R. Goyal, S. Ebrahimi Kahou, V. Michalski, J. Materzynska, S. Westphal, H. Kim, V. Haenel, I. Fruend, P. Yianilos, M. Mueller-Freitag et al., “The” something something” video database for learning and evaluating visual common sense,” in Proceedings of the IEEE international conference on computer vision, 2017, pp. 5842–5850.
- [22] D. Shan, J. Geng, M. Shu, and D. F. Fouhey, “Understanding human hands in contact at internet scale,” in Proceedings of the IEEE/CVF conference on computer vision and pattern recognition, 2020, pp. 9869–9878.
- [23] S. Levine, P. Pastor, A. Krizhevsky, J. Ibarz, and D. Quillen, “Learning hand-eye coordination for robotic grasping with deep learning and large-scale data collection,” The International journal of robotics research, vol. 37, no. 4-5, pp. 421–436, 2018.
- [24] R. Detry, D. Kraft, O. Kroemer, L. Bodenhagen, J. Peters, N. Krüger, and J. Piater, “Learning grasp affordance densities,” Paladyn, vol. 2, pp. 1–17, 2011.
- [25] R. Paolini, A. Rodriguez, S. S. Srinivasa, and M. T. Mason, “A data-driven statistical framework for post-grasp manipulation,” The International Journal of Robotics Research, vol. 33, no. 4, pp. 600–615, 2014.
- [26] A. Morales, E. Chinellato, A. H. Fagg, and A. P. Del Pobil, “Using experience for assessing grasp reliability,” International Journal of Humanoid Robotics, vol. 1, no. 04, pp. 671–691, 2004.
- [27] F. T. Pokorny, K. Hang, and D. Kragic, “Grasp moduli spaces.” in Robotics: Science and Systems, 2013.
- [28] A. Krizhevsky, I. Sutskever, and G. E. Hinton, “Imagenet classification with deep convolutional neural networks,” Advances in neural information processing systems, vol. 25, 2012.
- [29] H. Liu, S. Nasiriany, L. Zhang, Z. Bao, and Y. Zhu, “Robot learning on the job: Human-in-the-loop autonomy and learning during deployment,” The International Journal of Robotics Research, p. 02783649241273901, 2022.
- [30] K. Bousmalis, G. Vezzani, D. Rao, C. Devin, A. X. Lee, M. Bauzá, T. Davchev, Y. Zhou, A. Gupta, A. Raju et al., “Robocat: A self-improving generalist agent for robotic manipulation,” arXiv preprint arXiv:2306.11706, 2023.
- [31] M. Ahn, D. Dwibedi, C. Finn, M. G. Arenas, K. Gopalakrishnan, K. Hausman, B. Ichter, A. Irpan, N. Joshi, R. Julian et al., “Autort: Embodied foundation models for large scale orchestration of robotic agents,” arXiv preprint arXiv:2401.12963, 2024.
- [32] S. Levine, C. Finn, T. Darrell, and P. Abbeel, “End-to-end training of deep visuomotor policies,” Journal of Machine Learning Research, vol. 17, no. 39, pp. 1–40, 2016.
- [33] T. Gao, S. Nasiriany, H. Liu, Q. Yang, and Y. Zhu, “Prime: Scaffolding manipulation tasks with behavior primitives for data-efficient imitation learning,” arXiv preprint arXiv:2403.00929, 2024.
- [34] S. Jin, R. Wang, M. Zahid, and F. T. Pokorny, “How physics and background attributes impact video transformers in robotic manipulation: A case study on planar pushing,” in 2024 IEEE/RSJ International Conference on Intelligent Robots and Systems (IROS). IEEE, 2024, pp. 7391–7398.
- [35] M. Zahid and F. T. Pokorny, “Cloudgripper: An open source cloud robotics testbed for robotic manipulation research, benchmarking and data collection at scale,” in 2024 IEEE International Conference on Robotics and Automation (ICRA). IEEE, 2024, pp. 12 076–12 082.
- [36] A. v. d. Oord, Y. Li, and O. Vinyals, “Representation learning with contrastive predictive coding,” arXiv preprint arXiv:1807.03748, 2018.
- [37] Z. Wu, Y. Xiong, S. X. Yu, and D. Lin, “Unsupervised feature learning via non-parametric instance discrimination,” in Proceedings of the IEEE conference on computer vision and pattern recognition, 2018, pp. 3733–3742.
- [38] S. Dasari, M. K. Srirama, U. Jain, and A. Gupta, “An unbiased look at datasets for visuo-motor pre-training,” in Conference on Robot Learning. PMLR, 2023, pp. 1183–1198.
- [39] R. Rahmatizadeh, P. Abolghasemi, A. Behal, and L. Bölöni, “From virtual demonstration to real-world manipulation using lstm and mdn,” in Proceedings of the AAAI Conference on Artificial Intelligence, vol. 32, no. 1, 2018.
- [40] L. Smaira, J. Carreira, E. Noland, E. Clancy, A. Wu, and A. Zisserman, “A short note on the kinetics-700-2020 human action dataset,” arXiv preprint arXiv:2010.10864, 2020.
- [41] S. Dasari, F. Ebert, S. Tian, S. Nair, B. Bucher, K. Schmeckpeper, S. Singh, S. Levine, and C. Finn, “Robonet: Large-scale multi-robot learning,” arXiv preprint arXiv:1910.11215, 2019.
- [42] I. Radosavovic, T. Xiao, S. James, P. Abbeel, J. Malik, and T. Darrell, “Real-world robot learning with masked visual pre-training,” in Conference on Robot Learning. PMLR, 2023, pp. 416–426.
- [43] J. Gildenblat and contributors, “Pytorch library for cam methods,” https://github.com/jacobgil/pytorch-grad-cam, 2021.