Solvation enhances folding cooperativity and the topology dependence of folding rates in a lattice protein model
Abstract
The aqueous solvent profoundly influences protein folding, yet its effects are relatively poorly understood. In this study, we investigate the impact of solvation on the folding of lattice proteins by using Monte Carlo simulations. The proteins are modelled as self-avoiding 27-mer chains on a cubic lattice, with compact native states and structure-based Gō potentials. Each residue that makes no contacts with other residues in a given protein conformation is assigned a solvation energy , representing its full exposure to the solvent. We find that a negative , indicating a favorable solvation, increases the cooperativity of the folding transition by lowering the free energy of the unfolded state, increasing the folding free energy barrier, and narrowing the folding routes. This favorable solvation also significantly improves the correlation between folding rates and the native topology, measured by the relative contact order. Our results suggest that Gō model may overestimate the importance of native interactions and a solvation potential countering the native bias can play a significant role. The solvation energy in our model can be related to the polar interaction between water and peptide groups in the protein backbone. It is therefore suggested that the solvation of peptide groups may significantly contribute to the exceptional folding cooperativity and the pronounced topology-dependence of folding rates observed in two-state proteins.
I Introduction
Water plays a fundamental role in protein folding, mainly through the dominance of the hydrophobic effect Kauzmann (1959); Dill (1990); Baldwin and Rose (2016) in the folding and stabilization of proteins. Water also influences helix propensities of amino acids Luo and Baldwin (1999) and regulates protein aggregation Thirumalai, Reddy, and Straub (2012). The extent of water-mediated effects on protein folding remains elusive, despite extensive research. It has been shown experimentally that solvation free energies are pairwise non-additive Morgantini and Kollman (1995), complicating the modeling and analysis of proteins by requiring many-body interactions Papoian et al. (2004). The particulate nature of water gives rise to a desolvation barrier Pratt and Chandler (1977); Rank and Baker (1997); Levy and Onuchic (2006) to hydrophobic cluster formation, which may contribute to the rate-limiting step in protein folding Cheung, Garc´ıa, and Onuchic (2002); Kaya and Chan (2003a); Liu and Chan (2005). The role of solvents extends beyond water, as changes in the solvent conditions such as pH, ionic strength, or the presence of denaturants, can modulate the folding rates and outcomes Jackson and Fersht (1991). Simulating folding kinetics at atomic resolution, whether with explicit or implicit solvents, remains highly computationally demanding Rhee et al. (2004); Lindorff-Larsen et al. (2011). Meanwhile, valuable insights into the role of solvents on protein folding can be obtained using simple lattice Hao and Scheraga (1997); Sorenson and Head-Gordon (1998), off-lattice Cheung, Garc´ıa, and Onuchic (2002); Kaya and Chan (2003a); Liu and Chan (2005) and continuous Snir and Kamien (2005); Banavar et al. (2007) models.
In this study, we examine the role of solvation in determining two remarkable properties of two-state proteins—a class of small, single-domain proteins that fold essentially with simple two-state kinetics Viguera et al. (1994); Plaxco et al. (1998). One is folding cooperativity, which refers to the ability of proteins to exhibit a sharp transition between the unfolded and folded states without significant intermediate states, resembling an “all-or-none” process Chan, Shimizu, and Kaya (2004). Two-state proteins exhibit surprisingly high folding cooperativity in both kinetic and thermodynamic aspects, compared to those obtained from simulations Kaya and Chan (2000a, b, 2003b). The other property is the topology dependence of folding rates, an important observation made by Plaxco et al. Plaxco, Simons, and Baker (1998); Plaxco et al. (2000). These authors discovered a strong correlation between the logarithms of experimentally observed folding rates for two-state proteins and the relative contact order Plaxco, Simons, and Baker (1998), which is defined as the average sequence separation of native contacts relative to the protein chain length. This empirical result called into question early theories and simulations regarding the folding rates, many of which suggested that chain length is a dominant factor Thirumalai (1995); Gutin, Abkevich, and Shakhnovich (1996); Cieplak, Hoang, and Li (1999); Cieplak and Hoang (2000, 2001); Finkelstein and Badredtinov (1997). Despite significant progress Debe and Goddard III (1999); Muñoz and Eaton (1999); Weikl and Dill (2003); Makarov and Plaxco (2003); Fersht (2000); Paci et al. (2005); Jewett, Pande, and Plaxco (2003); Kaya and Chan (2003c); Wallin and Chan (2005); Badasyan, Liu, and Chan (2008); Ferguson, Liu, and Chan (2009); Chan et al. (2011); Kaya, Uzunoğlu, and Chan (2013); Koga and Takada (2001); Cieplak and Hoang (2003); Cieplak (2004), our understanding of the physical basis for the rate-topology dependence remains limited. It was suggested that the rate-topology dependence is a consequence of the extraordinary folding cooperativity in two-state proteins Jewett, Pande, and Plaxco (2003). Thus, our goal is to check if solvation contributes to the folding cooperativity and whether its increase is associated with the increase in the rate-topology dependence.
Gō Taketomi, Ueda, and Gō (1975) and Gō-like models Hoang and Cieplak (2000a, b); Clementi, Nymeyer, and Onuchic (2000) have been widely used for studying the folding mechanism Baker (2000); Takada (2019), offering insights into how the folding process is driven solely by native interactions. Despite this global native preference, these models show moderate folding cooperativity Kaya and Chan (2000a, b); Chan, Shimizu, and Kaya (2004) and insignificant to low correlations between folding rates and the relative contact order Koga and Takada (2001); Cieplak and Hoang (2003); Cieplak (2004). Jewett et al. Jewett, Pande, and Plaxco (2003) demonstrated that adding an explicit energetically cooperative feature to the Hamiltonian of the lattice Gō model can give rise to the rate-topology correlation. Another modification to the Gō model that leads to a similar effect was given by Kaya and Chan Kaya and Chan (2003c), who introduced a coupling between non-local contact interactions and local conformational preferences. These studies indicate that an energetic component leading to folding cooperativity is missing in the Gō model. More recently, by using an off-lattice Gō-like model with desolvation barriers in the pairwise potentials, Chan and coworkers Badasyan, Liu, and Chan (2008); Ferguson, Liu, and Chan (2009); Chan et al. (2011); Kaya, Uzunoğlu, and Chan (2013) showed that the desolvation barriers can substantially enhance folding cooperativity and the diversity in the folding rates, while their impact on the rate-topology correlation is modest.
Here, we propose a modification to the Gō model by incorporating a solvation energy term that favors fully solvent-exposed residues. This modification is based on a hypothesis that Gō potentials may overemphasize the contributions of native interactions to folding free energy, thereby undermining favorable solvent-protein interactions in the unfolded state, such as the polar interaction between water and exposed peptide groups in an unfolded protein. Not only competing with native interactions, the proposed solvation energy can also energetically disfavor the formation of non-native contacts. Finally, the solvation energy term represents a many-body interaction, enabling it to influence a wide range of conformations in a pairwise non-additive manner. We will show that this modification produces intriguing effects on folding cooperativity and the rate-topology dependence of the protein model.
II Model and Methods
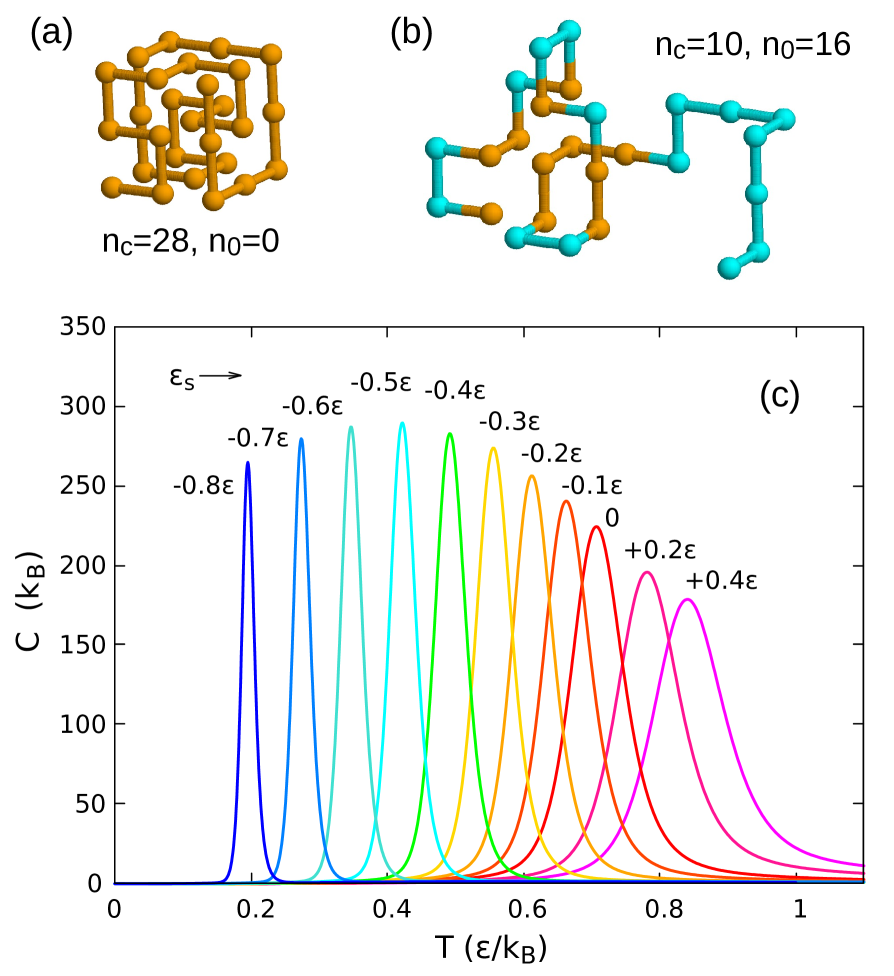
We model proteins as self-avoiding chains on a three-dimensional cubic lattice with Gō potentials Taketomi, Ueda, and Gō (1975) for contacts between the residues and an implicit solvent. The proteins are of the same length of 27 residues and have the native states being compact conformations (see an example of a native conformation in Fig. 1(a)). The energy of a protein in a given conformation is given by
| (1) |
where is the number of native contacts, is an energy unit in the system with being the energy of a native contact; is the number of residues that make no contacts with other residues, considered as the number of fully solvent-exposed residues (see example in Fig. 1 (b)); and is the solvation energy per fully solvent-exposed residue. In a given protein conformation is given by
| (2) |
where is a protein contact map in the given conformation with equal to 1 if two residues and are nearest neighbors on the lattice but not consecutive along the chain, and otherwise; is the contact map of the native conformation. We generally consider , but also some positive values of for comparison. For , the model becomes identical to the Gō model Abe and Go (1981).
The relative contact order parameter (RCO) Plaxco, Simons, and Baker (1998) of a native state is defined as
| (3) |
There are 97 distinct values of RCO ranging from about 0.28 to about 0.53 for compact conformations Jewett, Pande, and Plaxco (2003). Our set of proteins corresponds to 97 different native states, such that for each RCO value there is only one native state picked up randomly from the compact conformations. The number of native contacts is for all maximally compact lattice proteins.
Our Monte Carlo (MC) simulations follow the Metropolis algorithm Metropolis et al. (1953) and the standard polymer move set, which contains single monomer moves (corner flip and end move) and double monomer moves (crankshaft) Cieplak et al. (1998). The single and double monomer moves were attempted with probabilities of 0.2 and 0.8, respectively. For calculating thermodynamic properties, we employed the replica-exchange technique Swendsen and Wang (1986) in parallel tempering simulations and the weighted histogram method Ferrenberg and Swendsen (1989) in the data analyses. The specific heat of a protein is given by
| (4) |
where denotes a thermodynamic average, is the Boltzmann constant, and is an absolute temperature. In our consideration, is given in units of .
Kinetic properties were obtained from independent folding and unfolding trajectories in multiple simulations. The folding trajectories start from random conformations sampled at infinite temperatures and proceed until the native state is reached. The unfolding trajectories start from the native state and proceed until the number of native contacts is less than 20% of that of the native state. The folding and unfolding rates ( and ) are determined as the inverse of the median folding and unfolding times, respectively. Time is measured in MC steps.
III Results
We began by studying the effects of solvation on the folding properties of proteins. For a detailed analysis, we selected a representative protein with an intermediate RCO value. The native state of this protein is illustrated in Fig. 1(a), and its corresponding RCO value is 0.4048. We calculated the temperature dependence of the specific heat for this protein at various values of , between and . Fig. 1(c) shows that as decreases, the peak of the specific heat shifts to lower temperatures and becomes sharper. The increased sharpness of the peak with decreasing is accompanied by a reduced width and an increased height of the peak; however, the height reaches its maximum at and then decreases. These remarkable changes in the specific heat peak indicate that solvation significantly influences the folding transition.
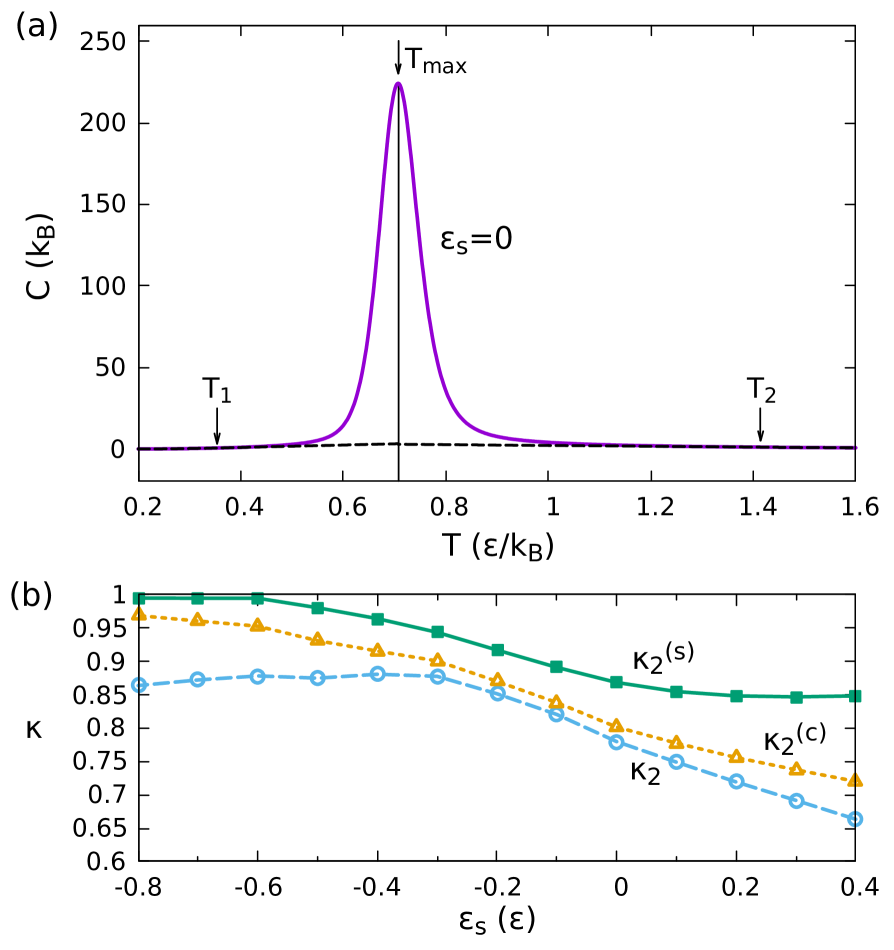
The cooperativity of the folding transition can be assessed from the specific heat data. We followed Privalov and Potekhin Privalov and Potekhin (1986), and Kaya and Chan Kaya and Chan (2000a, b), to calculate the ratio between the van’t Hoff enthalpy () and the calorimetric enthalpy () from the specific heat. The experimental calorimetric criterion requires for a two-state process Privalov and Potekhin (1986). Two-state proteins have within the range of Privalov and Potekhin (1986); Viguera et al. (1994). Though the calorimetric criterion itself is not sufficient for determining a two-state process Zhou, Hall, and Karplus (1999), may be considered as a measure of thermodynamic cooperativity Kaya and Chan (2000a, b). Without a baseline subtraction from the specific heat, can be given by Privalov and Potekhin (1986); Kaya and Chan (2000b) with , where and are the specific heat maximum and its temperature. In our numerical calculation of , the integration of is taken with running from 0 to . When a baseline subtraction is applied, is equal to , as given in Ref. Kaya and Chan (2000b) under the same notation. Our construction of the baselines (see Fig. 2(a) and its caption) is similar to that described in Ref. Kaya and Chan (2000b), with an addition that we specified the two temperatures, where the baselines for the folded and unfolded states are tangent to the specific heat curve, to be given by and , respectively. We defined also another cooperativity index, denoted as , which is without baseline subtraction but with . By comparing to and , one can see separately the effects of the temperature range and of the baselines, respectively, on their values. The numerical values of and depend on the choice of and , and it is not clear how to determine the correct values. Our aim here is to show how they qualitatively depend on .
Figure 2(b) shows that as decreases from to , monotonically increases from approximately 0.85 to more than 0.99. also monotonically increases to a value larger than 0.96, while only increases from 0.66 to a maximum of about 0.88 at and then slightly decreases. The main reason why decreases is that at low , the specific heat develops a long tail at high temperatures, leading to an increase in the calculated calorimetric enthalpy. Therefore, and may be more meaningful than in underscoring the folding transition for low values of . Both the behaviors of and indicate a significant increase of folding cooperativity upon decreasing the solvation energy parameter.
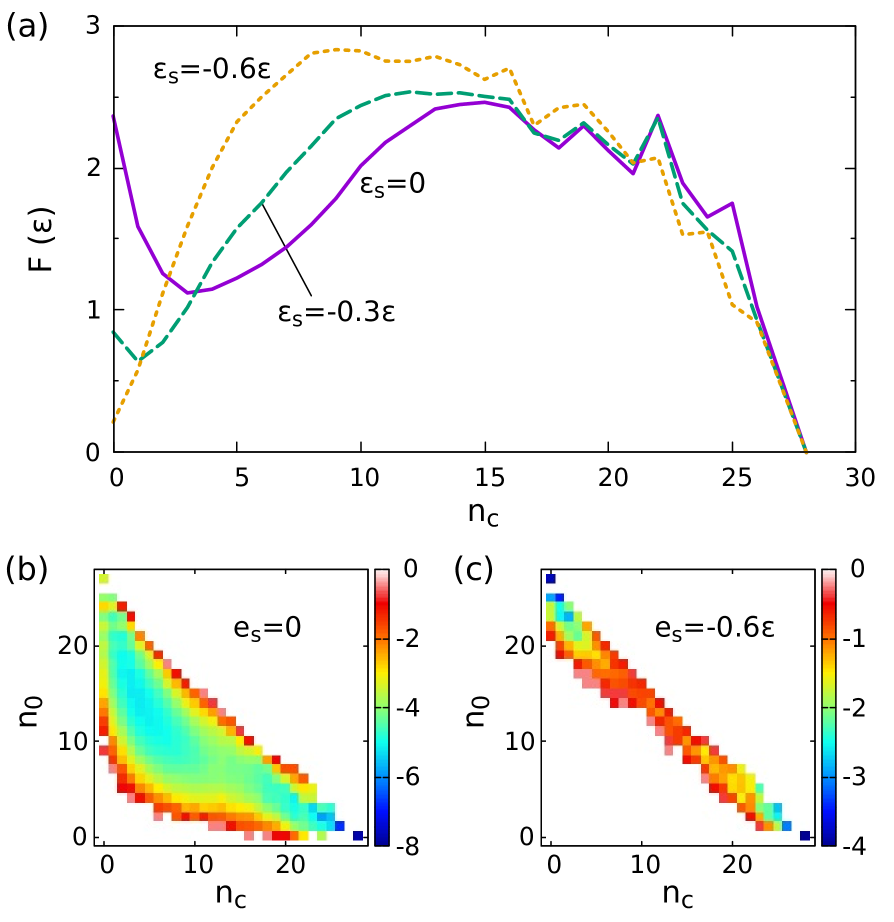
The effect of solvation on folding cooperativity can be understood by examining the free energy profiles of the protein (Fig. 3). These profiles show that a negative solvation energy shifts the unfolded state and the transition state further away from the native state along the folding coordinate, increases the folding free energy barrier, and narrows the folding pathways. Specifically, Fig. 3(a) shows that while the native state remains unchanged, the unfolded state, corresponding to the free energy minimum at a small number of native contacts , is shifted toward lower values of and also lower values of the free energy as decreases from zero to . At the same time, the transition state, which presumably corresponds to the maximum of the largest free energy barrier, is shifted toward lower values of and higher values of . Due to these shiftings, the folding free energy barrier, , given by the free energy difference between the transition state () and the unfolded state (), obtained at , is increased almost twice (from 1.34 to 2.62) as decreases from zero to . Since also decreases with (see Fig. 1), the increase of in units of is about 4 times as decreases from zero to . Figures 3 (b and c) show that the pathway between the native state and the unfolded state is narrowed due to the effect of a negative solvation energy, as the latter energetically disfavors conformations with low values of , the number of fully solvent-exposed residues. Because non-native contacts have zero energy, they are strongly disfavored by the negative solvation energy if their formation decreases . Both the increased free energy barrier and the narrowed folding pathway promote folding cooperativity, as they make the accessible states on the pathway connecting the unfolded and native states less probable, making the system more two-state-like. We have checked that the linear shape of folding pathway in the - plan shown in Fig. 3c is also found in other lattice proteins for the same value of .
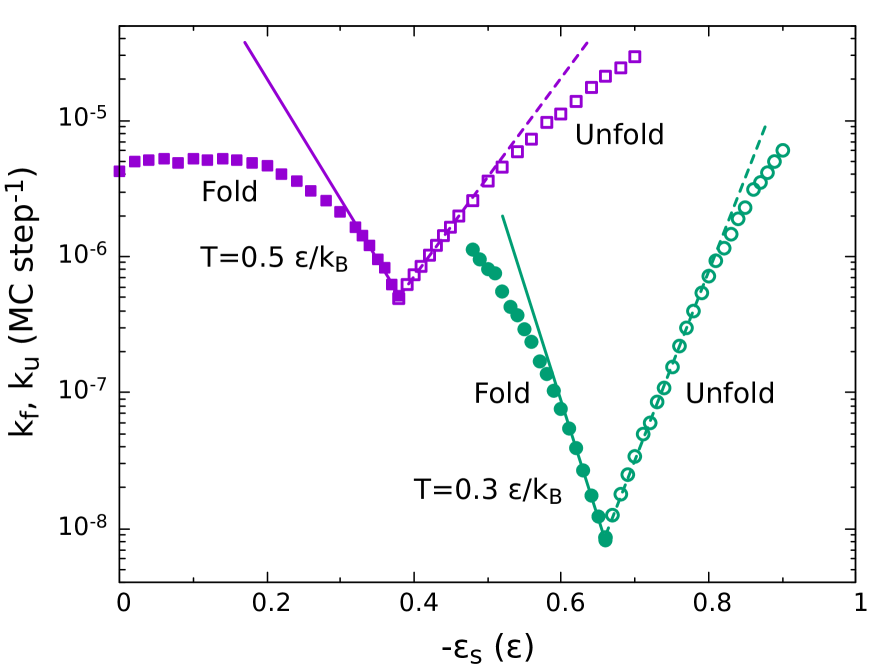
One can think of varying the solvation energy parameter as a way to mimic the effect of denaturants. We determined the folding and unfolding rates, and , at two different temperatures, and , from the simulations of the selected protein for various values of . Using these data, we constructed chevron plots of and vs. , where represents the effect of increasing denaturant concentration (Fig. 4). Note that the pure solvent may correspond to a specific value of , and the presence of a denaturant adds to that value. Figure 4 shows that as the temperature decreases, the V-shaped region around the denaturation midpoint shifts toward higher values of and lower values of and . The linear fits of and vs. near the denaturation midpoint are indications of two-state folding kinetics. Note that these linear fits are better defined, spanning a wider range of , at than at . This indicates that the kinetic data align more closely with the two-state model in the lower range of . Experimentally, the movements of the denaturation midpoint towards higher denaturant concentration and lower values of transition rates on decreasing temperature have been observed, e.g. for the N-terminal domain of L9 protein Kuhlman et al. (1998); Taskent, Cho, and Raleigh (2008). For this protein, no rollover of the chevron plots was observed, even at low concentrations of denaturant, for temperatures between 9∘C and 40∘C Kuhlman et al. (1998); Taskent, Cho, and Raleigh (2008), indicating a very high two-state kinetic cooperativity that remains unchanged within this range of temperature. For temperatures above 55∘C, the range of denaturant concentration at which the rates can be measured is significantly reduced Kuhlman et al. (1998), which somewhat aligns with our simulation results.
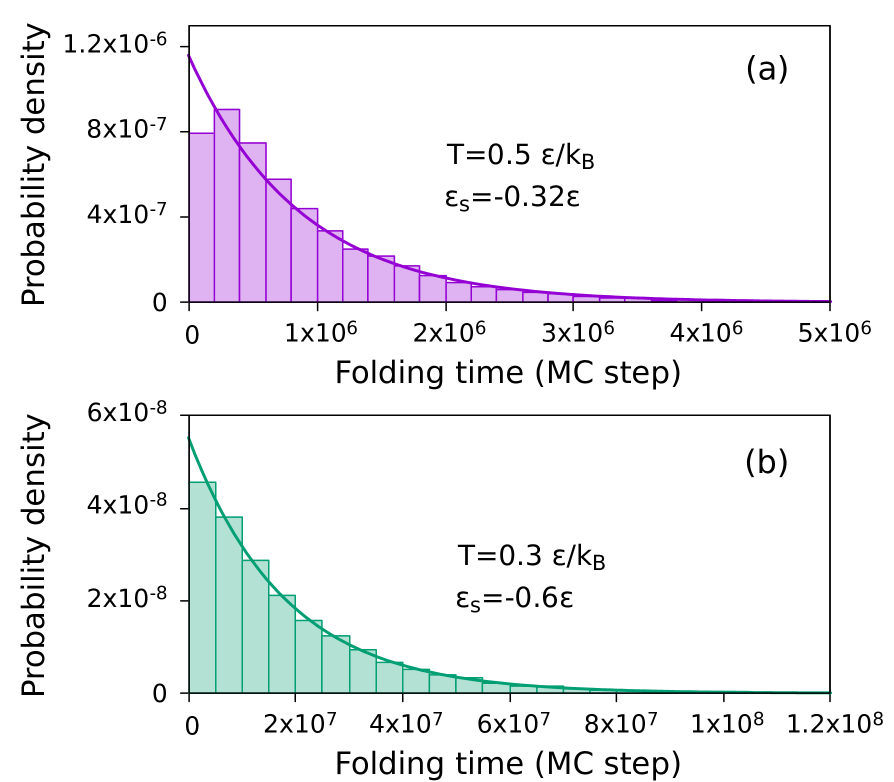
Figure 5 shows that the histograms of the folding times obtained from simulations for the temperature and solvation energy parameters, and , within the linear regions of the corresponding chevron plots in Fig. 4, align well with an exponential distribution of folding time, which is characteristic of the kinetics of a two-state system Plaxco et al. (1998). Notably, the histogram at and (Fig. 5b) fits the exponential function slightly better at low time values than the one at and (Fig. 5a), indicating an increased two-state cooperativity at the lower value.
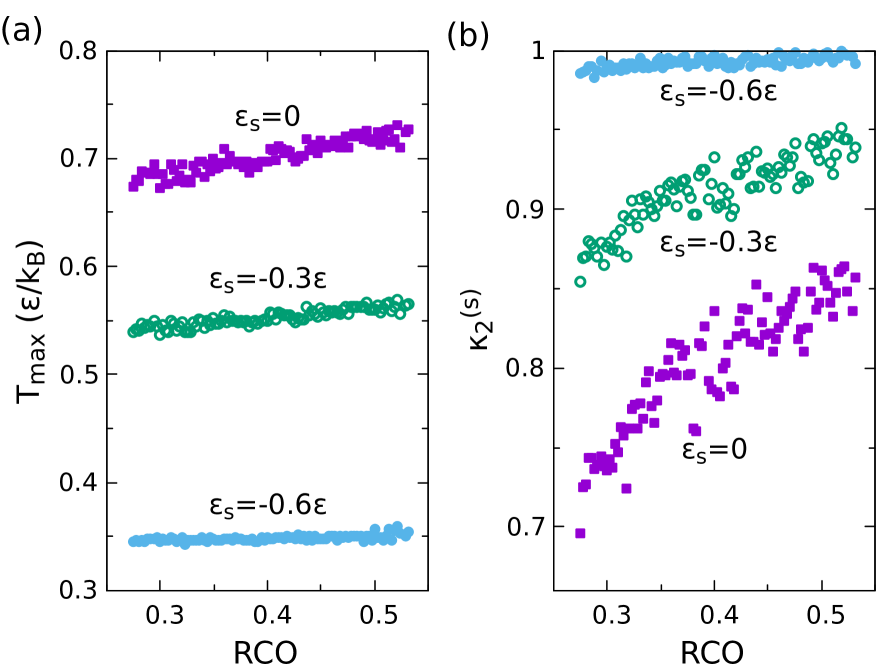
We now turn to examining the effect of solvation on the correlations between folding properties and the relative contact order. To this end, we considered 97 model proteins with distinct RCO values and determined their specific heats and folding rates through simulations. Figure 6a shows that the temperature , corresponding to the maximum of the specific heat of the proteins, increases weakly with RCO, albeit with some small variations. Without solvation, rises by approximately 8% as RCO increases from 0.28 to 0.53. With solvation, the rise decreases to about 6% for and about 4% for . Fig. 6b shows that the cooperativity index with a baseline subtraction, , on average, increases with RCO. Interestingly, the RCO dependence of this cooperativity index is strongest for the case without solvation, , and weakens as decreases below zero. Similar trends are also found for and (data not shown). These results indicate that proteins with higher RCO in general are thermally more stable and have higher folding cooperativity than those with lower RCO. It is also shown that solvation weakens the RCO dependence of both thermal stability and folding cooperativity, even though it enhances folding cooperativity. These behaviors can be rationalized as being due to the stabilizing effect of short-range native contacts (along the sequence). In the absence of the solvation term, a larger number of such contacts are expected to be present in conformations of the unfolded state for proteins with lower RCO, leading to an increased stability of the unfolded state and consequently a lower folding temperature. More of these contacts also contribute to the stability of partially folded conformations, leading to a decreased folding cooperativity for proteins with lower RCO. In the presence of the solvation energy term, the effect of short-range native contacts is diminished by competing solvent interactions.
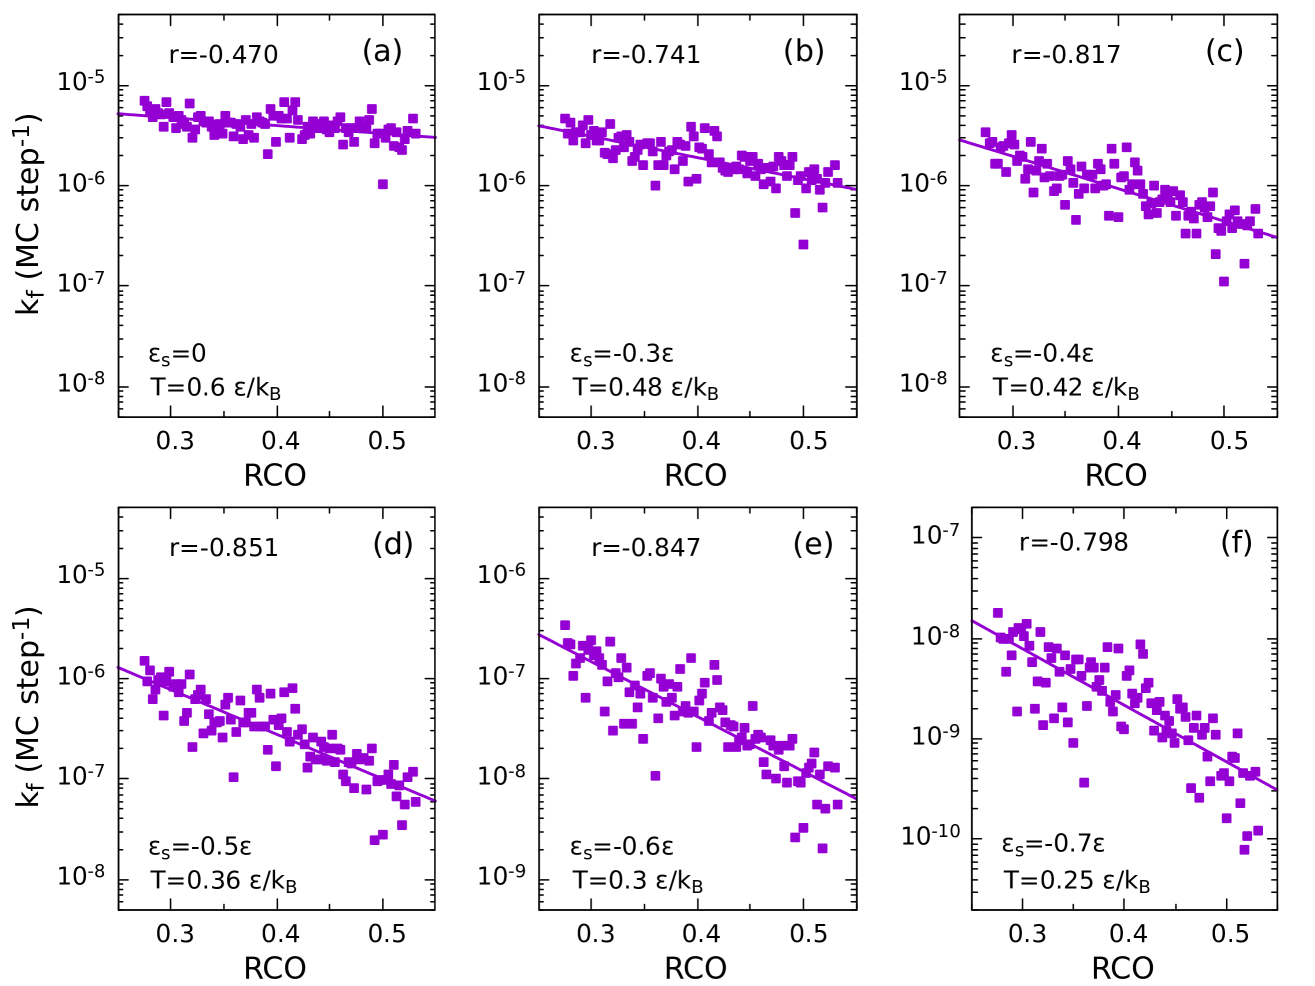
To examine the effect of solvation on the rate-topology dependence, we determined the folding rates, , at constant temperatures ’s below for all 97 proteins. We found that the best correlation between and RCO occurs when is in the range from to , where is the mean value of of all the proteins at a given . Figure 7 shows the dependence of on RCO at temperatures within this ‘optimal’ range for various values of . For each value of , this rate-topology dependence is shown for a fixed temperature for all proteins to mimic a real situation, as if the folding rates of all proteins were measured under the same solvent conditions. In this figure, one observes not only the tendency of to decrease with RCO in all the cases, but also the increase the slope of the linear regression between and RCO as decreases. The diversity of the folding rates increases from less than one order of magnitude for to more than two orders of magnitude for . The correlation between and RCO improves significantly as decreases, with the correlation coefficient rising from to as decreases from 0 to (Figs. 7a to 7d). However, the correlation somewhat decreases when becomes smaller than , but remains high at and (Figs. 7e and 7f). The slope of the vs. RCO dependence, the correlation coefficient and the -value for all cases studied with different values of are listed in Table I.
| Slope of vs. RCO | -value | |||||||
|---|---|---|---|---|---|---|---|---|
| 0.802 | 0.826 | 0.890 | 0.702 | 0.60 | ||||
| 0.839 | 0.858 | 0.908 | 0.658 | 0.57 | ||||
| 0.866 | 0.886 | 0.929 | 0.609 | 0.53 | ||||
| 0.888 | 0.912 | 0.952 | 0.553 | 0.48 | ||||
| 0.887 | 0.923 | 0.969 | 0.490 | 0.42 | ||||
| 0.875 | 0.929 | 0.983 | 0.423 | 0.36 | ||||
| 0.868 | 0.949 | 0.993 | 0.355 | 0.30 | ||||
| 0.850 | 0.950 | 0.995 | 0.295 | 0.25 |
The best correlation obtained in the present study () is better than that in the study of Jewett et al. Jewett, Pande, and Plaxco (2003) (), but somewhat lower than that in the work of Kaya and Chan Kaya and Chan (2003c) (), for similar lattice systems but with different models. The increase in the diversity of the folding rates due to the effect of solvation in our study is not too impressive but comparable to those in the previous studies Jewett, Pande, and Plaxco (2003); Kaya and Chan (2003c).
We have also calculated the average values of various cooperativity indices, , , and , across all 97 proteins, for different values of (see Table I). The dependences of these average indices on are similar to that shown in Fig. 2(b). We found that the correlation coefficient as well as the slope of the vs. RCO dependence strongly correlate with both and , whereas it shows a medium correlation with . In particular, the corresponding correlation coefficient exceeds 0.96 for vs. and vs. , and is about 0.78 for vs. . Thus, the non-monotonic trends observed in the dependencies of and on seem to be weakly related. The strong correlations of with and support the idea that the folding rate-topology dependence is linked to folding cooperativity Jewett, Pande, and Plaxco (2003).
IV Discussion
Although a more appropriate way to theoretically study protein folding would be to start with a sequence-based model and select foldable sequences through an evolutionary sequence design Tiana et al. (2004); Faisca and Ball (2002), in this work, we adhere to the Gō model due to the significant success of its structure-based approach in capturing protein folding mechanisms Baker (2000) and its relatively well-known folding properties Cieplak, Hoang, and Li (1999). Because Gō model is minimally frustrated Bryngelson and Wolynes (1987), its energy landscape is smooth and funnel-like Nymeyer, Garc´ıa, and Onuchic (1998), facilitating rapid folding, as expected for globular proteins. The folding rate in the Gō model is close to that of the fastest-folding sequence in a comparable sequence-based model for a given native structure Plotkin (2001); Cieplak and Hoang (2002). Gō model is also often more cooperative than its sequence-based counterparts Kaya and Chan (2000b). Using the Gō model, the solvation effects on folding cooperativity and the rate-topology dependence can be studied without perturbations from the sequence Plaxco et al. (2000). For the type of solvation energy considered, the solvation effects can be expected to be independent of the sequence. Thus, for sequence-based models, the effects of solvation can be qualitatively similar to those obtained with the Gō model.
To some extent, the favorable solvation energy for fully exposed residues in our model may correspond to the solvation of peptide groups (-NHCO-) in the protein backbone. Experimental transfer data of amides indicate that the polar interaction between water and peptide CO and NH groups is entirely enthalpic with the hydration enthalpy as low as kcal/mol for a free amide group Luo and Baldwin (1999). Electrostatic solvation free energy (ESF) calculation based on numerically solving the Poisson-Boltzmann equation Sitkoff, Sharp, and Honig (1994) gives an ESF of kcal/mol for an alanine peptide group in the solvent-exposed -strand conformation, and kcal/mol for a hydrogen-bonded (H-bonded) peptide group in a solvent-exposed alanine -helix Avbelj, Luo, and Baldwin (2000). A similar ESF of kcal/mol was found also for an alanine H-bonded peptide group in an alanine -hairpin Avbelj and Baldwin (2002); Baldwin (2003). Other non-polar amino acids may have higher ESF values (negative but closer to zero) for their peptide groups in - and -structures than alanine due to more effective side-chain shielding of the peptide backbone Luo and Baldwin (1999). These data indicate that the desolvation of a peptide group due to secondary structure formation increases the hydration enthalpy by at least 5.4 kcal/mol. This energy penalty is significantly large compared to an average contribution of hydrophobic interaction, which has been estimated to be about kcal/mol per residue Baldwin (2003), based on the calculation of buried nonpolar surface areas. If the secondary structures form prior to the tertiary structure Karplus and Weaver (1994); Hoang and Cieplak (2000b); Weikl and Dill (2003), then for most residues, the first contact with another residue would correspond to the formation of a peptide H-bond, which causes a substantial desolvation of the peptide group. In our model, a peptide H-bond is considered as a native interaction. A residue can undergo multiple stages of desolvation during the folding process. The above consideration suggests that the initial stage of desolvating the peptide group due to peptide H-bond formation is associated with the most significant change in the hydration enthalpy. The singular term in our solvation potential is supported by this assessment.

One can think of a more general form of the considered solvation potential, which covers also partially exposed residues. Let be the number of contacts made by residue in a given conformation; takes integer values from 0 to , where is equal to 4 and 5 for non-terminal and terminal residues, respectively, on the cubic lattice. It follows that and , where is the number of non-native contacts, and is the Kronecker’s delta function. Consider the residual solvation energy as a function of in the form:
| (5) |
where represents the exposure degree of the residue , and is an energy parameter. Incorporating the solvation potential in Eq. (5) into the Gō model gives the total energy
| (6) |
where the additive constant does not depend on the chain conformation. Thus, the linear term in Eq. (5) is interchangeable with the energies of native and non-native contacts, and therefore can be absorbed into the Gō model with energy contributions from non-native contacts.
Figure 8 shows various shapes of the solvation potential in Eq. (5) for several choices of the parameters and . We have checked that the solvation potential in Fig. 8b (, ) enhances the folding cooperativity of the Gō model in a similar manner to what obtained by the potential in Fig. 8a (, ), but to a significantly lower degree. In particular, by using the same analysis of the specific heats as shown in Fig. 2, as decreases towards more negative values, the cooperativity index increases only up to a maximum of 0.91, while reaches a maximum of 0.81. It is expected that the potential in Fig. 8c (, ) can improve the folding cooperativity as effectively as the potential in Fig. 8a, while the potential in Fig. 8d (, ) may be less effective than the latter. This expectation is based on the observation that the competition between solvation and native interactions promotes cooperativity.
The derivation of Eq. (6) is similar to the treatment of polymer-solvent interactions in the Flory-Huggins theory Doi (1996). It indicates that if the solvation potential is a linear function of the number of residue-residue contacts then the solvation energy remains pairwise additive. In our model, pairwise non-additivity Morgantini and Kollman (1995) comes from a singular term for the solvation of fully exposed residues, which makes the solvation potential nonlinear. In traditional implicit solvent models Ferrara, Apostolakis, and Caflisch (2002), the solvation free energy of a solute is often assumed to be proportional to the solvent accessible surface area (SASA) Lee and Richards (1971) of its molecular surface. Depending on the solvent molecule radius, SASA can be a nonlinear function of the number of residue-residue contacts due to the overlaps of buried areas arising from different contacts Street and Mayo (1998). The nonlinearity of a solvation potential for a residue may also arise from the irregular shape of the residue and the anisotropy of its surface Hao and Scheraga (1997). For example, the surface of an amino acid residue can have both polar and nonpolar regions, which contribute differently to the solvation energy.
Several solvation models have been proposed in the past to capture the effects of water on protein folding. Early simulations of lattice protein models by Hao and Scheraga Hao and Scheraga (1997) have shown that adding a solvation term to pairwise contact potentials improves the foldability of sequences and makes the folding transition first-order like. Their solvation model specifies a preferred solvation state for each residue and applies an increasing energy penalty for solvation states that deviate from the preferred state. Using the Hao and Scheraga’s model and a two-letter sequence design, Sorenson and Head-Gordon found that sequences in the solvation model fold faster and more cooperative than sequences in the nonsolvation model Sorenson and Head-Gordon (1998). Note that Hao and Scheraga’s solvation potential is also nonlinear, depending on the type of amino acid, but it has no singular term as in our potential. Using a coarse-grained model for protein structure prediction, Wolynes and coworkers Papoian et al. (2004) demonstrated that adding nonpairwise-additive water-mediated knowledge-based interactions to the Hamiltonian markedly improves the quality of structure prediction. Their solvation model includes a water-mediated second-well potential that depends on the local density environment of residues and facilitates residue-residue indirect contact at an intermediate Cβ-Cβ distance (6.5–9.5 Å), mimicking the effect of one or two water layers between the residues. This potential provides a ‘wetting’ of non-buried residues, but unlike our solvation potential, it has a distance constraint on the interacting residues, therefore promoting intermediate chain compaction. The studies of Chan and coworkers Kaya and Chan (2003a); Liu and Chan (2005); Badasyan, Liu, and Chan (2008); Ferguson, Liu, and Chan (2009); Chan et al. (2011); Kaya, Uzunoğlu, and Chan (2013) showed that Gō-like models with desolvation barriers embedded in the native contact potentials Cheung, Garc´ıa, and Onuchic (2002); Liu and Chan (2005) possess higher degrees of folding cooperativity than models without the desolvation barriers. These barriers account for the process of the hydration water expulsion when residues come into a direct contact Levy and Onuchic (2006). It was shown that their effects on folding cooperativity can be very strong and may be intimately linked to the shortening of the effective attractive range of residue-residue interactions Kaya, Uzunoğlu, and Chan (2013). Note that both the second-well potential and the desolvation barrier potential in these previous works promote solvent-induced interactions at an intermediate to short range of distance between the residues, while our solvation energy applies to fully exposed residues regardless of their distance from each other. However, a favorable interaction with the solvent is implied in both our and their models. The successes of all these previous approaches demonstrate the significant role of water in various details of the folding process Levy and Onuchic (2004, 2006). Our study further supports this perspective.
Our study aligns with previous studies of lattice models, which showed that higher folding cooperativity is associated with a stronger topology dependence of the folding rates Jewett, Pande, and Plaxco (2003); Kaya and Chan (2003c). However, other studies of off-lattice models indicated that while cooperativity increases folding rate diversity, it does not necessarily enhance the rate-topology dependence Badasyan, Liu, and Chan (2008); Ferguson, Liu, and Chan (2009); Chan et al. (2011); Kaya, Uzunoğlu, and Chan (2013). The mechanism behind the folding rate-topology dependence may lie beyond the energetics Debe and Goddard III (1999); Muñoz and Eaton (1999); Weikl and Dill (2003); Makarov and Plaxco (2003); Wallin and Chan (2005). Notably, a model based on the “zipping up” mechanism, using a few physical rate parameters, can predict the folding rates of two-state proteins from their native contact maps with good correlation to experimental data Weikl and Dill (2003). This mechanism is defined by a time sequence of folding events supported by molecular dynamics simulations of a Gō-like model Hoang and Cieplak (2000a, b). A number of studies have been focused on the topological aspect of the rate-topology relation. In addition to RCO, several descriptors have been proposed to predict folding rates from the native state structures, including long-range order Gromiha and Selvaraj (2001), the number of native contacts Makarov et al. (2002), total contact distance Zhou and Zhou (2002), absolute contact order Ivankov et al. (2003), cliquishness Micheletti (2003), local secondary structure content Gong et al. (2003), and relative logarithmic effective contact order Dixit and Weikl (2006). Although their performance typically does not surpass that of RCO for two-state proteins, some are effective for both two- and three-state proteins Zhou and Zhou (2002); Ivankov et al. (2003); Micheletti (2003). Recently, it was shown that maximum intrachain contact entanglement Baiesi et al. (2017), a new descriptor of protein native state entanglement, can improve the folding rate predictions when combined with other descriptors, underscoring the importance of topological complexity beyond contact order.
V Conclusion
We have introduced a solvation energy into the lattice Gō model, which favors residues that are fully exposed to the solvent. This solvation energy promotes unfolding of proteins and is meant to compensate for the overwhelming native bias in the Gō model which considers only native interactions. Our results show that it significantly enhances both the folding cooperativity and the folding rate-topology dependence of the lattice proteins considered, thereby suggesting that this type of solvent interactions may play a key role in determining these properties in two-state proteins.
The mechanism by which the competition between the solvation and native interactions enhances folding cooperativity has been elucidated. We have demonstrated that as the solvation energy parameter decreases, the folding free energy barrier increases. This occurs due to a decrease in the free energy of the unfolded state together with an increase in the free energy of the transition state. In addition, the folding pathways become narrower because the solvation potential energetically disfavors the formation of non-native contacts. The heightened folding free energy barrier and the narrowed folding routes strengthens folding cooperativity by making the system more two-state-like.
We have also suggested that the solvation energy in our model corresponds to the solvation of peptide groups in the protein backbone. The polar interaction between water and exposed peptide groups is highly favorable. Peptide groups become substantially desolvated due to peptide hydrogen bonding during secondary structure formation, resulting in a substantial deficit in hydration enthalpy. Our study indicates that the effects of peptide group solvation can be significant for the protein folding cooperativity and for the folding rate-topology dependence. It is expected that these effects can be studied in more realistic models.
Acknowledgements
This work is dedicated to Marek Cieplak and is supported by Vietnam Academy of Science and Technology under Grant No. NCXS02.05/22-23. The simulations were conducted using the HPC cluster at IOP-VAST.
Author Declarations
Conflict of interest
The authors have no conflicts to disclose.
Data Availability Statement
The data that support the findings of this study are available from the corresponding author upon reasonable request.
References
- Kauzmann (1959) W. Kauzmann, in Advances in Protein Chemistry, Vol. 14 (Elsevier, 1959) pp. 1–63.
- Dill (1990) K. A. Dill, Biochem. 29, 7133 (1990).
- Baldwin and Rose (2016) R. L. Baldwin and G. D. Rose, Proc. Natl. Acad. Sci. USA 113, 12462 (2016).
- Luo and Baldwin (1999) P. Luo and R. L. Baldwin, Proc. Natl. Acad. Sci. USA 96, 4930 (1999).
- Thirumalai, Reddy, and Straub (2012) D. Thirumalai, G. Reddy, and J. E. Straub, Acc. Chem. Res. 45, 83 (2012).
- Morgantini and Kollman (1995) P.-Y. Morgantini and P. A. Kollman, J. Am. Chem. Soc. 117, 6057 (1995).
- Papoian et al. (2004) G. A. Papoian, J. Ulander, M. P. Eastwood, Z. Luthey-Schulten, and P. G. Wolynes, Proc. Natl. Acad. Sci. USA 101, 3352 (2004).
- Pratt and Chandler (1977) L. R. Pratt and D. Chandler, J. Chem. Phys. 67, 3683 (1977).
- Rank and Baker (1997) J. A. Rank and D. Baker, Prot. Sci. 6, 347 (1997).
- Levy and Onuchic (2006) Y. Levy and J. N. Onuchic, Annu. Rev. Biophys. Biomol. Struct. 35, 389 (2006).
- Cheung, Garc´ıa, and Onuchic (2002) M. S. Cheung, A. E. García, and J. N. Onuchic, Proc. Natl. Acad. Sci. USA 99, 685 (2002).
- Kaya and Chan (2003a) H. Kaya and H. S. Chan, J. Mol. Bio. 326, 911 (2003a).
- Liu and Chan (2005) Z. Liu and H. S. Chan, J. Mol. Bio. 349, 872 (2005).
- Jackson and Fersht (1991) S. E. Jackson and A. R. Fersht, Biochem. 30, 10428 (1991).
- Rhee et al. (2004) Y. M. Rhee, E. J. Sorin, G. Jayachandran, E. Lindahl, and V. S. Pande, Proc. Natl. Acad. Sci. USA 101, 6456 (2004).
- Lindorff-Larsen et al. (2011) K. Lindorff-Larsen, S. Piana, R. O. Dror, and D. E. Shaw, Science 334, 517 (2011).
- Hao and Scheraga (1997) M.-H. Hao and H. A. Scheraga, Phys. A: Stat. Mech. Appl. 244, 124 (1997).
- Sorenson and Head-Gordon (1998) J. M. Sorenson and T. Head-Gordon, Fold. Des. 3, 523 (1998).
- Snir and Kamien (2005) Y. Snir and R. D. Kamien, Science 307, 1067 (2005).
- Banavar et al. (2007) J. R. Banavar, T. X. Hoang, J. H. Maddocks, A. Maritan, C. Poletto, A. Stasiak, and A. Trovato, Proc. Natl. Acad. Sci. USA 104, 17283 (2007).
- Viguera et al. (1994) A. Viguera, J. Martinez, V. Filimonov, P. Mateo, and L. Serrano, Biochem. 33, 2142 (1994).
- Plaxco et al. (1998) K. W. Plaxco, J. I. Guijarro, C. J. Morton, M. Pitkeathly, I. D. Campbell, and C. M. Dobson, Biochem. 37, 2529 (1998).
- Chan, Shimizu, and Kaya (2004) H. S. Chan, S. Shimizu, and H. Kaya, in Methods in Enzymology, Vol. 380 (Elsevier, 2004) pp. 350–379.
- Kaya and Chan (2000a) H. Kaya and H. S. Chan, Phys. Rev. Lett. 85, 4823 (2000a).
- Kaya and Chan (2000b) H. Kaya and H. S. Chan, Prot. Struct. Func. Bio. 40, 637 (2000b).
- Kaya and Chan (2003b) H. Kaya and H. S. Chan, Phys. Rev. Lett. 90, 258104 (2003b).
- Plaxco, Simons, and Baker (1998) K. W. Plaxco, K. T. Simons, and D. Baker, J. Mol. Biol. 277, 985 (1998).
- Plaxco et al. (2000) K. W. Plaxco, K. T. Simons, I. Ruczinski, and D. Baker, Biochem. 39, 11177 (2000).
- Thirumalai (1995) D. Thirumalai, J. Phys. I. 5, 1457 (1995).
- Gutin, Abkevich, and Shakhnovich (1996) A. M. Gutin, V. I. Abkevich, and E. I. Shakhnovich, Phys. Rev. Lett. 77, 5433 (1996).
- Cieplak, Hoang, and Li (1999) M. Cieplak, T. X. Hoang, and M. S. Li, Phys. Rev. Lett. 83, 1684 (1999).
- Cieplak and Hoang (2000) M. Cieplak and T. X. Hoang, J. Bio. Phys. 26, 273 (2000).
- Cieplak and Hoang (2001) M. Cieplak and T. X. Hoang, Prot. Struct. Func. Bio. 44, 20 (2001).
- Finkelstein and Badredtinov (1997) A. V. Finkelstein and A. Y. Badredtinov, Fold. Des. 2, 115 (1997).
- Debe and Goddard III (1999) D. A. Debe and W. A. Goddard III, J. Mol. Bio. 294, 619 (1999).
- Muñoz and Eaton (1999) V. Muñoz and W. A. Eaton, Proc. Natl. Acad. Sci. USA 96, 11311 (1999).
- Weikl and Dill (2003) T. R. Weikl and K. A. Dill, J. Mol. Bio. 329, 585 (2003).
- Makarov and Plaxco (2003) D. E. Makarov and K. W. Plaxco, Prot. Sci. 12, 17 (2003).
- Fersht (2000) A. R. Fersht, Proc. Natl. Acad. Sci. USA 97, 1525 (2000).
- Paci et al. (2005) E. Paci, K. Lindorff-Larsen, C. M. Dobson, M. Karplus, and M. Vendruscolo, J. Mol. Bio. 352, 495 (2005).
- Jewett, Pande, and Plaxco (2003) A. I. Jewett, V. S. Pande, and K. W. Plaxco, J. Biol. Mol. 326, 247 (2003).
- Kaya and Chan (2003c) H. Kaya and H. S. Chan, Prot. Struc. Func. Gen. 52, 524 (2003c).
- Wallin and Chan (2005) S. Wallin and H. S. Chan, Prot. Sci. 14, 1643 (2005).
- Badasyan, Liu, and Chan (2008) A. Badasyan, Z. Liu, and H. S. Chan, J. Mol. Bio. 384, 512 (2008).
- Ferguson, Liu, and Chan (2009) A. Ferguson, Z. Liu, and H. S. Chan, J. Mol. Bio. 389, 619 (2009).
- Chan et al. (2011) H. S. Chan, Z. Zhang, S. Wallin, and Z. Liu, Ann. Rev. Phys. Chem. 62, 301 (2011).
- Kaya, Uzunoğlu, and Chan (2013) H. Kaya, Z. Uzunoğlu, and H. S. Chan, Phys. Rev. E 88, 044701 (2013).
- Koga and Takada (2001) N. Koga and S. Takada, J. Mol. Biol. 313, 171 (2001).
- Cieplak and Hoang (2003) M. Cieplak and T. X. Hoang, Biophys. J. 84, 475 (2003).
- Cieplak (2004) M. Cieplak, Phys. Rev. E 69, 031907 (2004).
- Taketomi, Ueda, and Gō (1975) H. Taketomi, Y. Ueda, and N. Gō, Int. J. Pep. Protein Res. 7, 445 (1975).
- Hoang and Cieplak (2000a) T. X. Hoang and M. Cieplak, J. Chem. Phys. 112, 6851 (2000a).
- Hoang and Cieplak (2000b) T. X. Hoang and M. Cieplak, J. Chem. Phys. 113, 8319 (2000b).
- Clementi, Nymeyer, and Onuchic (2000) C. Clementi, H. Nymeyer, and J. N. Onuchic, J. Mol. Biol. 298, 937 (2000).
- Baker (2000) D. Baker, Nature 405, 39 (2000).
- Takada (2019) S. Takada, Biophys. Physicobiology 16, 248 (2019).
- Abe and Go (1981) H. Abe and N. Go, Biopolymers 20, 1013 (1981).
- Metropolis et al. (1953) N. Metropolis, A. W. Rosenbluth, M. N. Rosenbluth, A. H. Teller, and E. Teller, J. Chem. Phys. 21, 1087 (1953).
- Cieplak et al. (1998) M. Cieplak, M. Henkel, J. Karbowski, and J. R. Banavar, Phys. Rev. Lett. 80, 3654 (1998).
- Swendsen and Wang (1986) R. H. Swendsen and J.-S. Wang, Phys. Rev. Lett. 57, 2607 (1986).
- Ferrenberg and Swendsen (1989) A. M. Ferrenberg and R. H. Swendsen, Phys. Rev. Lett. 63, 1195 (1989).
- Privalov and Potekhin (1986) P. L. Privalov and S. A. Potekhin, in Methods in Enzymology, Vol. 131 (Academic Press, 1986) pp. 4–51.
- Zhou, Hall, and Karplus (1999) Y. Zhou, C. K. Hall, and M. Karplus, Prot. Sci. 8, 1064 (1999).
- Kuhlman et al. (1998) B. Kuhlman, D. L. Luisi, P. A. Evans, and D. P. Raleigh, J. Mol. Bio. 284, 1661 (1998).
- Taskent, Cho, and Raleigh (2008) H. Taskent, J.-H. Cho, and D. P. Raleigh, J. Mol. Bio. 378, 699 (2008).
- Tiana et al. (2004) G. Tiana, B. E. Shakhnovich, N. V. Dokholyan, and E. I. Shakhnovich, Proc. Natl. Acad. Sci. USA 101, 2846 (2004).
- Faisca and Ball (2002) P. Faisca and R. Ball, J. Chem. Phys. 117, 8587 (2002).
- Bryngelson and Wolynes (1987) J. D. Bryngelson and P. G. Wolynes, Proc. Natl. Acad. Sci. USA 84, 7524 (1987).
- Nymeyer, Garc´ıa, and Onuchic (1998) H. Nymeyer, A. E. García, and J. N. Onuchic, Proc. Natl. Acad. Sci. USA 95, 5921 (1998).
- Plotkin (2001) S. S. Plotkin, Prot. Struct. Func. Bio. 45, 337 (2001).
- Cieplak and Hoang (2002) M. Cieplak and T. X. Hoang, Int. J. Mod. Phys. C 13, 1231 (2002).
- Sitkoff, Sharp, and Honig (1994) D. Sitkoff, K. A. Sharp, and B. Honig, J. Phys. Chem. 98, 1978 (1994).
- Avbelj, Luo, and Baldwin (2000) F. Avbelj, P. Luo, and R. L. Baldwin, Proc. Natl. Acad. Sci. USA 97, 10786 (2000).
- Avbelj and Baldwin (2002) F. Avbelj and R. L. Baldwin, Proc. Natl. Acad. Sci. USA 99, 1309 (2002).
- Baldwin (2003) R. L. Baldwin, J. Bio. Chem. 278, 17581 (2003).
- Karplus and Weaver (1994) M. Karplus and D. L. Weaver, Prot. Sci. 3, 650 (1994).
- Doi (1996) M. Doi, Introduction to Polymer Physics (Oxford University Press, 1996).
- Ferrara, Apostolakis, and Caflisch (2002) P. Ferrara, J. Apostolakis, and A. Caflisch, Prot. Struct. Func. Bio. 46, 24 (2002).
- Lee and Richards (1971) B. Lee and F. M. Richards, J. Mol. Bio. 55, 379 (1971).
- Street and Mayo (1998) A. G. Street and S. L. Mayo, Fold. Des. 3, 253 (1998).
- Levy and Onuchic (2004) Y. Levy and J. N. Onuchic, Proc. Natl. Acad. Sci. USA 101, 3325 (2004).
- Gromiha and Selvaraj (2001) M. M. Gromiha and S. Selvaraj, J. Mol. Bio. 310, 27 (2001).
- Makarov et al. (2002) D. E. Makarov, C. A. Keller, K. W. Plaxco, and H. Metiu, Proc. Natl. Acad. Sci. USA 99, 3535 (2002).
- Zhou and Zhou (2002) H. Zhou and Y. Zhou, Biophys. J. 82, 458 (2002).
- Ivankov et al. (2003) D. N. Ivankov, S. O. Garbuzynskiy, E. Alm, K. W. Plaxco, D. Baker, and A. V. Finkelstein, Prot. Sci. 12, 2057 (2003).
- Micheletti (2003) C. Micheletti, Prot. Struct. Func. Bio. 51, 74 (2003).
- Gong et al. (2003) H. Gong, D. G. Isom, R. Srinivasan, and G. D. Rose, J. Mol. Bio. 327, 1149 (2003).
- Dixit and Weikl (2006) P. D. Dixit and T. R. Weikl, Prot. Struct. Func. Bio. 64, 193 (2006).
- Baiesi et al. (2017) M. Baiesi, E. Orlandini, F. Seno, and A. Trovato, J. Phys. A: Math. Gen. 50, 504001 (2017).