Compositional Analysis of Fragrance Accords Using Femtosecond Thermal Lens Spectroscopy
Science Instiute, Univesity of Iceland &
Department of Chemistry
Indian Institute of Technology Kanpur &
Quansight Labs, TX, Austin
rgoswami@ieee.org
&Ashwini Kumar Rawat
Department of Chemistry
Indian Institute of Technology Kanpur
sonaly@iitk.ac.in
&
Department of Chemistry
Indian Institute of Technology Kanpur
sonaly@iitk.ac.in
&
Department of Chemistry
Indian Institute of Technology Kanpur
dgoswami@iitk.ac.in
Abstract
Characterizing complex, multi-component volatile organic compound mixtures, relevant to fragrance formulation, is a significant challenge. While femtosecond thermal lens spectroscopy (FTLS) – encompassing Z-scan and time-resolved techniques – offers powerful tools for probing thermo-optical properties, its application to mixtures beyond a few components is largely unexplored. We present a unified analysis approach for FTLS data from liquid fragrance accords, utilizing an Integrated Magnitude (IM) metric. FTL-IM is a positive-definite measure of the overall signal magnitude, calculated by integrating the processed signal absolute value of signals, and captures the total thermal dissipation dynamics, including contributions from convection. We demonstrate consistency and linear additivity of the FTL-IM with respect to component mass fractions across single-beam, dual-beam, and time-resolved measurements, even when including components with unknown individual thermal lens properties. Our metric demonstrates the necessity of single-beam measurements to explain signal trends in dual-beam data. This robust, rapid technique offers significant advantages for fragrance quality control and formulation development, providing a foundation for linking liquid-phase thermal lens properties to quantitative fragrance compounding.
Keywords Fragnances, Thermal Lens Spectroscopy, Diffusion, Molecular Interactions, Ultrafast Spectroscopy, Femtosecond Lasers, Optical Properties, Volatile Organic Compounds
1 Introduction
Formulating fragrances with desired scent profiles requires precise control over the composition of complex mixtures of volatile organic compounds. However, predicting the behavior of these multi-component mixtures (accords) remains a significant challenge. Traditional methods for fragrance analysis, such as sensory panels and gas chromatography-mass spectrometry (GC-MS), can be time-consuming, expensive, and subjective [31, 3, 32]. Although Femtosecond thermal lens spectroscopy (FTLS) has been used to great effect, expanding the applicability of Z-scan and time-resolved fixed-point measurements beyond calculating nonlinear optical material properties [7, 11, 6, 5], its application to complex, multi-component mixtures like fragrance accords remains largely unexplored [19]. Previous studies have primarily focused on single-component, binary, or ternary systems [23, 21, 9], and often struggle to account for convective effects that can significantly influence measurements in liquids [16, 29, 30]. Furthermore, the sensitivity of thermal lensing to molecular-level interactions, such as hydrogen bonding, suggests its potential for differentiating subtle differences in mixture composition [26, 25, 24]. Traditional analysis of FTLS data often relies on fitting analytical models to experimental data or by using summary statistics like the peak-to-valley signal difference or the steady-state thermal lens (SSTL) signal or the signal at point [20, 26, 28, 33]. These measures can be sensitive to noise, and analytical fits require visual inspection followed by assumptions about the underlying heat transfer mechanisms (conduction and convection). We employ a multi-modal FTLS approach [10] for experimental data acquisition, focusing on a novel unified measure, the Femtosecond Thermal Lens Integrated Magnitude (FTL-IM). The FTL-IM is a transformed area metric, defined specifically for each measurement configuration, and provides a direct, model-independent measure of the total thermo-optical response as a proxy for the heat-load dissipation dynamics of these complex systems, accurately accounting for convective contributions and overcoming limitations of traditional fitting procedures.
We demonstrate linear additivity of the FTL-IM with respect to component mole fractions, even in six-component mixtures containing solids, across single-beam Z-scan, dual-beam Z-scan, and dual-beam time-resolved FTLS measurements, validating this technique as a simple yet powerful tool for fragrance analysis.
2 Experimental Section
2.1 Materials
Fragrance accords and their individual components (listed in the Supporting Information) were provided by Jyothy Laboratories Ltd., India, and used as received.
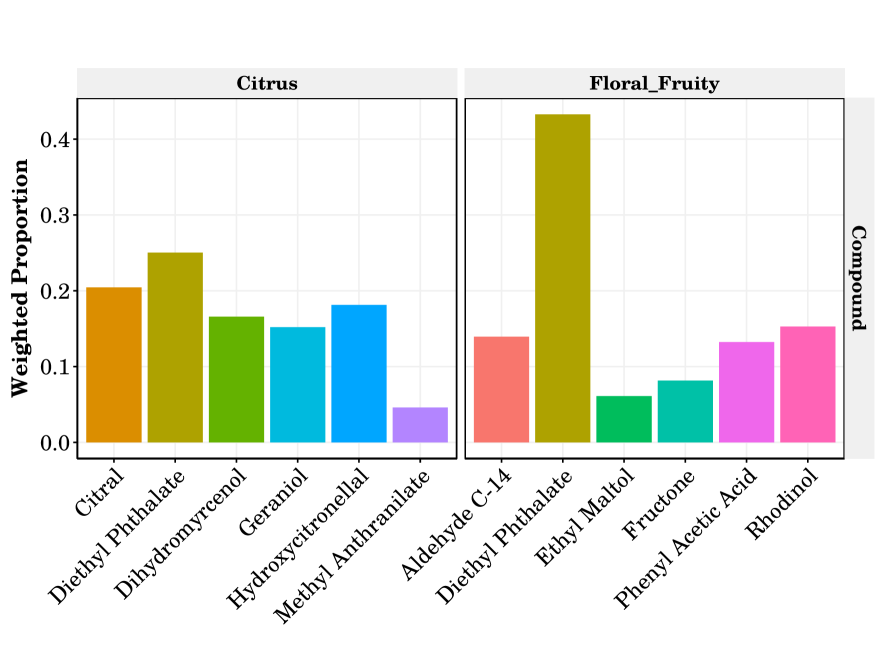
To investigate the thermo-optical properties of complex fragrance mixtures and test the feasibility of a rapid, quantitative analysis method, we prepared two fragrance accords, “Citrus” and “Fruity”, with differing compositions (Figure 1). The Citrus accord consisted of six liquid components, while the Fruity accord consisted of four liquid components and two solid components. Diethyl Phthalate (DEP) served as the solvent in both accords. Methanol shows a strong convective effect among the alcohols [30] and so was used as a reference. As shown in Figure 1, the Fruity accord has a significantly higher concentration of DEP, necessitated by the presence of solid components.
2.2 Thermal Lens Measurements
Femtosecond thermal lens spectroscopy (FTLS) measurements were performed using two experimental configurations to obtain three distinct datasets: single-beam Z-scan, dual-beam Z-scan, and time-resolved pump-probe.
For single-beam Z-scan measurements [30], a mode-locked Ti:Sapphire laser (Coherent Mira-900, ~150 fs pulse width, 76 MHz repetition rate, tunable from 730-900 nm) was focused into a 1 mm path length quartz cuvette containing the fragrance sample.
Dual-beam Z-scan measurements [17, 25, 18] employed a mode-mismatched pump-probe configuration using an Er-doped fiber laser (IMRA Femtolite, 50 MHz repetition rate). A 1560 nm pump beam (~300 fs pulse width) and a 780 nm probe beam (~100 fs pulse width) were co-focused into a 1 mm path length quartz cuvette.
For Z-scan measurements, the sample was translated along the beam propagation axis (z-direction), and the transmitted light through an aperture was detected by a silicon photodiode. A 30% closed aperture was used for single-beam measurements, and a 40% open aperture in the far field was used for dual-beam measurements. The Rayleigh range was determined to be 1.58 mm.
Time-resolved pump-probe measurements [17, 25, 18] were performed using the same dual-beam optical setup as above, but with the sample held at a fixed position, corresponding to the point of maximum thermal lens (TL) signal (the focus). The relative change in the probe beam signal in the presence of the pump beam over five-second intervals was collected. Further details of the experimental setups, including schematic diagrams, are provided in the Supplementary.
Due to the complex and often proprietary nature of fragrance accord compositions, a direct quantitative determination of fundamental thermo-optical parameters (such as or ) by analytical fits from the FTLS data using standard theoretical models is not feasible. However, as we will demonstrate, the FTL-IM provides a robust and useful metric for characterizing these mixtures and predicting their behavior, even in the absence of detailed compositional information.
3 Computational Methods
Data acquisition was performed using LabVIEW [15]. Subsequent data processing, analysis, and visualization were performed reproducibly in R [22] using the tidyverse suite of packages [35, 34].
To quantify the thermo-optical response from the different FTLS modalities (single-beam Z-scan, dual-beam Z-scan, and time-resolved pump-probe), we introduce a unified metric termed the FTLS Integrated Magnitude (FTL-IM). The FTL-IM is a positive-definite measure of the overall signal magnitude, calculated by integrating the processed signal as defined by Eq. 1.
| (1) |
where:
-
•
is the baseline-corrected and Rayleigh-range-normalized single-beam Z-scan signal.
-
•
is the baseline-corrected and normalized dual-beam Z-scan signal.
-
•
is the baseline-corrected and normalized dual-beam time-resolved signal.
-
•
is the normalized z-position, defined by .
-
•
is the Rayleigh range.
-
•
is the number of excitation pulses (N=3 in this study) in the time-resolved measurements.
-
•
t is the time.
The absolute value is taken over the integrals as the trapezoid rule is used for calculating the signed area.
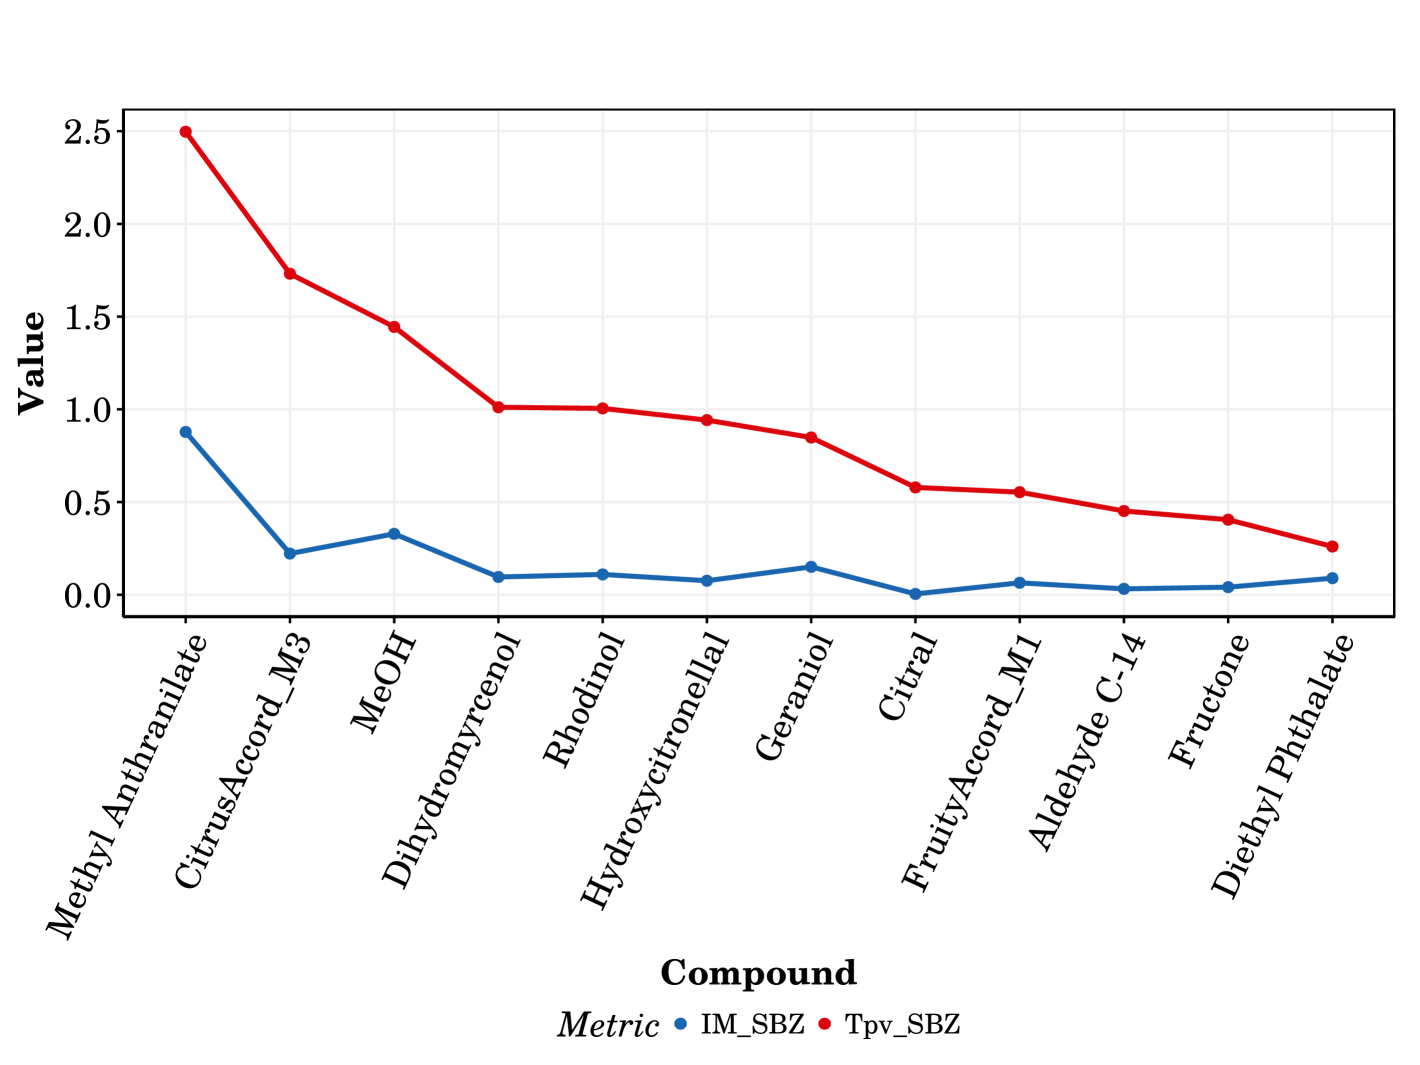
For validation and comparison, we contrast our metric with the more traditional peak-to-valley signal difference for single beam Z-scan data () [27], the zero point measure for the dual beam Z-scan data [23], and the steady state TL signal from time-resolved studies [28, 26].
Unlike commonly used point-based measures, the area-based FTL-IM metric is inherently robust to experimental noise. This is because it relies on area measurements, avoiding the errors associated with pinpointing exact locations in noisy data and bypassing the need for analytical models.
4 Results and Discussion
4.1 Single Beam Z-Scan
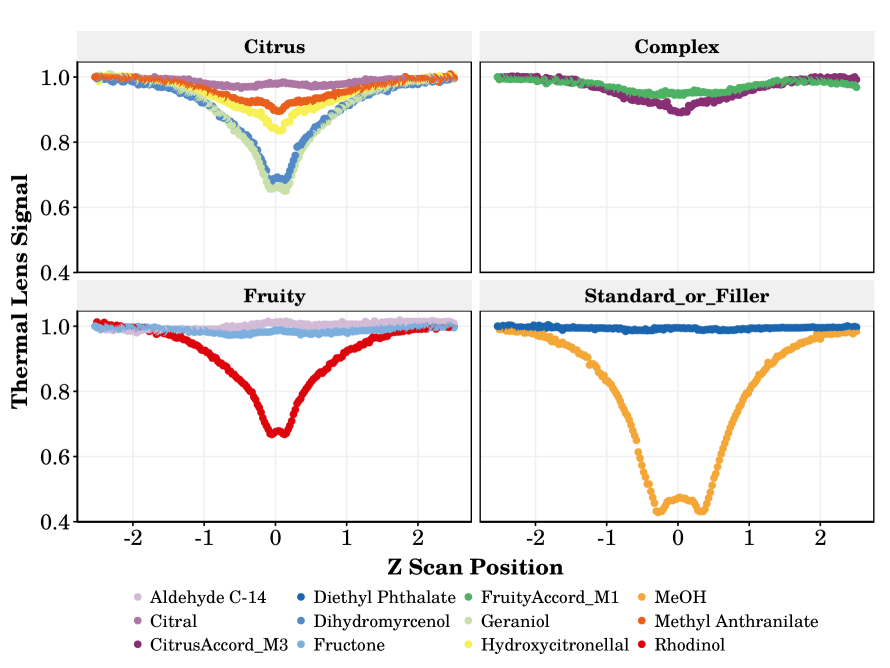
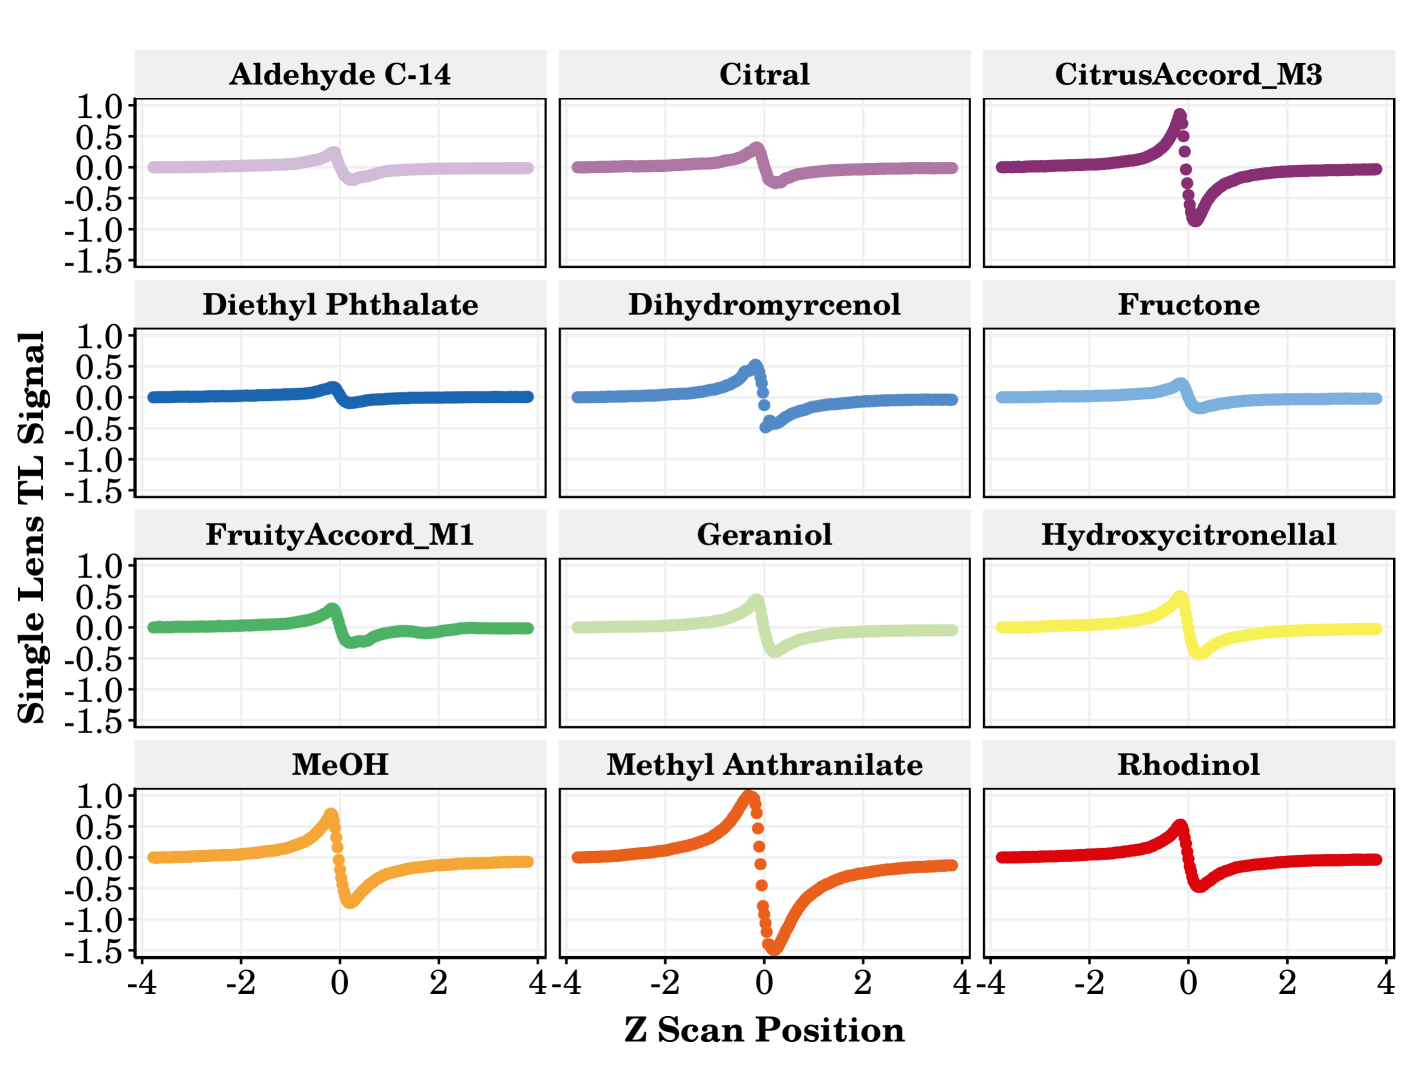
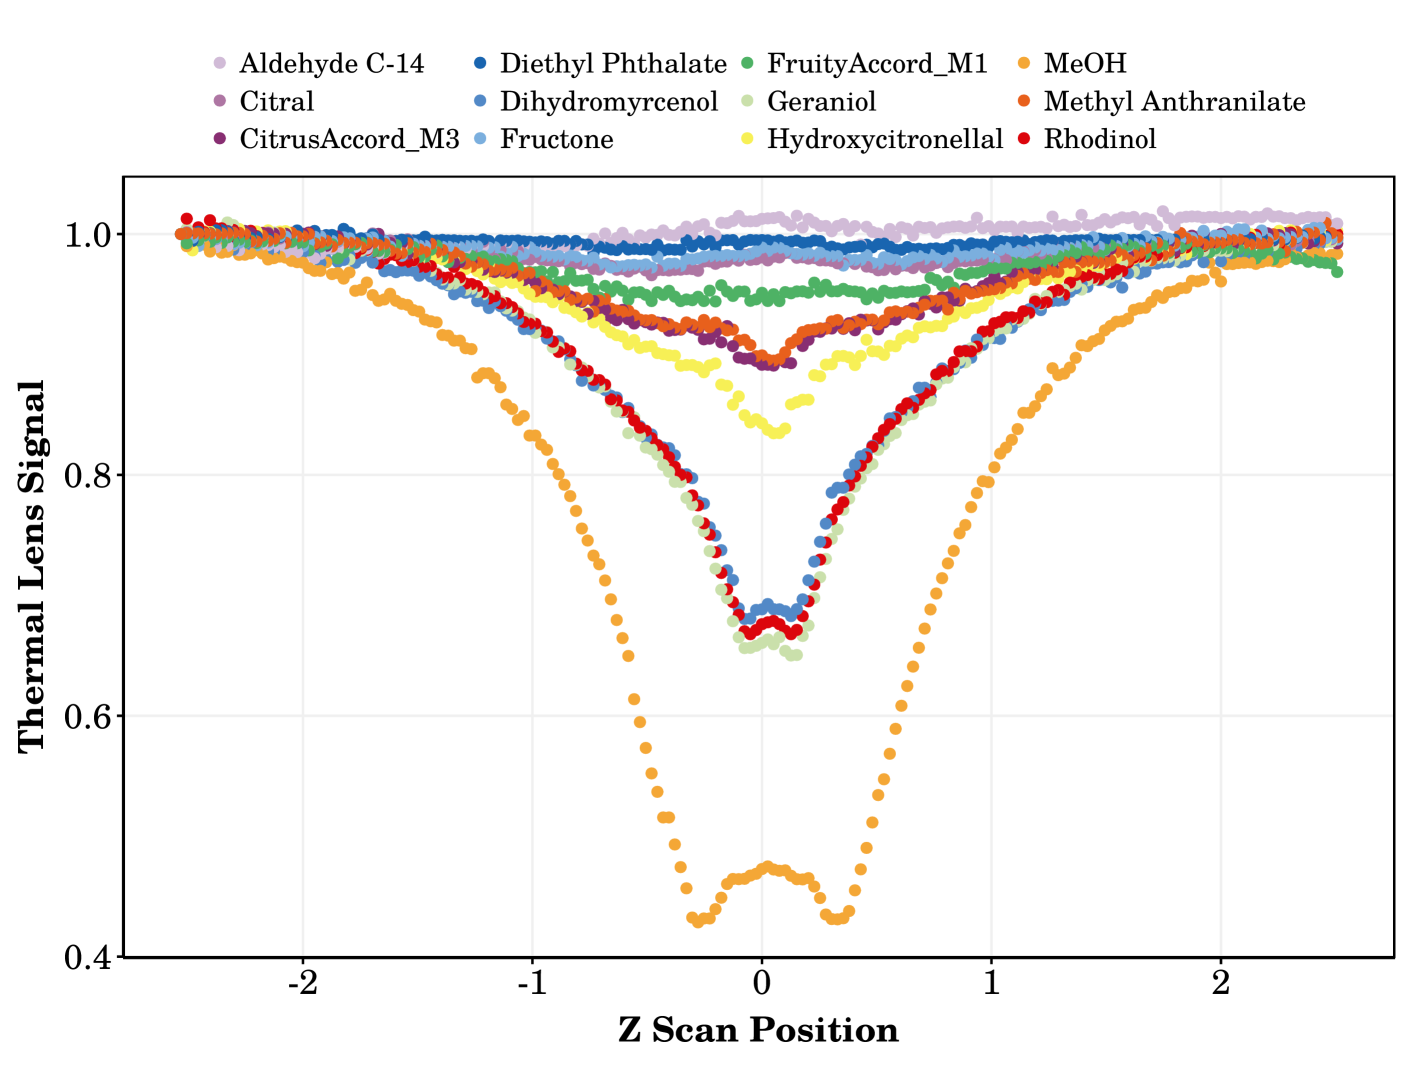
The single beam data collected is shown in Figure 2, which demonstrates the prefocal and postfocal transmittance extrema, indicative of a negative thermo-optic coefficient () for all liquid components [27].
Notably, the Citrus accord curve closely resembles that of Methyl Anthranilate (MeA), both in shape and magnitude. This suggests that MeA, the only ester component in the Citrus accord, is the dominant contributor to the overall heat dissipation dynamics. The presence of the aromatic ring and carbonyl group in MeA likely results in a significantly higher absorption coefficient at the laser wavelength compared to the other, primarily alcohol and aldehyde, components. Furthermore, a potential reaction between MeA and aldehydes, such as Hydroxycitronellal, could lead to the formation of a Schiff base [2], which may exhibit altered absorption properties and contribute to the enhanced thermal lens signal observed in the Citrus accord. The Fruity accord, in contrast, exhibits a smaller signal magnitude, consistent with the higher concentration of DEP (which shows negligible signal) and the presence of solid components.
Furthermore, a closer examination of the individual component curves (Figure S3) reveals a striking similarity between the Z-scan curves of Rhodinol, Geraniol, and Hydroxycitronellal. Chemically, this is not surprising since Rhodinol is a mixture of Geraniol and Citronellol [2]. From a perfumery perspective, however, this similarity is noteworthy. These compounds, all contributing to floral scent notes, despite their differing molecular weights (see Supplementary Table 2), exhibit nearly indistinguishable thermal dissipation dynamics in the single-beam Z-scan. This suggests that, from the perspective of the thermal lens signal, these components could be considered somewhat interchangeable within a formulation, and indeed, these three, Rhodinol, Geraniol, and Hydroxycitronellal, have “Floral” scents.
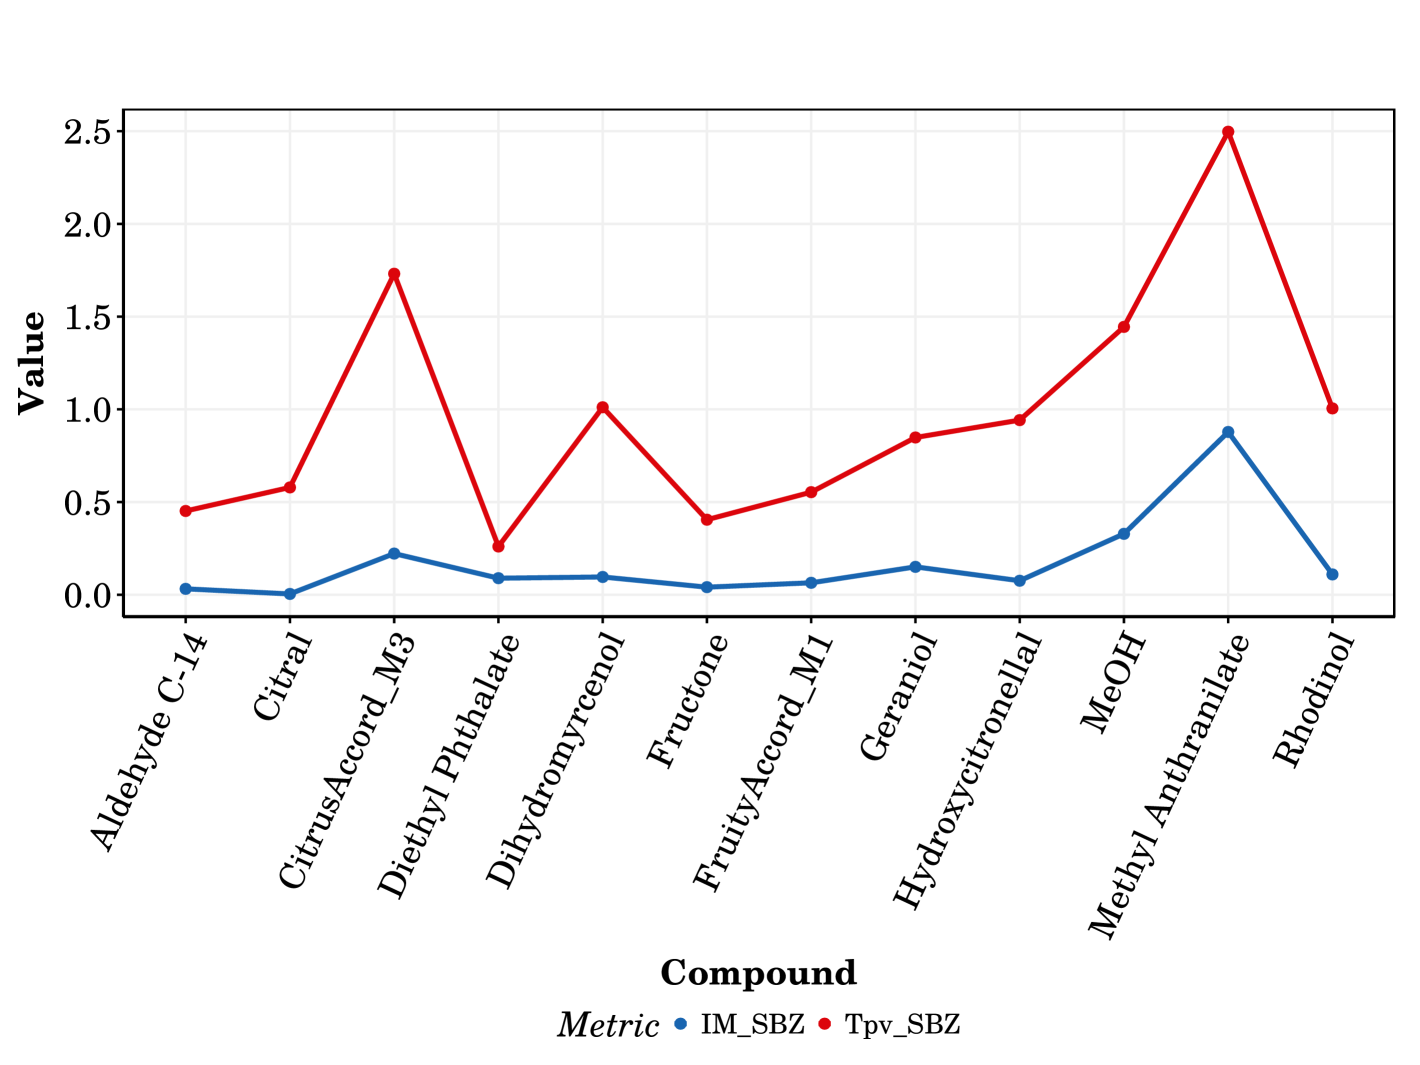
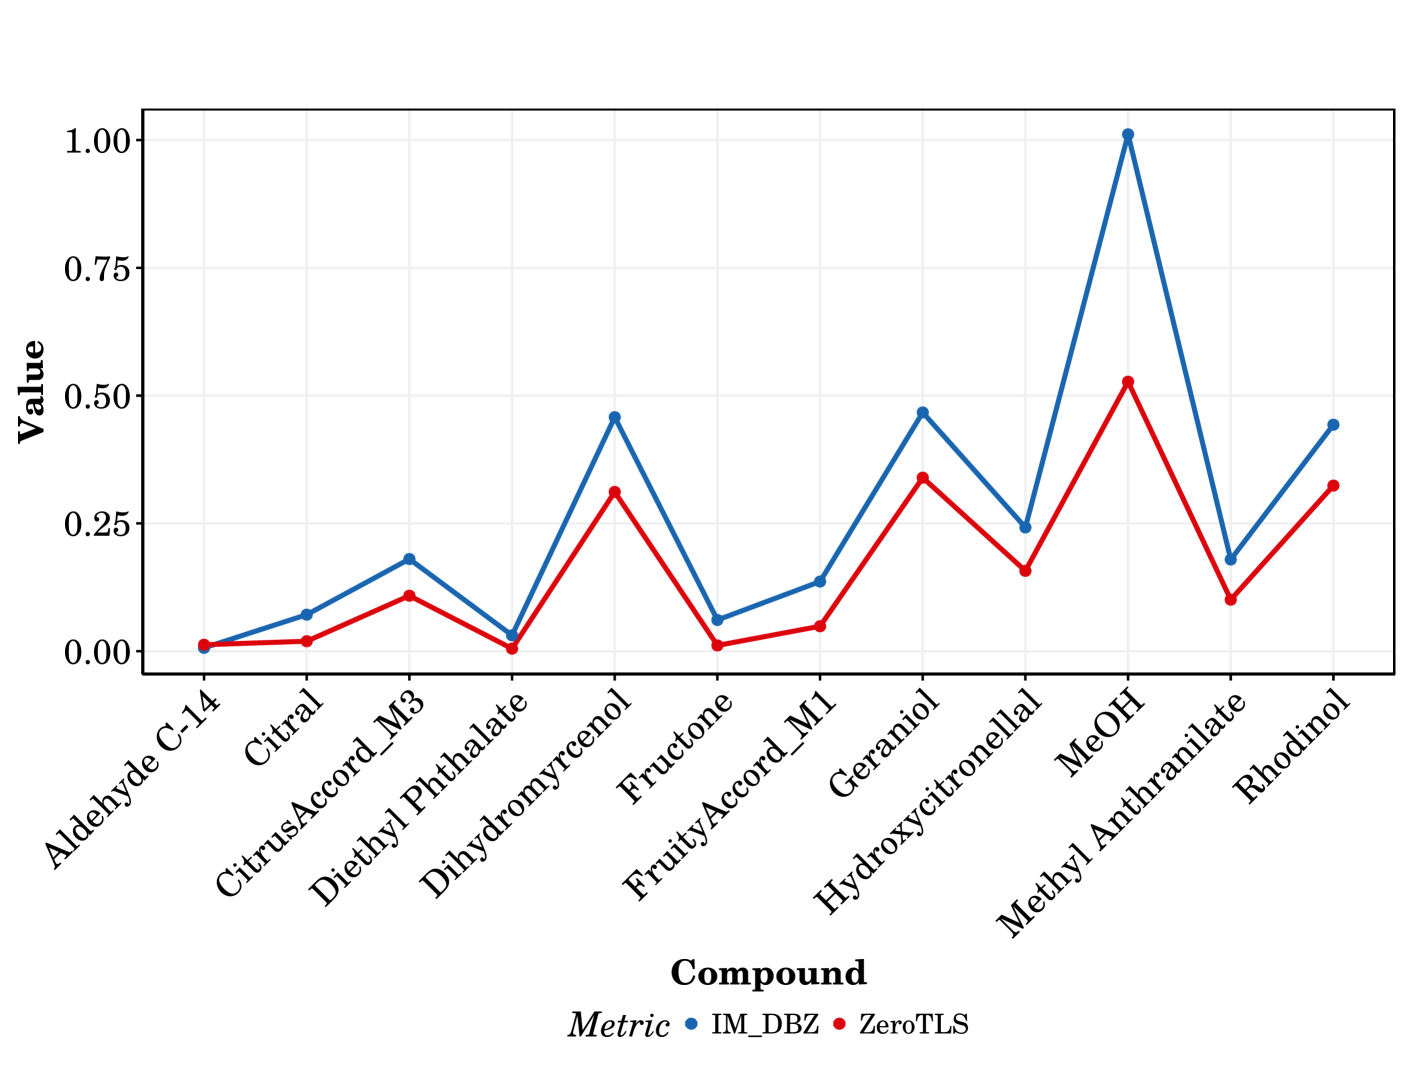
Our chemical and visual observations are reinforced by the FTL-IM summary statistic as seen in Figure 3, which also includes a comparison against the peak-to-valley transmittance difference (). We note that the broadening of the Z-scan signal is captured accurately by the FTL-IM, which in turn correctly orders the signal strength and thermal dissipation of MeOH and the Citrus Accord. Hydroxycitronellal has a higher molecular weight compared to Geraniol, so it is expected to have slightly slower dynamics than the lighter Geraniol, a relation which is seen in the FTL-IM but not in the .
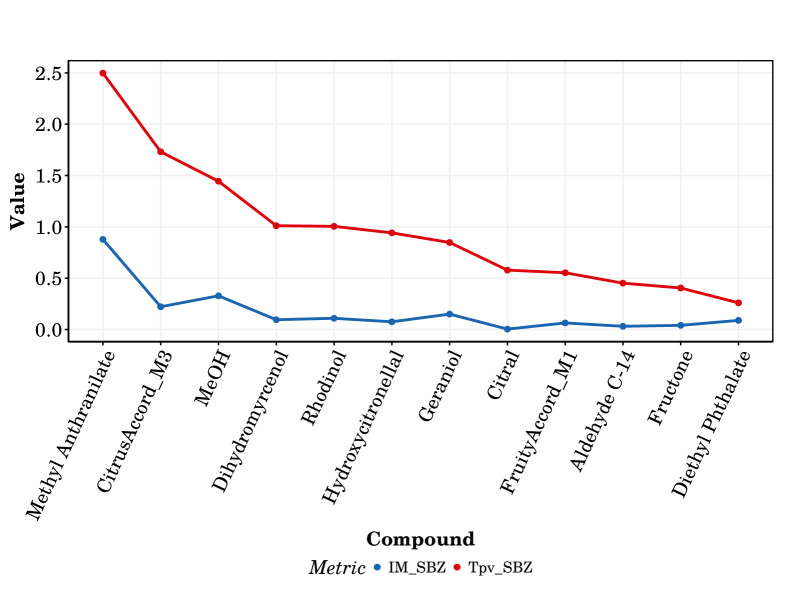
Citral and Fruity accord have similar values, although the Fruity accord has a larger FTL-IM measure due to its shape. This is in line with the trends shown for dual beam data, which suggests that the measure is correctly proxying the thermal dissipation dynamics of the system. In terms of magnitude, the absolute value of the value is higher, as the signed area is used for FTL-IM, though the is unable to demonstrate sensitivity to convection and other thermal heat dissipation modes.
4.2 Dual Beam
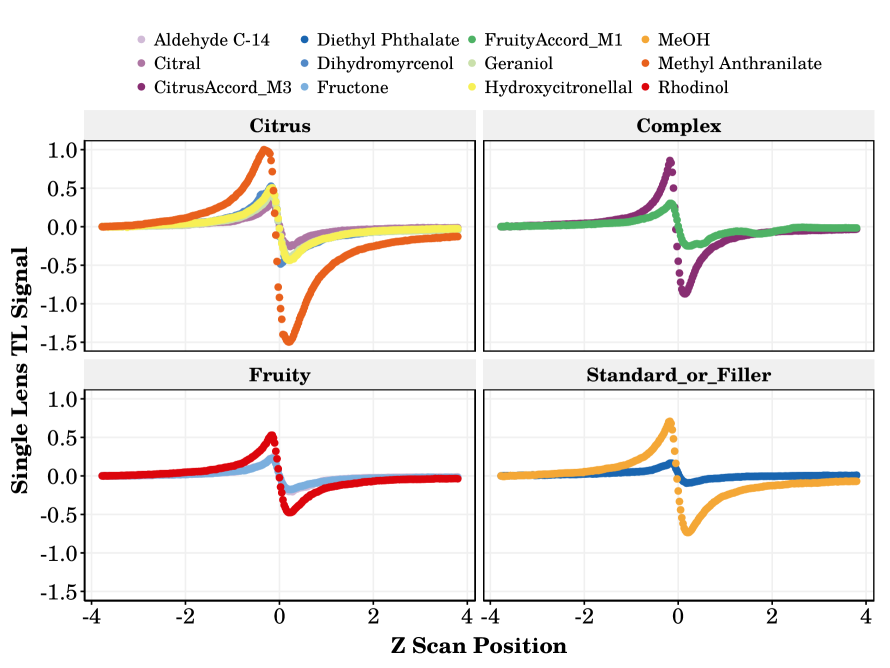
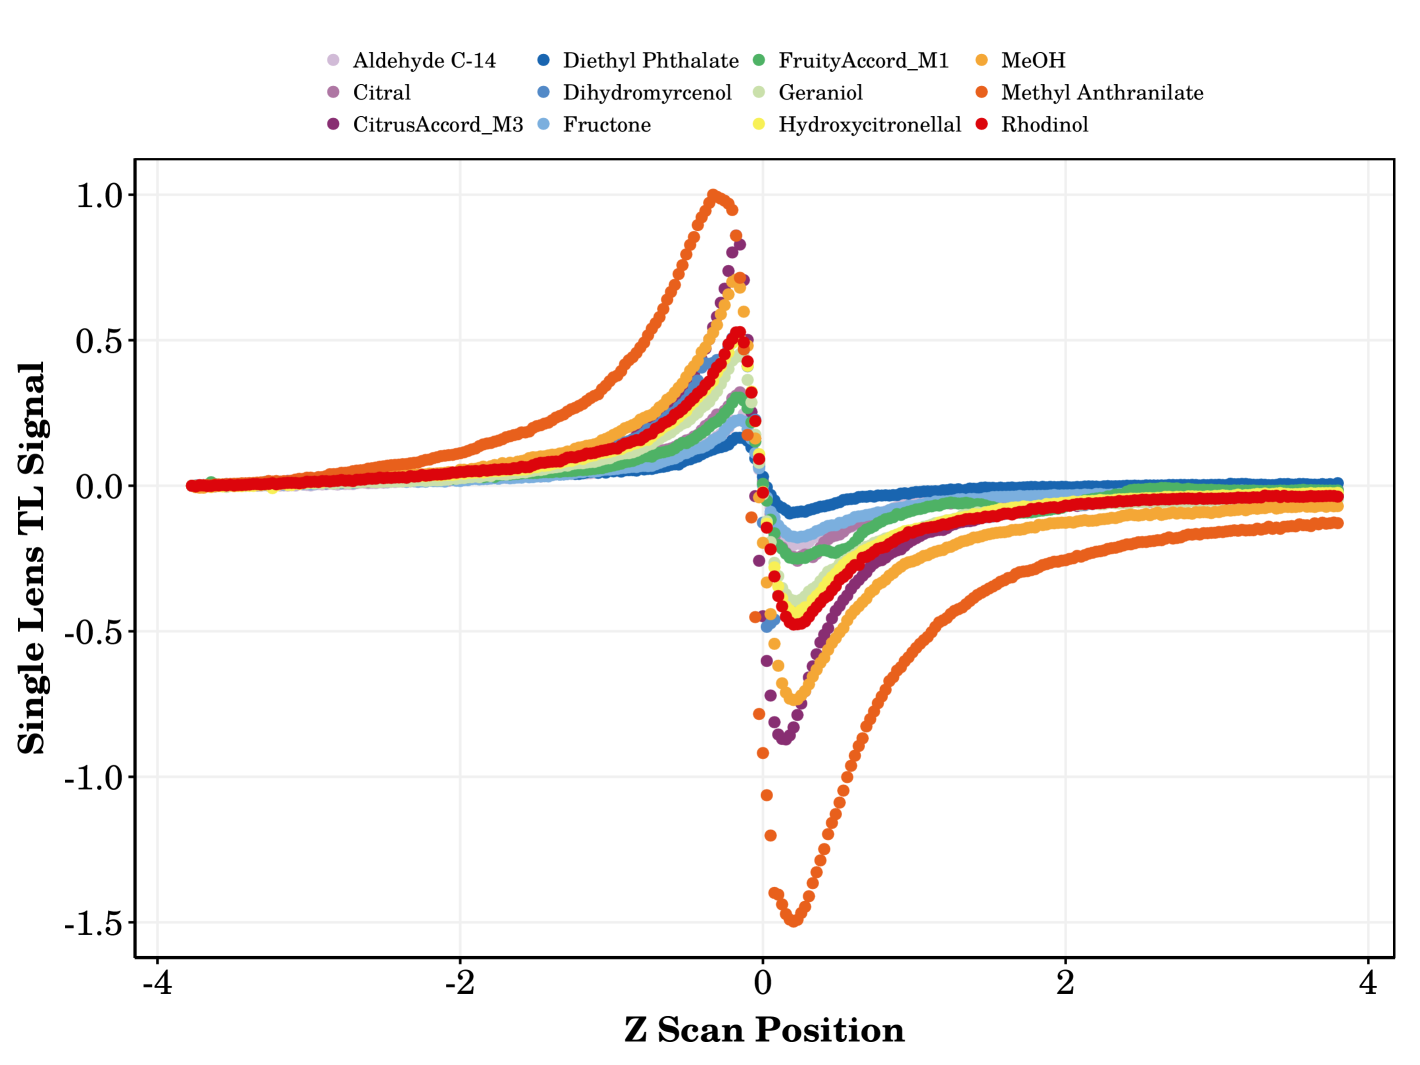
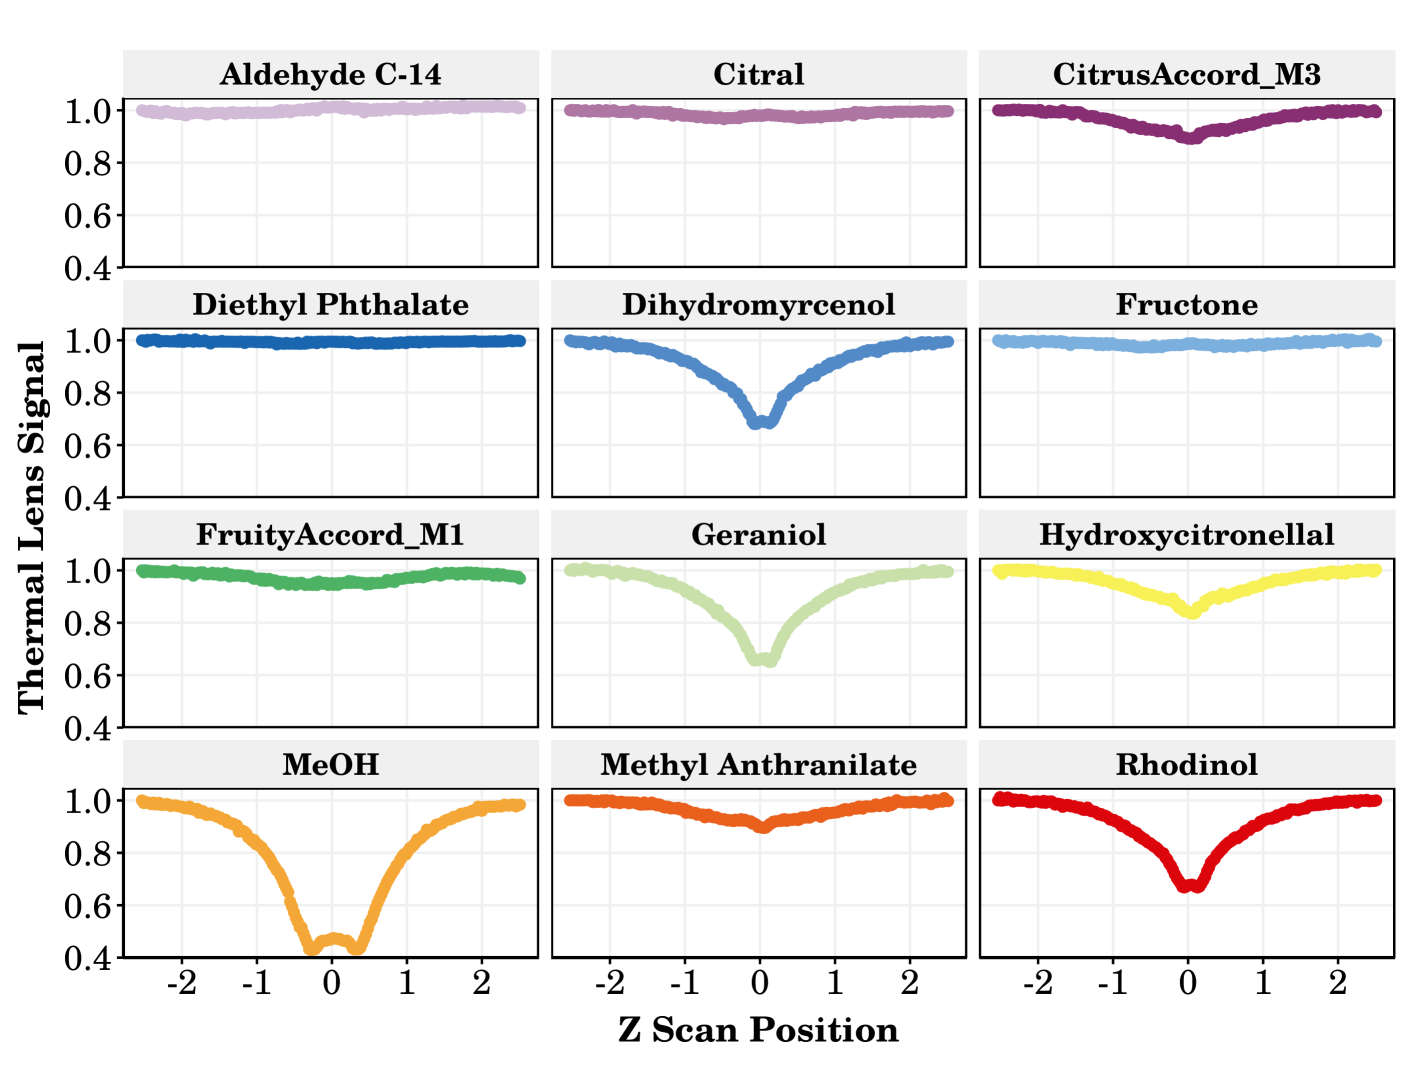
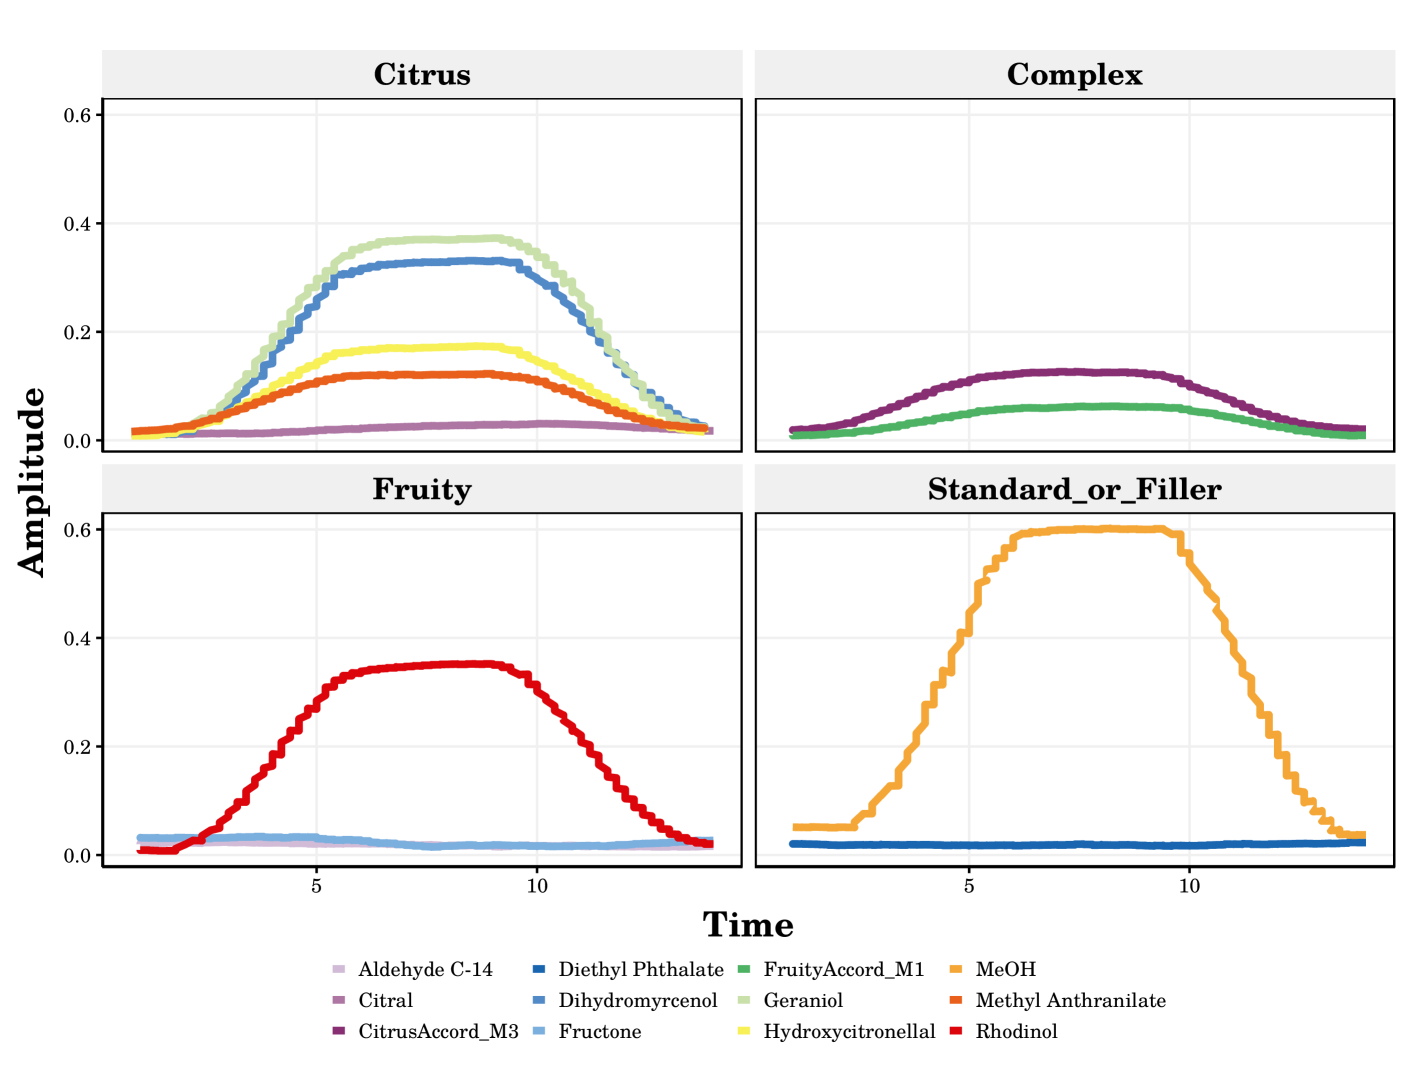
Dual-beam measurements were performed to further investigate the TL signal of the individual components and accords. The data collected from the dual beam Z-scan is shown in Figure 4. The alcohol curves: Methanol, Rhodinol, Dihydromyrcenol, and Geraniol exhibit the characteristic “W” shape expected for materials which are known to dissipate heat through convection. Diethyl Phthalate, Fructone, Aldehyde C-14, and Citral, are completely colorless and show no appreciable signal. The Citrus accord curve is almost exactly overlapped with that of MeA, which may be understood in the context of the single beam signal in the previous section.
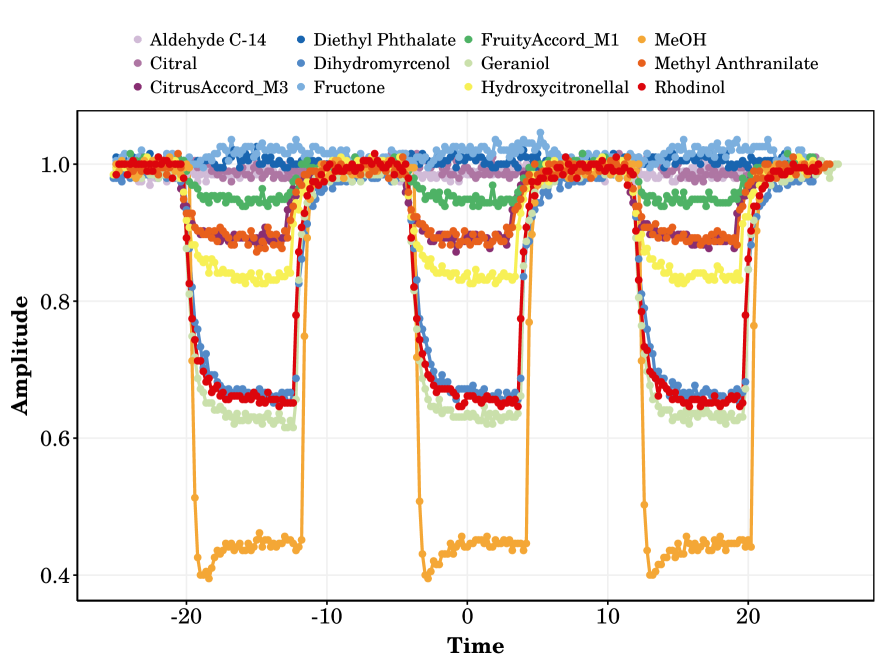
The pump-probe time-resolved experimental data is shown in Figure 5 and reinforces the same trends and concepts, with the dip below the steady-state signal indicating heat dissipation beyond conduction.
The steady-state thermal lens (SSTL) signal represents the amplitude of the thermal lens signal after it has reached equilibrium following the initial transient response. The supplementary information demonstrates the comparison.
4.3 FTL-IM Consistency and Linearity
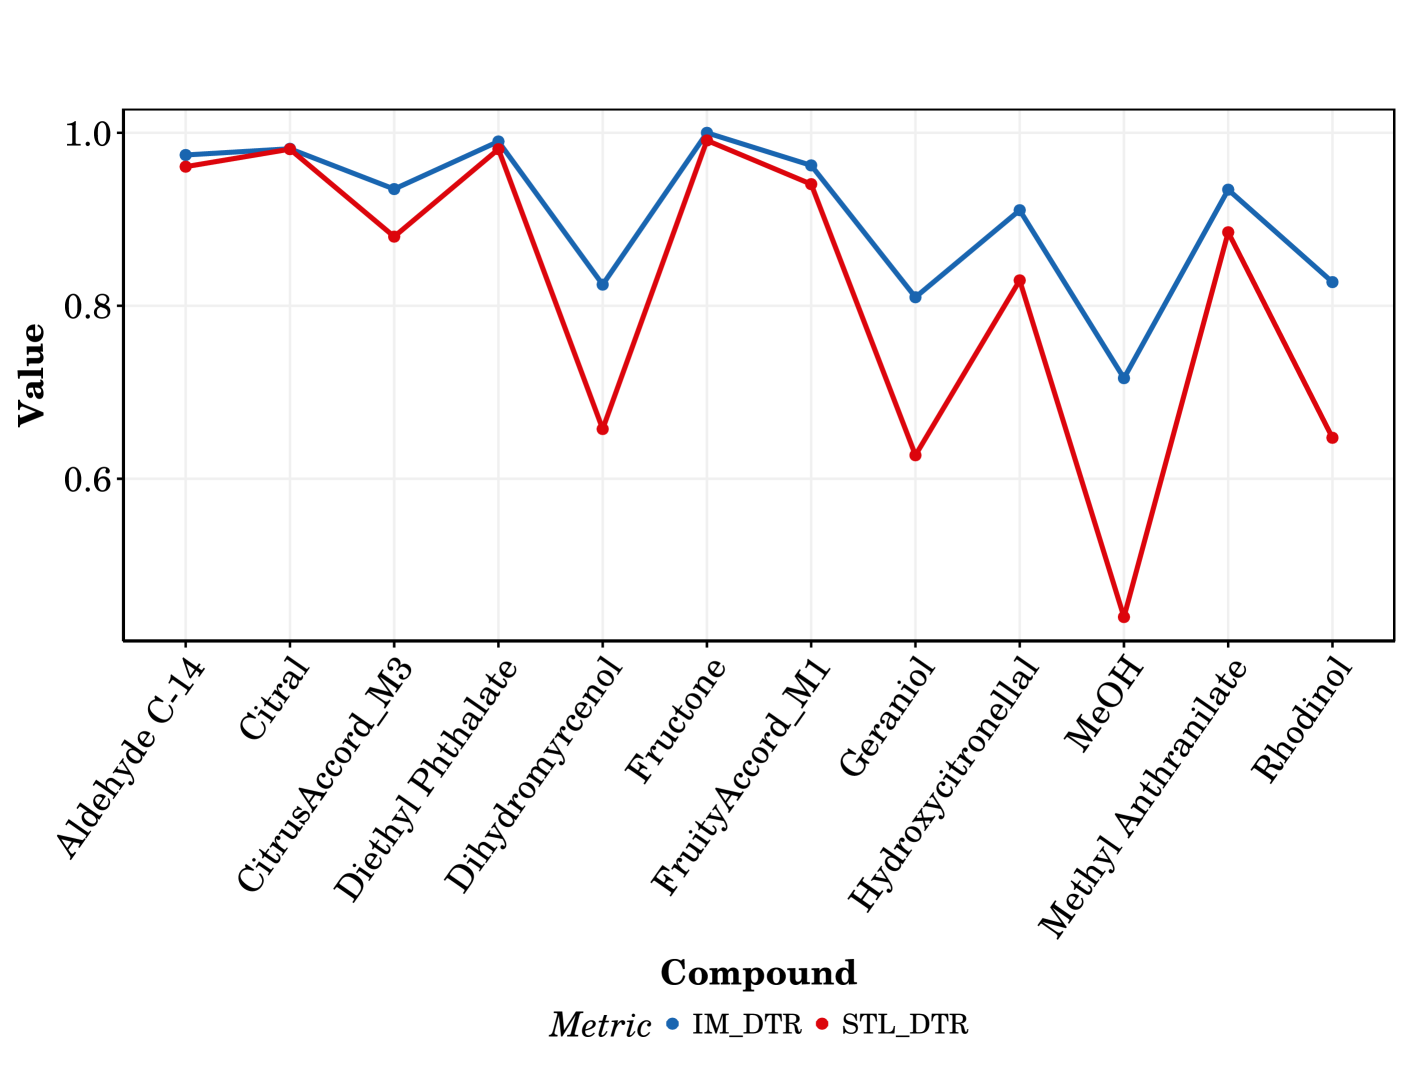
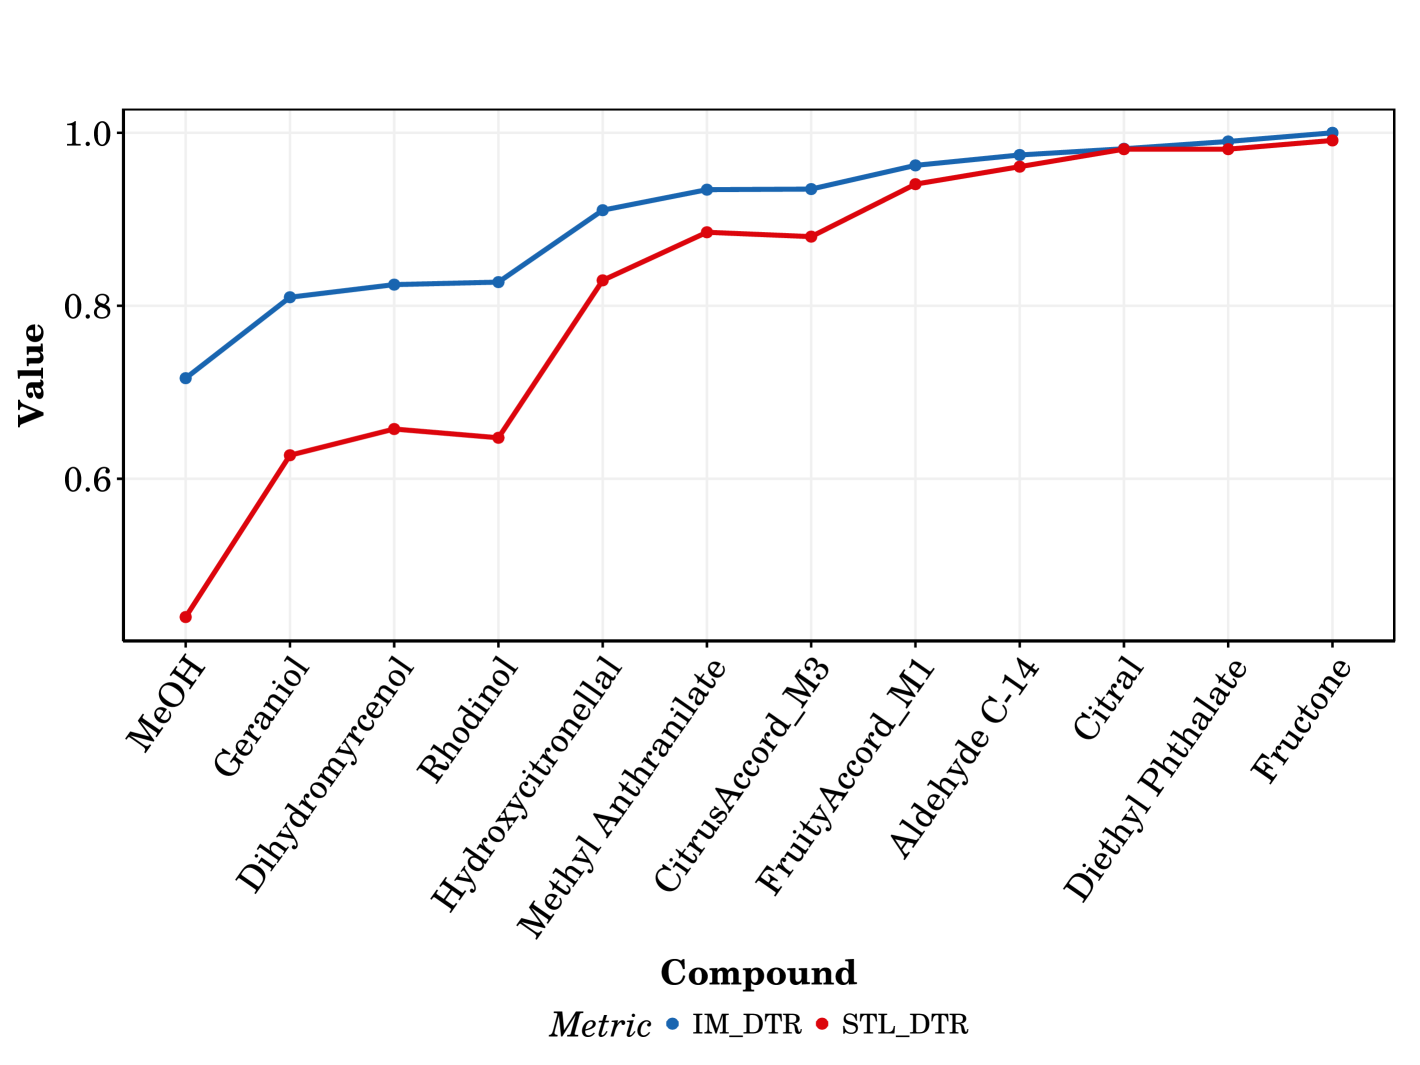
FTLS Integrated Magnitude (FTLS-IM) values for individual components and accords, measured using single-beam Z-scan (IMSBZ), dual-beam Z-scan (IMDBZ), and time-resolved pump-probe (IMDTR) are presented in Figure 6.
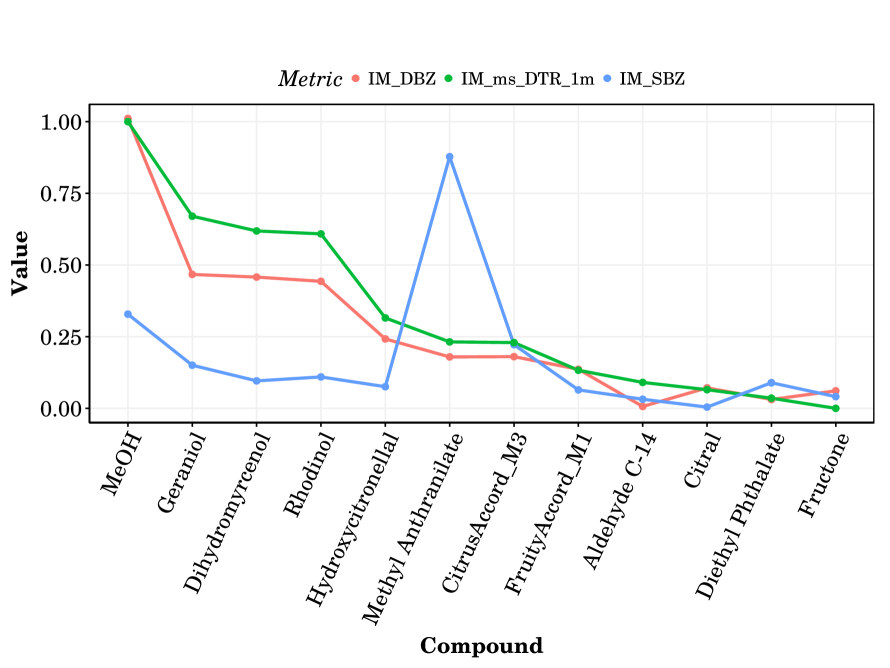
Despite the differences in experimental configuration for each modality, the overall trends observed in Figure 6 are remarkably consistent. This consistency arises from the fact that all three techniques are fundamentally probing the same underlying phenomenon: the power-dependent heating of the sample by the laser beam and the resulting change in refractive index. While the single-beam Z-scan is primarily sensitive to the spatial profile of the induced thermal lens, the dual-beam Z-scan is more directly sensitive to the phase shift and convective effects, and the time-resolved measurements probe the temporal dynamics of the thermal lens formation and decay, they all ultimately depend on the amount of energy absorbed by the sample and converted to heat. Crucially, we have demonstrated in the previous sub-section that the measure is able to account for convective and conductive heating effects, and is able to provide a quantitative view of processes taking place in the ester, which has not yet been analytically modeled.
The observed consistency justifies our use of a unified FTL-IM metric as defined in Eq. 1. It also highlights the importance of the single-beam measurements, which provide a sensitive measure of the overall signal strength and the underlying dissipation dynamics. As a check for linearity in FTL-IM, we predict the values of the accords using a mass-fraction weighted average, using Eq. 2.
| (2) |
where represents the measured IM for each component, and is the corresponding mass fraction. As shown in Table 1 and Table 2, the FTL-IM correlates linearly with component mass fractions. The relatively larger errors in the single beam (IMSBZ) Citrus accord prediction arises from the down-weighting of MeA, which, despite its low mass fraction, significantly influences the single-beam Z-scan curve shape. For the fruity accord, the linearity assumption holds much better as no single component dominates the response.
| Measure | Pred. | Exp. | Abs. Err. | Obs. Range |
|---|---|---|---|---|
| 0.11 | 0.14 | 0.03 | (0.07, 0.47) | |
| 16.18 | 16.26 | 0.08 | (13.69, 16.59) | |
| 0.08 | 0.06 | 0.02 | (0.0, 0.88) |
| Measure | Pred. | Exp. | Abs. Err. | Obs. Range |
|---|---|---|---|---|
| 0.22 | 0.18 | 0.04 | (0.01, 0.44) | |
| 15.49 | 15.8 | 0.31 | (13.98, 16.90) | |
| 0.12 | 0.22 | 0.1 | (0.03, 0.11) |
5 Conclusion
We have demonstrated linear additivity between the femtosecond thermal lens spectroscopy Integrated Magnitude (FTL-IM) and component mass fractions in complex, multi-component fragrance accords. The FTL-IM, defined as the absolute value of the signed integral of a baseline-corrected, Rayleigh-range-normalized signal for single-beam Z-scan, and as the area under the baseline-corrected, normalized curve for dual-beam Z-scan and time-resolved measurements, provides a unified metric for characterizing the underlying thermal dissipation dynamics across these modalities. This linearity, observed for both Citrus and Fruity accords across all three FTLS techniques, demonstrates the robustness of the FTL-IM for analyzing complex mixtures, even when including solid components in unknown compositions.
As a reactive and volatile ester, Methyl Anthranilate (MeA) shows an outsized signal, going beyond the reference MeOH. From the single beam data, both from visual inspection and quantified by FTL-IM or even , it is clear that the presence of MeA dominates the overall heat dissipation mechanism for the citrus accord, leading to a signal similar in shape to MeA, despite having a relatively low presence in terms of weight fractions.
Our results underscore the value of performing single-beam Z-scan studies, especially for volatile and reactive esters such as MeA, while highlighting the similarity of information obtained from dual-beam time-resolved and Z-scan studies, though time-resolved data has a stronger signal. The rapid, non-destructive nature of FTLS, combined with the predictive power of the FTL-IM, offers significant advantages for fragrance quality control and formulation. While further research is needed to establish a direct correlation between the FTLS signal and olfactory perception, our results hint at a potential link between readily measurable thermo-optical properties and the ultimate scent profile of a fragrance mixture. Future work will explore a wider range of mixtures and potential correlations between FTL-IM and olfactory properties, heat, and mass transport, along with classical thermo-optic properties.
Acknowledgments
R.G. thanks Mrs. Ruhila Goswami for fruitful discussions. R.G. and A.K.R. thank the Indian Institute of Technology Kanpur (India) for their respective Research Fellowship and Senior Research Fellowship grants. R.G. was also partially supported by the Icelandic Research Fund (grant no. 217436-053). D.G. thanks funding support from the SERB Core Research Grant, Govt. of India. We dedicate this work to the memory of our beloved little birdie, Tuitui.
Conflict of interest
The authors declare no conflict of interest.
Exact code to reproduce all models and visualization is available on reasonable request.
Appendix A Experimental
A.1 Materials used
The following materials were analyzed in this work: Citral, Fractone, Diethyl phthalate, Geraniol, Rhodinol, C4 Aldehyde, Dihydro Mercenol, Hydroxy Citronellal, Methyl Anthranilate, and the fragrance accords “Citrus” and “Fruity.” These materials, provided to us by Jyothy Laboratories Ltd, India, were characterized using single-beam and dual-beam femtosecond thermal lens spectroscopy (FTLS). Basic material properties of interest are listed in Table 3 and Table 4.
| Compound | CASID | Accord | M. Frac | Appearance |
|---|---|---|---|---|
| Rhodinol | 141-25-3 | FloralFruity | 15 | Colorless / Pale yellow clear liquid |
| Phenyl Acetic Acid | 103-82-2 | FloralFruity | 13 | White crystalline powder |
| Ethyl Maltol | 4940-11-8 | FloralFruity | 6 | White crystalline |
| Aldehyde C-14 | 104-67-6 | FloralFruity | 13.70 | Colorless / Pale yellow clear liquid |
| Fructone | 6413-10-1 | FloralFruity | 8 | Colorless clear liquid |
| Citral | 5392-40-5 | Citrus | 22.20 | Colorless / Pale yellow clear liquid |
| Dihydromyrcenol | 18479-58-8 | Citrus | 18 | Colorless clear liquid |
| Hydroxycitronellal | 107-75-5 | Citrus | 19.70 | Pale yellow thick liquid |
| Geraniol | 106-24-1 | Citrus | 16.50 | Colorless clear liquid |
| Methyl Anthranilate | 134-20-3 | Citrus | 5 | Pale / Dark yellow liquid |
| Diethyl Phthalate | 84-66-2 | Citrus | 27.19 | Colorless liquid |
| Diethyl Phthalate | 84-66-2 | FloralFruity | 42.50 | Colorless liquid |
| Compound | MolWt | logPow | OType | OStr | Volatility | SType | Shr | Nature |
|---|---|---|---|---|---|---|---|---|
| Rhodinol | 156.27 | 3.24 | Floral | Med. | Heart | Rose | 236 | Alcohol |
| Phenyl Acetic Acid | 136.15 | 1.42 | Honey | High | Heart | Honey | 400 | Acid |
| Ethyl Maltol | 140.14 | 0.63 | CaramelVanilla | High | Base | Fruity | 360 | Alcohol |
| Aldehyde C-14 | 206.24 | 1.65 | Fruity | Med. | Base | Peach | 338 | Aldehyde |
| Fructone | 174.19 | 0.98 | Fruity | Med. | HH | Apple | 12 | Ketal |
| Citral | 152.24 | 3.45 | Citrus | Med. | Head | Lemon | 12 | Aldehyde |
| Dihydromyrcenol | 156.27 | 2.99 | Citrus | Med. | Heart | Fresh | 16 | Alcohol |
| Hydroxycitronellal | 172.27 | 1.65 | Floral | Med. | Heart | Muguet | 218 | Aldehyde |
| Geraniol | 154.25 | 3.56 | Floral | Med. | HH | Rose | 60 | Alcohol |
| Methyl Anthranilate | 151.17 | 1.88 | Fruity | Med. | Heart | Neroli | 88 | Ester |
| Diethyl Phthalate | 222.24 | 2.42 | Solv. | 400 | Alcohol | |||
| Diethyl Phthalate | 222.24 | 2.42 | Solv. | 400 | Alcohol |
A.2 Experimental Setup
LabVIEW [15] is used to automate the instruments and to record data.
A.2.1 Single Beam Z-Scan
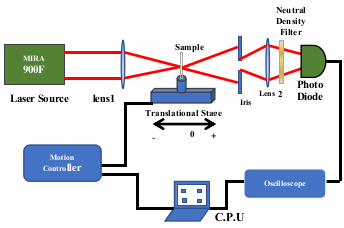
For the single-beam setup, a mode-locked Ti:Sapphire laser (Coherent Mira-900, 100-200 fs pulse width, 730-900 nm tuning range, 76 MHz repetition rate) was focused using a 20 cm focal length lens into a 1 mm path length quartz cuvette containing the fragrance sample. Sample translation along the beam axis (z-direction) was controlled by a motorized stage (Newport, 0.1 µm resolution). Transmitted light through a 30% closed aperture was detected by a silicon photodiode (Thorlabs PDA100A-EC). The average laser power was 350 mW. Further details of the close-aperture single beam z-scan technique are described elsewhere [30] and a schematic is given in Figure 7.
A.2.2 Dual Beam
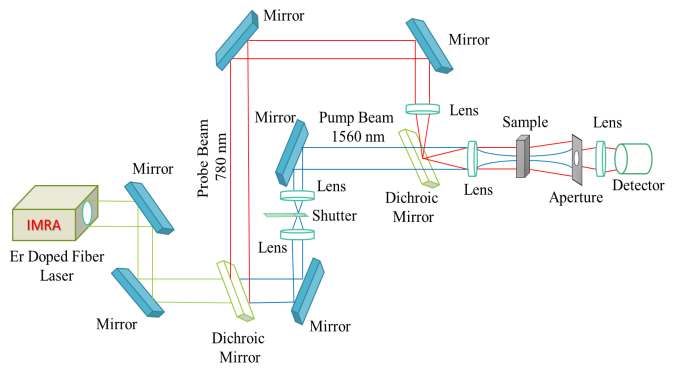
A mode-mismatched pump-probe configuration [28] was employed for the dual-beam setup [16, 25, 18]. An Er-doped fiber laser (IMRA Femtolite, 50 MHz repetition rate) provided a 1560 nm pump beam (300 fs pulse width, 10 mW average power) and a 780 nm probe beam (Gaussian , 100 fs pulse width, 6 mW mean power). The distance between the sample and aperture is maintained to satisfy the far field diffraction limits and a cut-off filter is positioned to block the pump before the detector. An oscilloscope (LeCroy Wave Runner 64xi, 600 MHz) is connected to the photodiode and controlled via LabVIEW. A schematic for this setup is shown in Figure 8.
-
1.
Z-Scan The probe beam was focused using a 5 cm focal length plano-convex lens into the sample cuvette, and the transmitted light through a 60% closed aperture was detected by a silicon photodiode (Thorlabs PDA100A-EC).
- 2.
Appendix B Computational details
B.1 Area Calculation
The integration is performed numerically using the trapezoidal rule [8]. This approximates the definite integral of a function by dividing the area under the curve into a series of trapezoids and summing their areas. Given a set of data points , where , the area, , is approximated as:
| (3) |
This numerical integration method is equivalent to the trapz function in the pracma package [4], which, in turn, is based on the Gauss polygon area formula. For a closed polygon with vertices , the Gauss polygon area formula is given by:
| (4) |
where and (i.e., the polygon is implicitly closed) [1]. In the context of our Z-scan and time-resolved data, the values correspond to sample position (Z-scan) or time (time-resolved), and the values correspond to the normalized transmittance. Areas calculated where the curve travels to the left are counted negatively, and areas to the right are positive; the total area is the sum of all such areas, taking sign into account.
B.2 Single Beam Z-Scan FTLS-IM
For single-beam Z-scan measurements, the FTLS-IM is defined as the integral of the absolute value of the baseline-corrected and Rayleigh-range-normalized Z-scan signal:
| (5) |
where is the baseline-corrected Z-scan signal as a function of the normalized sample position (), and is the Rayleigh range. The baseline correction involves subtracting the average of the signal values far from the focus ( and ) from the raw signal.
- Baseline Correction
-
For each Z-scan curve, a baseline value was determined by the first recorded thermal lensing signal value at the lowest normalized Z-position. This initial value was then subtracted from all subsequent thermal lensing signal measurements for that specific compound to remove any background signal.
- Rayleigh Range Normalization
-
The sample position (ZPos) was normalized by a factor related to the Rayleigh range. With a Rayleigh range mm, the dimensionless z-position () was obtained by dividing the ZPos by mm (since was used as the normalization factor).
B.2.1 Preprocessing
The initial data frame was prepared by converting the compound identifier to a factor variable and normalizing the Z-position values. The normalization was achieved by dividing the Z-position by (assuming a Rayleigh range of 1.58 mm).
For each compound, a baseline correction was applied to the thermal lensing signal. This involved identifying the first recorded thermal lensing signal value at the lowest normalized Z-position and subtracting this initial value from all subsequent thermal lensing signal measurements for that specific compound. This step ensured that the initial signal was set to zero for each compound.
Following the baseline correction, the thermal lensing signal data for each compound was normalized. This normalization was performed by dividing all baseline-corrected signal values by the maximum absolute baseline-corrected signal value observed across all compounds. This step scaled the data to a range between -1 and 1.
B.3 Dual Beam Z-Scan FTLS-IM
For dual-beam Z-scan measurements, the FTLS-IM is defined as the area under the curve (AUC) of the normalized and baseline-corrected Z-scan signal:
| (6) |
where is the baseline-corrected and normalized Z-scan signal as a function of the normalized sample position (), and is the Rayleigh range. The baseline correction involves subtracting 1 from the Z-scan signal, which has been normalized so the intial value is unity.
B.3.1 Preprocessing
The initial data frame was prepared by converting the compound identifier to a factor variable and normalizing the Z-position values. The normalization was achieved by dividing the Z-position by (assuming a Rayleigh range of 1.58 mm).
Following this, for each compound, a baseline correction was applied to the thermal lensing signal. The first recorded thermal lensing signal value was identified (assuming the data was ordered by the Z-position). Then, all thermal lensing signal values for that compound were shifted by subtracting this first value and adding 1. This step ensured that the initial thermal lensing signal value for each compound was approximately unity.
B.4 Dual Beam Time Resolved FTLS-IM
For time-resolved pump-probe measurements, the FTLS-IM is defined as the area under the curve (AUC) of the normalized and baseline-corrected time-dependent signal:
| (7) |
where is the time-resolved signal, is the total time, and is the number of excitation pulses (N=3 in this study). The signal is normalized by applying the Pruned Exact Linear Time (PELT) algorithm with the Modified Bayes Information Criterion (MBIC) to identify the initial response, setting this value to unity. Subsequently, the signal was shifted such that the minimum amplitude value was zero. This normalization allows for a direct comparison of the signal decay across different samples, accounting for variations in initial signal amplitude and baseline offsets.
B.4.1 Thinning
To reduce computational cost and data volume, the time-resolved data were subsampled, retaining every 100th data point. This subsampling rate was chosen to be well above the Nyquist frequency, ensuring that all relevant features of the thermal lens signal were preserved.
B.4.2 Normalization
Preprocessing and normalization of the time resolved data involved the Pruned Exact Linear Time (PELT) algorithm [14] with the Modified Bayes Information Criterion (MBIC) [36] penalty as implemented in the changepoint package [13].
For each compound, this algorithm was used to detect the first significant change in the mean of the amplitude signal. The amplitude value at this detected changepoint (or the first amplitude value if no changepoint was identified) was then used to normalize the signal by subtracting this value and adding 1. This effectively sets the amplitude at the initial response to unity.
B.5 Package versions
The packages that were part of the session as per devtools::session_info, are in Table B.5, note that the packages used are only the attached ones. All packages are from CRAN (R 4.3.3). The R base was version 4.3.3 (2024-02-29) running on Arch Linux (x86_64, linux-gnu) with an X11 UI, English language, en_US.UTF-8 collation and ctype, UTC timezone.
| packages.package | packages.loadedversion | packages.date |
|---|---|---|
| broom | 1.0.7 | 2024-09-26 |
| changepoint | 2.30 | 2024-11-04 |
| cluster | 2.1.8 | 2024-12-11 |
| devtools | 2.4.5 | 2022-10-11 |
| dplyr | 1.1.4 | 2023-11-17 |
| factoextra | 1.0.7 | 2020-04-01 |
| forcats | 1.0.0 | 2023-01-29 |
| fs | 1.6.5 | 2024-10-30 |
| ggnewscale | 0.5.1 | 2025-02-24 |
| ggplot2 | 3.5.1 | 2024-04-23 |
| ggpmisc | 0.6.1 | 2024-11-14 |
| ggpp | 0.5.8-1 | 2024-07-01 |
| ggthemes | 5.1.0 | 2024-02-10 |
| httpgd | 1.3.1 | 2023-01-30 |
| khroma | 1.16.0 | 2025-02-25 |
| latex2exp | 0.9.6 | 2022-11-28 |
| lubridate | 1.9.4 | 2024-12-08 |
| patchwork | 1.3.0 | 2024-09-16 |
| pracma | 2.4.4 | 2023-11-10 |
| purrr | 1.0.4 | 2025-02-05 |
| readr | 2.1.5 | 2024-01-10 |
| readxl | 1.4.5 | 2025-03-07 |
| reprex | 2.1.1 | 2024-07-06 |
| scales | 1.3.0 | 2023-11-28 |
| stringr | 1.5.1 | 2023-11-14 |
| testthat | 3.2.3 | 2025-01-13 |
| tibble | 3.2.1 | 2023-03-20 |
| tidyr | 1.3.1 | 2024-01-24 |
| tidyverse | 2.0.0 | 2023-02-22 |
| usethis | 3.1.0 | 2024-11-26 |
Appendix C Results
C.1 Single Beam Z-Scan
C.1.1 Comparison to Tpv
The peak to valley measure is given by Eq. 8.
| (8) |
C.2 Dual Beam Z-Scan
C.2.1 Comparison to signal
The signal at corresponds to the focal point signal, and is given by Eq. 9.
| (9) |
Where represents the value of the baseline-corrected and shifted thermal lensing signal when the Z-position is equal to .
C.2.2 FTLS-IM Validation
The “W” shape effect is captured by the FTL-IM measure as seen in Figure 15, where it is seen to correspond to a higher measure compared to the signal measured at . The trends are equivalent, although the magnitude of the FTL-IM compared to the single point measure reinforces the understanding that the measure is sensitive to convective effects. The value for MeA and Citrus accord in both measures is almost equivalent, and it is also visually evident that the measure order corresponds exactly to the transmittance order.
C.3 Dual Beam Time Resolved
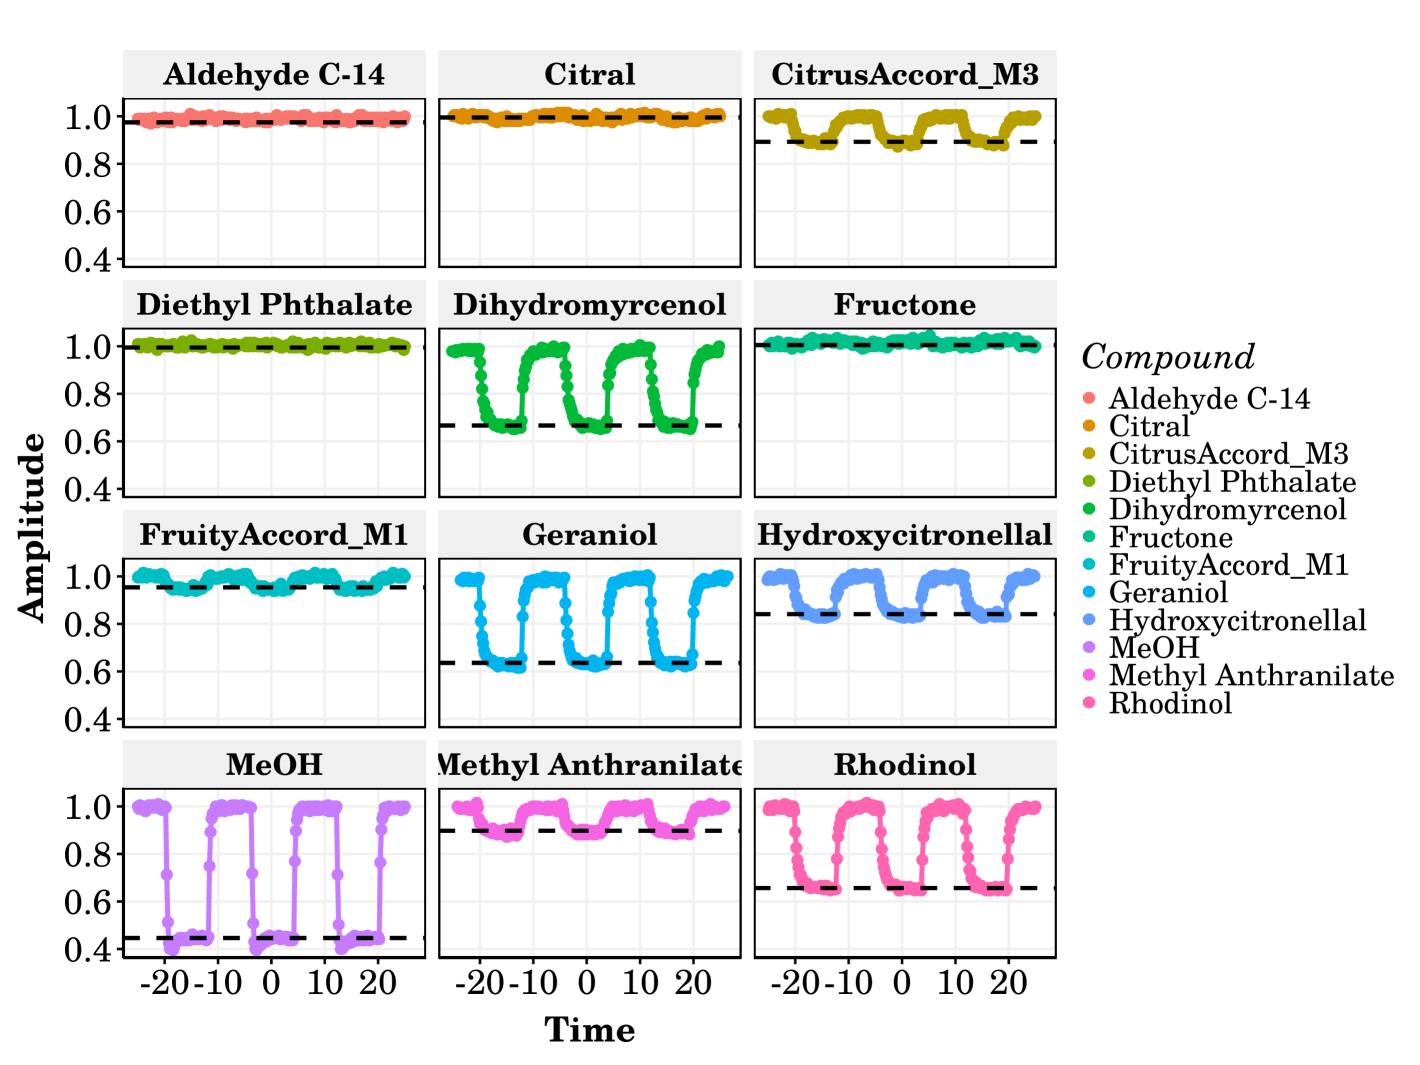
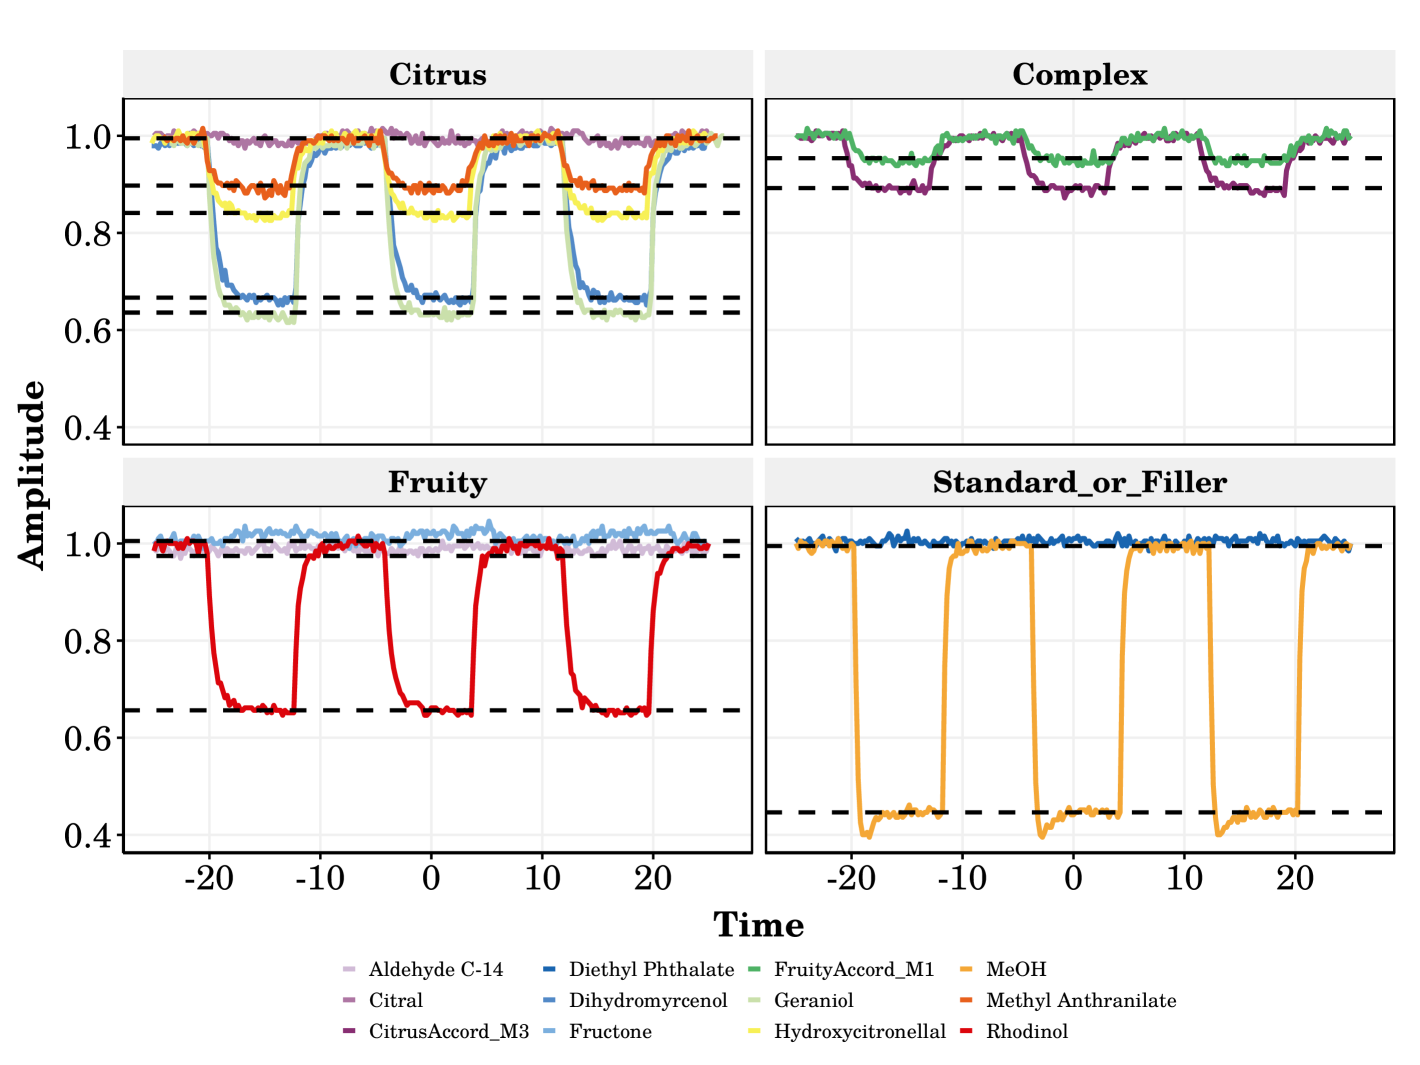
To facilitate visual comparison between compounds and accords, the data were smoothed using a rolling mean and folded to overlay multiple cycles (Figure 18).
C.3.1 Steady state TL determination
The steady-state thermal lens (STL) signal, represents the amplitude of the thermal lens signal after it has reached equilibrium following the initial transient response. Accurately determining this value is crucial for subsequent calculations, such as the figure of merit (FTL-IM). We employed a changepoint detection method to identify the point at which the signal stabilizes.
The procedure involved the following steps:
- Data Pre-filtering
-
For each compound, the time-resolved thermal lens signal data (Amplitude_shifted, already baseline-corrected and shifted) was pre-filtered to consider only the portion of the curve below the mean amplitude. This pre-filtering step was implemented to prevent the initial, rapid decrease in signal (often associated with the formation of the thermal lens) from being incorrectly identified as the steady-state. We focused on the lower half of the signal where the stabilization occurs.
- Changepoint Analysis
-
The changepoint package in R was used to identify the changepoint within the pre-filtered data. Specifically, the cpt.meanvar function was applied. This function is designed to detect changes in both the mean and variance of a time series. The minimum segment length between changepoints was set to the ESTIMATED_PERIOD of . The CROPS (Changepoints for a Range Of Penalties) penalty [12] was employed with the pen.value set between 0 and 1. Since the changepoints will be, at most, one value, then the first and only value is taken.
- Steady-State Value Extraction
-
The changepoint analysis identified the index (time point) at which the signal transitioned to its steady-state behavior. The STL value was then extracted as the Amplitude_shifted value corresponding to that changepoint index.
C.3.2 FTLS-IM Validation
For the time resolved data, the FTL-IM measure is contrasted against the the steady state TL signal in Figure 20, the primary difference is that of magnitude, as the FTL-IM has a larger value for alcohols.
C.4 Comparing FTL-IM
The FTL-IM values for the SBZ and DBZ are both on similar scales by construction. For the DTR result, we scale using min-max scaling given by Eq. 10.
| (10) |
References
- [1] Allgower, E. L., and Schmidt, P. H. Computing volumes of polyhedra. Mathematics of Computation 46, 173 (1986), 171–174.
- [2] Arctander, S. Perfume and Flavor Chemicals (Aroma Chemicals) Vol.1. Lulu.com, Oct. 2017.
- [3] Bhattacharyya, D. K. Perfumery Materials: Production & Applications. Studium Press, Houston, Texas, 2009.
- [4] Borchers, H. W. pracma: Practical Numerical Math Functions, 2023. R package version 2.4.4.
- [5] Chandrasekhar, V., Pandey, M. D., Maurya, S. K., Sen, P., and Goswami, D. Two-photon-absorption technique for selective detection of copper(II) ions in aqueous solution using a dansyl–pyrene conjugate. Chemistry – an Asian Journal 6, 9 (Sept. 2011), 2246–2250.
- [6] D. Snook, R., and D. Lowe, R. Thermal lens spectrometry. A review. Analyst 120, 8 (1995), 2051–2068.
- [7] Dobek, K. Thermal lensing: Outside of the lasing medium. Applied Physics B 128, 2 (Jan. 2022), 18.
- [8] Epperson, J. F. An Introduction to Numerical Methods and Analysis. 615.
- [9] Georges, J. Matrix effects in thermal lens spectrometry: Influence of salts, surfactants, polymers and solvent mixtures. Spectrochimica Acta, Part A: Molecular and Biomolecular Spectroscopy 69, 4 (Apr. 2008), 1063–1072.
- [10] Goswami, D. Intense femtosecond optical pulse shaping approaches to spatiotemporal control. Frontiers in Chemistry 10 (2023).
- [11] Goswami, S., and Goswami, D. Chapter 7 - Ultrafast laser induced photothermal spectroscopy. In Photoacoustic and Photothermal Spectroscopy, S. N. Thakur, V. N. Rai, and J. P. Singh, Eds. Elsevier, Jan. 2023, pp. 155–184.
- [12] Haynes, K., Eckley, I. A., and Fearnhead, P. Efficient penalty search for multiple changepoint problems, Dec. 2014.
- [13] Killick, R., and Eckley, I. A. Changepoint: An R package for changepoint analysis. Journal of Statistical Software 58 (June 2014), 1–19.
- [14] Killick, R., Fearnhead, P., and Eckley, I. A. Optimal Detection of Changepoints With a Linear Computational Cost. Journal of the American Statistical Association 107, 500 (2012), 1590–1598.
- [15] Kodosky, J. LabVIEW. Proc. ACM Program. Lang. 4, HOPL (June 2020), 78:1–78:54.
- [16] Kumar, P., Dinda, S., Chakraborty, A., and Goswami, D. Unusual behavior of thermal lens in alcohols. Physical Chemistry Chemical Physics 16, 24 (2014), 12291–12298.
- [17] Kumar, P., Khan, A., and Goswami, D. Importance of molecular heat convection in time resolved thermal lens study of highly absorbing samples. Chemical Physics 441 (Sept. 2014), 5–10.
- [18] Kumar Rawat, A., Chakraborty, S., Kumar Mishra, A., and Goswami, D. Achieving molecular distinction in alcohols with femtosecond thermal lens spectroscopy. Chemical Physics 561 (Sept. 2022), 111596.
- [19] Liu, M., and Franko, M. Thermal lens spectrometry: Still a technique on the horizon? International Journal of Thermophysics 37, 7 (May 2016), 67.
- [20] Maurya, S. K., Yadav, D., and Goswami, D. Effect of femtosecond laser pulse repetition rate on nonlinear optical properties of organic liquids. PeerJ Physical Chemistry 1 (Oct. 2019), e1.
- [21] Mohebbifar, M. R., and Almasi, M. Study of thermal behavior of alcohol-CCl4 binary mixtures using laser thermal lens spectroscopy. Journal of Thermal Analysis and Calorimetry 147, 16 (Aug. 2022), 8679–8687.
- [22] R Core Team. R: A Language and Environment for Statistical Computing. R Foundation for Statistical Computing, Vienna, Austria, 2024.
- [23] Rawat, A. K., Chakraborty, S., Mishra, A. K., and Goswami, D. Unraveling molecular interactions in binary liquid mixtures with time-resolved thermal-lens-spectroscopy. Journal of Molecular Liquids 336 (Aug. 2021), 116322.
- [24] Rawat, A. K., Chakraborty, S., Mishra, A. K., and Goswami, D. Investigating the pH dependence of thermal signatures in monohydric and polyhydric alcohols using time-resolved thermal lens spectroscopy. Optical Materials 137 (Mar. 2023), 113623.
- [25] Rawat, A. K., Chakraborty, S., Mishra, A. K., and Goswami, D. Power-dependent study of the photothermal response of several alcoholic media with femtosecond laser-induced thermal lens. Photochemistry and Photobiology 100, 4 (June 2024), 1140–1150.
- [26] Sharma, A., and Goswami, D. Impact of molecular convection in time-resolved thermal lensing: A computational exploration. Journal of Physics D: Applied Physics 57, 44 (2024), 44LT01.
- [27] Sheik-Bahae, M., Said, A., Wei, T.-H., Hagan, D., and Van Stryland, E. Sensitive measurement of optical nonlinearities using a single beam. IEEE Journal of Quantum Electronics 26, 4 (Apr. 1990), 760–769.
- [28] Shen, J., Lowe, R. D., and Snook, R. D. A model for cw laser induced mode-mismatched dual-beam thermal lens spectrometry. Chemical Physics 165, 2 (Sept. 1992), 385–396.
- [29] Singhal, S., and Goswami, D. Thermal Lens Study of NIR Femtosecond Laser-Induced Convection in Alcohols. ACS Omega 4, 1 (Jan. 2019), 1889–1896.
- [30] Singhal, S., and Goswami, D. Unraveling the molecular dependence of femtosecond laser-induced thermal lens spectroscopy in fluids. Analyst 145 (2020), 929–938.
- [31] Teixeira, M. A., Ed. Perfume Engineering: Design, Performance & Classification. Butterworth-Heinemann, Oxford, England; Waltham, MA, 2013.
- [32] Toller, S., and Dodd, G. H. Perfumery: The Psychology and Biology of Fragrance. Springer Netherlands, Dordrecht, 1988.
- [33] Wang, J., Sheik-Bahae, M., Said, A. A., Hagan, D. J., and Stryland, E. W. V. Time-resolved Z-scan measurements of optical nonlinearities. Josa B 11, 6 (June 1994), 1009–1017.
- [34] Wickham, H. Ggplot2: Elegant Graphics for Data Analysis, second ed. Use R! Springer international publishing, Cham, 2016.
- [35] Wickham, H., Averick, M., Bryan, J., Chang, W., McGowan, L. D., François, R., Grolemund, G., Hayes, A., Henry, L., Hester, J., Kuhn, M., Pedersen, T. L., Miller, E., Bache, S. M., Müller, K., Ooms, J., Robinson, D., Seidel, D. P., Spinu, V., Takahashi, K., Vaughan, D., Wilke, C., Woo, K., and Yutani, H. Welcome to the Tidyverse. Journal of Open Source Software 4, 43 (Nov. 2019), 1686.
- [36] Zhang, N. R., and Siegmund, D. O. A modified bayes information criterion with applications to the analysis of comparative genomic hybridization data. Biometrics 63, 1 (Mar. 2007), 22–32.