Cavity quantum electrodynamics with single perovskite quantum dots
Abstract
Quantum emitters of single indistinguishable photons play a key role in quantum technologies. Among condensed matter systems, colloidal perovskite quantum dots have emerged as promising candidates, exhibiting high-purity single photon emission at room temperature and two-photon interference visibilities up to 0.5 at cryogenic temperatures. Achieving deterministic coupling of individual perovskite quantum dots to photonic structures is now a critical step towards harnessing cavity quantum electrodynamics (cQED) effects, such as the Purcell effect, to enhance single photon emission rate and indistinguishability. Here, we demonstrate the deterministic and reversible coupling of individual CsPbBr3 perovskite quantum dots to a tunable, high-quality factor, low mode volume fiber-based Fabry-Pérot microcavity at 10 . By spatially and spectrally tuning the cavity mode in resonance with the quantum dot emission, we observe up to a twofold increase in single photon emission rates. We build on the original multiplet excitonic fine structure to assess the vacuum Rabi coupling strength ( 40 ) from the shaping of the spectral profile of the emission upon increasing the electromagnetic confinement. This approach also made it possible to delineate the contributions of spectral diffusion and pure dephasing to the total linewidth of emission, paving the way to a fully optimized control of the emission properties of cavity coupled perovskite quantum dots.
Since their first synthesis in 2015 [1], colloidal lead halide perovskite quantum dots (pQDs) have emerged as promising nano-emitters for scalable, solution-processed quantum dot-based optoelectronic devices such as photonic sources [2]. This is due to their excellent optical properties, including high brightness, tunable optical bandgap, and reduced blinking, achieved through accessible and cost-effective synthesis methods. At the single dot level, pQDs are also among the most promising newcomers in the field of solid-state single-photon emitters [3, 4] showing stable single photon emission with high purity at room temperature [5, 6]. In addition, at cryogenic temperatures, pQDs exhibit long coherence time (), comparable to their lifetime () [7, 8, 9]. This remarkable value has allowed the first demonstration by Kaplan et al. in 2023 of 50 photon indistinguishability in colloidal quantum dots [10], whereas perfect photon indistinguishability is achieved in the limit . Furthermore, phenomena such as radiative biexciton-exciton cascade emission [11, 12], capable of generating correlated polarized photon pairs, and collective superfluorescence emission in self-assembled pQDs superstructures [13], highlight the assets of perovskite nanostructures for quantum technologies.
To fully exploit these assets, a critical step is to enhance light-matter interaction at the single pQD scale by coupling to photonic structures, such as optical microcavities, to harness cavity quantum electrodynamics (cQED) effects. These effects, whether in the weak or strong coupling regime, depend critically on the spectral and spatial matching between the emitter and the cavity, as well as on the quality factor () and mode volume () of the cavity. In the weak coupling regime, where the vacuum Rabi coupling strength is smaller than the system losses, the acceleration of the radiative spontaneous emission together with the redirection of the emission in the cavity mode are key features of the Purcell effect [14] for the development of efficient single photon sources. In the strong coupling regime, where exceeds the losses, cQED effects yield few-photon nonlinearities enabling advanced features for quantum photonic logic gates [15]. Knowing the value of is therefore crucial to assess the potential of individual quantum emitters for cQED applications. While is directly imprinted in the spectrum via the Rabi splitting in the strong coupling regime, its evaluation in the weak coupling regime is more challenging as it relies mainly on indirect analysis. Up to now, pQDs have seen limited experimental demonstrations of cavity coupling and the evaluation of remains unexplored for individual pQDs. Early work demonstrated the coupling of ensembles of pQDs to photonic crystal nanobeams, achieving emission acceleration [16]. Recently, the coupling of single pQDs to circular Bragg gratings has also been demonstrated with an emission enhancement in the Purcell regime [17, 18]. Nevertheless, significant challenges hinder the precise assessment of cQED effects. These include the statistical biases arising from the variations of their local environment when comparing the optical properties of coupled pQDs with those of uncoupled ones. To overcome these limitations, open microcavities offer a compelling solution, especially for randomly positioned quantum emitters, since their flexibility enables deterministic emitter-cavity coupling, as demonstrated for various individual emitters such as carbon nanotubes [19, 20], NV centers in diamond [21], molecules [22], or epitaxial QDs [23]. In this context, recent studies have demonstrated the deterministic coupling of single pQDs to an open Fabry-Pérot microcavity, leading to room temperature single photon emission with significant spectral narrowing due to cavity filtering [24], but without cQED effects.
In this work, we demonstrate the deterministic coupling of single pQDs into an open fiber-based Fabry–Pérot microcavity at cryogenic temperature, achieving a twofold enhancement of the emission rate, corresponding to Purcell factors of up to 3.3 for the smallest cavity mode volume. We then exploit the unique multiplet excitonic fine structure of pQDs by monitoring its spectral evolution under cavity length modulation, showing that the pQD-cavity system provides clear spectral cQED signatures in the weak coupling regime. We model these results by accounting for both static and dynamic effects, including pure dephasing and spectral diffusion, which shape the emitter’s spectral properties and impact light-matter coupling in distinct ways. The combination of detailed temporal and spectral investigations of the very same pQD enables reliable determination of cQED parameters and their dependence on the cavity mode volume. Overall, our approach provides a new methodology to estimate the vacuum Rabi coupling - up to 40 in our case - while offering an original means to delineate the respective contributions of pure dephasing and spectral diffusion to the emitter linewidth.
Results and discussion
Coupling of a single perovskite quantum dot with a tunable fiber microcavity
The synthesis of lead halide CsPbBr3 pQDs is carried out in-house using the hot injection method. Cubic-shaped pQDs with approximate edge sizes of 10 are obtained in solution. In order to study the optical properties of individual pQDs either in free space or in cavity, the solution is diluted in a polystyrene-toluene mixture and spin-coated on a high-reflectivity planar dielectric mirror (see Methods). The resulting sample then consists of highly dispersed and randomly oriented pQDs embedded in a polystyrene matrix, which prevents the pQDs from degradation with air and humidity and is therefore crucial for the pQDs emission stabilization [25]. Micro-photoluminescence (PL) experiments are performed at cryogenic temperature (10 ), using backside excitation through the planar mirror beyond the stop band and collection by a drilled aspheric lens (Figure 1a). Once a single pQD is characterized in free space, this setup further enables coupling the very same pQD to an optical microcavity (Figure 1b), where the second mirror is fabricated at the tip of an optical fiber inserted in the drilled lens [19, 20]. Spectral matching is then achieved by precisely adjusting the distance between the mirrors to tune the cavity resonance, while spatial matching is achieved by laterally displacing the planar mirror. Furthermore, the cavity can be opened and closed at will while keeping all other parameters (temperature, excitation, local electrostatic environment) constant, providing a unique opportunity to directly compare the properties of an individual pQD in free space and in cQED regimes (see Methods and Supplemental Information, section I, for more details on the microcavity implementation and the optical properties of the mirrors).
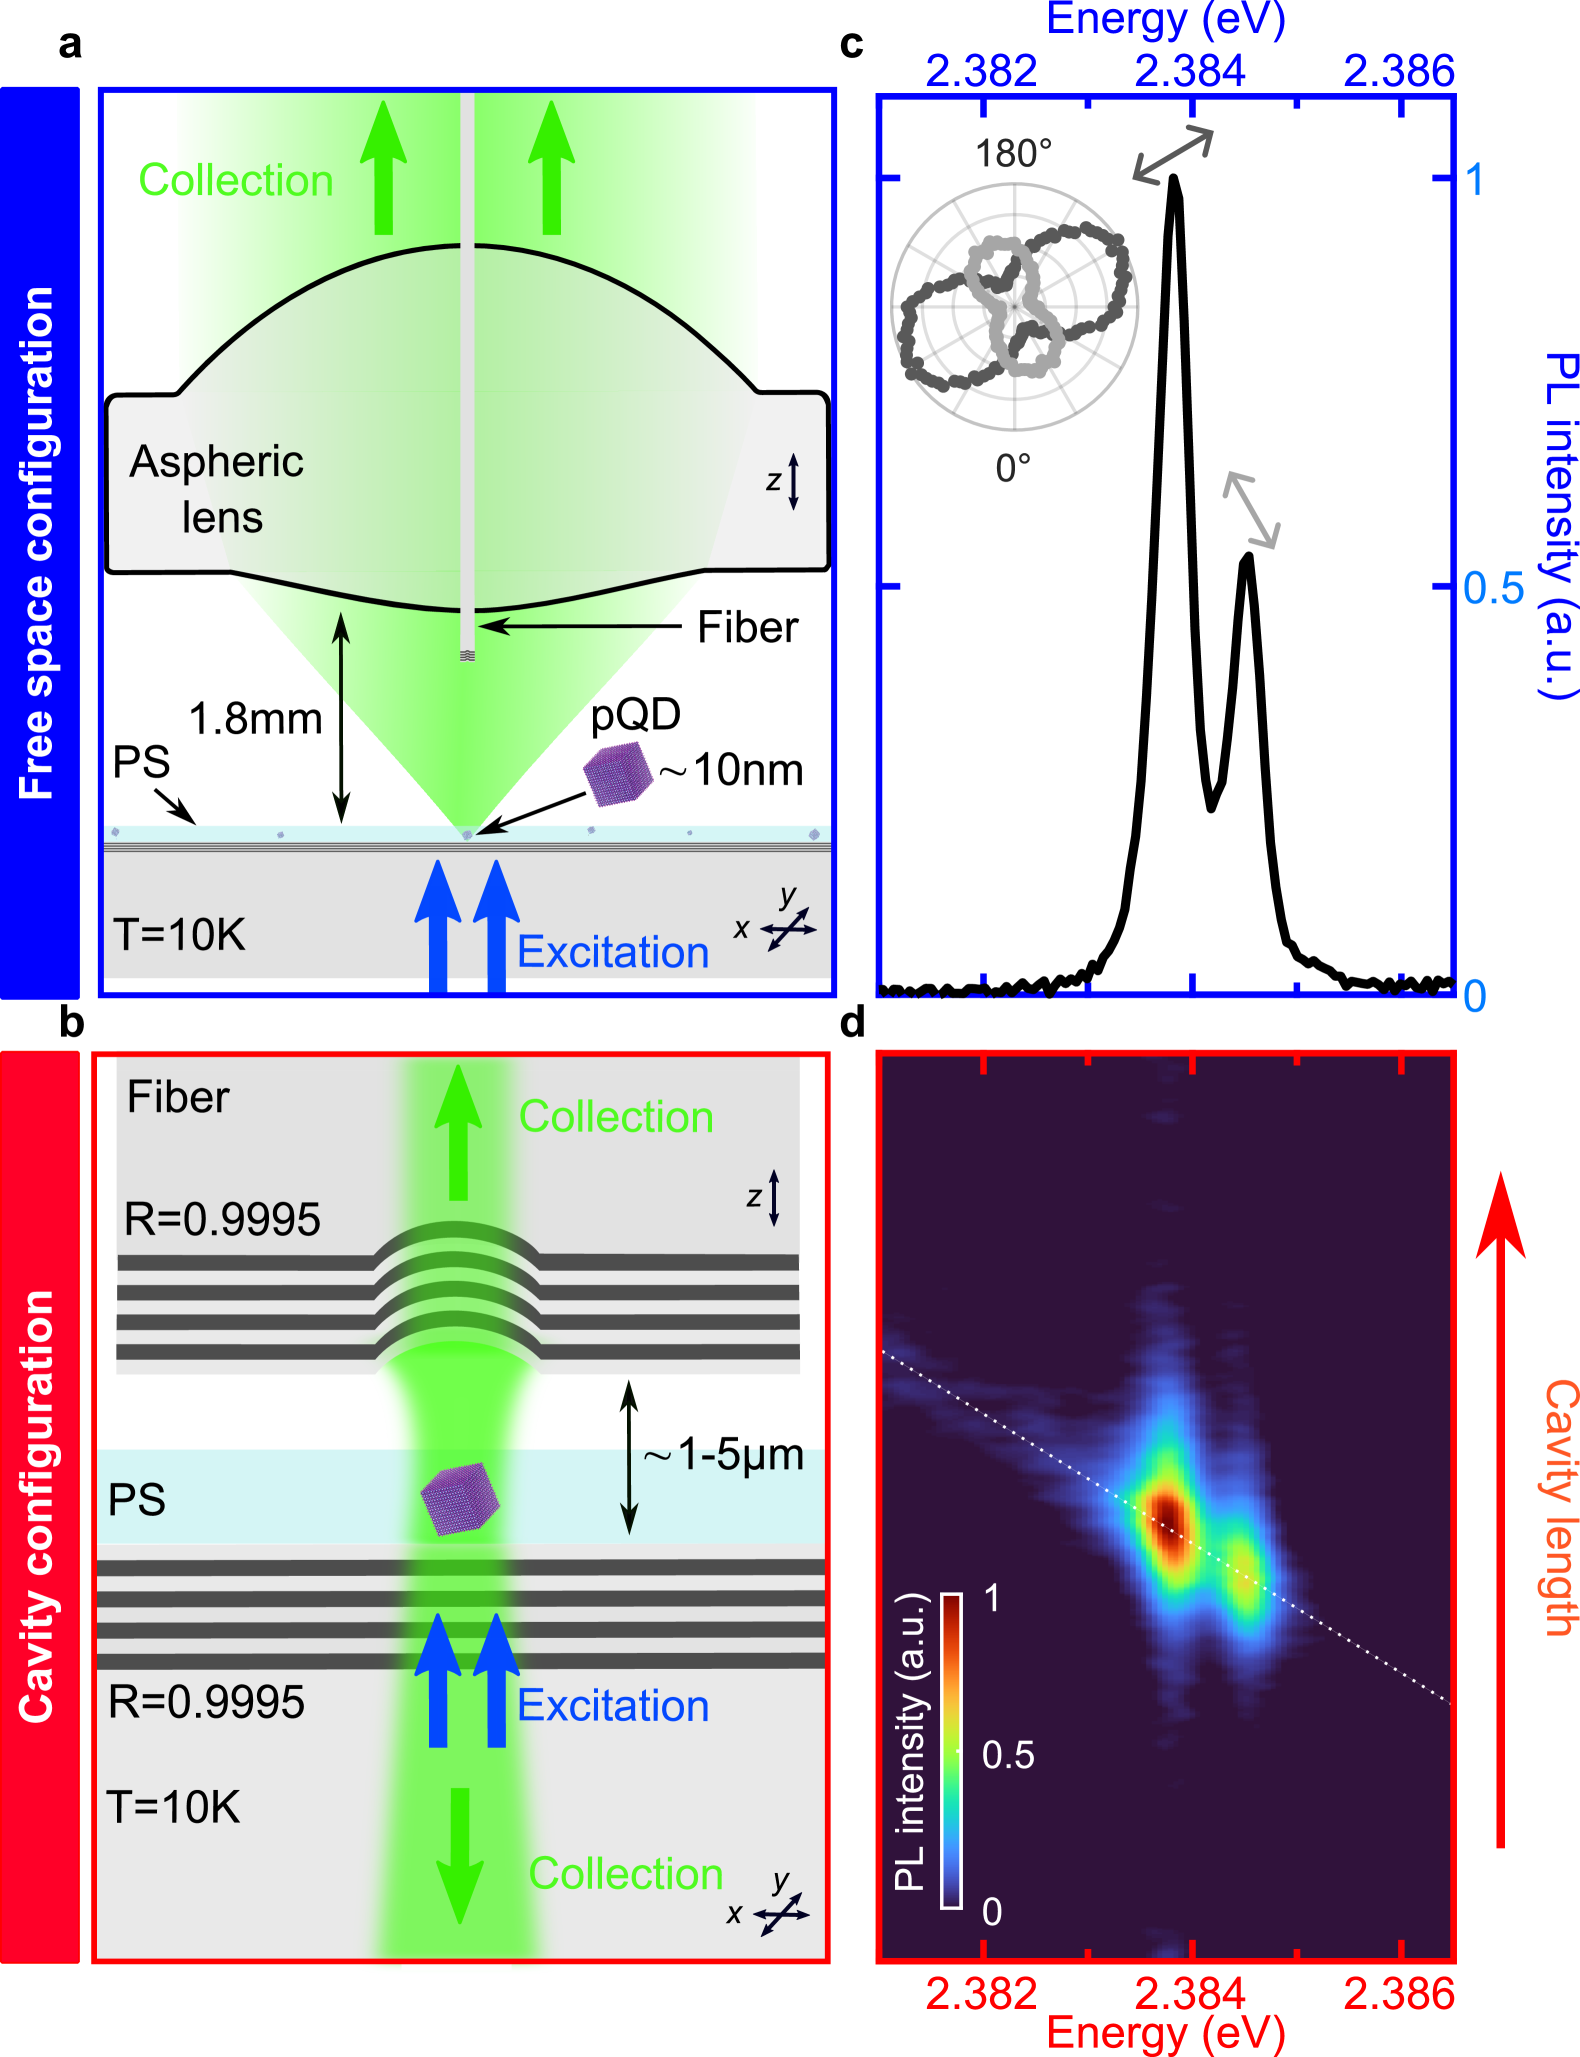
Figure 1c shows the free space PL spectrum of a single pQD. Here, the spectrum consists of a cross-linearly polarized doublet at 2.38 characterized by linewidths of 350 and 290 for the lower and higher energy peaks respectively, and a splitting . The full pQD spectrum showing the trion and biexciton complexes, along with another example of spectrum where an excitonic triplet can be resolved, are shown in the Supplemental Information (see SI, section II). We have previously shown that the observation of a doublet, instead of the expected triplet for CsPbBr3 pQDs at cryogenic temperatures, can be explained by the orientation of the pQD (and thus of its three emission dipoles) within the polystyrene matrix relatively to the direction of observation [26]. For a pQD spectrum where only one doublet is observed, it can be assumed that one of the emission dipoles is along the direction of observation, i.e. here along the microcavity axis (z-axis), while the other two are orthogonal. In the following, we focus on such a pQD, which we model as a pair of orthogonal dipoles, hence optimally coupled to the cavity mode (the effect of the random z positioning of pQDs is discussed in SI, section III). By varying the cavity length, we observe in Figure 1d that emission is detected in resonant condition only, when the longitudinal cavity mode of linewidth is tuned at one of the excitonic doublet energies. Note that the mechanical vibrations of the open cavity induce an apparent broadening of the cavity modes with for the lowest accessible mode. This observation of the pQD emission through the highly reflective mirrors of the cavity is the first strong evidence for the effective coupling of the pQD to the cavity mode.
Lifetime acceleration of a single perovskite quantum dot in the Purcell regime
Once a quantum emitter is efficiently coupled to a cavity, an acceleration of its decay rate is expected due to the modification of the electromagnetic density of states. This Purcell effect [14] is studied here by analyzing the time-resolved PL of the pQD in both free space and cavity configurations under pulsed excitation. In free space, time-resolved PL can be performed by spectrally integrating the emission of the pQD excitonic doublet, since each dipole emission has identical lifetimes (see SI, section IV). In cavity, the two emission lines are successively coupled due to the modulation of the pQD-cavity detuning induced by the mechanical vibrations. Therefore, within the measurement duration, the time-resolved PL includes the contribution of both lines. Figure 2a shows the PL decay of the very same pQD in free space (blue dots) and in cavity (red dots). A shortening of the PL lifetime is observed in the cavity configuration. By convoluting the Instrument Response Function (IRF) with a single exponential decay and accounting for the photon storage in the cavity configuration (see SI, section IV), PL lifetimes of and are deduced in free space and cavity configurations, respectively. Repeating this procedure yields an acceleration of the emission rate in the cavity by a factor of . For all investigated pQDs, an emission acceleration of similar magnitude was systematically observed in the cavity configuration (see SI, Section IV). We also emphasize that the time-resolved PL of an individual pQD can show significant variations with time (up to 50 in free space within a few hours), and that only a reconfigurable microcavity, such as the one used here, can provide a reliable acceleration value (see SI, Section IV where multiple measurements of the pQD PL lifetimes are made successively in free space and in cavity).
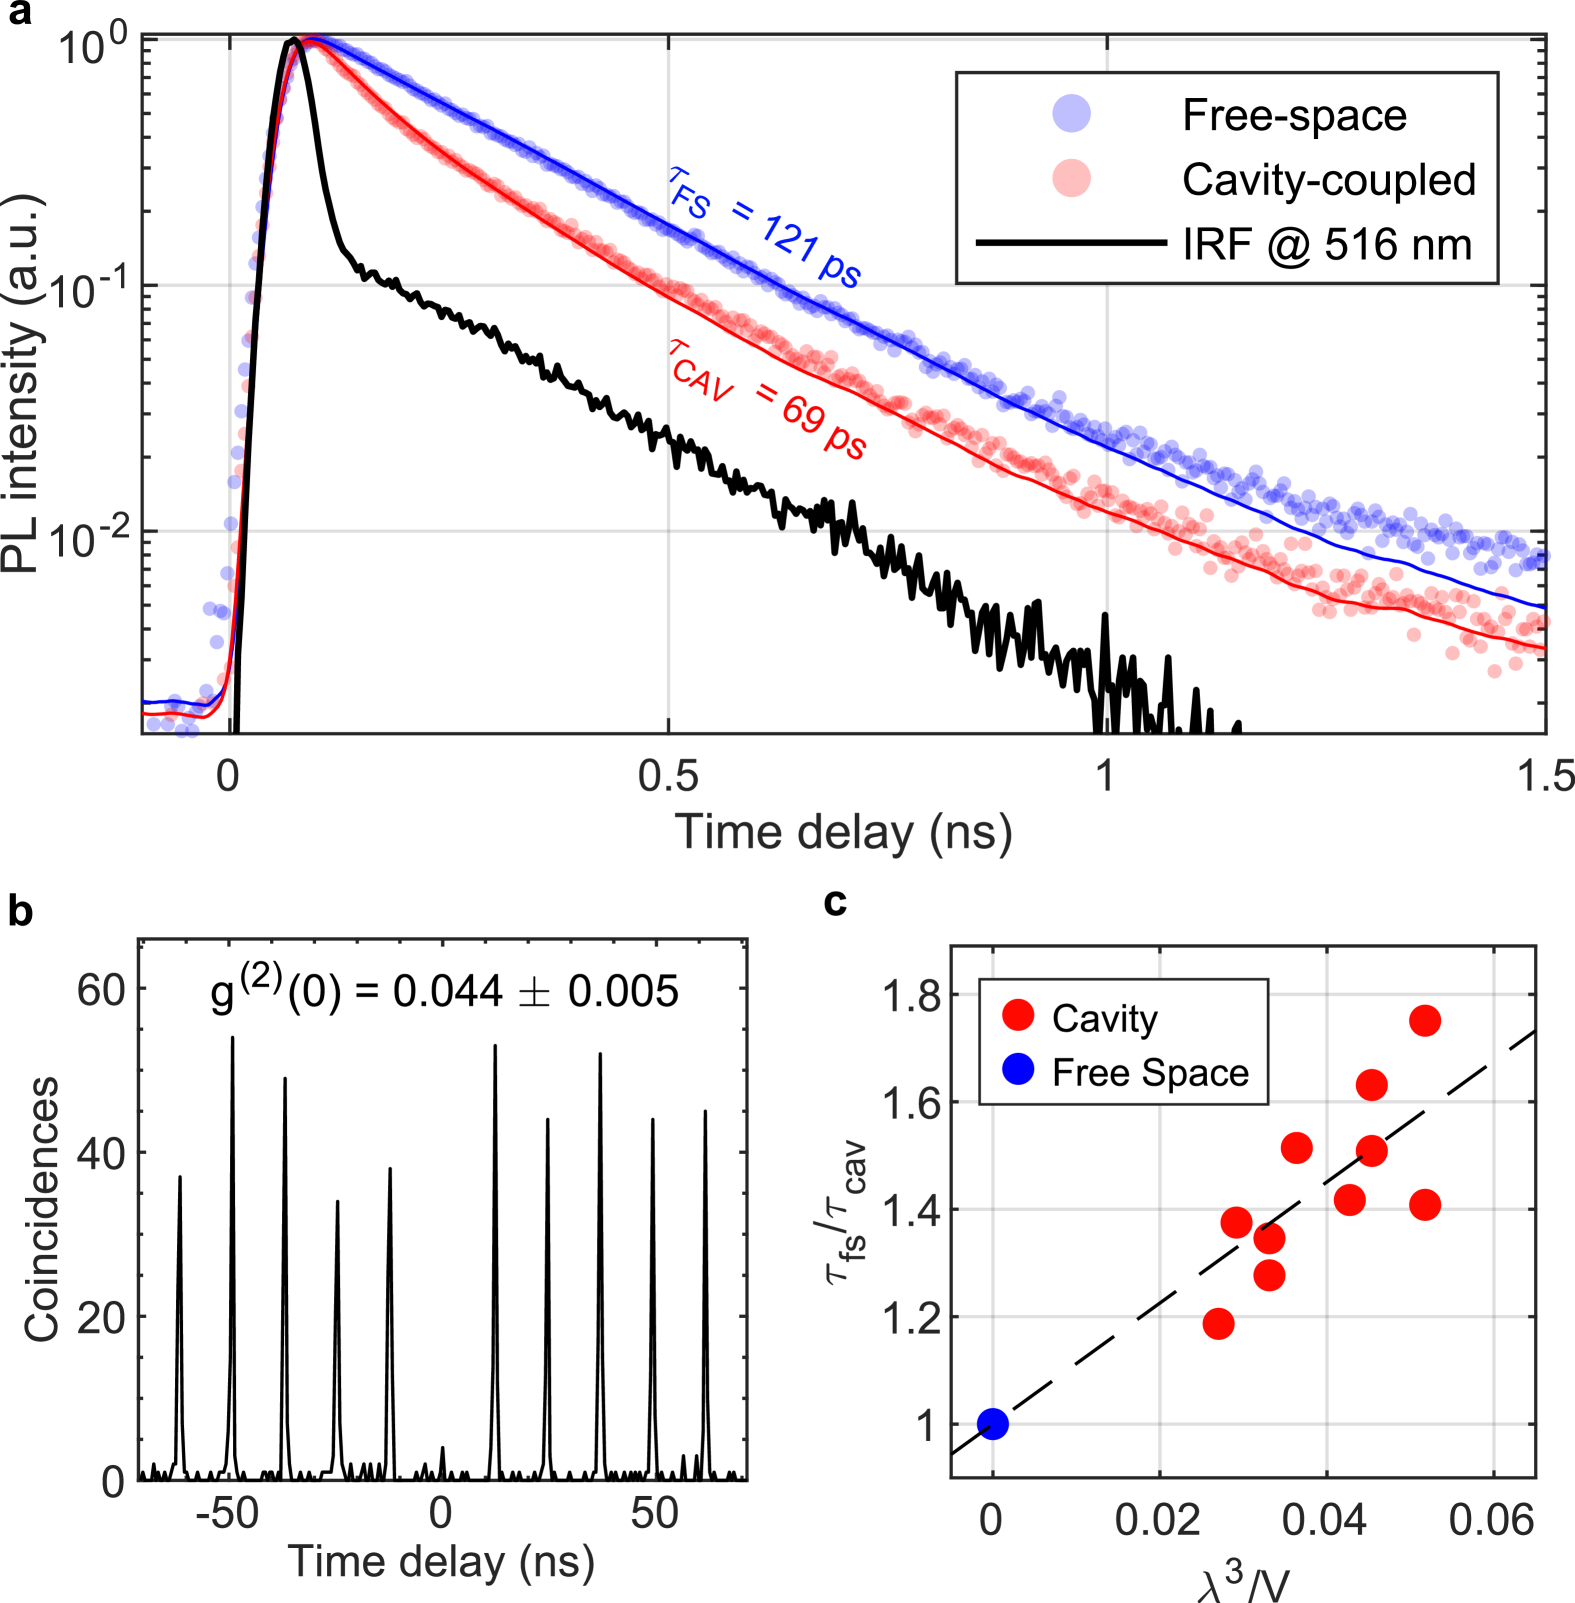
In a first approach, the pQD is considered as a single two-level system. The photon antibunching observed in the second-order intensity auto-correlation function measured at the excitonic transition (Figure 2b) indeed shows that the emission from each line of the excitonic doublet does not occur simultaneously. cQED effects in the weak coupling regime are then typically assessed through the Purcell factor characterizing the emission acceleration. The PL decay rate in cavity is related to the free space PL decay rate by , where refers to the free space radiative quantum yield of the two-level system transition. The relation between and is such that the theoretical expression of matches the usual expression: , where is the cavity mode volume, the refractive index at the emitter position and the effective quality factor which is related to the cavity Q-factor and the emitter Q-factor through [27]. The quantum yield can be determined experimentally and is given by the number of photons emitted per excitation pulse at saturation, for pQD2 (see SI, section II), allowing us to extract an experimental Purcell factor . This value agrees with the theoretical one of obtained for , and . Finally, using our tunable microcavity, we can verify that the PL lifetime acceleration follows the expected linear trend with the inverse of the cavity mode volume, as shown in Figure 2c where the cavity length is varied by steps of half a wavelength.
Vacuum Rabi coupling strength
We now take into account the specificities of the hybrid pQD-cavity system in a more comprehensive model, which allows us to assess the vacuum Rabi coupling , a fundamental cQED figure of merit encoding the strength of light-matter coupling. In the case of a simple two-level system, is related to the acceleration in cavity by , where is the emitter decay rate in cavity at resonance, the free space emitter decay rate, the emitter pure dephasing rate and the cavity loss rate [27]. For most solid-state quantum emitters, the evaluation of is complicated by the presence of spectral diffusion, which is experimentally difficult to distinguish from pure dephasing when it occurs on a time scale shorter than the integration time. In fact, even if the instantaneous PL linewidth is given by , a typical Gaussian broadening of the emission line can be caused by spectral diffusion on any time scale between the emitter lifetime and the integration time. Consequently, the measured linewidth is the sum of both contributions and hence only an upper bound for the pure dephasing rate can be extracted from the spectra. Spectral diffusion leads to a time-varying cavity-emitter detuning and the apparent decay rate measured in cavity is thus smaller than the value expected strictly at resonance . This effect makes it difficult to deduce a reliable value of from the analysis of the temporal dynamics.
To obtain an independent estimate of and determine the transition between the weak and strong light-matter coupling regimes, one can instead analyse the spectral fingerprints of the cavity-emitter system as a function of the emitter-cavity detuning. For very low coupling strengths, the hybrid system emission spectrum is simply the product of the emitter and cavity transmission spectra. When the cavity mode linewidth is smaller than that of the emitter, the cavity acts as a narrow spectral filter. As the coupling increases, spectral mixing between the emitter and cavity contributions occurs, resulting in more complex spectral signatures which depend on the emitter-cavity detuning.
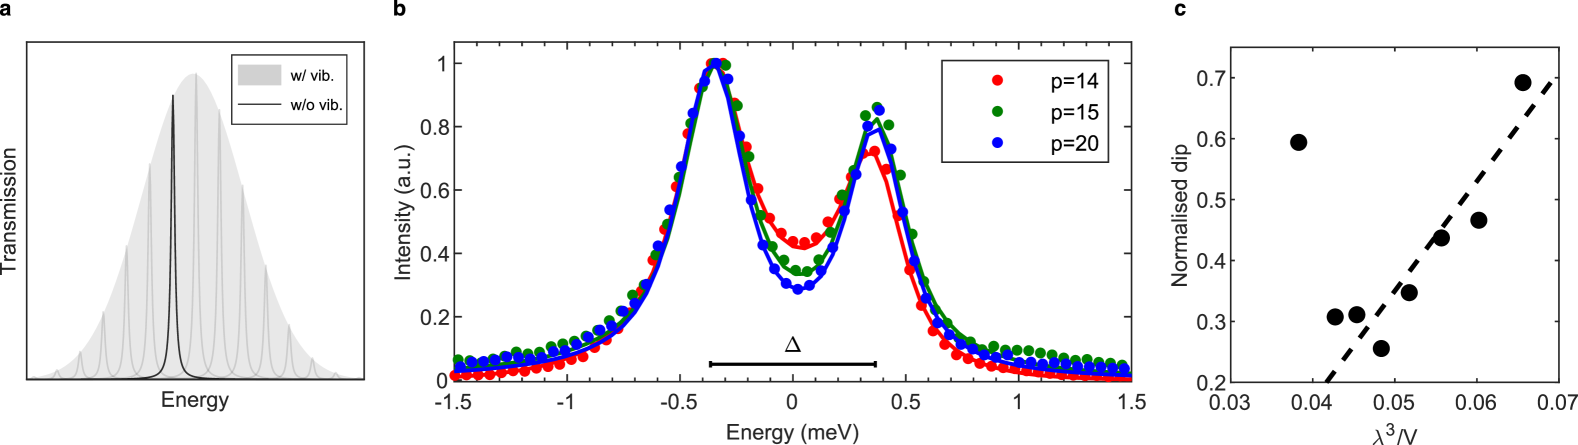
With our flexible platform, the detuning can be modulated either externally or simply by exploiting the spontaneous cavity’s mechanical vibrations. In the latter case, the cavity length is indeed modulated at sub-kHz frequencies, leading to an apparent cavity linewidth for most accessible longitudinal modes. These vibrations can be reduced by a mechanical contact of the two mirrors, i.e. for the lowest accessible mode where . Similarly, while the coupled pQD-cavity system is characterized by an instantaneous Lorentzian spectrum for each cavity length, the emission spectrum of the modulated pQD-cavity system shows a spectral envelope that is displayed in Figure 3a for three longitudinal cavity modes (, 15, and 20). For each mode, the envelope features two main peaks resulting from the spectral matching of the cavity with each line of the excitonic doublet. The shape of the envelope, particularly the central minimum hereafter called dip, is strongly influenced by the emitter-cavity coupling. Figure 3c summarizes the measured normalized dip depths as a function of the inverse cavity mode volume (see Methods for the dip evaluation). The observed linear trend of the normalized dip reflects the modification of the light matter coupling when varying the volume 111We note that the simple extraction of the dip for is far from the general trend. However, this discrepancy is less critical when considering the full theoretical analysis as shown in Figure 4b.. Hence, this feature can be used to assess .
In the case of a single two-level system coupled to a cavity mode, the spectral envelope and its dependence with can be calculated analytically (see SI, section V). Here, we describe the two non-degenerate and orthogonally polarized emission lines (Figure 1c) as two independent and mutually exclusive two-level systems coupled to distinct cavity modes, resulting in two independent subsystems. This framework is indeed valid because the two cavity polarization modes are degenerate and the polarization basis can be chosen arbitrarily aligned with that of the pQD. Therefore, the two subsystems can be incoherently summed in the model.
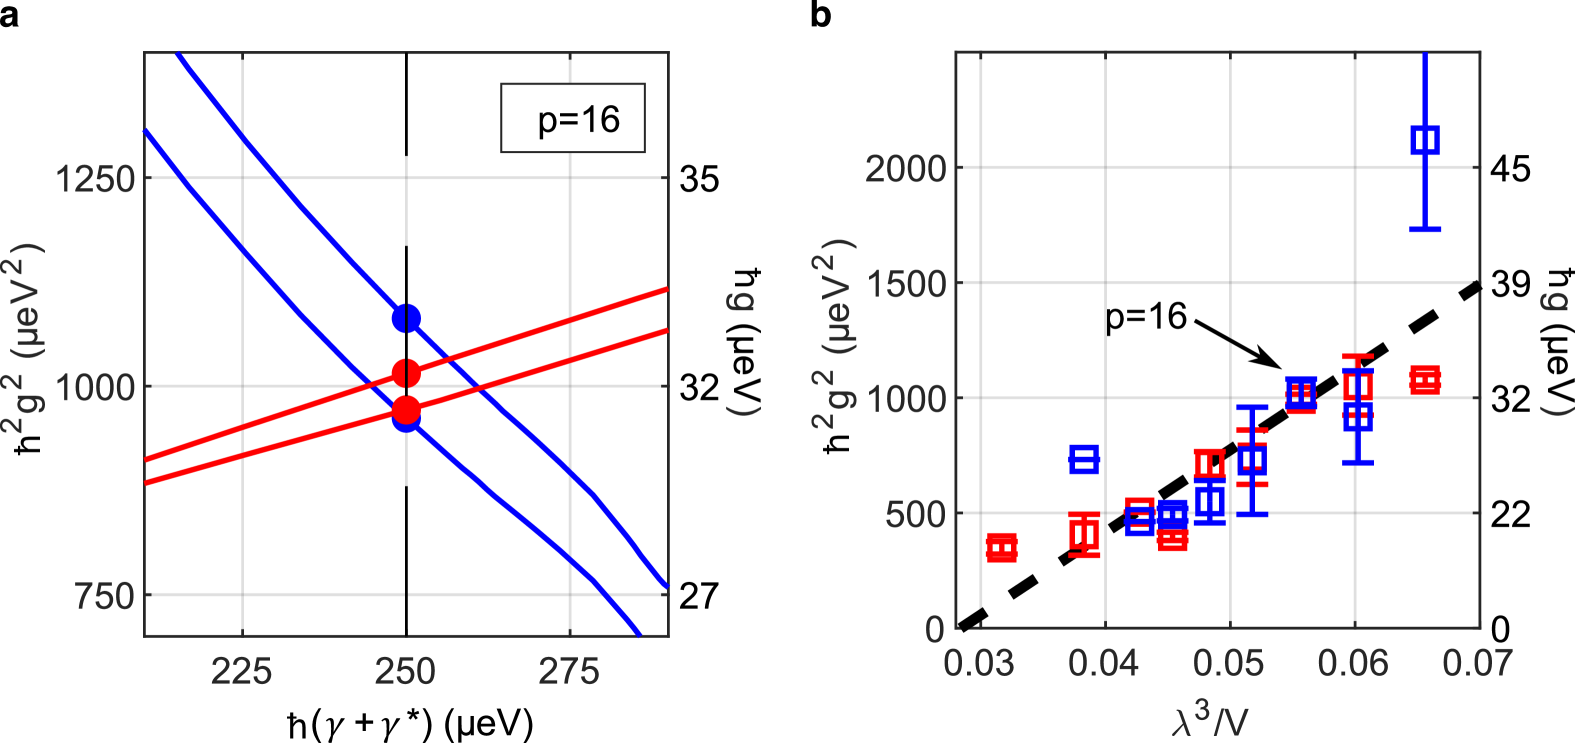
Moreover, the resulting spectral envelope not only depends on the vacuum Rabi coupling , but also on the spectral diffusion amplitude and the instantaneous linewidth , all the other parameters being experimentally determined. Since the total free space PL linewidth is the sum of the pure dephasing and spectral diffusion contributions, a relationship between and can be established (see SI, section V), reducing the model to two free parameters. Similarly, the PL decays that were previously analyzed in a simplified picture are now modeled including the varying detuning induced by the cavity vibrations and the spectral diffusion (see SI, section V). Our model shows that higher pure dephasing requires, firstly, higher values to account for the experimental PL decay rate and, secondly, lower values to fit the experimental spectral envelope profile. Hence, the simultaneous fitting of both experimental inputs (PL decay and spectral envelope) yields a unique intersection from which an accurate estimate of can be deduced, as shown in Figure 4a for the mode . This opposite trend can be understood by considering the dominant dimensionless parameters governing the PL decay and the spectral envelope, which are given by and , respectively. To keep them constant while increasing the instantaneous linewidth (), an increase in is required for the former, whereas a decrease is needed for the latter. Hence, the intersection of the two curves yields all together , and . By reproducing this analysis for all the accessible mode volumes in our platform, the same behavior is obtained with a consistent crossing at (see SI, section V). Figure 4b presents the corresponding values of as a function of the inverse mode volume and shows the expected increase of the Rabi coupling, following a linear trend with . We stress that this comprehensive analysis, based on two complementary experiments, provides a reliable value not only for the vacuum Rabi coupling strength but also for the emitter’s instantaneous linewidth, which are key parameters for quantum technology applications.
In conclusion, we have demonstrated the efficient coupling of single pQDs into an open fiber Fabry-Pérot microcavity, which offers great flexibility in spatial and spectral tuning. The deterministic and reversible coupling of fully characterized single photon emitters, while maintaining the same excitation and local environment, enables insightful cQED experiments in the weak light-matter coupling regime. We systematically observe an acceleration of the emission rate with a maximum twofold acceleration. In a simple two-level system picture, where the radiative quantum yield of the pQD could be estimated to be on the order of , we deduce that this acceleration corresponds to a Purcell factor of . Beyond this first order approach, we developed a comprehensive theoretical model that encompasses advanced spectral properties of the pQDs, i.e. the excitonic fine structure and the linewidth broadening due to pure dephasing and spectral diffusion, in order to accurately analyse the temporal and spectral signatures of the hybrid pQD-cavity system. Using this theoretical framework to analyse two independent sets of experimental results, we extracted key metrics of our pQD-cavity platform: the instantaneous pQD linewidth ( , free from any spectral diffusion contribution) and the light-matter vacuum Rabi coupling strength ( for the smallest mode volume). On the one hand, these results hold great promise for the emission of cavity-enhanced indistinguishable photons. Indeed, according to the work of T. Grange et al. [29], the indistinguishability of photons emitted through the cavity can be estimated to be up to 16%, which is a fourfold improvement over the free space value. This value is obtained while maintaining a high single-photon efficiency of . On the other hand, this study also demonstrates that achieving the strong coupling regime is within reach with this platform using for instance pQDs with optimized ligand stabilization, for which linewidths as narrow as have been reported [7], and by further reducing the cavity volume as we have already done with other emitters [20] while enhancing the cavity finesse to a reasonable extent [22].
References
- Protesescu et al. [2015] L. Protesescu, S. Yakunin, M. I. Bodnarchuk, F. Krieg, R. Caputo, C. H. Hendon, R. X. Yang, A. Walsh, and M. V. Kovalenko, Nanocrystals of cesium lead halide perovskites (CsPbX, X = Cl, Br, and I): Novel optoelectronic materials showing bright emission with wide color gamut, Nano Letters 15, 3692 (2015).
- Sutherland and Sargent [2016] B. R. Sutherland and E. H. Sargent, Perovskite photonic sources, Nature Photonics 10, 295 (2016).
- Aharonovich et al. [2016] I. Aharonovich, D. Englund, and M. Toth, Solid-state single-photon emitters, Nature Photonics 10, 631 (2016).
- Hu et al. [2015] F. Hu, H. Zhang, C. Sun, C. Yin, B. Lv, C. Zhang, W. W. Yu, X. Wang, Y. Zhang, and M. Xiao, Superior Optical Properties of Perovskite Nanocrystals as Single Photon Emitters, ACS Nano 9, 12410 (2015).
- Park et al. [2015] Y.-S. Park, S. Guo, N. S. Makarov, and V. I. Klimov, Room Temperature Single-Photon Emission from Individual Perovskite Quantum Dots, ACS Nano 9, 10386 (2015).
- Zhu et al. [2022] C. Zhu, M. Marczak, L. Feld, S. C. Boehme, C. Bernasconi, A. Moskalenko, I. Cherniukh, D. Dirin, M. I. Bodnarchuk, M. V. Kovalenko, and G. Rainò, Room-temperature, highly pure single-photon sources from all-inorganic lead halide perovskite quantum dots, Nano Letters 22, 3751 (2022).
- Utzat et al. [2019] H. Utzat, W. Sun, A. E. K. Kaplan, F. Krieg, M. Ginterseder, B. Spokoyny, N. D. Klein, K. E. Shulenberger, C. F. Perkinson, M. V. Kovalenko, and M. G. Bawendi, Coherent single-photon emission from colloidal lead halide perovskite quantum dots, Science 363, 1068 (2019).
- Lv et al. [2019] Y. Lv, C. Yin, C. Zhang, W. W. Yu, X. Wang, Y. Zhang, and M. Xiao, Quantum Interference in a Single Perovskite Nanocrystal, Nano Letters 19, 4442 (2019).
- Lv et al. [2021] Y. Lv, C. Yin, C. Zhang, X. Wang, Z.-G. Yu, and M. Xiao, Exciton-acoustic phonon coupling revealed by resonant excitation of single perovskite nanocrystals, Nature Communications 12, 2192 (2021).
- Kaplan et al. [2023] A. E. K. Kaplan, C. J. Krajewska, A. H. Proppe, W. Sun, T. Sverko, D. B. Berkinsky, H. Utzat, and M. G. Bawendi, Hong-Ou-Mandel interference in colloidal CsPbBr perovskite nanocrystals, Nature Photonics 17, 775 (2023).
- Tamarat et al. [2020] P. Tamarat, L. Hou, J.-B. Trebbia, A. Swarnkar, L. Biadala, Y. Louyer, M. I. Bodnarchuk, M. V. Kovalenko, J. Even, and B. Lounis, The dark exciton ground state promotes photon-pair emission in individual perovskite nanocrystals, Nature Communications 11, 6001 (2020).
- Wang et al. [2021] Z. Wang, A. Rasmita, G. Long, D. Chen, C. Zhang, O. G. Garcia, H. Cai, Q. Xiong, and W.-b. Gao, Optically driven giant superbunching from a single perovskite quantum dot, Advanced Optical Materials 9, 2100879 (2021).
- Rainò et al. [2018] G. Rainò, M. A. Becker, M. I. Bodnarchuk, R. F. Mahrt, M. V. Kovalenko, and T. Stöferle, Superfluorescence from lead halide perovskite quantum dot superlattices, Nature 563, 671 (2018).
- Purcell [1946] E. M. Purcell, Spontaneous emission probabilities at radio frequencies., Phys. Rev. 69, 10.1103/PhysRev.69.674.2 (1946).
- Birnbaum et al. [2005] K. M. Birnbaum, A. Boca, R. Miller, A. D. Boozer, T. E. Northup, and H. J. Kimble, Photon blockade in an optical cavity with one trapped atom, Nature 436, 87 (2005).
- Yang et al. [2017] Z. Yang, M. Pelton, M. I. Bodnarchuk, M. V. Kovalenko, and E. Waks, Spontaneous emission enhancement of colloidal perovskite nanocrystals by a photonic crystal cavity, Applied Physics Letters 111, 221104 (2017).
- Jun et al. [2024] S. Jun, J. Kim, M. Choi, B. S. Kim, J. Park, D. Kim, B. Shin, and Y.-H. Cho, Ultrafast and bright quantum emitters from the cavity-coupled single perovskite nanocrystals, ACS Nano 18, 1396 (2024).
- Purkayastha et al. [2024] P. Purkayastha, S. Gallagher, Y. Jiang, C.-M. Lee, G. Shen, D. Ginger, and E. Waks, Purcell enhanced emission and saturable absorption of cavity-coupled CsPbBr quantum dots, ACS Photonics 11, 1638 (2024).
- Jeantet et al. [2016] A. Jeantet, Y. Chassagneux, C. Raynaud, P. Roussignol, J. Lauret, B. Besga, J. Estève, J. Reichel, and C. Voisin, Widely Tunable Single-Photon Source from a Carbon Nanotube in the Purcell Regime, Physical Review Letters 116, 247402 (2016).
- Borel et al. [2023] A. Borel, T. Habrant-Claude, F. Rapisarda, J. Reichel, S. K. Doorn, C. Voisin, and Y. Chassagneux, Telecom Band Single-Photon Source Using a Grafted Carbon Nanotube Coupled to a Fiber Fabry-Perot Cavity in the Purcell Regime, ACS Photonics 10, 2839 (2023).
- Riedel et al. [2017] D. Riedel, I. Söllner, B. J. Shields, S. Starosielec, P. Appel, E. Neu, P. Maletinsky, and R. J. Warburton, Deterministic Enhancement of Coherent Photon Generation from a Nitrogen-Vacancy Center in Ultrapure Diamond, Physical Review X 7, 031040 (2017).
- Wang et al. [2019] D. Wang, H. Kelkar, D. Martin-Cano, D. Rattenbacher, A. Shkarin, T. Utikal, S. Götzinger, and V. Sandoghdar, Turning a molecule into a coherent two-level quantum system, Nature Physics 15, 483 (2019).
- Najer et al. [2019] D. Najer, I. Söllner, P. Sekatski, V. Dolique, M. C. Löbl, D. Riedel, R. Schott, S. Starosielec, S. R. Valentin, A. D. Wieck, N. Sangouard, A. Ludwig, and R. J. Warburton, A gated quantum dot strongly coupled to an optical microcavity, Nature 575, 622 (2019).
- Farrow et al. [2023] T. Farrow, A. R. Dhawan, A. R. Marshall, A. Ghorbal, W. Son, H. J. Snaith, J. M. Smith, and R. A. Taylor, Ultranarrow Line Width Room-Temperature Single-Photon Source from Perovskite Quantum Dot Embedded in Optical Microcavity, Nano Letters 23, 10667 (2023).
- Rainò et al. [2019] G. Rainò, A. Landuyt, F. Krieg, C. Bernasconi, S. T. Ochsenbein, D. N. Dirin, M. I. Bodnarchuk, and M. V. Kovalenko, Underestimated Effect of a Polymer Matrix on the Light Emission of Single CsPbBr Nanocrystals, Nano Letters 19, 3648 (2019).
- Amara et al. [2023] M.-R. Amara, Z. Said, C. Huo, A. Pierret, C. Voisin, W. Gao, Q. Xiong, and C. Diederichs, Spectral Fingerprint of Quantum Confinement in Single CsPbBr Nanocrystals, Nano Letters 23, 3607 (2023), publisher: American Chemical Society.
- Auffèves et al. [2010] A. Auffèves, D. Gerace, J.-M. Gérard, M. F. m. c. Santos, L. C. Andreani, and J.-P. Poizat, Controlling the dynamics of a coupled atom-cavity system by pure dephasing, Phys. Rev. B 81, 245419 (2010).
- Note [1] We note that the simple extraction of the dip for is far from the general trend. However, this discrepancy is less critical when considering the full theoretical analysis as shown in Figure 4b.
- Grange et al. [2015] T. Grange, G. Hornecker, D. Hunger, J.-P. Poizat, J.-M. Gérard, P. Senellart, and A. Auffèves, Cavity-Funneled Generation of Indistinguishable Single Photons from Strongly Dissipative Quantum Emitters, Physical Review Letters 114, 193601 (2015).
- Hunger et al. [2010] D. Hunger, T. Steinmetz, Y. Colombe, C. Deutsch, T. W. Hänsch, and J. Reichel, A fiber Fabry-Perot cavity with high finesse, New Journal of Physics 12, 065038 (2010).
Methods
Perovskite quantum dot synthesis and sample preparation
Cesium lead bromide (CsPbBr3) quantum dots were synthesized using a first-generation hot injection method as described by Protesescu et al. [1], which consists of two main steps: the preparation of Cs-oleate and its subsequent reaction with a bromide source. Cesium carbonate (Cs2CO3), octadecene (ODE) and oleic acid (OA) were introduced into a reaction flask. The mixture was dried at 120 for 1 hour and then heated to 150 under a nitrogen atmosphere until all the Cs2CO3 had reacted to form the Cs oleate precursor. ODE and lead bromide (PbBr2) were injected into a separate flask and dried under vacuum at 120 for 1 hour. Dried oleylamine (OLA) and OA were then added at 120 under nitrogen. When the PbBr2 was completely dissolved, the temperature was raised to 180 . At this point the Cs-oleate precursor solution was rapidly injected into the reaction mixture. After brief heating, the reaction mixture was rapidly cooled in an ice-water bath. The product was purified by a two-step centrifugation. The resulting CsPbBr3 quantum dots were re-dispersed in toluene to form long-term stable dispersion. The CsPbBr3 quantum dots can be stored for weeks to months if kept in a concentrated solution under inert atmosphere.
Sample preparation for single perovskite quantum dot studies
For single perovskite quantum dot spectroscopy studies, the synthesized solution was diluted approximately 1:10000 in toluene containing 3 by mass of polystyrene and spin-coated at 3000 rpm for 70 on a highly reflective planar dielectric mirror. After solvent evaporation, the resulting sample consists of highly dispersed and randomly oriented perovskite quantum dots with typical densities of 0.01 embedded in a 200 -thick polystyrene film.
Design of the tunable Fabry-Pérot fiber microcavity
The plano-concave Fabry-Pérot cavity consists of a large planar dielectric mirror and a concave fiber dielectric mirror, the shape of which has been micro-machined by CO2 laser ablation, resulting in a radius of curvature of about 10 [30]. Both the planar substrate and the fiber tip were coated by the company Laseroptik with precisely defined dielectric stacks of to ensure a high reflection coefficient at the emission wavelength of the CsPbBr3 quantum dots ( in the 475-585 range) and a high transmission of the excitation laser ( in the 430-455 range). This results in a high cavity finesse with a quality factor depending on the longitudinal order of the cavity mode. The lateral and longitudinal displacements of one mirror with respect to the other needed for spatial and spectral matching are obtained via nanopositioning systems (Attocube, ANPx51, ANPz51).
Low-temperature micro-photoluminescence spectroscopy
All optical measurements were performed at cryogenic temperatures using a closed-cycle liquid helium cryostat (Montana Instruments, Cryostation S50). The micro-photoluminescence spectroscopy experiments were performed with a home-built scanning confocal microscope as shown in Figure 1. Excitation was performed through the backside of the planar dielectric mirror on which the perovskite quantum dots are deposited by either a continuous wave laser diode (Thorlabs LP450-SF25) or a tunable femtosecond pulsed Ti:Sa laser (Spectra-Physics, Tsunami) frequency doubled with a BBO crystal to operate at 450 . The photoluminescence was collected by the movable 0.7 numerical aperture aspheric lens in free space configuration, and from the back of the planar mirror or the output port of the machined fiber in cavity configuration. The fiber used for the microcavity is inserted into this lens through a wide hole drilled at the lens center to switch between free space and cavity configurations by simple translation of the lens. Outside the cryostat, the photoluminescence was sorted from the excitation laser using a dichroic mirror (Thorlabs, DMLP505) and a long pass filter. It was then dispersed using a grating monochromator (Princeton Instruments HRS-500) and detected by a CCD camera (Teledyne Pixis 100) for spectral envelope studies (with a spectral resolution of 200 ). For time-resolved PL, a 35 resolution single photon avalanche detector (MPD) connected to a correlation acquisition card (Picoquant PicoHarp) was used to record the photon arrival times. The intensity auto-correlation measurements were performed using a Hanbury-Brown and Twiss setup where the photoluminescence from a single perovskite quantum dot was split by a 50/50 beam splitter and the two outputs were directed to two 35 resolution single photon avalanche detectors (MPD) connected to the correlation acquisition card.
Envelope dip value
The spectral envelope dip value is defined as , where and are the two maxima and is the central minimum (the three extrema values are obtained by a local second order polynomial fit). To correct for the effect of the different vibration amplitudes between the contact mode and other modes , the normalized dip value is multiplied by , where is the doublet splitting and is the vibration energy variance of the corresponding mode as derived from the white lamp cavity transmission.
Acknowledgments
This work was supported by the French National Research Agency (ANR) through the projects IPER-Nano2 (ANR-18-CE30-0023) and DELICACY (ANR-22-CE47-0001). The authors thank Pascal Morfin, Arnaud Leclercq, and the LPENS mechanical workshop for their assistance in designing and fabricating mechanical components. We also thank Aurélie Pierret for her help with the chemical synthesis setup at LPENS and Torben Pöpplau for assistance with fiber micromachining at LKB. Finally, we thank Gabriel Hétet and Emmanuel Baudin for fruitful discussions.
Author contributions
Z.S. and M.R.A. synthesized the pQDs and performed single pQD spectroscopy. Z.S. and A.B. designed and implemented the microcavity setup under the supervision of C.D., C.V., Y.C. and J.R. The cQED experiments were performed by Z.S. and M.C.T. under the supervision of C.D. and Y.C. The model was developed by Y.C. with the input of all co-authors. The paper was written by C.D., Y.C., C.V., Z.S. and M.C.T. with the contribution of all co-authors. C.D. and Y.C. conceived the project and supervised the work. All authors discussed the results and commented on the paper.
Competing interests
The authors declare no competing interests.