Predicting Mode-I/II fracture toughness and crack growth in diboride ceramics via machine-learning potentials
Abstract
Fracture toughness and strength are critical for structural ceramics, which are prone to brittle failure. However, accurately characterizing these properties is challenging, especially for thin films on substrates. In-situ microscopy often fails to resolve crack initiation, while fractured samples provide limited insight into fracture modes and crack paths. Here, we employ stress intensity factor () controlled atomistic simulations of fracture to characterize the crack-initiation properties of hard but brittle diboride ceramics. Our molecular statics calculations are based on moment-tensor machine-learning interatomic potentials (MLIPs) trained on ab initio information collected for a variety of atomistic environments. TMB2 (TMTi, Zr, Hf) lattice models with six distinct atomically-sharp crack geometries subjected to Mode-I (opening) and/or Mode-II (sliding) deformation serve as platforms to illustrate the capability of the approach. The Mode-I initiation toughness and fracture strength —within ranges 1.8-2.9 MPa and 1.6-2.4 GPa—are extrapolated at the macroscale limit by fitting the results of finite (up to 106 atoms) cracked plate models with constitutive scaling relations. Our simulations show that most diboride lattice models fail by extension of the native crack. However, crack-deflection on the plane is observed for the crystal geometry. As exemplified by TiB2, varying Mode-I/II loading ratios have little influence on crack propagation paths, which overall occurs by decohesion of low-energy fracture planes or combined sliding. Our predictions are supported by cube-corner nanoindentation on TiB2 samples along the [0001] direction, revealing the same fracture plane as observed in simulations and a of 3.1 MPa. Our work demonstrates the possibility of predicting orientation-dependent fracture behaviors in hard ceramics, highlighting the effectiveness of machine-learning-potential simulations.
Keywords: Transition metal diborides; Machine-Learning interatomic potentials; Fracture toughness; Molecular statics
Introduction
Fracture mechanics roots in Griffith’s pioneering work during the 1920s [1]. Griffith understood that strong but brittle solids, such as glass, break at stress levels much lower than their theoretical strength due to microstructural imperfections which, acting as stress concentrators, cause fracture initiation. His investigations led to the conclusion that the extension of native cracks occurs if the elastic-strain energy released during crack-growth exceeds the formation energy of new crack surfaces. Thirty years later, Irwin [2] broadened the energy-balance approach proposed by Griffith to account for dissipative non-linear responses (e.g., plastic deformation in metals). Irwin also introduced the concept of the stress intensity factor, , quantifying the stress state near the crack tip. Furthermore, he categorized fracture modes into three distinct types—Mode-I (opening), Mode-II (sliding), and Mode-III (tearing)—where the conditions for crack propagation are dictated by critical values , , and .
The critical stress intensity factor is recognized as the most practically significant. The term is often referred to as the material’s fracture toughness, as fracture in solids generally initiates at structural flaws under tension. The is a property measured through standardized tests (see, e.g., Refs. [3, 4, 5, 6, 7]), which involve introducing a crack into a sample and applying a controlled load or displacement to determine the conditions leading to fracture. In general, the reproducibility of measured values strongly depends on the sample’s structural features and density of crystallographic defects [8, 9, 10, 11, 12, 13, 14]. Additionally, traditional fracture toughness tests cannot resolve nanoscale processes responsible for fracture initiation. The limitations of experimental techniques become even more evident when it comes to studying thin-film samples, due to the small sizes involved and substrate effects [15]. Hence, fundamental understanding and characterization of materials’ fracture would necessitate complementing mechanical testing and/or state-of-the-art in-situ imaging [16, 17] with atomistic simulations of crack behavior during loading.
Machine-learning interatomic potentials (MLIPs) can offer detailed atomic-scale understanding of materials’ fracture initiation and accurate evaluation of fracture properties. Although the reliability and quality of MLIP-based simulations is dependent on the underlying ab initio training set [18, 19, 20, 21, 22], MLIPs are systematically improvable force fields [23, 24] [25, 26, 27] that can achieve accuracy rivaling that of density functional theory (DFT) calculations but with up to 105 times higher computational efficiency. We have recently proposed an MLIP training workflow and a validation standard [28] to reproduce the elastic and plastic properties of bulk ceramic lattices (free of extended crystallographic defects in the unstrained state) predicted by ab initio molecular dynamics (MD). Our MLIP-based MD simulations allowed investigating the variations of theoretical strength values as a function of the supercell size and the anisotropy of lattice slip and fracture processes during tensile and shear elongation at room as well as elevated temperatures. The training and validation strategy presented in Refs. [28, 29, 30] lay the foundations to this work.
Here we use MLIPs in -controlled atomistic simulations of fracture to investigate the properties of Group-IV transition-metal diborides, TMB2:s (TMTi, Zr, Hf). As most ceramics, TMB2:s are prone to crack without yielding, but exhibit ultra-high thermal stability [31], exceptionally high hardness [32], corrosion resistance, and excellent thermal and electrical conductivity [33]. Unlike other hard ceramic protective coatings (e.g. nitrides and carbides, for which the fracture properties have been characterized relatively thoroughly [34, 35, 36, 37, 38, 39] , information on the toughness and strength available in the literature for TMB2:s is sparse [40, 41, 42]. An experimental characterization of the fracture resistance of diboride films is further complicated by largely varying degrees of TMB stoichiometry which, together with a typically high density of crystallographic defects [43, 44], constitutes an additional hurdle to understanding the structure/property relationship in this class of materials [45]. The limitations of the experiments provide further motivation to use MLIPs to determine the crack behavior in diboride systems.
Results and discussion
1 MLIP validation and theoretical strengths of defect-free crystals
| TMB2 | LC (Å) | Elastic constants (GPa) | Surface energy (J/m2) | Reference | ||||||||||
| 3.027 | 3.213 | 654 | 464 | 259 | 76 | 115 | 580 | 263 | 256 | 3.80 | 3.98 | 3.42 | This work (DFT) | |
| 3.030 | 3.204 | 636 | 441 | 272 | 61 | 92 | 576 | 242 | 261 | 3.80 | 4.12 | 3.57 | This work (ML-MS) | |
| TiB2 | 3.029 | 3.219 | 656 | 461 | 259 | 65 | 98 | 582I | 253I | 261I | / | / | / | Ref. [46] |
| / | / | 660 | 464 | 255 | 60 | 96 | 583I | 250 | 258 | 4.20II | 4.10II | / | Ref. [47] | |
| 3.029 | 3.219 | / | / | / | / | / | / | / | / | 4.21 | 4.19 | / | Ref. [48] | |
| 3.180 | 3.545 | 539 | 422 | 270 | 52 | 109 | 523 | 226 | 235 | 3.86 | 4.54 | 3.83 | This work (DFT) | |
| 3.167 | 3.531 | 551 | 427 | 248 | 54 | 118 | 517 | 234 | 228 | 3.61 | 4.38 | 3.57 | This work (ML-MS) | |
| ZrB2 | 3.168 | 3.536 | 555 | 436 | 254 | 62 | 119 | 524 | 238 | 231 | / | / | / | Ref. [46] |
| / | / | 539 | 420 | 238 | 60 | 116 | 502I | 231 | 218 | 3.85II | 4.45II | / | Ref. [47] | |
| 3.168 | 3.536 | / | / | / | / | / | / | / | / | 3.91 | 4.33 | / | Ref. [49] | |
| 3.149 | 3.480 | 602 | 432 | 309 | 57 | 105 | 580 | 238 | 266 | 3.88 | 4.53 | 4.07 | This work (DFT) | |
| 3.127 | 3.473 | 604 | 473 | 271 | 70 | 137 | 565 | 263 | 248 | 3.53 | 4.51 | 3.83 | This work (ML-MS) | |
| HfB2 | 3.165 | 3.512 | 584 | 457 | 257 | 98 | 135 | 544 | 253 | 238 | / | / | / | Ref. [46] |
| / | / | 588 | 448 | 248 | 89 | 138 | 533I | 260 | 227 | 3.80II | 4.35II | / | Ref. [47] | |
| 3.163 | 3.515 | 602 | 452 | 258 | 78 | 137 | 550 | 260 | 239 | / | / | / | Ref. [50] | |
I: Calculated based on the reference data.
II: Approximate value read from the presented figures.
The moment tensor potential (MTP) framework [27] is employed to train machine-learning interatomic potentials (MLIPs) for the Group-IV transition metal diborides (TiB2, ZrB2, HfB2; all crystallizing in the /AlB2-type phase [51]), using datasets from ab initio MD simulations. Training and validation errors, quantified by the residual mean square error (RMSE), remain below 8 meV/atom for energies, 0.24 eV/Å for forces, and 0.6 GPa for stresses, as detailed in the Supplementary Material. Prior to simulations on defective diboride crystals under loading, the reliability of the here-developed MLIPs is showcased by the comparison with DFT-calculated properties as well as with room-temperature ab initio MD tensile tests.
Tab. 1 presents the results obtained by MLIP-based molecular statics simulations in the context with own reference DFT calculations as well as DFT data from other studies. Although trained mainly on finite-temperature ab initio MD snapshots, our MLIPs reproduce 0 K ab initio lattice parameters (, ), elastic constants (), and surface energies () satisfactorily well. Note that DFT and ab initio MD calculations of this work are carried out using the same accuracy parameters (see the Methods). The deviations in lattice parameters are below 0.7%, while the , , and elastic constants, as well as the polycrystalline bulk (), shear () and Young’s moduli () differ by less than 10% from the corresponding DFT values. For , , elastic constants, the deviations are generally below 20%. The differences between ab initio and MLIP-calculated surface energies are lower than 6.5%. Our results are also consistent with those from other DFT studies.
In our previous work [28, 29], we have thoroughly tested the reliability of TiB2-MLIP against finite-temperature ab initio MD tensile and shear simulations, considering loading geometries characterized by low-index crystallographic directions and planes. Furthermore, transferability to tensile and shear tests beyond DFT length scales has been shown for initially defect-free single crystal TiB2 using the concept of extrapolation grade. As the MLIPs for HfB2 and ZrB2 in this work were trained using the same strategy, we do not repeat all validation steps (please see the Supplementary Material). Overall, the results obtained with our force fields closely match those of the underlying ab initio MD training configurations describing mechanical response within the elastic regime until fracture.
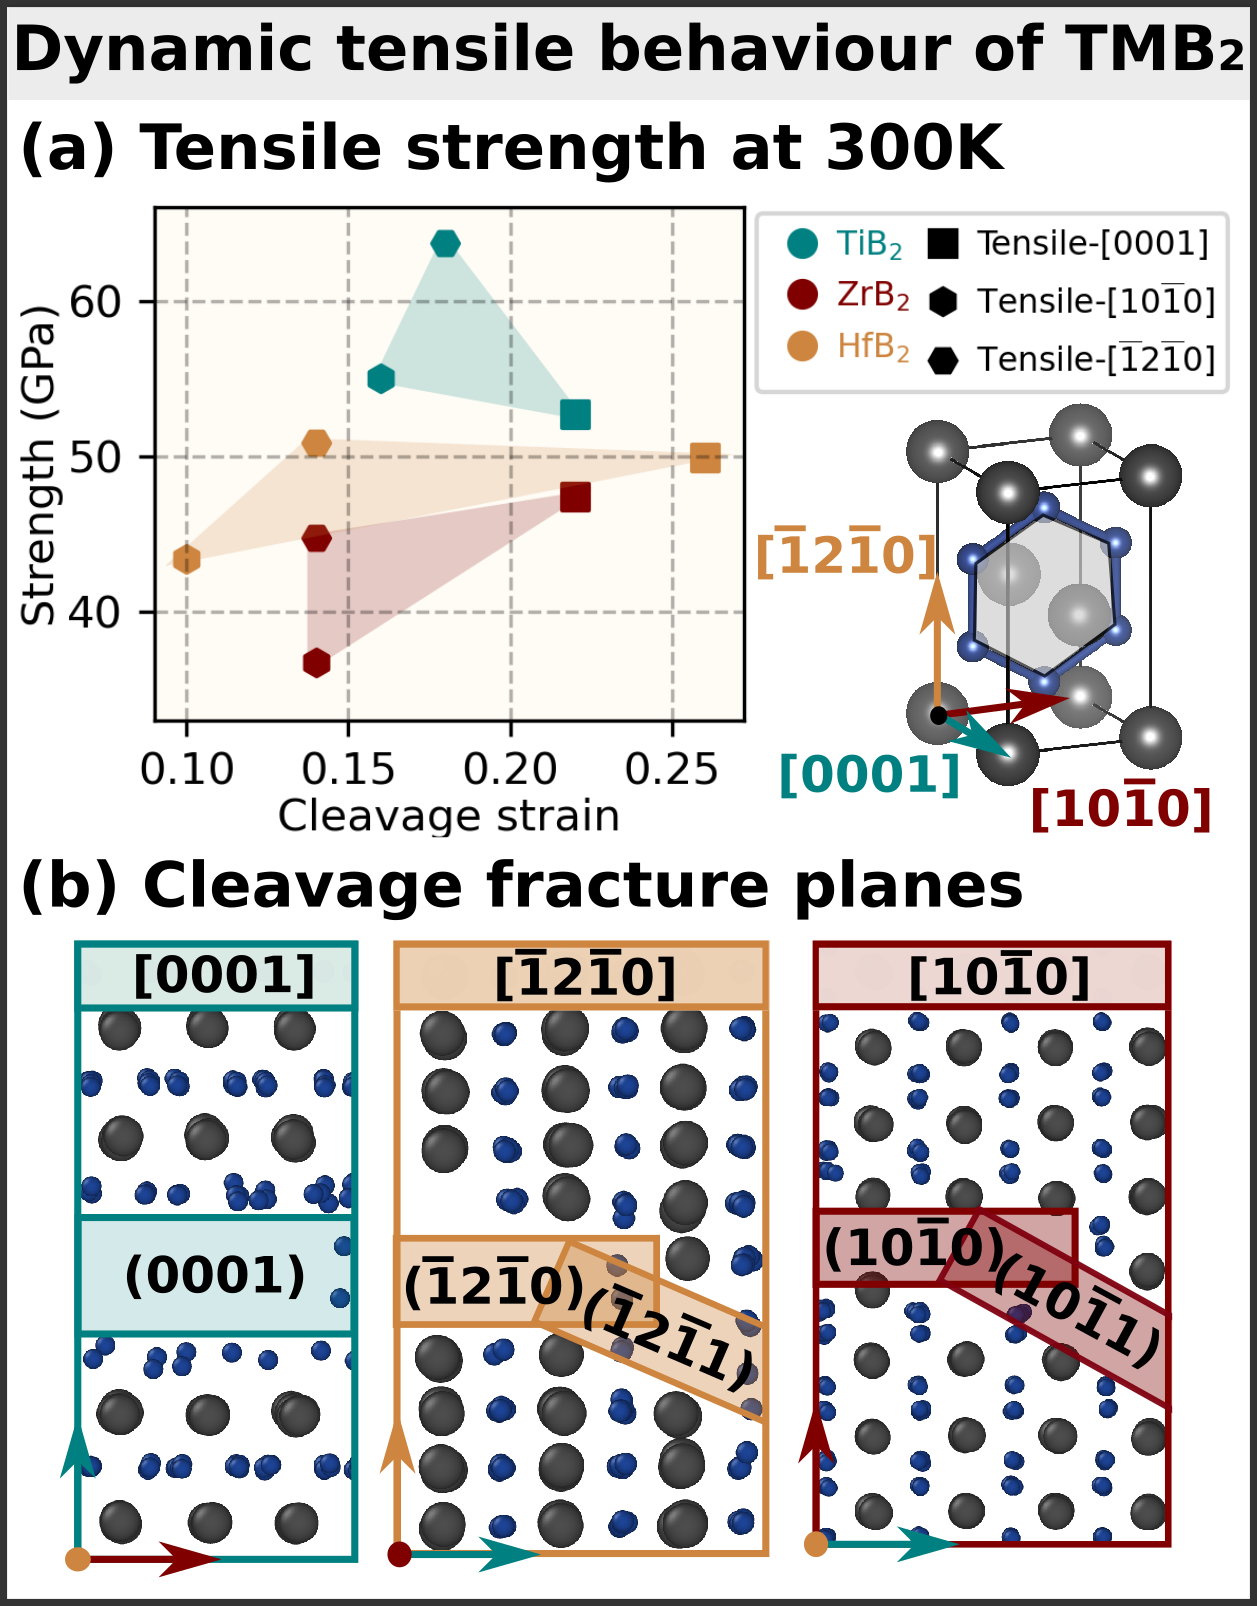
Fig. 1 depicts the theoretical tensile strength and the corresponding fracture strain subject to uniaxial tensile strain along the [0001], [100], [20] direction, respectively, allowing to asses the degree of anisotropy in response to elongation. Irrespective of the loading direction, TiB2 is the strongest among the studied systems, followed by HfB2 and ZrB2 (Fig. 1-(b)). All three materials sustain the largest strain along the [0001] direction. According to Fig. 1-(b), the three simulated loading scenarios lead to brittle cleavage along the basal, prismatic, or pyramidal planes, consistently for TMTi, Zr, Hf, i.e., the failure mechanisms remain independent of the TM. For instance, the [0001] tensile loading causes a fracture along the (0001) plane for TiB2, ZrB2, as well as HfB2, only the maximum stress withstood by each diboride is different.
2 Cracked-plate lattice models for simulations of fracture
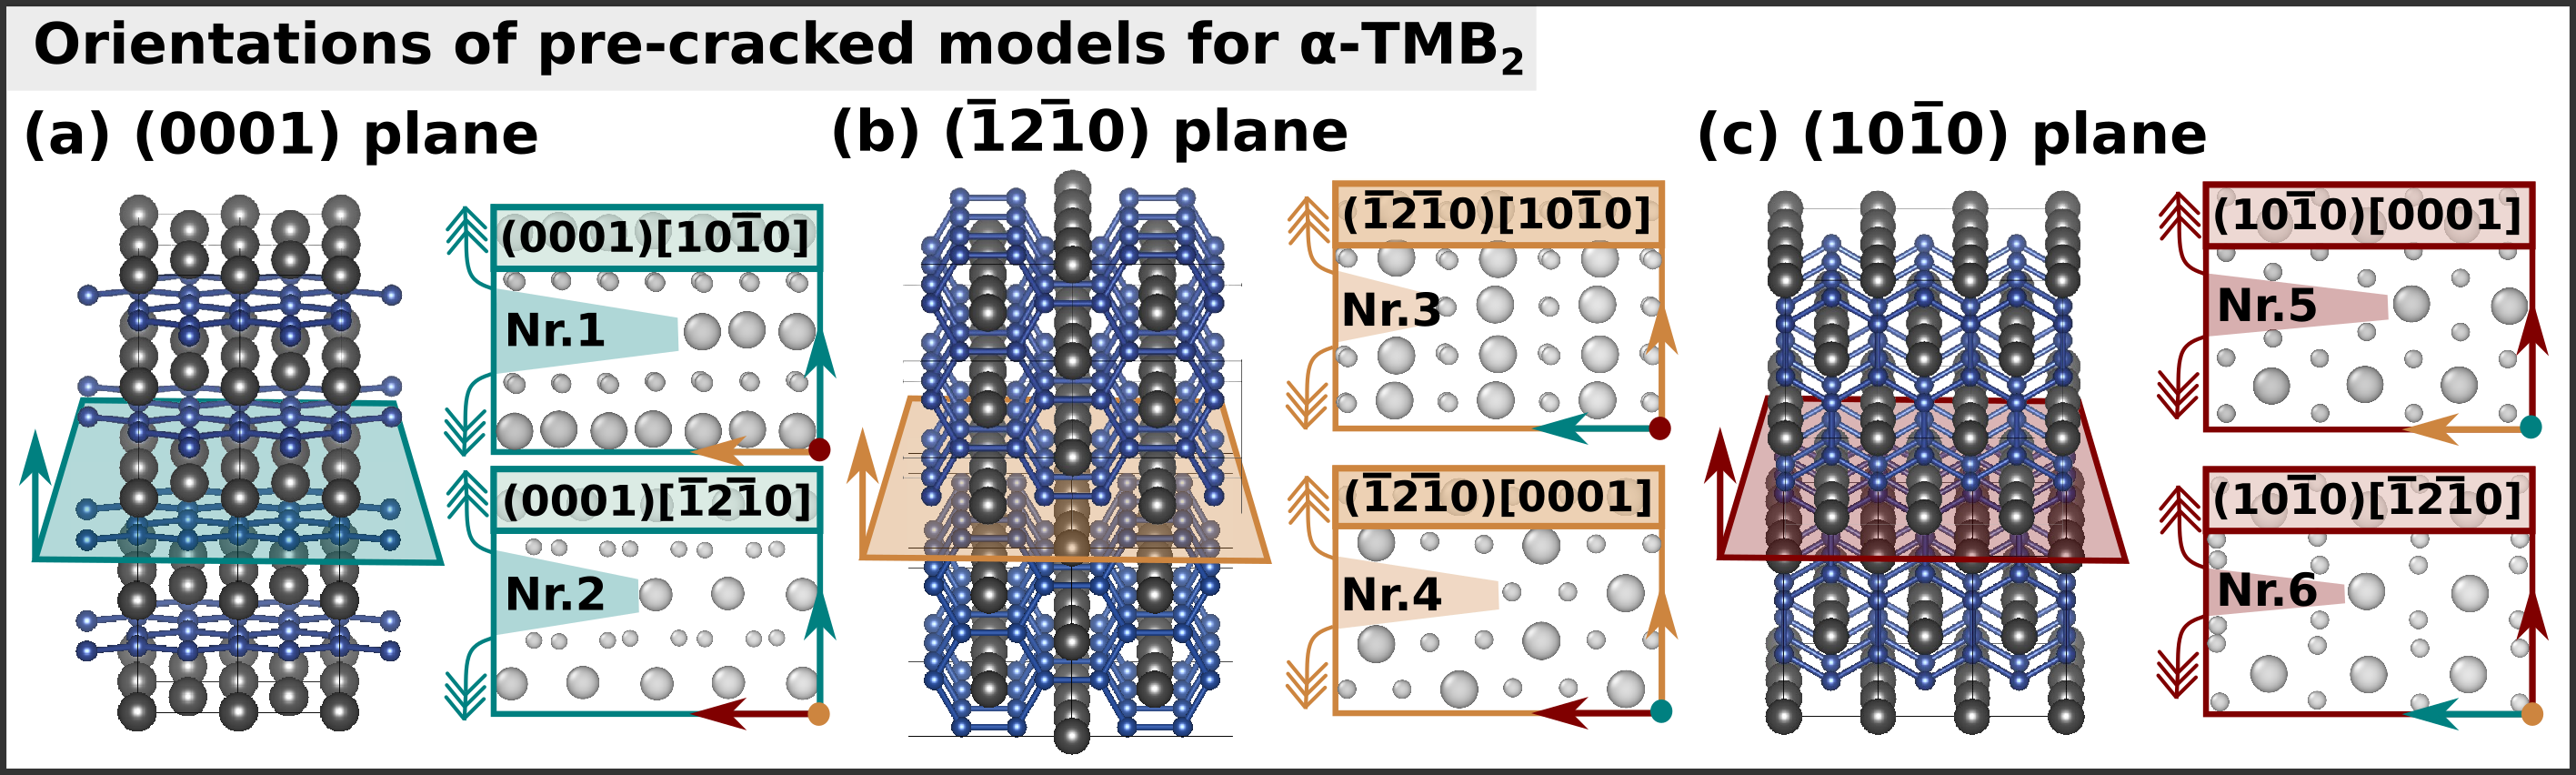
The mechanical properties of diborides are calculated by -controlled loading of plate lattice models containing an atomically sharp crack. The fracture-initiation strength and fracture-initiation toughness are obtained at the value for which the crack tip has advanced by two percent of the model width. The calculations are repeated as a function of the plate area, so that the fracture initiation toughness and fracture initiation strength can be extrapolated at the macroscale limit by constitutive scaling relations, as done in Ref. [52]. Below, the crack plane and crack line of a supercell are indicated as ()[’’’’], where , , , and and their primes are crystallographic indexes of a hexagonal lattice.
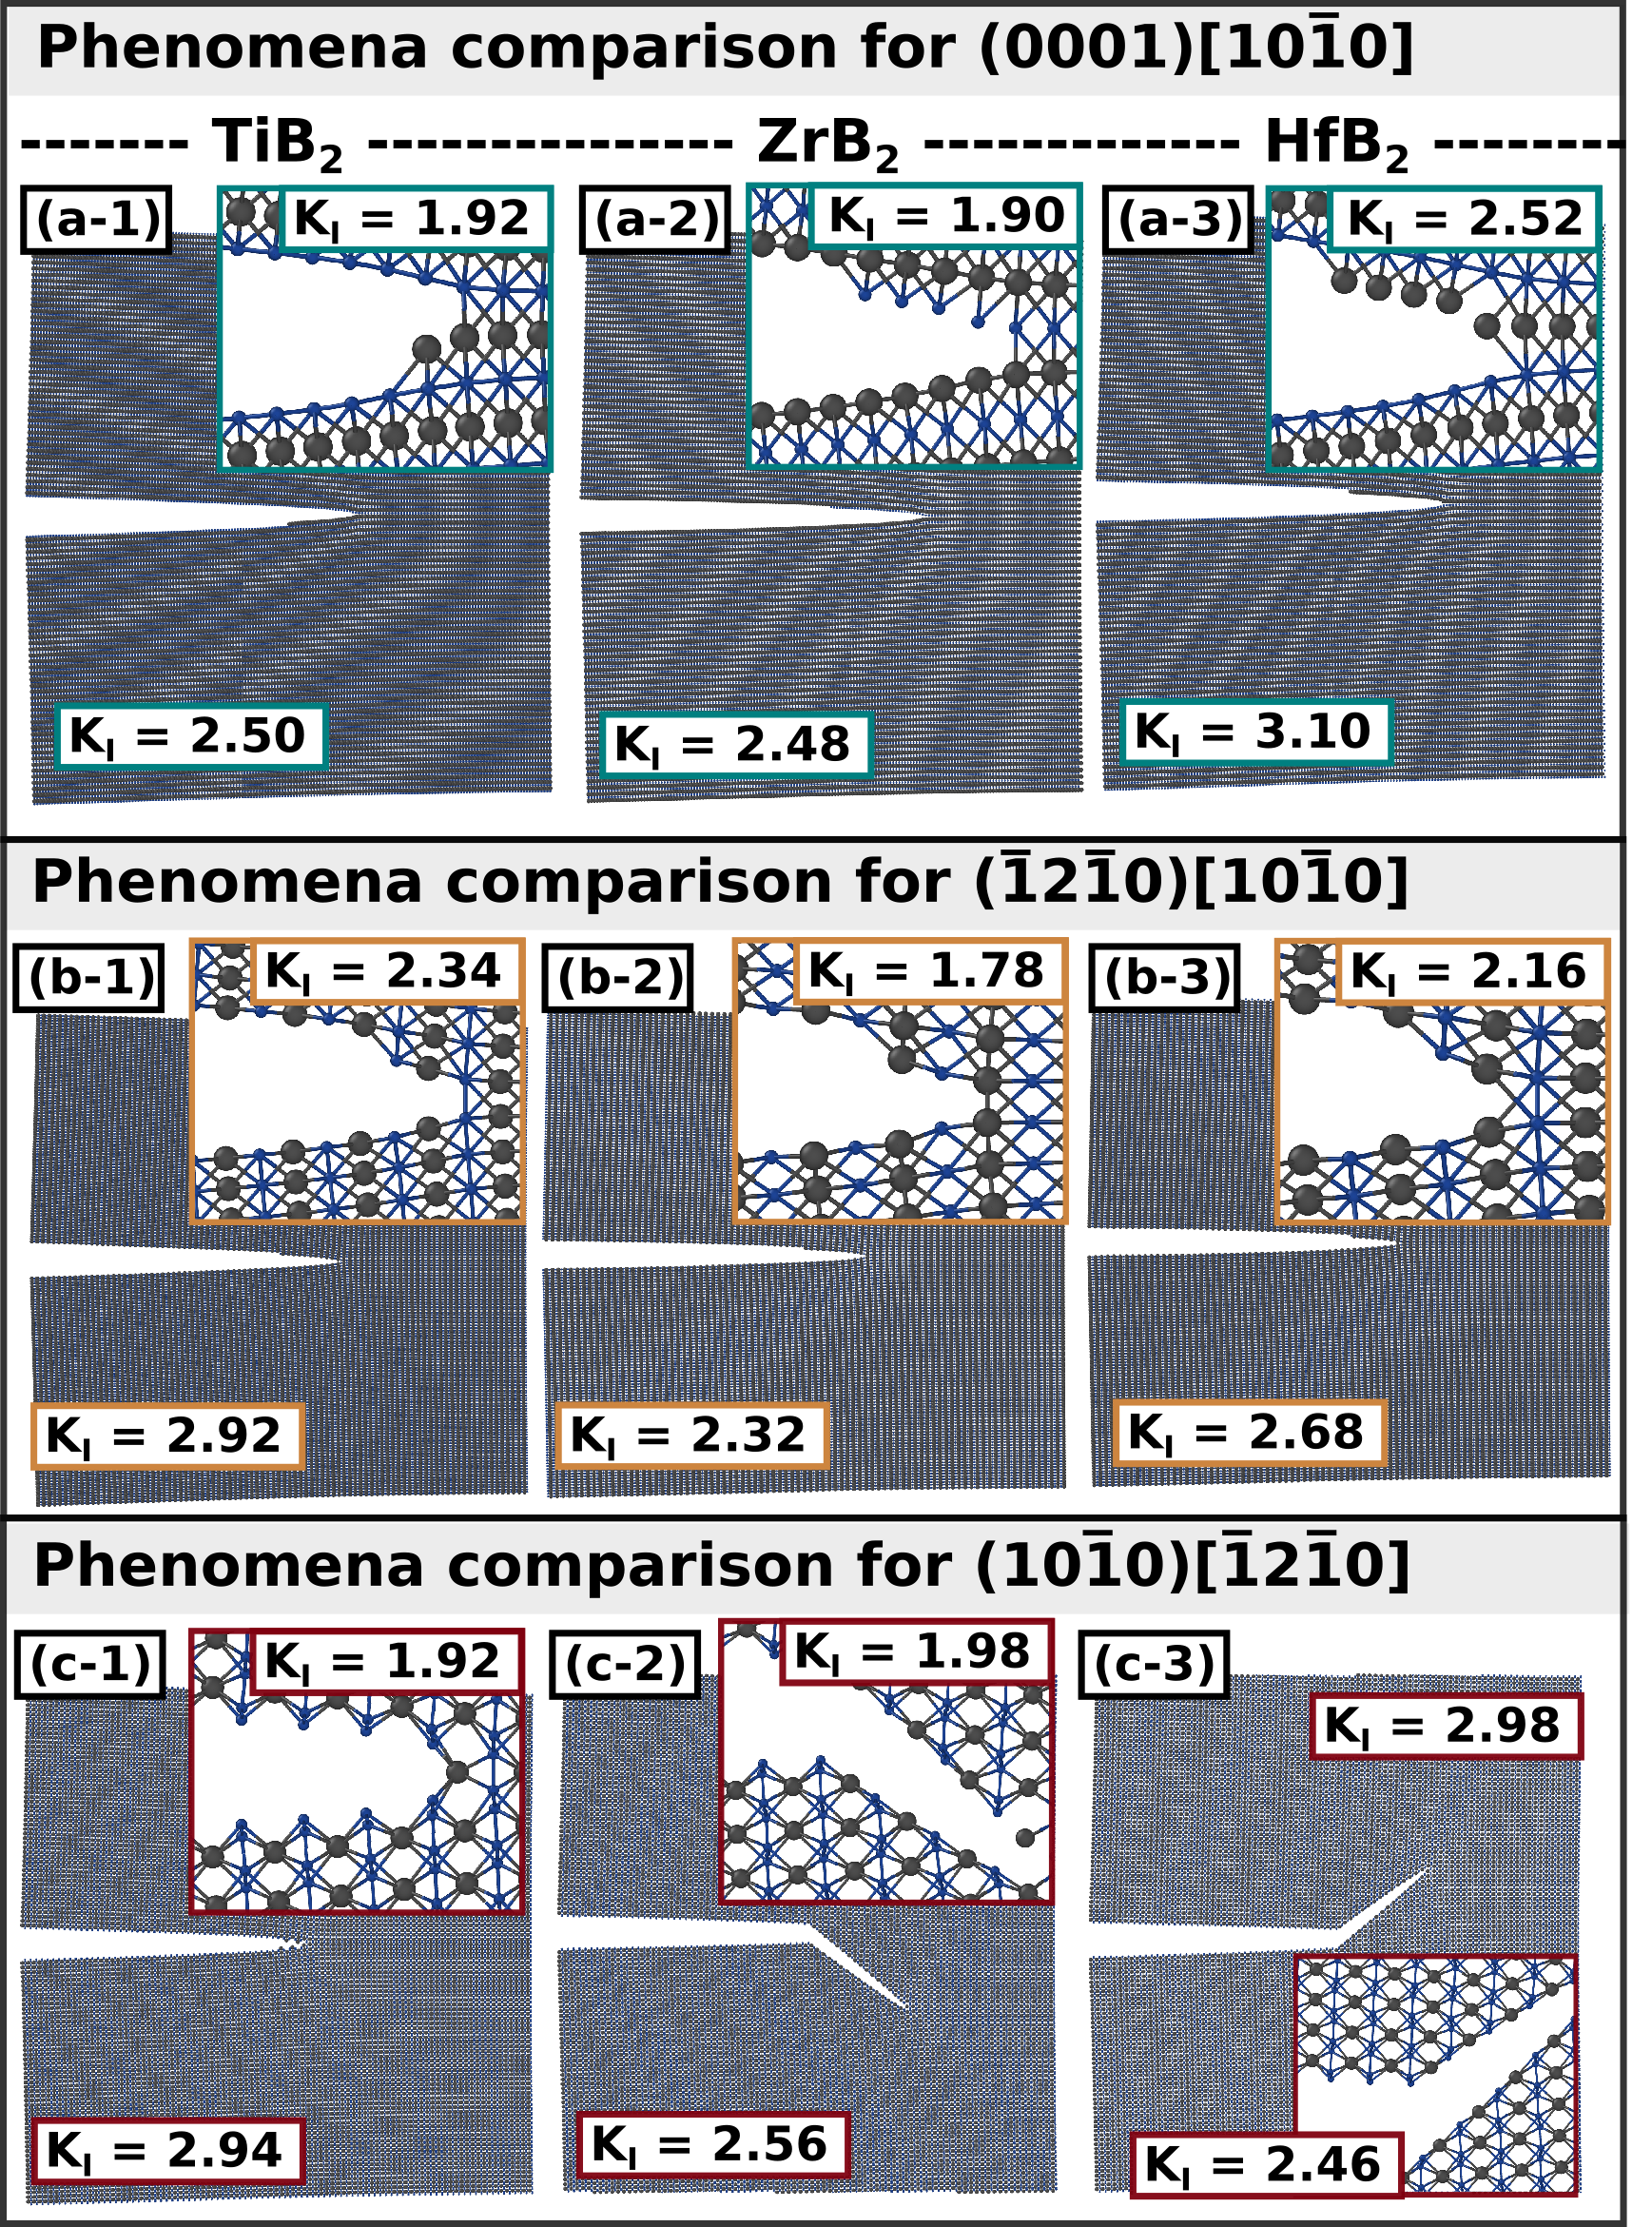
Fig. 2 illustrates six crack geometries characterized by low-index planes and crack-line directions for hexagonal -structured TMB2:s. Among them, the orientations - and - have the crack plane orthogonal to the [0001] axis. Thus, simulation results of fracture properties obtained for model and in Fig. 2 are of the highest relevance for comparison with experimental testing: since the [0001] is the typical growth direction of TMB2 thin-film coatings, experimental toughness measurements induce crack formation normal to the (0001) plane.
3 Mode-I loading (crack opening): comparison of different TMB2:s
| Geometry | TiB2 | ZrB2 | HfB2 | ||||||
|---|---|---|---|---|---|---|---|---|---|
| K (MPa) | K (MPa) | (GPa) | K (MPa) | K (MPa) | (GPa) | K (MPa) | K (MPa) | (GPa) | |
| () | 1.81 0.03 | 2.02 | 2.00 0.77 | 2.03 0.04 | 1.86 | 1.83 0.65 | 2.75 0.02 | 1.93 | 2.02 0.64 |
| () | 2.35 0.03 | 2.20 | 1.97 0.49 | 2.08 0.02 | 1.98 | 1.89 0.22 | 2.89 0.02 | 2.05 | 2.04 0.31 |
| : 4.02 (J/m2) | : 3.68 (J/m2) | : 3.61 (J/m2) | |||||||
| () | 2.24 0.02 | 2.37 | 2.24 0.63 | 1.74 0.02 | 2.18 | 2.21 0.68 | 2.01 0.02 | 2.20 | 2.27 0.61 |
| () | 1.88 0.02 | 2.29 | 2.22 0.67 | 1.84 0.02 | 2.15 | 1.75 0.29 | 2.25 0.05 | 2.18 | 1.61 0.54 |
| : 4.36 (J/m2) | : 4.33 (J/m2) | : 4.07 (J/m2) | |||||||
| () | 2.25 0.02 | 2.24 | 2.26 0.69 | 1.74 0.02 | 2.04 | 2.21 0.68 | 2.74 0.03 | 2.22 | 2.36 0.47 |
| () | 2.24 0.02 | 2.16 | 1.97 0.60 | 1.93 0.02 | 2.01 | 2.11 0.33 | 2.25 0.02 | 2.20 | 2.26 0.34 |
| : 3.88 (J/m2) | : 3.81 (J/m2) | : 4.15 (J/m2) | |||||||
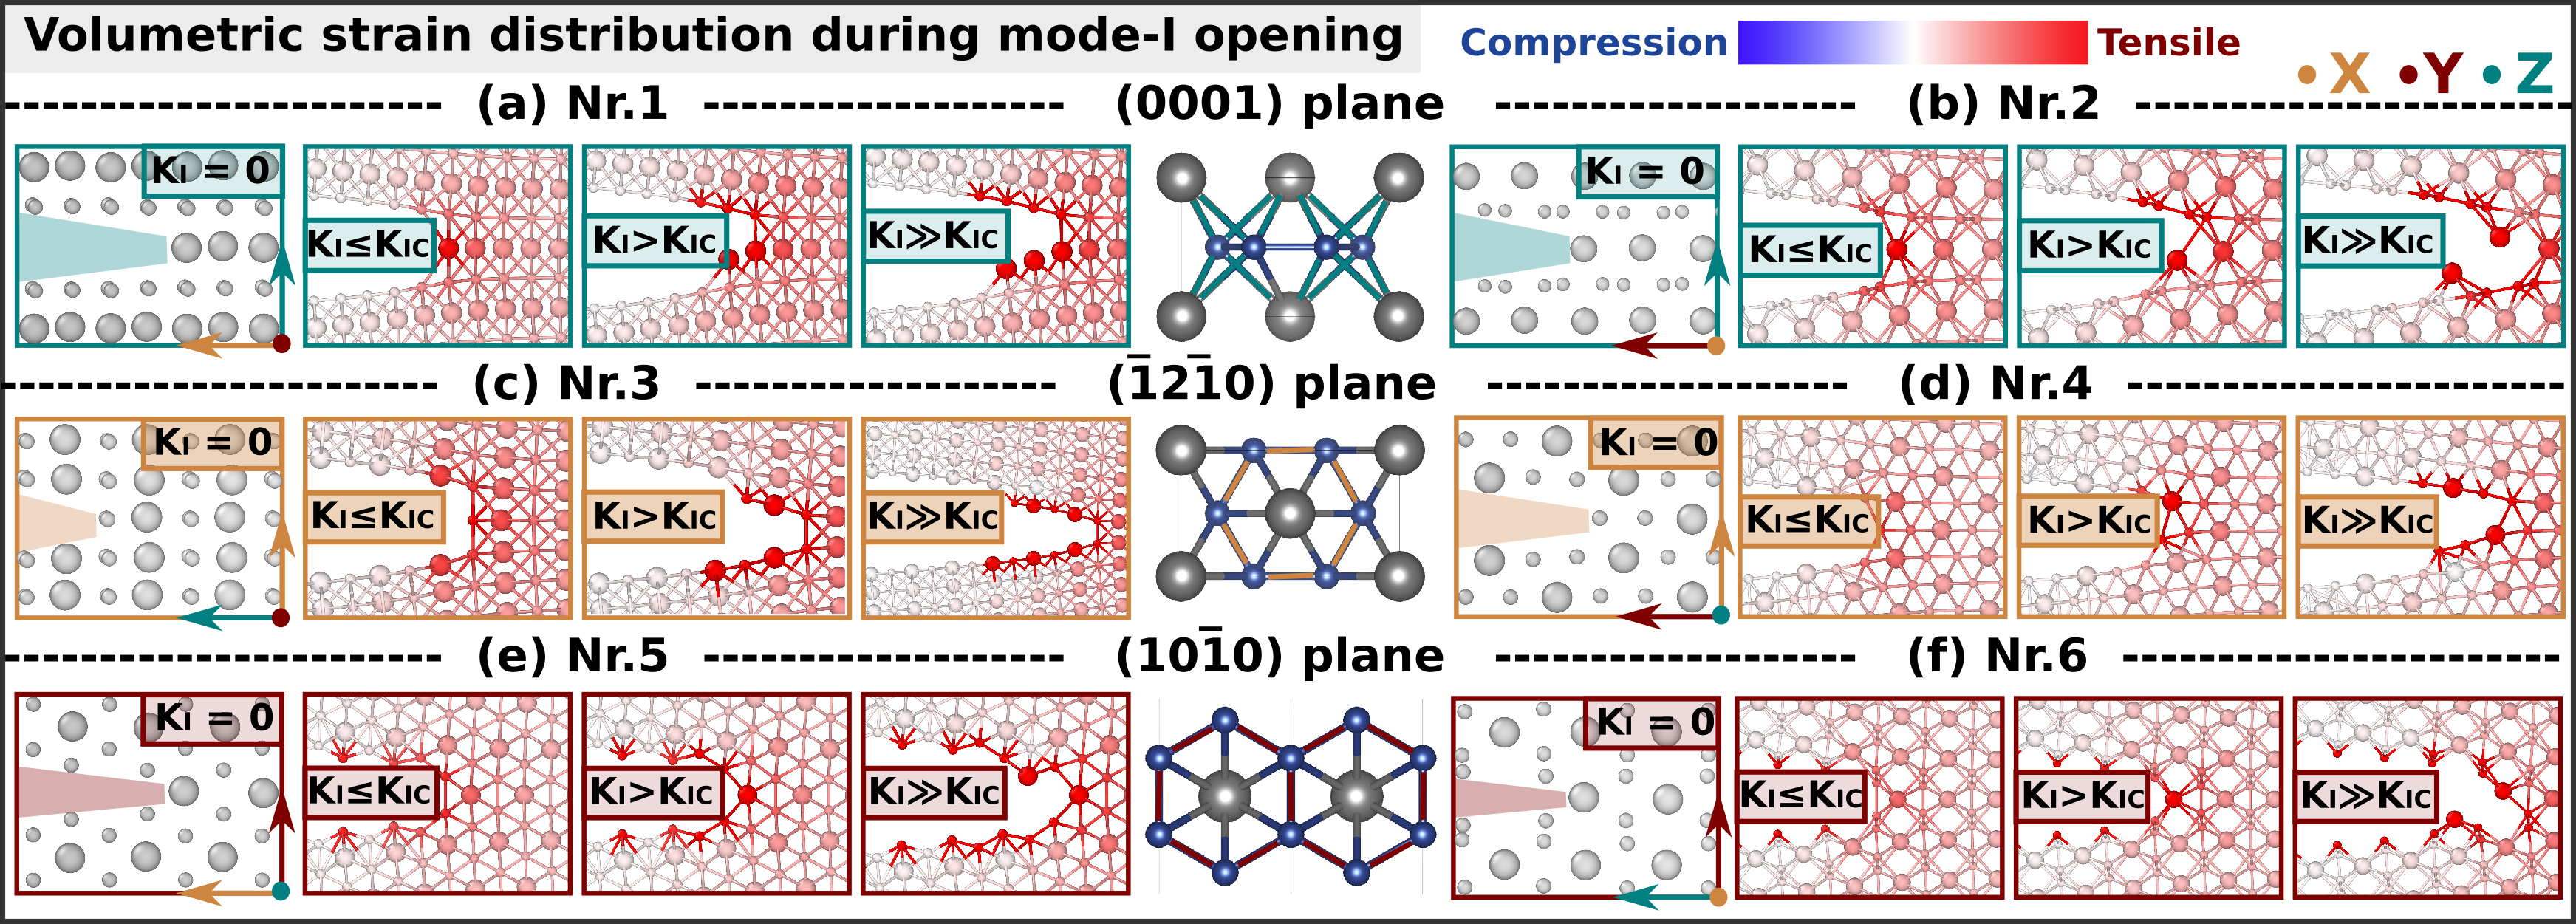
In -controlled simulations, the stress-intensity factor is incremented sequentially to identify stress conditions corresponding to the onset of crack growth. The bond-breaking behavior at different stages of pure Mode-I loading—simulated by ML-MS using our MLIPs—are shown in Fig. 3, depicting TMB2 models with crack-plane and crack-line directions defined in Fig. 2. Specifically, we visualize the atomic configuration before, immediately after, and far beyond has reached the critical value, .
For geometries based on the plane (Fig. 2-(a)), the B–TM bonds consistently break first, while for those based on the (Fig. 2-(b)) and (Fig. 2-(c)) planes, the B–B bonds are the first to break. During the Mode-I opening process, as increases (), stress becomes increasingly concentrated at the atom located at the crack tip. Upon reaching , the corresponding bond breaks. Typically, only one bond breaks at this stage, but simultaneous breaking of multiple bonds is also possible, as observed in (Fig. 3-(c)). Beyond this point, as increases further (), the crack propagates in a certain direction, typically along the crack plane (: Fig. 3-(a); : Fig. 3-(c); : Fig. 3-(d)). The crack propagation, however, may be more complicated, e.g., following a zigzag pattern (: Fig. 3-(b); : Fig. 3-(e)), or growing diagonally across the lattice (.: Fig. 3-(f)). The detailed mechanisms underlying these propagation behaviors will be analyzed below.
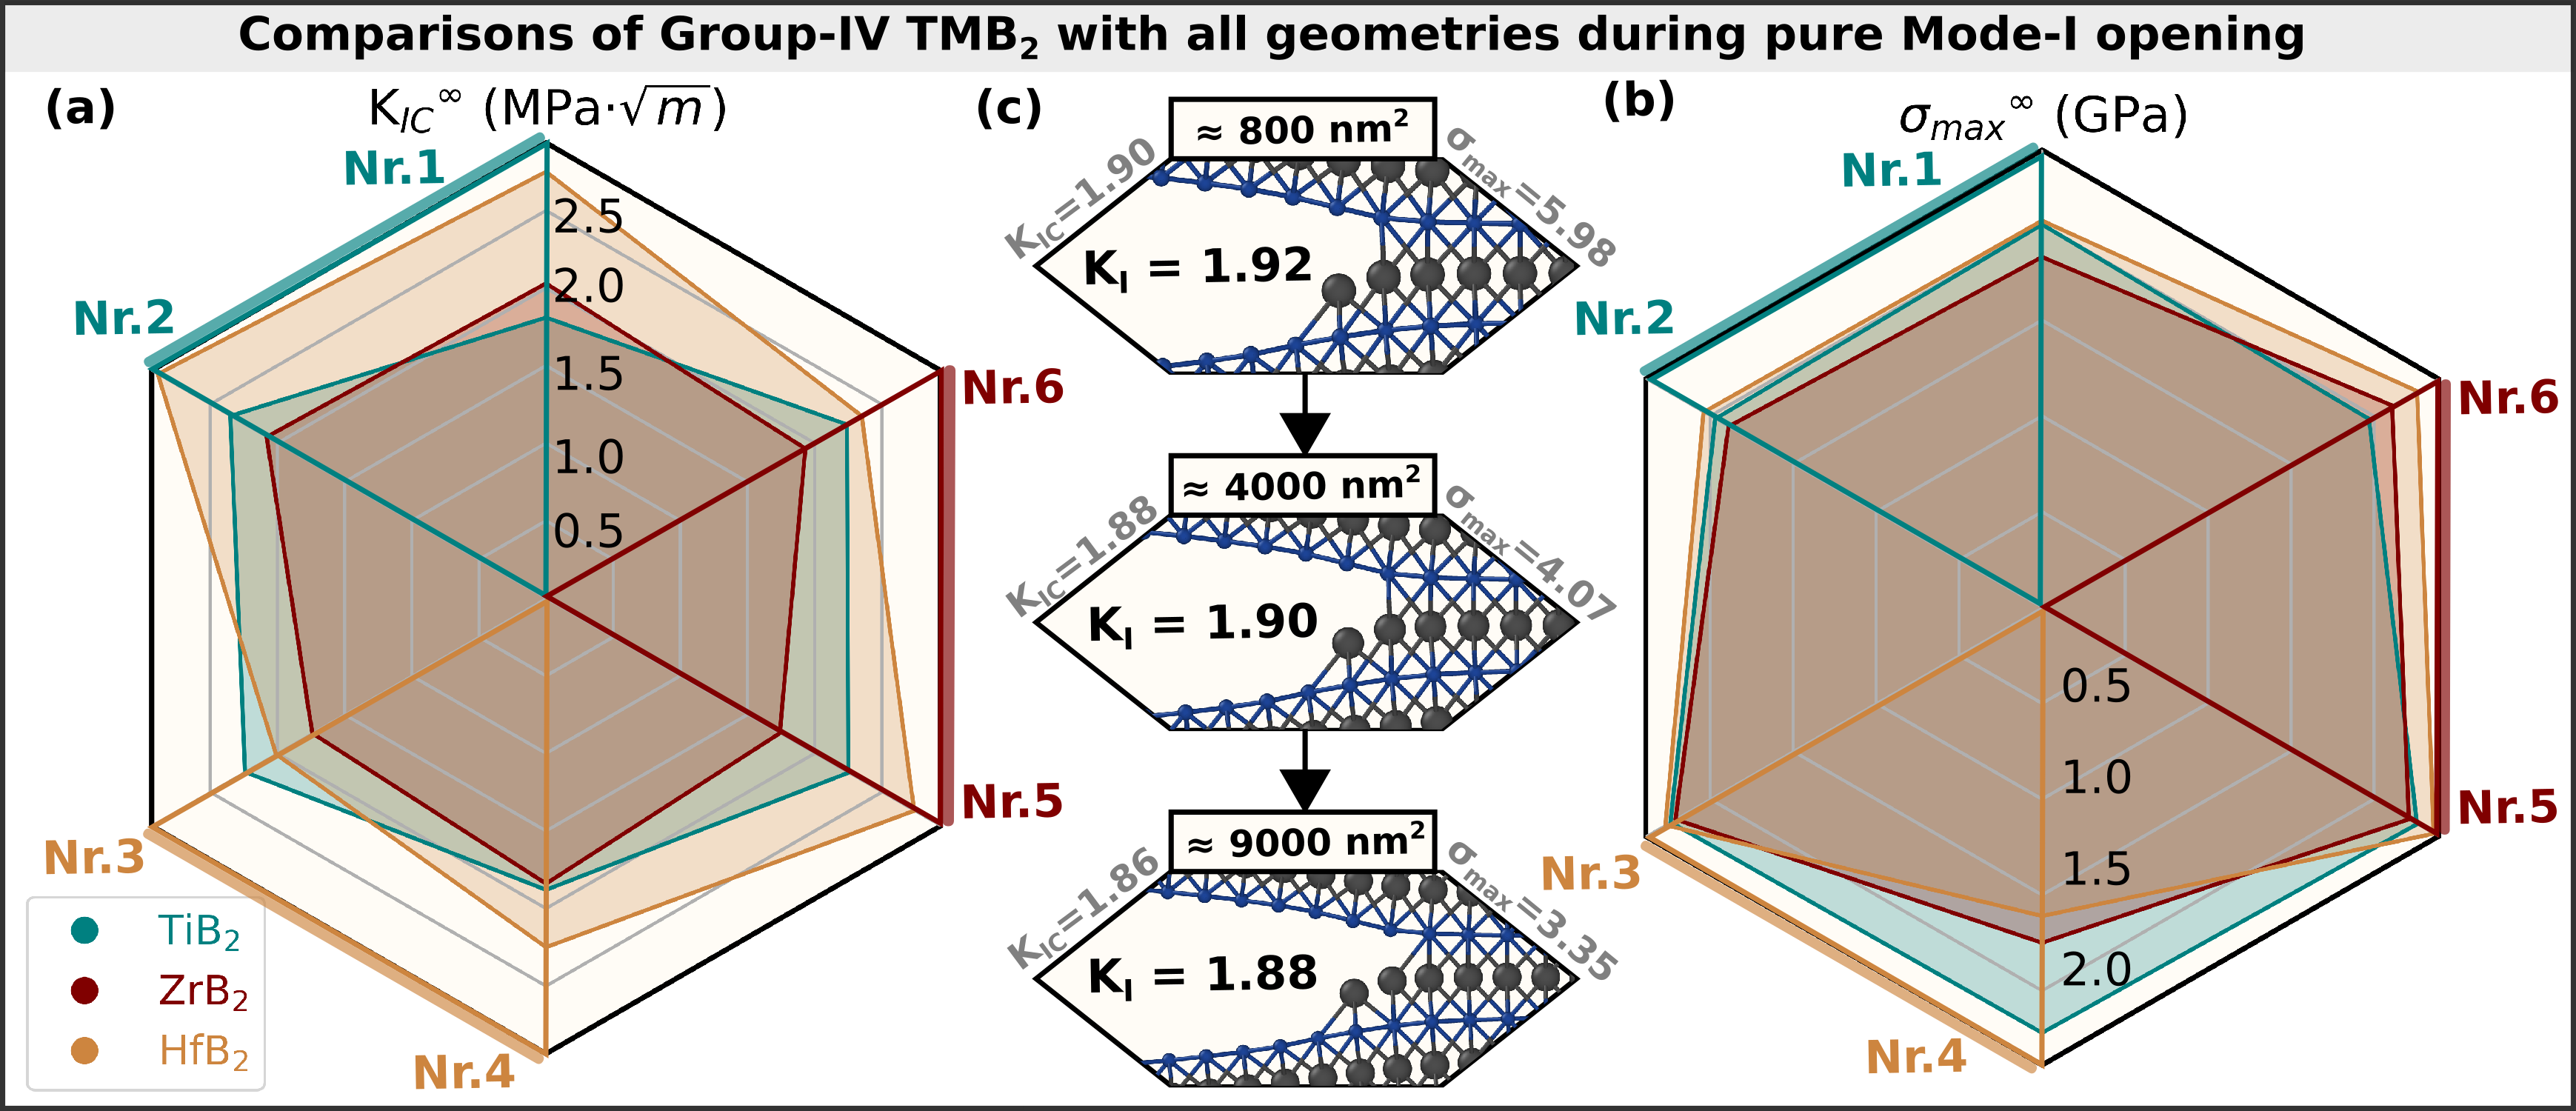
Fig. 4 compares (Fig. 4-(a)) and (Fig. 4-(b)) for the Group-IV TMB2:s, derived as extrapolative values for an infinite plate area. Following Ref. [53], the data is fitted using a combined inverse polynomial function against the plate area () [52], as further detailed in the supplementary material. Overall, HfB2 exhibits the highest (mainly 2.8 MPa), except for (TiB2 is the highest with 2.24 MPa, whereas HfB2 has 2.01 MPa), while ZrB2 shows the lowest (mainly 1.8 MPa), except for (TiB2 is the lowest with 1.81 MPa, whereas ZrB2 has 2.03 MPa). In terms of , the three materials display similar values (mainly 2.0 GPa), with the notable exception of , where TiB2 demonstrates significantly higher values (TiB2 remains 2.0 GPa, where the others have 1.7 GPa). Contrarily to strongly size-dependent fracture mechanisms and nearly size-independent strength subject to uniaxial tensile tests for single crystals [28], Mode-I opening simulations reveal significant size effects in both strength and . However, the crack growth mechanisms remain very similar for TMTi, Zr, Hf (Fig. 4-(c)) and are almost independent of the plate size.
Tab. 2 lists the predicted s—precisely, the infinite-plate-extrapolation values, —together with the Griffith’s estimates derived from the surface energy and zero-Kelvin elastic constants (Tab. 1). Note that considers ideal fracture surface parallel to the pre-crack [54], which does not fully capture the fracture behavior observed in our -controlled simulations. Overall, the difference between and falls within the range of 0.5–20%, with the exception of and for HfB2, where is approximately 30% lower than . Additional data is provided in the the supplementary material.
During pure Mode-I opening, Group-IV TMB2 materials exhibit similar behavior, as illustrated in Fig. 5, with one representative example for each plane (: Fig. 5-(a), : Fig. 5-(b), : in Fig. 5-(c)). For –, the first TM–B bond breaks upon reaching the point (as shown in the sub-patterns in each row and Fig. 3-(a-d)), and the opening continues along the corresponding plane: (0001) for and (zigzag path), and for and . Contrarily for the plane, differences arise from the bond-breaking sequence after the initial B–B bond breaks at (as shown in the sub-patterns and Fig. 3-e,f). In all Group-IV TMB2 compounds, the crack tip advances primarily through the continuous breaking of TM–B bonds, as B–B bonds are generally much stronger than TM–B bonds in -structured TMB2 compounds [46]. The difference lies in the propagation patterns: in TiB2, the breaking sequence forms a zigzag path but remains along the horizontal direction (Fig. 5-(c-1)), whereas in ZrB2 and HfB2, the crack tip advances diagonally along the plane (Fig. 5-(c-2,3)). Importantly, despite the predominant crack opening in TiB2 occurs along the plane, the actual fracture surface is more complex than that assumed by the Griffith’s theory, which would disregard the alternations between mirrored diagonal facets. The observed difference in crack propagation patterns may be attributed to the small differences between and surface energies.
The fracture toughness from experiment ranges between 1.8–6.8 MPa for TiB2 [55, 56, 57], 2.2–5.0 MPa for ZrB2 [40, 41, 58], and 2.8–7.2 MPa for HfB2 [59, 60]. These values align with ML-MS predictions in Fig. 4 and Tab. 2, where the differences between our data and data from various experimental studies (note the significant spread in experimental values) stem from various sample preparation methods, microstructural effects, as well as particular mechanical testing approach. Furthermore, the possibility of mixing with Mode-II shearing or the Mode-III tearing introduces variations in the experimentally obtained s. While Mode-III is rather exotic for brittle materials [61], hence disregarded in this work, mixed Mode-I and Mode-II effects are explored in the following section.
Fig. 5 compares fracture mechanisms of TiB2, Zr2, and HfB2 after reaching , considering the most experimentally relevant (0001) (), (), and () crack geometries. Among them, only the opening in the geometry (Fig. 5-(b)) shows that each TMB2 compound breaks the same number of bonds. For the other two geometries, (Fig. 5-(a)) and (Fig. 5-(c)), TiB2 consistently breaks a single bond, while ZrB2 and HfB2 rupture multiple bonds simultaneously. This suggests that stress in ZrB2 and HfB2 redistributes more effectively, leading to abrupt fracture. Despite their high values among all TMB2:s—indicating intrinsic brittleness [62, 46]—variations in crack-tip shielding, bond anisotropy, or localized deformation mechanisms further influence the fracture behavior.
4 Mixed Mode-I and Mode-II loading: example of TiB2
Due to the material’s heterogeneity, the sample’s geometry, or loading conditions, achieving a pure Mode-I fracture in experiments is rare [63, 64, 65]. Even a slight misalignment in combination with microstructural effects (e.g., grain boundaries, phase interfaces) can introduce shear components, leading to mixed-mode fracture [66, 67, 68]. In this section, we focus on mixed Mode-I and Mode-II crack opening, using TiB2 together with the (), and () crack geometries as an example.
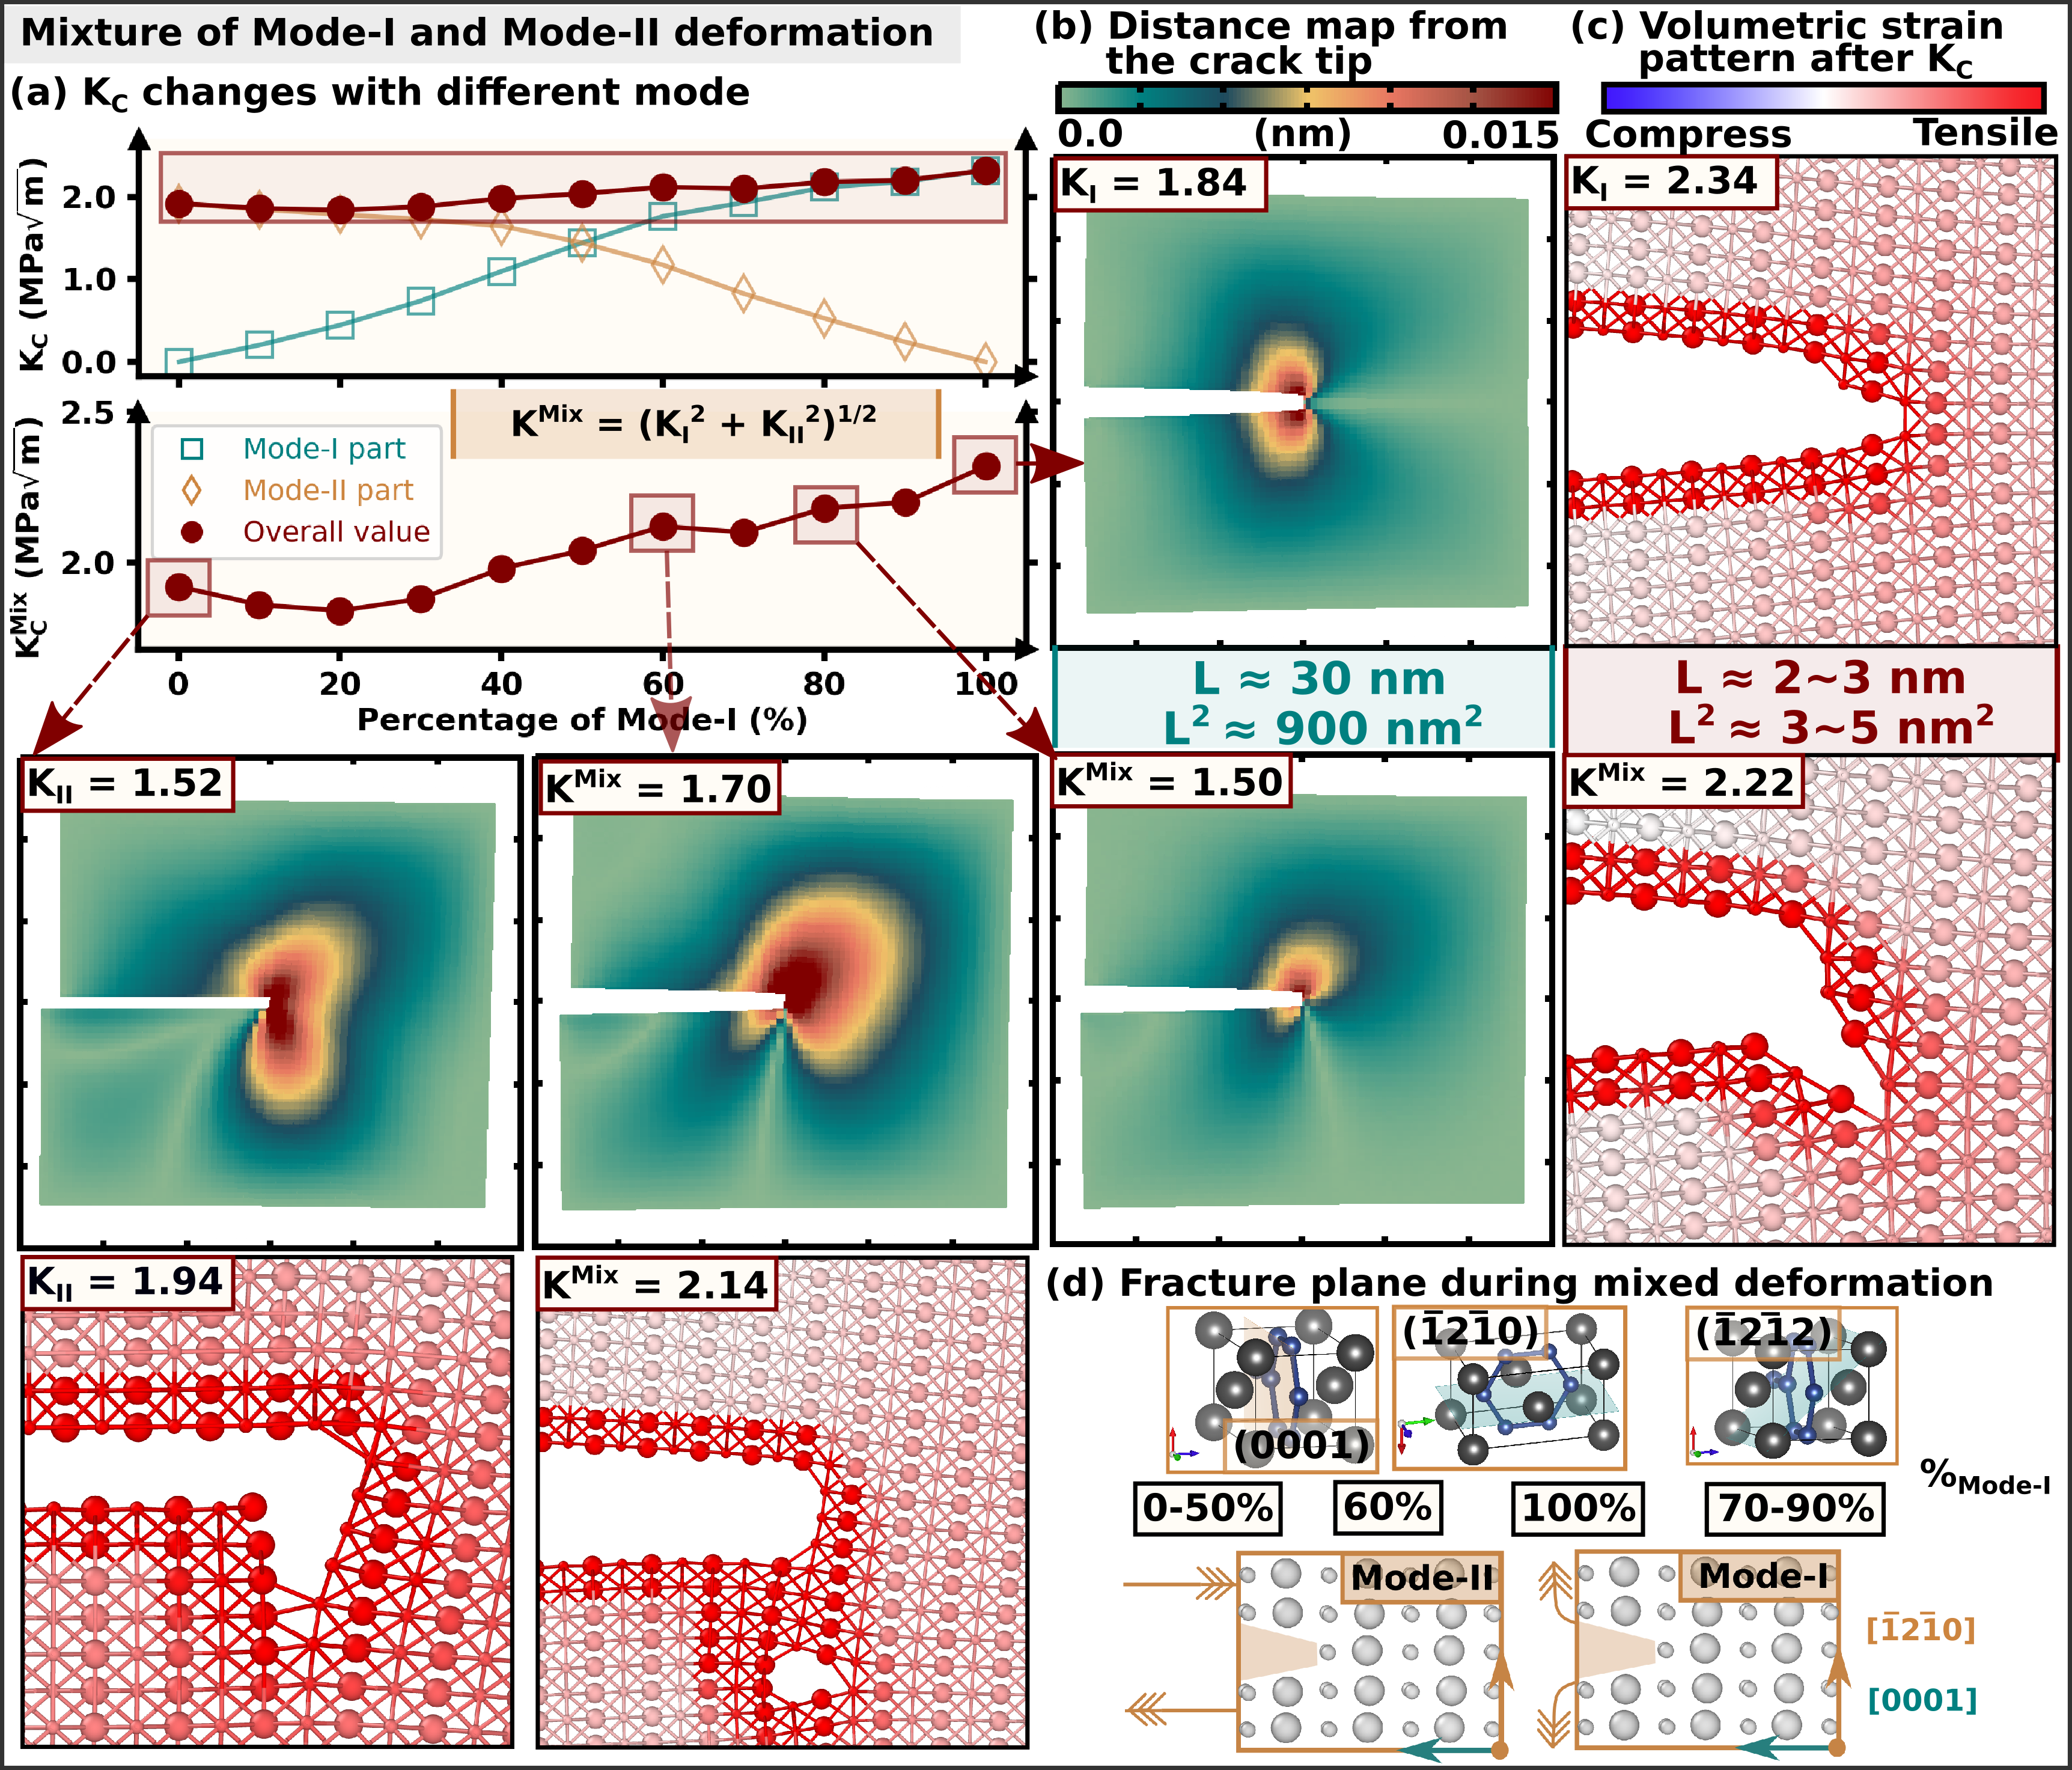
Fig. 6 illustrates effects of the Mode-I fraction on the nucleation of cracks parallel to () plane with [] front direction ([]). There is a gradual increase in with a higher Mode-I fraction (Fig. 6-a), rising from MPa for pure Mode-II to MPa for pure Mode-I. However, within the range of 0% to 20% Mode-I fraction, a slight decrease is observed, with dropping from 1.92 to 1.84 MPa. Fig. 6-(b) presents a distance map corresponding to the deformation stage when the step reaches 50–85% of , highlighting the distance from the crack tip to the border and showing the stress distribution during deformation. A distinct fracture mechanisms corresponding ti Mode-I and Mode-II loading are observed. Fig. 6-(c,d) depicts four distinct crack propagation mechanisms that occur during [] deformation.
Starting with pure Mode-I opening, the crack propagates predominantly along the plane. As the Mode-I fraction decreases to 70%, the crack propagation shifts entirely to the plane, indicating a transition in the crack path and initiating a pyramidal slip. This behavior is consistent with observations of both tensile [28] and shear [29] deformation in TiB2, aligning with the studied preferred failure plane. At 60% Mode-I fraction, the crack first propagates along the (0001) plane before transitioning to the plane. Below 50% Mode-I fraction, and continuing to the pure Mode-II case, the structure opens along the (0001) plane once is reached. This is similar to crack growth mechanism observed in the [] () loading geometry. For further details, refer to the supplementary material.
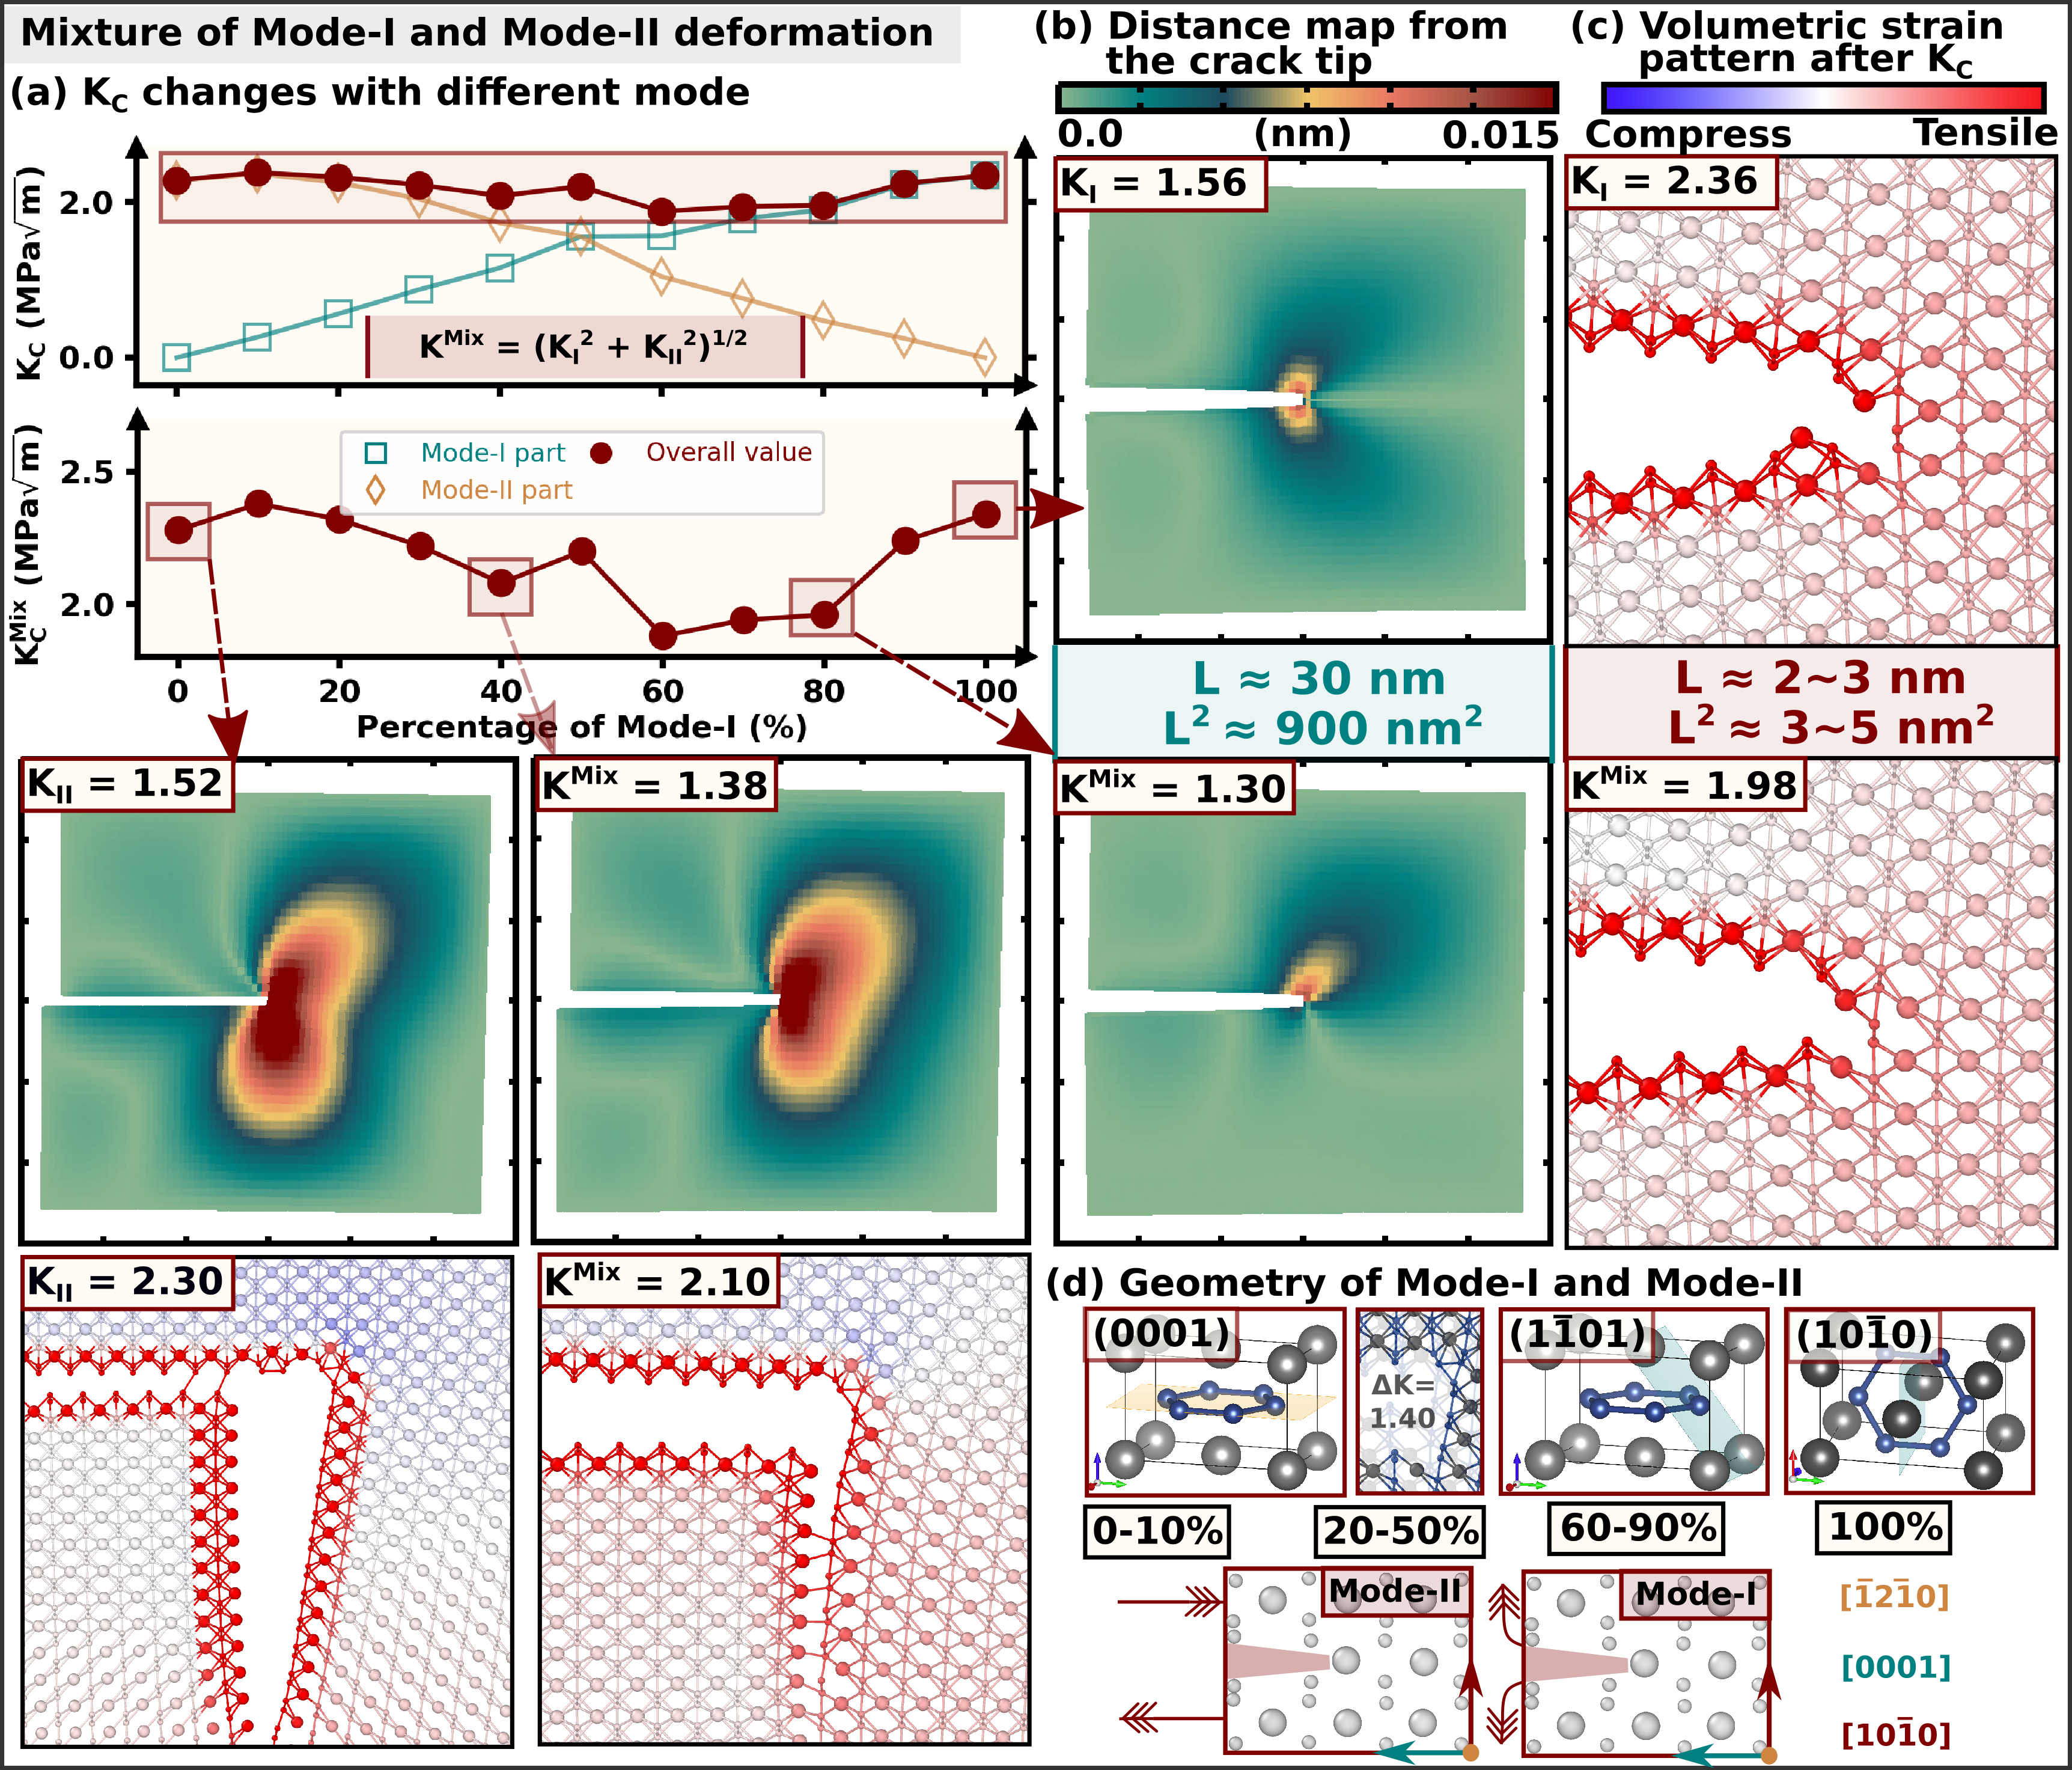
The () deformation (Fig. 7-(a)) shows more intricate trends, with a local minimum, MPa, around 60% of Mode-I. The values for pure Mode-I and pure Mode-II are fairly similar, with MPa and MPa, respectively. Fig. 7-(b), featuring a distance map, illustrates the distance from the crack tip and highlights the differences in stress contributions between Mode-I and Mode-II deformation. Combined with Fig. 7-(c) and (d), this deformation exhibits distinct behavior across varying Mode-I contributions. In pure Mode-I loading, the crack propagates in a zigzag pattern by opening along mirrored diagonal facets while maintaining an overall horizontal direction. From 90% down to 60% Mode-I fractions, the material opens along the plane after reaching , aligning with the first pyramidal slip plane and the preferred pure Mode-I opening plane for ZrB2 and HfB2 (Fig. 5-(c)). Interestingly, between 50% and 10% Mode-I, the TiB2 initially slips along the basal plane, then opens along the same plane. A similar slip behavior is also observed during the shear deformation in other TMB2 compounds, TMTa, W, Re [29]. Between 10% Mode-I and pure Mode-II, the structure transitions to opening exclusively along the (0001) plane without any prior slipping. The transition from Mode-I to Mode-II in deformation () follows a expectable pattern. The crack propagates through the plane from pure Mode-I to 90% Mode-I, but in a flat manner rather than a zigzag pattern. Between 80% and 70% Mode-I, the crack shifts to the plane, and for all percentages below this, down to pure Mode-II, it propagates through the plane. These transitions indicate prismatic slip occurring after reaching . For additional details, refer to the Supplementary material.
Furthermore, the fracture toughness results for the [] and geometries exhibit minimal differences (of similar magnitude) between and , indicating that the resistance of TMB2 to crack propagation remains consistent in these two perpendicular planes ( and ). Since these configurations share a common normal direction along the [0001]-axis, this underlines the basal plane isotropy of TiB2, previously shown for elastic constants, tensile and shear strengths [28, 29].
5 Experimental testing and verification of model
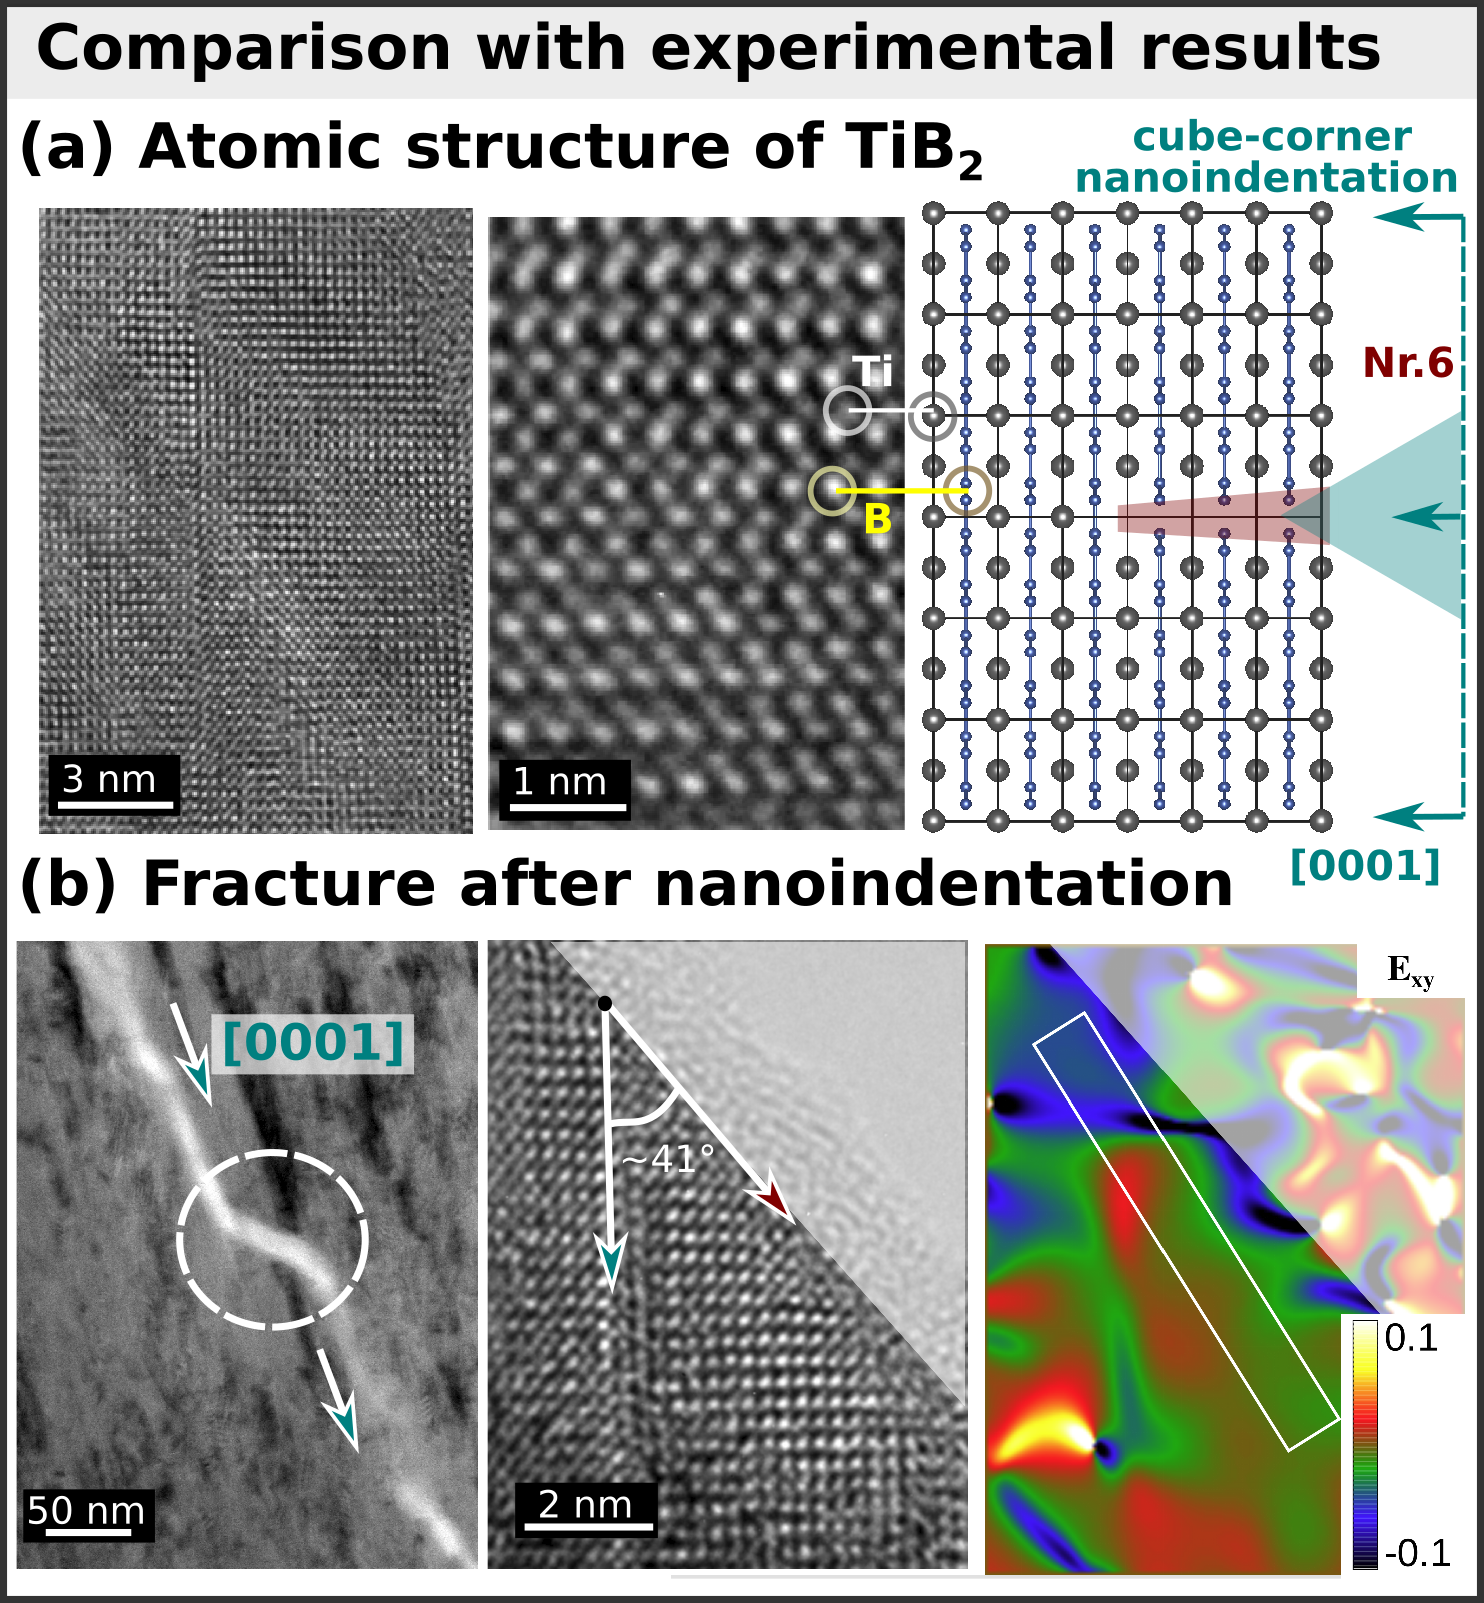
To support results of atomistic simulations, we conduct cube-corner nanoindentation tests on TiB2 thin films with near 1:2 Ti-to-B stoichiometry. The film’s structure prior to as well as after nanoindentaion is observed using high-resolution transmission electron microscopy (HRTEM). As typical for TMB2:s, our as-deposited TiB2 films are [0001]-oriented (Fig. 8-(a)). Following post-mortem HRTEM analysis (Fig. 8-(b)), a similarity between experiment and ML-MS simulations of loading () crack geometry is deduced.
As cube-corner indentation tests generally induce mixed Mode-I (dominant) and Mode-II opening [69], we use the Mixed-Mode simulations to find correlations with HRTEM observations. Specifically, a crack growth under is shown in Fig. 8-(b). This can be mimicked by simulations with Mode-II fraction, during which crack propagates along the plane, consistently with low energetic costs of prismatic and pyramidal slip in AlB2-type materials [70, 71]. The strain distribution map (obtained from TEM using the geometric phase analysis, GPA) indicates an average shear strain of 5% near the crack region, underscoring the presence of Mode-II deformation. The fracture toughness of our TiB2 sample is measured as 3.08 MPa [45], which is approximately 40% higher than both our simulated value () and the theoretical value predicted by Griffith’s theory (). The experimental , however, represents the fracture toughness across the entire sample, which has a slightly boron-rich composition (TiB2.04). The boron-rich tissue phase likely reduces fracture toughness, while TiB4.42 exhibits a of 2.51 MPa [45].
Although the idealized Griffith assumption does not fully capture the fracture behavior observed in our -controlled simulations (under pure Mode-I) and experiments (a mixture of Mode-I and Mode-II), it remains a useful reference. Griffith’s theory is based on purely elastic behavior, neglecting inelastic deformation. In contrast, our -controlled simulations incorporate atomic-scale effects such as plasticity and bond-breaking mechanisms, all of which influence crack propagation and lead to deviations from the purely elastic prediction. Additionally, while the -controlled approach assumes linear elastic fracture mechanics (LEFM) [72, 53], atomic-scale phenomena introduce nonlinear effects, including bond stretching and local stress concentrations in interatomic potentials. These factors collectively contribute to the observed differences between the fracture toughness values obtained from Griffith’s theory and those from our simulations. While modifications by McClintock and Walsh [73] account for plastic effects, the Griffith approach remains a relatively objective method for evaluating the fracture toughness of brittle materials.
6 Conclusion
To investigate inherent fracture properties of the Group-IV transition metal diborides, TMB2:s (TMTi, Zr, Hf), -controlled molecular statics simulations were performed using pre-cracked models and own machine-learning interatomic potentials. We demonstrated the suitability of MLIPs for determining the fracture toughness and fracture strength of hard but brittle solids, thus pointing to a route for systematically classifying the fracture properties of materials.
The validation against DFT and finite-temperature ab initio MD calculations confirmed the reliability of here-trained MLIPs, with tensile strength, elastic constants, and surface energy showing sufficient accuracy. Our main focus was on the pure Mode-I fracture (representing ideal brittle failure), considering six low-index crack geometries: (0001) (), (0001) (), (), [0001] (), [0001] (), (). While the maximum strength remained similar (2.0 GPa) for the studied TMB2:s (except for one crack geometry), fracture toughness ordered as: HfB2 (2.7 MPa) TiB2 (2.3 MPa) ZrB2 (1.8 MPa), with minor deviations in two geometries. Additionally, although most results aligned well with Griffith’s predictions, discrepancies arose due to crack propagation not always confined to the ideal crack plane but sometimes diverted in a diagonal or zigzag-like manner.
With the example of TiB2 and the [] and crack geometries (motivated by typical [0001] orientation of TMB2 thin films), effects of mixed Mode-I and Mode-II deformation on fracture toughness and mechanisms were investigated. Our simulations revealed that even a small Mode-II component can significantly alter fracture behavior. Furthermore, we conducted cube-corner nanoindentation tests, typically considered a pure Mode-I loading. The local strain distribution—mapped using the geometric phase analysis (GPA)—indicated a 5% shear strain component, pointing towards the contribution of Mode-II deformation. The observed sample orientation in the as deposited state and the nanoindentation-induced crack growth was correlated with our ML-MS simulations of mixed Mode-I and II loading, with the Mode-II component below 40%.
Our work shows that -controlled simulations can provide an atomistic view of nanoscale mechanical response to crack growth, yielding reliable values while incorporating plasticity and bond-breaking effects that influence propagation and cause deviations from purely elastic predictions. While finite-temperature effects have not been explicitly considered, the strong agreement between ab initioMD and ML-MD simulations suggests the potential for extending the pre-crack model to more complex environmental conditions. Overall, the presented simulation approach can serve a powerful tool for analyzing fracture toughness and behavior in complex ceramics, pawing the path towards systematic predictions of fracture-related descriptors and mechanisms.
Methods
Ab initio calculations
Finite-temperature Born-Oppenheimer ab initio molecular dynamics (ab initio MD) calculations were carried out using VASP [74] together with the projector augmented wave (PAW) [75] method and the Perdew-Burke-Ernzerhof exchange-correlation functional revised for solids (PBEsol) [76]. The plane-wave cut-off energies of 300 eV and -point sampling of the reciprocal space were employed.
Structural models of TMB2:s, TM(Ti, Zr, Hf) were based on the polymorph, adopting AlB2-type (P6/mmm) phase [77, 51]. The hexagonal unit cells were orthogonalized using the following crystallographic orientations: , , . All ab initio MD calculations were conducted using 720-atom supercells (240 TM480 B) with dimensions of . The supercells were equilibrated at target temperature (300 K and 1200 K) through a two-step process: (i) a 10 ps isobaric-isothermal (NpT) simulation using a Parrinello-Rahman barostat [78] and Langevin thermostat; (ii) a 2–4 ps simulation with the canonical (NVT) ensemble based on Nosé-Hoover thermostat, applying the time-averaged lattice parameters obtained from (i).
Room-temperature elastic constants, , were determined following Ref. [79], i.e., obtained from a second-order polynomial fit of stress/strain data from the [0001], [10], and [] tensile simulations (used to derive , , , ), and the (0001), and shear simulations (used to derive ). Strains ranging from 0 to 4% were considered. Stress tensor components were calculated by averaging data over the last 0.5 ps of each simulation. Zero Kelvin elastic constants were also calculated using the stress-strain method, with the same energy convergence criteria as the ab initio MD calculations but smaller strain (up to 1%). The methodology is consistent with our previous work [28], concerning of -TiB2. The surface energies were calculated at zero Kelvin using a 60-atom TiB2 supercell (with a k-mesh and cut-off energy of 300 eV) together with a 12 Å vacuum layer.
Molecular statics/dynamics with MLIPs (ML-MS/MD)
ML-MS calculations were conducted using the LAMMPS code [80] interfaced with the mlip-2 package [27] enabling the usage of MTP-type MLIPs. Active learning has been performed using the concept of extrapolation grade, MV [81], which also served to assess the reliability during MD simulations with the trained MLIPs. For MLIP validation purposes, we performed MD simulations of uniaxial deformation and calculated elastic constants. Computational setup for equilibration and tensile tests at the atomic scale was designed to closely match the corresponding ab initio MD simulations. For zero-Kelvin elastic constant validation, to minimize variables and maintain accuracy, we conducted MD calculations at 10 K instead of using MS simulations. A detailed discussion of MD validation is provided in the supplementary material. The zero-Kelvin surface energies were validated using ML-MS with 12 Å vacuum, the same as in DFT calculations.
-controlled MS simulations were utilized to evaluate the effective resistance to brittle cleavage, using cracked-plate models of sizes reaching atoms (nm2, where is the lateral size). Theory and methods followed Refs. [82, 72, 53]. We employed square TMB2 plates (with area of ) with all the possible geometries for both Mode-I and Mode-II loadings, i.e., (0001) (), (0001) (), (), [0001] (), [0001] (), (). The supercells were periodic along the crack-front direction with the thickness of approxiamately 0.5 nm. Atoms in the frame region centered at the crack tip are sequentially displaced by incrementing the crack-tip stress intensity , , and at steps of 0.02 MPa, while during Mode-Mix the s are calculated as follows: , , (percentage), where a is the content of Mode-I, b for Mode-II, and . All, except frame atoms, were relaxed with the conjugate-gradient algorithm at each increment, with the tolerances are set to 10-14 for energy changes and 10-14 eV/Å for forces. The simulations were carried out with atomically sharp cracks, where interactions between atoms on opposite sides of the crack plane were screened over nm. Further, half rows of atoms were deleted, and the plates are constructed with an equal number of atomic layers above and below the crack.
The Griffith fracture toughness, , was derived from [83]:
| (1) |
where represents the unrelaxed surface energy and is an element from the inverse of the Stroh energy tensor (), calculated from the elastic tensor.
Experimental methods
A TiB2.04 coating with near 1:2 stoichiometry and approximately 2 µm thickness was provided for analysis. The coating was deposited using an in-house DC balanced magnetron sputtering system, employing a 6-inch, powder-metallurgically produced TiB2/C (99/1 wt.%) target (>99.6% purity). The complete deposition procedure is detailed in Ref. [45]. Nanoindentation tests were performed using an FT-I04 Femto-Indenter equipped with a cube-corner diamond tip to induce controlled cracking. A total of 17 indents were applied at peak loads (Fm) ranging from 50 to 450 mN. The tests followed a displacement-controlled loading-unloading cycle. A cross-sectional TEM lamella was extracted from a radial crack tip using a Thermo Scientific Scios 2 DualBeam FIB-SEM system. Following a conventional FIB milling and lift-out procedure as presented in Ref. [84], an 8 µm thick tungsten protection layer was deposited over the region of interest to prevent milling damage. Initially, a 2 µm thick cross-sectional lamella was prepared, which was then refined by sequential ion milling steps to approximately 100 nm. Final cleaning steps at 2 kV and 27 pA, followed by Ar ion milling at 0.5 kV using a Gatan PIPS II system, further reduced the thickness to <75 nm, allowing high-resolution TEM analysis.
The cross-sectional transmission electron microscopy (TEM) specimens were prepared using an FEI Quanta 200 3D DBFIB. A 200 kV field emission TEM (JEOL 2100F) equipped with an image-side spherical aberration ()-corrector was used in the high-resolution TEM (HRTEM) study, demonstrating a resolution of 1.2 Åat 200 kV. The aberration coefficient was set close to zero, under which the HRTEM images were taken under slightly over-focus conditions (close to the Scherzer defocus). A CCD Orius camera is used to record HRTEM images, where image sizes are 2048 pixels 1336 pixels. The strain fields in TiB2 were calculated based on the -corrected HRTEM images by the geometric phase analysis (GPA) method. According to the GPA algorithm, the displacement fields can be obtained by selecting two non-collinear Bragg vectors in the power spectrum generated from a high-resolution TEM image.
Acknowledgements
LH acknowledges financial support from the Swedish Government Strategic Research Area in Materials Science on Functional Materials at Linköping University SFO-Mat-LiU No. 2009 00971. Support from Knut and Alice Wallenberg Foundation Scholar Grants KAW2016.0358 and KAW2019.0290 is also acknowledged by LH. DGS gratefully acknowledges financial support from the Swedish Research Council (VR) through Grant Nº VR-2021-04426 and the Competence Center Functional Nanoscale Materials (FunMat-II) (Vinnova Grant No. 2022-03071). The financial support (Z.C.and Z.Z.) by the Austrian Science Fund (FWF P33696) is highly acknowledged. The authors acknowledge original TiB2 samples from Anna Viktoria Hirle, also for providing the raw data from previous publication [45] and participating discussion. PHM and NK acknowledge the Austrian Science Fund, FWF (10.55776/PAT4425523). The FFG projects: Bridge and iDAP+ are further acknowledged by PHM. We sincerely thank the Electron Microscopy Center at USTEM TU Wien for FIB-SEM access. The computations handling were enabled by resources provided by the National Academic Infrastructure for Supercomputing in Sweden (NAISS) and the Swedish National Infrastructure for Computing (SNIC) at the national supercomputer center (NSC) partially funded by the Swedish Research Council through grant agreements no. 2022-06725 and no. 2018-05973, as well as by the Vienna Scientific Cluster (VSC) in Austria. The authors acknowledge TU Wien Bibliothek for financial support through its Open Access Funding Program.
CRediT author contributions statement
SL: Methodology, Investigation, Data curation, Formal analysis, Visualization, Writing - original draft. ZC: Investigation, Writing - review & editing RJ: Investigation, Writing - review & editing ZZ, LH, PHM: Resources, Funding acquisition, Writing - review & editing NK: Conceptualization, Methodology, Supervision, Writing - review & editing DGS: Conceptualization, Methodology, Software, Investigation, Writing - review & editing
Conflicts of interest
The authors declare that they have no known competing financial interests or personal relationships that could have appeared to influence the work reported in this paper.
Data availability
Data will be made available on request.
References
- [1] A. A. Griffith, “Vi. the phenomena of rupture and flow in solids,” Proc R Soc Lond A Math Phys Sci, vol. 221, no. 582-593, pp. 163–198, 1921.
- [2] G. R. Irwin, “Analysis of stresses and strains near the end of a crack traversing a plate,” American Society of Mechanical Engineers, 1957.
- [3] T. Nose and T. FUJII, “Evaluation of fracture toughness for ceramic materials by a single-edge-precracked-beam method,” J. Am. Ceram. Soc., vol. 71, no. 5, pp. 328–333, 1988.
- [4] T. L. Anderson, M. Dawes, and H. McHenry, Elastic-plastic fracture toughness tests with single-edge notched bend specimens. ASTM International, 1985.
- [5] E. M. Shaji, S. R. Kalidindi, R. D. Doherty, and A. S. Sedmak, “Plane strain fracture toughness of MP35N in aged and unaged conditions measured using modified CT specimens,” Mater. Sci. Eng. A, vol. 340, no. 1-2, pp. 163–169, 2003.
- [6] J. Underwood, S. Freiman, F. Baratta, et al., “A review of chevron-notched fracture specimens,” in Chevron-notched Specimens, Testing and Stress Analysis: A Symposium, vol. 855, p. 5, ASTM International, 1984.
- [7] R. Kolhe, C.-Y. Hui, and A. T. Zehnder, “Effects of finite notch width on the fracture of chevron–notched specimens,” Int. J. Fract., vol. 94, pp. 189–198, 1998.
- [8] B. Gludovatz, S. Wurster, A. Hoffmann, and R. Pippan, “Fracture toughness of polycrystalline tungsten alloys,” Int. J. Refract. Met. Hard Mater., vol. 28, no. 6, pp. 674–678, 2010.
- [9] M. E. Launey and R. O. Ritchie, “On the fracture toughness of advanced materials,” Adv. Mater., vol. 21, no. 20, pp. 2103–2110, 2009.
- [10] X. Zeng and A. Hartmaier, “Modeling size effects on fracture toughness by dislocation dynamics,” Acta Mater., vol. 58, no. 1, pp. 301–310, 2010.
- [11] J. J. Möller and E. Bitzek, “Fracture toughness and bond trapping of grain boundary cracks,” Acta Mater., vol. 73, pp. 1–11, 2014.
- [12] T. Shimokawa, M. Tanaka, K. Kinoshita, and K. Higashida, “Roles of grain boundaries in improving fracture toughness of ultrafine-grained metals,” Phys. Rev. B Condens. Matter, vol. 83, no. 21, p. 214113, 2011.
- [13] S. Samborski and T. Sadowski, “Dynamic fracture toughness of porous ceramics,” J. Am. Ceram. Soc., vol. 93, no. 11, pp. 3607–3609, 2010.
- [14] H.-J. Kleebe, G. Pezzotti, and G. Ziegler, “Microstructure and fracture toughness of Si3N4 ceramics: combined roles of grain morphology and secondary phase chemistry,” J. Am. Ceram. Soc., vol. 82, no. 7, pp. 1857–1867, 1999.
- [15] Z. Zhang, A. Ghasemi, N. Koutná, Z. Xu, T. Grünstäudl, K. Song, D. Holec, Y. He, P. H. Mayrhofer, and M. Bartosik, “Correlating point defects with mechanical properties in nanocrystalline TiN thin films,” Mater. Des., vol. 207, p. 109844, 2021.
- [16] L. Ma, A.-L. Fauchille, M. R. Chandler, P. Dowey, K. G. Taylor, J. Mecklenburgh, and P. D. Lee, “In-situ synchrotron characterisation of fracture initiation and propagation in shales during indentation,” Energy, vol. 215, p. 119161, 2021.
- [17] K. Fadenberger, I. E. Gunduz, C. Tsotsos, M. Kokonou, S. Gravani, S. Brandstetter, A. Bergamaschi, B. Schmitt, P. H. Mayrhofer, C. C. Doumanidis, et al., “In situ observation of rapid reactions in nanoscale Ni–Al multilayer foils using synchrotron radiation,” Appl. Phys. Lett., vol. 97, no. 14, 2010.
- [18] Y. Mishin, “Machine-learning interatomic potentials for materials science,” Acta Mater., vol. 214, p. 116980, 2021.
- [19] D. Dragoni, T. D. Daff, G. Csányi, and N. Marzari, “Achieving DFT accuracy with a machine-learning interatomic potential: Thermomechanics and defects in bcc ferromagnetic iron,” Phys. Rev. Mater., vol. 2, no. 1, p. 013808, 2018.
- [20] T. Mueller, A. Hernandez, and C. Wang, “Machine learning for interatomic potential models,” J. Chem. Phys., vol. 152, no. 5, 2020.
- [21] L. Zhang, G. Csányi, E. van der Giessen, and F. Maresca, “Efficiency, accuracy, and transferability of machine learning potentials: Application to dislocations and cracks in iron,” Acta Mater., vol. 270, p. 119788, 2024.
- [22] J. Behler, “Perspective: Machine learning potentials for atomistic simulations,” J. Chem. Phys., vol. 145, no. 17, 2016.
- [23] V. L. Deringer, M. A. Caro, and G. Csányi, “Machine learning interatomic potentials as emerging tools for materials science,” Adv. Mater., vol. 31, no. 46, p. 1902765, 2019.
- [24] Y. Zuo, C. Chen, X. Li, Z. Deng, Y. Chen, J. Behler, G. Csányi, A. V. Shapeev, A. P. Thompson, M. A. Wood, et al., “Performance and Cost Assessment of Machine Learning Interatomic Potentials,” J. Phys. Chem. A, vol. 124, no. 4, pp. 731–745, 2020.
- [25] J. S. Smith, O. Isayev, and A. E. Roitberg, “ANI-1: an extensible neural network potential with DFT accuracy at force field computational cost,” Chem. Sci., vol. 8, no. 4, pp. 3192–3203, 2017.
- [26] A. V. Shapeev, E. V. Podryabinkin, K. Gubaev, F. Tasnádi, and I. A. Abrikosov, “Elinvar effect in -Ti simulated by on-the-fly trained moment tensor potential,” New J. Phys., vol. 22, no. 11, p. 113005, 2020.
- [27] I. S. Novikov, K. Gubaev, E. V. Podryabinkin, and A. V. Shapeev, “The package: moment tensor potentials with and active learning,” Mach. learn.: sci. technol., vol. 2, no. 2, p. 025002, 2020.
- [28] S. Lin, L. Casillas-Trujillo, F. Tasnádi, L. Hultman, P. H. Mayrhofer, D. G. Sangiovanni, and N. Koutná, “Machine-learning potentials for nanoscale simulations of tensile deformation and fracture in ceramics,” Npj Comput. Mater., vol. 10, no. 1, p. 67, 2024.
- [29] S. Lin, D. Holec, D. Sangiovanni, T. Leiner, L. Hultman, P. Mayrhofer, and N. Koutná, “Shear-activated phase transformations of diborides via machine-learning potential molecular dynamics,” Preprint, vol. 10.21203/rs.3.rs-5327540/v1, 2024.
- [30] N. Koutná, S. Lin, L. Hultman, D. G. Sangiovanni, and P. H. Mayrhofer, “Machine-learning potentials for structurally and chemically complex MAB phases: strain hardening and ripplocation-mediated plasticity,” 2025.
- [31] C. Sevik, J. Bekaert, M. Petrov, and M. V. Milošević, “High-temperature multigap superconductivity in two-dimensional metal borides,” Phys. Rev. Mater., vol. 6, no. 2, p. 024803, 2022.
- [32] H. Holleck, “Material selection for hard coatings,” J. Vac. Sci. Technol., vol. 4, no. 6, pp. 2661–2669, 1986.
- [33] C. Wang, S. Akbar, W. Chen, and V. Patton, “Electrical properties of high-temperature oxides, borides, carbides, and nitrides,” J. Mater. Sci., vol. 30, pp. 1627–1641, 1995.
- [34] H. Waldl, M. Tkadletz, A. Lechner, C. Czettl, M. Pohler, and N. Schalk, “Evolution of the fracture properties of arc evaporated Ti1-xAlxN coatings with increasing Al content,” Surf. Coat. Technol., vol. 444, p. 128690, 2022.
- [35] Y. Moritz, C. Kainz, M. Tkadletz, C. Czettl, M. Pohler, and N. Schalk, “Microstructure and mechanical properties of arc evaporated Ti (Al, Si) N coatings,” Surf. Coat. Technol., vol. 421, p. 127461, 2021.
- [36] R. Daniel, M. Meindlhumer, W. Baumegger, J. Zalesak, B. Sartory, M. Burghammer, C. Mitterer, and J. Keckes, “Grain boundary design of thin films: using tilted brittle interfaces for multiple crack deflection toughening,” Acta Mater., vol. 122, pp. 130–137, 2017.
- [37] T. Csanádi, M. Vojtko, Z. Dankházi, M. J. Reece, and J. Dusza, “Small scale fracture and strength of high-entropy carbide grains during microcantilever bending experiments,” J. Eur. Ceram. Soc., vol. 40, no. 14, pp. 4774–4782, 2020.
- [38] J. Tatami, M. Katayama, M. Ohnishi, T. Yahagi, T. Takahashi, T. Horiuchi, M. Yokouchi, K. Yasuda, D. K. Kim, T. Wakihara, et al., “Local fracture toughness of Si3N4 ceramics measured using single-edge notched microcantilever beam specimens,” J. Am. Ceram. Soc., vol. 98, no. 3, pp. 965–971, 2015.
- [39] J. P. Best, J. Zechner, J. M. Wheeler, R. Schoeppner, M. Morstein, and J. Michler, “Small-scale fracture toughness of ceramic thin films: the effects of specimen geometry, ion beam notching and high temperature on chromium nitride toughness evaluation,” Phil. Mag., vol. 96, no. 32-34, pp. 3552–3569, 2016.
- [40] F. Monteverde, S. Guicciardi, and A. Bellosi, “Advances in microstructure and mechanical properties of zirconium diboride based ceramics,” Mater. Sci. Eng. A, vol. 346, no. 1-2, pp. 310–319, 2003.
- [41] T. Csanádi, A. Azizpour, M. Vojtko, and W. G. Fahrenholtz, “The effect of crystal anisotropy on fracture toughness and strength of ZrB2 microcantilevers,” J. Am. Ceram. Soc., vol. 107, no. 3, pp. 1669–1681, 2024.
- [42] M. Vidiš, T. Fiantok, M. Gocník, P. Švec Jr, Š. Nagy, M. Truchlỳ, V. Izai, T. Roch, L. Satrapinskyy, V. Šroba, et al., “Hardness and fracture toughness enhancement in transition metal diboride multilayer films with structural variations,” Materialia, vol. 34, p. 102070, 2024.
- [43] C. Hu, S. Lin, M. Podsednik, S. Mráz, T. Wojcik, A. Limbeck, N. Koutná, and P. H. Mayrhofer, “Influence of co-sputtering AlB2 to TaB2 on stoichiometry of non-reactively sputtered boride thin films,” Mater. Res. Lett., vol. 12, no. 8, pp. 561–570, 2024.
- [44] T. Glechner, H. Oemer, T. Wojcik, M. Weiss, A. Limbeck, J. Ramm, P. Polcik, and H. Riedl, “Influence of si on the oxidation behavior of tm-si-b2ąz coatings (tm= ti, cr, hf, ta, w),” urf. Coat. Technol., vol. 434, p. 128178, 2022.
- [45] C. Fuger, R. Hahn, A. Hirle, T. Wojcik, P. Kutrowatz, F. Bohrn, O. Hunold, P. Polcik, and H. Riedl, “Tissue phase affected fracture toughness of nano-columnar TiB2+z thin films,” Mater. Res. Lett., vol. 11, no. 8, pp. 613–622, 2023.
- [46] Y. Zhou, H. Xiang, Z. Feng, and Z. Li, “General trends in electronic structure, stability, chemical bonding and mechanical properties of ultrahigh temperature ceramics TMB2 (TM= transition metal),” J. Mater. Sci. & technology, vol. 31, no. 3, pp. 285–294, 2015.
- [47] Q. Gan, H. Liu, S. Zhang, F. Wang, J. Cheng, X. Wang, S. Dong, Q. Tao, Y. Chen, and P. Zhu, “Robust hydrophobic materials by surface modification in transition-metal diborides,” ACS Appl. Mater. Interfaces, vol. 13, no. 48, pp. 58162–58169, 2021.
- [48] W. Sun, H. Xiang, F.-Z. Dai, J. Liu, and Y. Zhou, “Anisotropic surface stability of TiB2: A theoretical explanation for the easy grain coarsening,” J. Mater. Res., vol. 32, no. 14, pp. 2755–2763, 2017.
- [49] W. Sun, J. Liu, H. Xiang, and Y. Zhou, “A theoretical investigation on the anisotropic surface stability and oxygen adsorption behavior of ZrB2,” J. Am. Ceram. Soc., vol. 99, no. 12, pp. 4113–4120, 2016.
- [50] T. Yang, X. Han, W. Li, X. Chen, and P. Liu, “First-principles calculations on the interfacial stability and bonding properties of HfN (111)/HfB2 (0001) interface,” Vacuum, vol. 207, p. 111678, 2023.
- [51] C. Hu, S. Mráz, P. J. Pöllmann, T. Wojcik, M. Podsednik, B. Hajas, A. Limbeck, N. Koutná, J. M. Schneider, and P. H. Mayrhofer, “Microstructure, mechanical properties, thermal decomposition and oxidation sequences of crystalline AlB2 thin films,” Mater. Des., vol. 250, p. 113584, 2025.
- [52] D. Sangiovanni, A. Kjellén, F. Trybel, L. Johnson, M. Odén, F. Tasnádi, and I. Abrikosov, “Controlled polymorphic competition–a path to tough and hard ceramics,” arXiv preprint arXiv:2412.15874, 2024.
- [53] D. G. Sangiovanni, A. Kraych, M. Mrovec, J. Salamania, M. Odén, F. Tasnádi, and I. A. Abrikosov, “Descriptor for slip-induced crack blunting in refractory ceramics,” Phys. Rev. Mater., vol. 7, no. 10, p. 103601, 2023.
- [54] W. Brace, “An extension of the Griffith theory of fracture to rocks,” J. Geophys. Res., vol. 65, no. 10, pp. 3477–3480, 1960.
- [55] M. K. Ferber, P. F. Becher, and C. B. Finch, “Effect of microstructure on the properties of TiB2 ceramics,” J. Am. Ceram. Soc., vol. 66, no. 1, pp. C–2, 1983.
- [56] S. Bhaumik, C. Divakar, A. K. Singh, and G. Upadhyaya, “Synthesis and sintering of TiB2 and TiB2–TiC composite under high pressure,” Mater. Sci. Eng. A, vol. 279, no. 1-2, pp. 275–281, 2000.
- [57] W. Wang, Z. Fu, H. Wang, and R. Yuan, “Influence of hot pressing sintering temperature and time on microstructure and mechanical properties of TiB2 ceramics,” J. Eur. Ceram. Soc., vol. 22, no. 7, pp. 1045–1049, 2002.
- [58] J. J. Swab, J. Jarman, W. Fahrenholtz, and J. Watts, “Mechanical properties of ZrB2 ceramics determined by two laboratories,” Int. J. Appl. Ceram. Technol., vol. 20, no. 5, pp. 3097–3103, 2023.
- [59] K. Li, Z. Huang, J. Yuan, X. Li, Z. Wang, M. Hu, T. Wang, X. Hu, Y. Li, and X. Zhang, “Synthesis and growth mechanism of highly crystalized multi-branched HfB2 microrods with self-toughening effect,” Mater. Des., vol. 244, p. 113196, 2024.
- [60] Z. Wang, X. Liu, B. Xu, and Z. Wu, “Fabrication and properties of HfB2 ceramics based on micron and submicron HfB2 powders synthesized via carbo/borothermal reduction of HfO2 with B4C and carbon,” Int. J. Refract. Met. Hard Mater., vol. 51, pp. 130–136, 2015.
- [61] T. Maccagno and J. Knott, “Brittle fracture under mixed modes I and II loading,” Int. J. Fract., vol. 29, pp. R49–R57, 1985.
- [62] Y. Zhou, J. Wang, Z. Li, X. Zhan, and J. Wang, “First-principles investigation on the chemical bonding and intrinsic elastic properties of transition metal diborides TMB2 (TM= Zr, Hf, Nb, Ta, and Y),” Ultra-High Temperature Ceramics: Materials for Extreme Environment Applications, pp. 60–82, 2014.
- [63] J. Royer, “Study of pure and mixed-mode fracture of a brittle material,” Exp. Mech., vol. 28, pp. 382–387, 1988.
- [64] M. De Moura, R. Campilho, and J. Gonçalves, “Pure mode II fracture characterization of composite bonded joints,” Int. J. Solids Struct., vol. 46, no. 6, pp. 1589–1595, 2009.
- [65] R. Jalayer, B. Saboori, and M. R. Ayatollahi, “A novel test specimen for mixed mode I/II/III fracture study in brittle materials,” Fatigue Fract. Eng. Mater. Struct., vol. 46, no. 5, pp. 1908–1920, 2023.
- [66] V. Rizov, “Mixed-mode I/II fracture study of polymer composites using single edge notched bend specimens,” Comput. Mater. Sci., vol. 77, pp. 1–6, 2013.
- [67] A. Braham, W. Buttlar, and F. Ni, “Laboratory mixed-mode cracking of asphalt concrete using the single-edge notch beam,” Road Mater. Pavement Des., vol. 11, no. 4, pp. 947–968, 2010.
- [68] R. Margevicius, J. Riedle, and P. Gumbsch, “Fracture toughness of polycrystalline tungsten under mode I and mixed mode I/II loading,” Mater. Sci. Eng. A, vol. 270, no. 2, pp. 197–209, 1999.
- [69] I. Gupta, C. Sondergeld, and C. Rai, “Fracture toughness in shales using nano-indentation,” J. Pet. Sci. Eng., vol. 191, p. 107222, 2020.
- [70] B. Hunter, X.-X. Yu, N. De Leon, C. Weinberger, W. Fahrenholtz, G. Hilmas, M. L. Weaver, and G. B. Thompson, “Investigations into the slip behavior of zirconium diboride,” J. Mater. Res., vol. 31, no. 18, pp. 2749–2756, 2016.
- [71] C. Fuger, R. Hahn, L. Zauner, T. Wojcik, M. Weiss, A. Limbeck, O. Hunold, P. Polcik, and H. Riedl, “Anisotropic super-hardness of hexagonal WB2±z thin films,” Mater. Res. Lett., vol. 10, no. 2, pp. 70–77, 2022.
- [72] P. Andric and W. A. Curtin, “Atomistic modeling of fracture,” Model. Simul. Mat. Sci. Eng., vol. 27, no. 1, p. 013001, 2018.
- [73] F. McClintock, “Friction on Griffith cracks in rocks under pressure,” in Proc. 4th US Nat. Congr. Appl. Mech., vol. 2, pp. 1015–1022, 1962.
- [74] G. Kresse and J. Furthmüller, “Efficient iterative schemes for ab initio total-energy calculations using a plane-wave basis set,” Phys. Rev. B, vol. 54, no. 16, p. 11169, 1996.
- [75] G. Kresse and D. Joubert, “From ultrasoft pseudopotentials to the projector augmented-wave method,” Phys. Rev. B, vol. 59, pp. 1758–1775, Jan 1999.
- [76] J. P. Perdew, A. Ruzsinszky, G. I. Csonka, O. A. Vydrov, G. E. Scuseria, L. A. Constantin, X. Zhou, and K. Burke, “Restoring the density-gradient expansion for exchange in solids and surfaces,” Phys. Rev. Lett., vol. 100, p. 136406, Apr 2008.
- [77] T. Leiner, N. Koutná, J. Janovec, M. Zelenỳ, P. H. Mayrhofer, and D. Holec, “On energetics of allotrope transformations in transition-metal diborides via plane-by-plane shearing,” Vacuum, vol. 215, p. 112329, 2023.
- [78] M. Parrinello and A. Rahman, “Polymorphic transitions in single crystals: A new molecular dynamics method,” J. Appl. Phys., vol. 52, no. 12, pp. 7182–7190, 1981.
- [79] D. G. Sangiovanni, F. Tasnádi, T. Harrington, M. Odén, K. S. Vecchio, and I. A. Abrikosov, “Temperature-dependent elastic properties of binary and multicomponent high-entropy refractory carbides,” Mater. Des., vol. 204, p. 109634, 2021.
- [80] A. P. Thompson, H. M. Aktulga, R. Berger, D. S. Bolintineanu, W. M. Brown, P. S. Crozier, P. J. in ’t Veld, A. Kohlmeyer, S. G. Moore, T. D. Nguyen, R. Shan, M. J. Stevens, J. Tranchida, C. Trott, and S. J. Plimpton, “LAMMPS - a flexible simulation tool for particle-based materials modeling at the atomic, meso, and continuum scales,” Comp. Phys. Comm., vol. 271, p. 108171, 2022.
- [81] E. V. Podryabinkin and A. V. Shapeev, “Active learning of linearly parametrized interatomic potentials,” Comput. Mater. Sci., vol. 140, pp. 171–180, 2017.
- [82] P. Andric and W. Curtin, “New theory for mode I crack-tip dislocation emission,” J. Mech. Phys. Solids, vol. 106, pp. 315–337, 2017.
- [83] T. C. Ting, Anisotropic elasticity: theory and applications, vol. 45. Oxford university press, 1996.
- [84] M. Schaffer, B. Schaffer, and Q. Ramasse, “Sample preparation for atomic-resolution stem at low voltages by fib,” Ultramicroscopy, vol. 114, pp. 62–71, 2012.