Euclid Quick Data Release (Q1)
Galaxy major mergers are indicated as one of the principal pathways to trigger active galactic nuclei (AGN). We present the first detection of major mergers in the Euclid Deep Fields and analyse their connection with AGN, showcasing the statistical power of the Euclid data. We constructed a stellar-mass-complete () sample of galaxies from the first quick data release (Q1), in the redshift range –2. We selected AGN using X-ray detections, optical spectroscopy, mid-infrared (MIR) colours, and processing observations with an image decomposition algorithm. We used convolutional neural networks trained on cosmological hydrodynamic simulations to classify galaxies as mergers and non-mergers. We found a larger fraction of AGN in mergers compared to the non-merger controls for all AGN selections, with AGN excess factors ranging from 2 to 6. The largest excess is seen in the MIR-selected AGN. Likewise, a generally larger merger fraction () is seen in active galaxies than in the non-active controls, with the excess depending on the AGN selection method. Furthermore, we analysed as a function of the AGN bolometric luminosity () and the contribution of the point-source component to the total galaxy light in the -band () as a proxy for the relative AGN contribution fraction. We uncovered a rising , with increasing up to , after which we observed a decreasing trend. In the range –0.7, mergers appear to be the dominant AGN fuelling mechanism. We then derived the point-source luminosity () and showed that monotonically increases as a function of at , with for . Similarly, at , rises as a function of , though mergers do not dominate until . For the X-ray and spectroscopically detected AGN we derived the bolometric luminosity, , which has a positive correlation with for X-ray AGN, while there is a less pronounced trend for spectroscopically-selected AGN due to the smaller sample size. At , AGN mostly reside in mergers. We concluded that mergers are most strongly associated with the most powerful and dust-obscured AGN, typically linked to a fast-growing phase of the supermassive black hole, while other mechanisms, such as secular processes, might be the trigger of less luminous and dominant AGN.
Key Words.:
Galaxies: interactions – Galaxies: evolution – Galaxies: active – Galaxies: statistics1 Introduction
Galaxy mergers have long been considered a key driver of galaxy evolution, with the potential to significantly influence the growth and properties of both the host galaxies and their central supermassive black holes (SMBHs; Sanders et al. 1988; Marconi et al. 2004). Tidal forces during the encounters can lead to gas inflows towards the central regions (Barnes & Hernquist 1996), feeding intense nuclear star formation and active galactic nucleus (AGN) activity (e.g., Springel et al. 2005; Somerville & Davé 2015; Blumenthal & Barnes 2018a). Consequently, this process can trigger AGN feedback, which could severely affect the evolution of a galaxy, for example, by driving galactic-scale outflows and suppressing or enhancing star formation (e.g., Fabian 2012; Harrison et al. 2018). Therefore, understanding the connection between mergers and AGN is crucial for advancing our knowledge of galaxy evolution and the formation of large-scale structure (Alexander & Hickox 2012; Heckman & Best 2014).
Previous studies have generally shown that mergers can trigger AGN activation; however, the exact mechanisms driving this process remain poorly understood. While many simulation-based studies suggest that mergers fuel SMBH accretion and initiate the AGN phase (e.g., Hopkins et al. 2008; Blecha et al. 2018), other simulations propose that mergers serve only as a secondary fuelling mechanism (e.g., Di Matteo et al. 2003; Martin et al. 2018; Byrne-Mamahit et al. 2023). Similarly, mixed results also emerge from observations. For example, multiple observational studies report a clear link between mergers and AGN triggering (Lackner et al. 2014; Kocevski et al. 2015; Goulding et al. 2018; Ellison et al. 2019; Gao et al. 2020; Toba et al. 2022; Tanaka et al. 2023; Bickley et al. 2024), with a possible dependency on AGN luminosity (Treister et al. 2012; Weigel et al. 2018; Pierce et al. 2022; La Marca et al. 2024), dust obscuration (Ricci et al. 2017, 2021; Donley et al. 2018), and environment (e.g., Koulouridis et al. 2006, 2024). However, other studies highlight that mergers are a less significant mechanism, being outnumbered by secular processes (Grogin et al. 2005; Allevato et al. 2011; Draper & Ballantyne 2012; Marian et al. 2019; Silva et al. 2021; Smethurst et al. 2023; Villforth 2023; Bichang’a et al. 2024). Additionally, no dependence on AGN luminosity has been observed in several studies (Hewlett et al. 2017; Villforth et al. 2017; Comerford et al. 2024).
This ongoing debate could arise from several factors. First, there are various methods to identify mergers, each with its advantages and limitations. Among the different methods, visual classification (Darg et al. 2010), close spectroscopic pairs (Knapen et al. 2015), and non-parametric morphological statistics (Nevin et al. 2019) have been widely employed in the past. More recently, several studies favoured machine learning (ML), in particular deep learning (DL) techniques (e.g., Wang et al. 2020). These methods are reproducible and, once trained, can process large samples efficiently (for a review, see Margalef-Bentabol et al. 2024). However, their performance depends on the specific task and is constrained by the quality of the training labels. Second, like in merger detections, there is no unique method to identify AGN. Since AGN exhibit a diverse range of observational signatures, they can be selected through a multitude of techniques, including X-ray detections, optical emission line ratios, variability, mid-infrared (MIR) colours, and radio emission (for a review, see Heckman & Best 2014). Not all AGN present the same signatures of ongoing activity. As a result, different selection methods can lead to AGN and host galaxy samples with very different characteristics (Silverman et al. 2008; Hickox & Alexander 2018). For these reasons, a panchromatic approach has emerged as a necessity to properly investigate the merger and AGN connection accounting for different AGN types (Li et al. 2023).
La Marca et al. (2024) exploited a large multi-wavelength dataset in one of the equatorial fields of the Galaxy and Mass Assembly survey (GAMA; Driver et al. 2011) at and estimated the AGN contribution fraction parameter, which measures the AGN light contribution to the total galaxy light, through spectral energy distribution (SED) modelling in the rest-frame wavelength range 3–30 . The AGN were selected with multiple diagnostics, that is X-ray, MIR, and SED modelling and a relation was proposed between the merger fraction and the AGN fraction relation, which revealed two distinct regimes. When the AGN is not dominant (low AGN fraction), the fraction of mergers stays roughly constant, with mergers representing only a secondary AGN triggering mechanism. However, for very dominant AGN, where the AGN fraction exceeds 0.8, the merger fraction rises rapidly towards 100%. A similar picture is observed in the merger fraction as a function of the AGN bolometric luminosity. These findings could explain some of the conflicting results in the literature. Secular processes may be the principal fuelling mechanisms in non-dominant and relatively faint AGN, while major mergers are the main or only viable channel to trigger the most powerful and dominant AGN.
So far, a lack of large survey data at high redshift limits our understanding of the merger and AGN relation and its evolution. To improve our knowledge, particularly at earlier epochs, we need several key ingredients, including deep imaging data with high spatial resolution to perform morphological classification, large volumes to construct large statistical samples, and multi-wavelength coverage to reliably select a diverse sample of AGN and derive physical properties of AGN and their host galaxies. The advent of Euclid and the associated ancillary data finally offers the opportunity to investigate this problem throughout cosmic history, up to “cosmic noon”. Euclid is a European Space Agency (ESA) mission (Laureijs et al. 2011), which aims to observe almost all of the extra-Galactic sky with two surveys, with its scientific objectives outlined in Euclid Collaboration: Mellier et al. (2024). Euclid operates in the optical and near-infrared (near-IR) in four bands (, , , and ) covering wavelengths from 0.53 to 2.02 , (Euclid Collaboration: Cropper et al. 2024; Euclid Collaboration: Jahnke et al. 2024). Although Euclid was designed as a cosmology mission, it will be able to detect billions of sources, of which at least million are expected to be AGN detected in (Euclid Collaboration: Bisigello et al. 2024; Euclid Collaboration: Selwood et al. 2025) and hundreds of thousands in the near-IR bands (Euclid Collaboration: Lusso et al. 2024). This will dramatically increase the number of known AGN with high-resolution imaging, providing an unprecedented opportunity to study the role of mergers in the evolution of AGN.
This study aims to investigate the connection between mergers and AGN using the first quick release of the Euclid data (Euclid Quick Release Q1 2025, hereafter Q1). We construct a stellar mass-complete sample of galaxies across the redshift range , with multi-wavelength data ranging from the X-ray to the MIR. We revisit two facets of the merger and AGN connection: i) using a binary active/non-active AGN classification, we analyse whether mergers are a viable path to trigger AGN and assess their significance, and ii) exploring continuous AGN properties, we study how the fraction of mergers varies with AGN dominance and absolute power. Specifically, we explore whether galaxies hosting the most dominant and luminous AGN are more likely to be mergers. We develop a convolutional neural network (CNN) to identify mergers in Euclid images. To mitigate issues with visual classifications, we trained the CNN on mock Euclid observations generated from cosmological hydrodynamic simulations, which includes galaxy merger histories. We use four different diagnostics to select AGN and characterise each AGN based on the central point source luminosity relative to the host galaxy and, when possible, its bolometric luminosity.
The manuscript is organised as follows. In Sect. 2, we first introduce the Euclid data products used in this work, including catalogues, imaging data, and ancillary multi-wavelength data, along with our galaxy sample selection. Then, we describe the mock Euclid observations generated from cosmological hydro-dynamical simulations to train our DL classifier. In Sect. 3, we present our galaxy merger classifier and the various AGN selection methods adopted. In Sect. 4, we first explore the merger and AGN connection using a binary classification of AGN and non-AGN. Next, we analyse this connection using continuous parameters that characterise the relative and absolute AGN power. Finally, we summarise our main findings in Sect. 6. Throughout the paper, unless otherwise stated, we assume a flat CDM Universe with , , and and express magnitudes in the AB system (Oke & Gunn 1983).
2 Data
In this section, we first describe the Euclid data, images, and catalogues. Then, we present a brief description of the multi-wavelength ancillary data, from the X-ray to the MIR. Finally, we introduce the mock Euclid VIS imaging data generated from the simulations.
2.1 Euclid data
This work focuses on exploring Q1, comprising data from a single visit of the Euclid Deep Fields (EDFs), namely the EDF North (EDF-N), the EDF South (EDF-S), and the EDF Fornax (EDF-F), covering a total area of . All EDFs have been observed in all four Euclid photometric bands, that is , , , and . These observations have been complemented by ground-based optical photometry taken with various instruments across the wavelength range 0.3–1.8 . Q1 includes imaging, spectroscopic data, and value-added catalogues, including photometric redshifts (photo-; Euclid Collaboration: Tucci et al. 2025). Further details on Q1 can be found in Euclid Collaboration: Aussel et al. (2025), Euclid Collaboration: McCracken et al. (2025), Euclid Collaboration: Polenta et al. (2025), and Euclid Collaboration: Romelli et al. (2025). All Euclid data used in this work, catalogues and images, have been retrieved using the ESA Datalabs facility (Navarro et al. 2024).
Catalogues.
We selected a sample of galaxies from the Euclid MER catalogue (Euclid Collaboration: Altieri et al. in prep.)
removing possible contaminants using the available columns as follows. First, we required a VIS detection by imposing VIS_DET . Then, we applied the condition DET_QUALITY_FLAG to filter out contaminants such as bad pixels, saturation, proximity to image borders, location within VIS or NIR bright star masks, presence within extended object areas, or omission by the deblending algorithm due to large pixel size.
Additional flags can be used to filter out further contaminants, such as the SPURIOUS_FLAG, which identifies spurious sources. We set this flag to to exclude such sources from our sample. Finally, we applied constraints on source flux and size by imposing MUMAX_MINUS_MAG to filter out point-like sources and FLUX_DETECTION_TOTAL to exclude faint objects.
In addition to the photometric catalogue, we queried the official pipeline photo- and stellar masses for each source (Euclid Collaboration: Tucci et al. 2025). We excluded objects flagged (greater or equal to 1) by either PHZ_FLAGS, PHYS_PARAM_FLAGS, or QUALITY_FLAG. When available, we used photometric redshifts and stellar masses estimated by Euclid Collaboration: Enia et al. (2025), which complemented the Euclid data with public IRAC observations for an improved quality of the recovered parameters. Finally, we limited our selection to galaxies within the redshift range photo- and with stellar mass . These galaxy parameters are given with their probability distributions and a set of possible values, from which we adopted the median values when applying these selections. The cut on stellar mass is motivated by our requirement of selecting a stellar mass complete sample, since Euclid Collaboration: Enia et al. (2025) showed that at the Euclid galaxy sample is complete at , based on the Pozzetti et al. (2010) methodology.
Images. For our task of identifying mergers, we utilised VIS imaging data, which have a pixel resolution of and a signal-to-noise ratio at (Euclid Collaboration: Cropper et al. 2024). For each galaxy in the selected sample, we made an (corresponding to a pixel grid) thumbnail centred on the source. This size approximately corresponds to a physical scale of in the redshift range considered. We excluded sources for which generating an cutout was not feasible because they are at the edge of the field. Additionally, we retrieved the VIS point spread function (PSF) which was used when constructing the training dataset.
Ancillary data. Q1 is complemented by ancillary multi-wavelength datasets from photometric surveys, including X-ray data from XMM-Newton, Chandra and eROSITA (hereafter RW25; Euclid Collaboration: Roster et al. 2025, and references therein), GALEX (Galaxy Evolution Explorer; Bianchi et al. 2017), Hyper Suprime-Cam (HSC; Miyazaki et al. 2018), Gaia (Gaia Collaboration et al. 2016), UNIONS (Ultraviolet Near-Infrared Optical Northern Survey; Gwyn et al. in prep.), DES (Dark Energy Survey; The Dark Energy Survey Collaboration 2005), the Dark Energy Spectroscopic Instrument (DESI; DESI Collaboration et al. 2016, 2022) Legacy Imaging Surveys (Dey et al. 2019) and spectroscopic survey, and the WISE-AllWISE DR6 survey data (Wright et al. 2010). To create multi-wavelength catalogues for each one of the EDFs, Euclid Collaboration: Matamoro Zatarain et al. (2025, hereafter MZ25) performed positional matches with the external surveys using the software STILTS, version 3.5–1 (Taylor 2006). The matching process was customised for each EDF to account for differences in sky coverage. For detailed information on the matching procedure, including the radii used and selection criteria applied, we refer the reader to MZ25.
2.2 The IllustrisTNG galaxy sample
To train our merger identification model, we used simulated galaxies from the IllustrisTNG (hereafter TNG) cosmological hydrodynamical simulations, which provide detailed merger histories in large cosmological volumes, ensuring a large sample of galaxies. The TNG simulation consists of three different volumes varying in physical size and mass resolution (Marinacci et al. 2018; Naiman et al. 2018; Nelson et al. 2018; Pillepich et al. 2018; Springel et al. 2018). We used the TNG100 and TNG300 boxes (hereafter referred to as the TNG simulation), with their box size corresponding to Mpc and Mpc, respectively. The baryonic matter resolution is in TNG100 and in TNG300. Using both TNG suites allows us to confidently select galaxies down to in TNG100, and to have a large sample of galaxies thanks to the TNG300 size. We required a minimum of about baryonic particles, which, for TNG100, correspond to galaxies with stellar mass , while for TNG300 the lower mass limit is .
We selected galaxies within the redshift range –2, corresponding to simulation snapshot numbers –33. The time step between each snapshot is . For each galaxy, the TNG simulation provides a complete merger history (Rodriguez-Gomez et al. 2015) identified through the Subfind algorithm (Springel et al. 2001). We then define a subhalo as a merger if a merger event occurred in the previous 300 Myr or will occur within the next 800 Myr. Otherwise, the subhalo is considered a non-merger. This time window is motivated by simulation studies (e.g., Moreno et al. 2019), which show that during this period, the majority of gas is transferred between galaxies, leading to enhanced star formation and nuclear activity. Here we considered only major merger events, with a stellar mass ratio . This selection includes pre-mergers (close galaxy pairs expected to merge within 800 Myr), ongoing mergers, and recent post-mergers. As such, we sample a significant fraction of the merger timescale, covering the late stages of the dynamical interaction and the immediate aftermath of coalescence, but excluding wide pairs that are still in the early interaction phase. It is important to note that the merger rate and its evolution in hydrodynamical simulations such as TNG depend on the underlying galaxy-halo connection implemented in the simulation. Different simulations with distinct prescriptions for galaxy formation physics can yield different merger rates (e.g., Grylls et al. 2020).
The dataset was divided into training, validation, and testing sets, corresponding to 80%, 10%, and 10% of the total sample, respectively. We ensured that galaxies involved in the same merger sequence were included in only one subset. These datasets result in 499 523 galaxies for the training sample (427 577 from TNG300 and 71 946 from TNG100), 54 911 for the validation set (46 660 from TNG300 and 8251 from TNG100), 61 697 for the testing set (52 875 from TNG300 and 8822 from TNG100). Of these, 250 142, 26 999, and 30 986 are mergers, respectively. In each set, we balanced the number of non-mergers to that of mergers.
We generated mock observations for the TNG galaxies following the Margalef-Bentabol et al. (2024) methodology. We prepared the mock VIS -band observations, at the same pixel resolution of , as follows.
-
1.
Each stellar particle contributes to the galaxy’s SED, determined by its mass, age, and metallicity. These SEDs are derived from the stellar population synthesis models of Bruzual & Charlot (2003). The summed SED was passed through the VIS filter to generate a smoothed 2D projected map (Rodriguez-Gomez et al. 2015). The image is then cropped to , corresponding to approximately in the relevant redshift range, matching the size used for the Euclid galaxy images.
-
2.
Each image was convolved with a VIS PSF, randomly chosen to account for the spatial variation of the PSF across the field of view.
-
3.
Poisson noise was added to each image to simulate the statistical variation in photon emission from sources over time.
-
4.
To ensure realistic merger classifications, it is essential to include observational effects (e.g., Huertas-Company et al. 2019; Rodriguez-Gomez et al. 2015). We injected the TNG galaxies into actual Euclid sky cutouts of . To prepare the sky cutouts, we generated random coordinates within the area covered by Q1 data. We controlled the segmentation map for each coordinate, ensuring that within a box, all pixels were set to zero111This constraint ensures that there are no detected sources or artefacts in each image pixel. The radius is derived from the estimated source density of the EDFs.. When creating the cutouts, we controlled that there were no invalid pixels (NaN values) and that the selected coordinates allowed for a perfectly square cutout without intersecting the edge of a tile.
To create a training sample that accounts for possible AGN, we added a central point source to the host galaxies. The central source intensity can be defined in relation to the host galaxy flux, given the PSF fraction ():
| (1) |
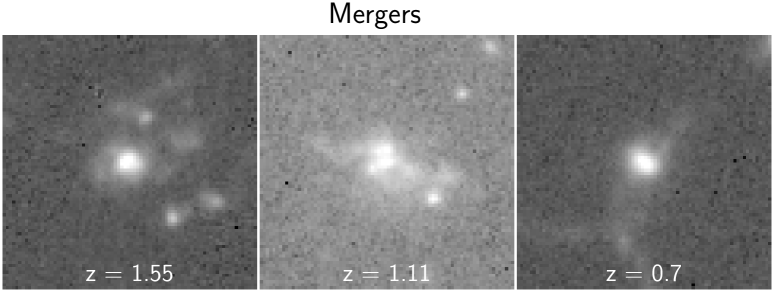
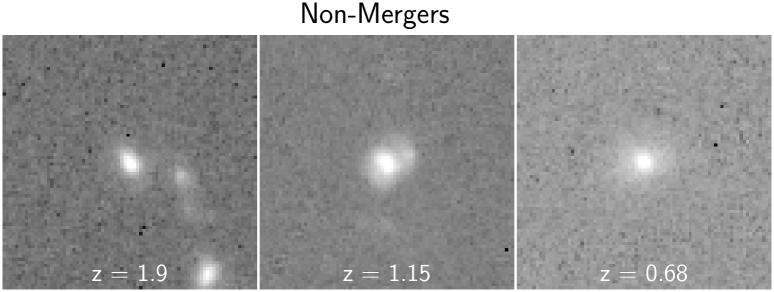
where and are the fluxes within a aperture of the central source and the host galaxy, respectively. The observed VIS PSF models were used as the central point source. The values were uniformly chosen in the range –1. This operation was performed for a randomly selected 20% of the TNG sample. We show examples of the final mock observations in Fig. 1. To see the effect of each step in the mock observations generation, we refer the reader to Margalef-Bentabol et al. (2024).
Our mock images are generated without incorporating dust attenuation, which may be particularly important at , where the observed -band corresponds to rest-frame ultraviolet wavelengths. At these wavelengths, dust can significantly alter galaxy morphology, and future improvements are needed to overcome this limitation.
We normalised each image following Bottrell et al. (2019). This normalisation ensures that all images are in a hyperbolic arcsin scale within the range 0–1, maximising the contrast of the central target. A summary of the main steps of this normalisation is provided below (see Bottrell et al. 2019, for a detailed description).
-
i)
We took the hyperbolic arcsin of the images. Values below were converted to NaNs.
-
ii)
We computed the median of each image, , and the 99th percentile, , considering a central box of side 25 pixels.
-
iii)
All values below were set to , including the NaNs. Values above were set to . The resulting clipped images were normalised by subtracting and dividing by .
This mock Euclid dataset was used to train, validate, and test our merger classifier, as described in the next section.
3 Methodology
Here, we first present the DL classifier we developed to identify mergers in Euclid images. We then describe the various techniques used to select AGN.
3.1 Merger classification using CNNs
| Layer type | No. param. | Output shape | Properties | |||||
|---|---|---|---|---|---|---|---|---|
| Input | 0 | (1,80,80) | ||||||
|
1600 | (32,80,80) |
|
|||||
| Max Pooling | 0 | (32,40,40) | pool size 2 | |||||
| Dropout | 0 | (32,40,40) | 30% | |||||
|
100 416 | (64,40,40) |
|
|||||
| Max Pooling | 0 | (64,20,20) | pool size 2 | |||||
| Dropout | 0 | (64,20,20) | 30% | |||||
| Batch Norm. | 256 | (64,20,20) | ||||||
|
401 536 | (128,20,20) |
|
|||||
| Max Pooling | 0 | (128,10,10) | pool size 2 | |||||
| Dropout | 0 | (128,10,10) | 30% | |||||
|
802 944 | (128,10,10) |
|
|||||
| Max Pooling | 0 | (128,5,5) | pool size 2 | |||||
| Dropout | 0 | (128,5,5) | 30% | |||||
| Flatten | 0 | (32 000) | ||||||
| Dense | 819 456 | (256) |
|
|||||
| Dropout | 0 | (256) | 30% | |||||
| Dense | 32 896 | (128) |
|
|||||
| Dropout | 0 | (128) | 30% | |||||
| Dense | 129 | (1) |
|
We developed a CNN (Lecun et al. 1998) to classify mergers and non-mergers. CNNs consist of multiple layers that apply learnable filters to an input image to capture features such as edges and textures. The later layers of the network are typically fully connected, combining the features from earlier layers to calculate a classification for the input image. The architecture developed in this work is presented in Table 1, for which we utilised the Keras framework for the TensorFlow platform (Chollet 2023; Abadi et al. 2016). The CNN consists of four convolutional layers and three fully-connected layers. For all layers, we adopted a rectified linear unit (ReLU) as an activation function, except for the final layer where a sigmoid activation function was used. A stride of one pixel was used for the convolutional layers. We introduced dropout layers after each processing layer to prevent overfitting. These dropout layers randomly set input units to zero at a specified rate. To further prevent overfitting, early stopping in the training phase was used. The specific hyper-parameters, listed in Table 1, include filter numbers and sizes, dropout rates, and strides, chosen based on a grid search.
| Class | Precision | Recall | F1-score |
|---|---|---|---|
| Mergers | 0.80 | 0.68 | 0.74 |
| Non-mergers | 0.72 | 0.83 | 0.77 |
We evaluated the model performance on the test set from the TNG simulations, using common metrics such as “precision”, “recall”, and “F1-score”. Precision measures how often the model correctly predicts a given class, while recall focuses on how complete the model is at finding objects in a given class. In other words, precision is the number of objects correctly recovered for a class divided by the total number of objects predicted in that class. Recall is the number of objects correctly recovered for a class divided by the total number of objects in that class. F1-score is the harmonic mean of precision and recall. All metrics are calculated on a balanced sample (50% mergers and 50% non-mergers).
In this work, we are interested in selecting a pure sample of mergers. Hence, we followed La Marca et al. (2024) to have a higher classification precision for mergers. We searched for a threshold which maximises the F1-score to identify mergers while maintaining a precision greater than or equal to for the merger class. According to these prescriptions, the best threshold for mergers is , thus, all galaxies with a predicted score greater than are classified as mergers. Similarly, to select a sample of non-mergers with low contamination levels, we searched for a threshold that ensures at least 0.70 precision for non-mergers, maximising the F1-score. We lowered the precision to 0.70 given the poorer precision of our classifier for the non-merger class. It is important to highlight that the expected number of non-mergers is much larger than that of interacting galaxies (e.g., Ferreira et al. 2020). Therefore, in real galaxies, we expect a much lower contamination of mergers in predicted non-mergers. The set threshold is 0.35, meaning all galaxies with a predicted score below 0.35 are labelled as non-mergers. Performance metrics for mergers and non-mergers are shown in Table 2. Setting a larger threshold for mergers and a lower one for non-mergers will further improve the purity of both classes, but also strongly affect their completeness, limiting the sample size of both classes.
The model performance is comparable with the performance of other recent studies. Margalef-Bentabol et al. (2024) benchmarked several state-of-the-art methods to identify major mergers in astronomical images out to . Each model was trained on mock observations from cosmological hydrodynamical simulations, where mergers have been defined in a similar fashion to this work. Based on the performance metrics on the TNG-test set, the best model in Margalef-Bentabol et al. (2024, Table 3) obtained a precision of 0.80 and a recall of 0.74 (F1-score 0.77) for the merger class, which is consistent with the performance for mergers we report in Table 2.
The Euclid collaboration also provides detailed morphologies (Euclid Collaboration: Walmsley et al. 2025), including possible companions and merger features, based on predictions from the Bayesian DL classifier Zoobot (Walmsley et al. 2022). However, these predictions are limited to the top brightest and most extended galaxies, with the selection criteria being segmentation_area OR AND segmentation_area . In comparison, our stellar mass-complete sample goes down to mag. Therefore, we developed our own classifier. We compare our model predictions with the Zoobot classification for the common galaxies in Appendix A.
The double threshold approach has the side effect of producing unclassified galaxies, defined as those with a predicted score between 0.35 and 0.59, inclusive. However, given the large sample size of Q1, this does not affect the analysis carried out in this work. The Euclid galaxy sample constructed contains sources classified as mergers, as non-mergers, and unclassified objects. These values correspond to , , and shares of the whole sample, respectively. Hereafter, we focus on the classified galaxies and calculate merger fractions as
| (2) |
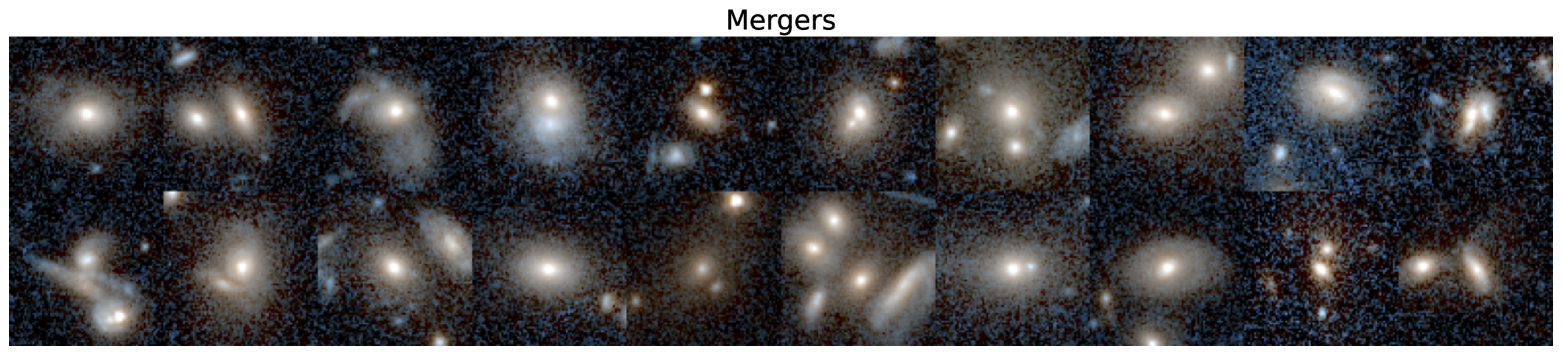
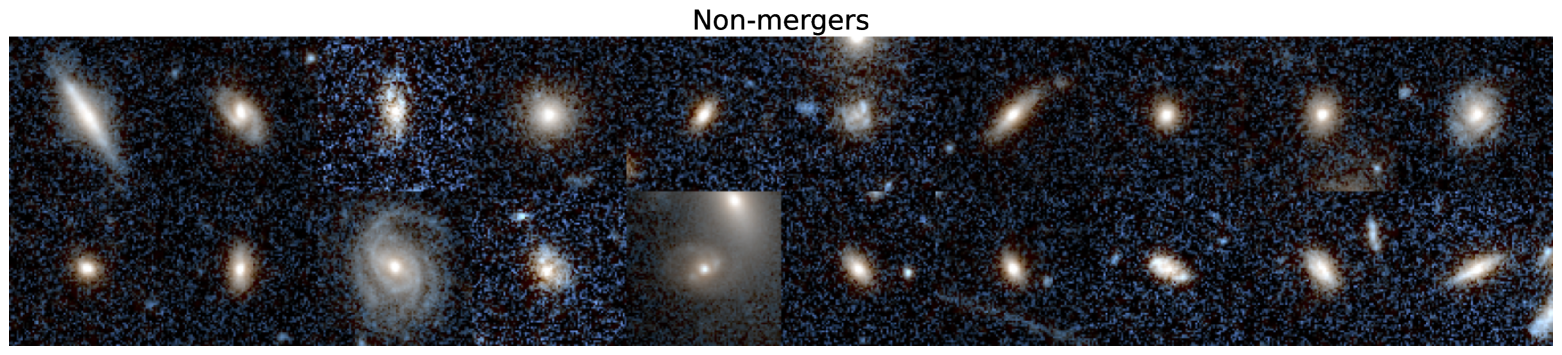
unless differently stated. We show some randomly selected Euclid merger and non-merger examples in Fig. 2. Examples of unclassified galaxies are provided in Appendix B. Most galaxies classified as mergers are pair galaxies, with close companions clearly visible in the images. In comparison, non-merger galaxies appear to be quite regular and isolated. Here, we point out that two close galaxies, if both detected, were considered individually rather than as a single system.
3.2 AGN identification
| AGN selection method | Reference | Description | No. |
| X-ray | RW25 | Extragalactic point-like X-rays sources from | 437 |
| 4XMM-DR13, CSC2, and eROSITA surveys | |||
| DESI, spectroscopy | Siudek et al. (2024) | Spectroscopic diagnostics based on emission | 160 |
| lines for the matched DESI sources (see Sect. 3) | |||
| DL-based | MB25 | Galaxies with a predicted , based on | |
| VIS images | |||
| C75, AllWISE | A18 | 75% Completeness-optimised MIR diagnostic | |
| Eq. (3) applied to the AllWISE data | |||
| R90, AllWISE | A18 | 90% Reliability-optimised MIR diagnostic | 556 |
| Eq. (4) applied to the AllWISE data |
The Q1 data are accompanied by a set of multi-wavelength catalogues allowing multiple AGN selections. This work focuses on four main AGN detection techniques: X-ray, optical spectroscopy, DL-based image decomposition, and MIR colours. The first Euclid AGN catalogue is presented in MZ25 and includes all these AGN selections, except the DL-based image decomposition method, described in Euclid Collaboration: Margalef-Bentabol et al. (2025, hereafter MB25). The AGN-selection techniques are detailed in these two papers. Here, we summarise the main aspects of the criteria used.
-
•
MIR colour selections defined in Assef et al. (2018, hereafter A18). MZ25 used two different diagnostics, C75 and R90, to select MIR AGN among the sources with AllWISE fluxes. The C75 selection, focusing on achieving 75% completeness, is defined as
(3) while the R90 diagnostic, optimised for obtaining 90% reliability, is
(4) These criteria were accompanied by some extra conditions. We only considered sources with and magnitudes fainter than the saturation limits of the survey set as and (Vega magnitudes), with S/N, and not flagged as either artefacts or affected by artefacts, meaning that the
cc_flagsare equal to zero (MZ25). In the case of EDF-F and EDF-S, multiple WISE fluxes are available, including the AllWISE and the LegacyDR10 WISE fluxes. The main difference is that the latter are obtained through forced photometry at the locations of the Legacy Surveys optical sources, resulting in a larger number of matches with Euclid counterparts. Moreover, the extra conditions of the A18 diagnostics are not easily applicable to the LegacyDR10 WISE data. Therefore, considering that the EDF-N has only AllWISE data, we decided to work with the AllWISE MIR data also for EDF-F and EDF-S. -
•
Sources with an X-ray counterpart identified by RW25. Several X-ray surveys observed the EDFs, such as the XMM-Newton 4XMM-DR13 survey (Webb et al. 2020), the Chandra Source Catalogue v.2.0 (CSC2; Evans et al. 2024), and the eROSITA DR1 Main sample (Predehl et al. 2021; Merloni et al. 2024). RW25 identified Q1 counterparts from these X-ray surveys using the Bayesian algorithm NWAY (Salvato et al. 2018). The final product is a catalogue of Q1 sources matched with several X-ray point-like sources. This catalogue also includes spectroscopic redshift, if available, otherwise photo-, X-ray luminosities (), and a galactic/extragalactic probability (Gal_proba). We refer the reader to RW25 for more details about the optical-X-ray matching procedure and the catalogue generation. To select a pure sample of X-ray AGN, we selected only sources with match_flag , Gal_proba , optical signal-to-noise , and . This soft X-ray luminosity threshold is generally sufficient for isolating AGN from other X-ray sources (Aird et al. 2017).
-
•
The MZ25 multi-wavelength catalogue provided DESI spectroscopic counterparts for 42 706 galaxies, allowing for spectroscopic AGN detection. We ran several diagnostics to identify quasars (QSOs) and AGN candidates based on these spectroscopic data. To select QSOs, we utilised the DESI spectral-type classification (SPECTYPE=QSO; DESI Collaboration et al. 2024). For sources classified as galaxies (SPECTYPE=GALAXY), we used several methods to identify AGN based on emission line fluxes, widths, and equivalent widths measured with
FastSpecFit(Moustakas et al. 2023). MZ25 reports the details of these measurements, available for 40 274 of the DESI EDR Q1 sources. This sample was accompanied by SED fitting performed by Siudek et al. (2024), which provided stellar masses and AGN properties. They only kept sources with an SED fit with a reduced . With these criteria, we found 160 counterparts in our stellar-mass-limited sample. -
•
MB25 trained a DL-based algorithm to perform image decomposition in the VIS imaging data and provide an estimate of the PSF contribution () with respect to the total galaxy light in the observed flux. This technique was applied to all galaxies in the constructed sample. For a complete description of the method, we refer the reader to MB25. Here, we labelled as DL-based AGN those galaxies with , which corresponds to a 4 cut given the mean uncertainty in the estimates. We also calculated the AGN luminosity in the VIS filter, as approximated by the luminosity of the PSF component . First, we multiplied the total galaxy flux in the VIS band by the predicted to obtain the central component flux. Then, this flux is converted to a luminosity given the galaxy redshift. Note that this luminosity is inferred from the observed fluxes.
In total, our sample includes classified galaxies hosting an AGN identified by at least one of the selection methods above.444Considering the whole sample, i.e., classified plus unclassified galaxies, about 39% of AGN are labelled as unclassified, similar to the non-AGN population, where the unclassified fraction is 36%. The number of AGN identified per selection method is reported in Table 3. Many AGN have multiple detections. We show the intersection of the AGN selections in Appendix C. The MZ25 Q1 AGN catalogue includes a variety of AGN selections, among which an AGN identification diagnostic based on Euclid’s photometry alone (Euclid Collaboration: Bisigello et al. 2024). However, we did not consider this selection because its purity and completeness are poor in the absence of -band observations. Moreover, this methodology is oriented toward obtaining a clean sample of quasars, which requires constraints on the point-like morphology of the source, which will bias against the detection of potential merging features.
For DESI- and X-ray-selected AGN, we computed the AGN bolometric luminosity. In the first case, we utilised the estimated through SED fitting by Siudek et al. (2024). The SED fitting was performed using Code Investigating GALaxy Emission (CIGALE v2022.1; Boquien et al. 2019; Yang et al. 2020, 2022), assuming for the AGN contribution the Fritz et al. (2006) templates. Siudek et al. (2024) found a close agreement between the derived from Chandra and SED fitting, with a median difference of . For the X-ray AGN, we used the X-ray luminosities () from RW25, which we converted into bolometric luminosities using the conversion factors from Shen et al. (2020). Specifically, we used the double power law:
| (5) |
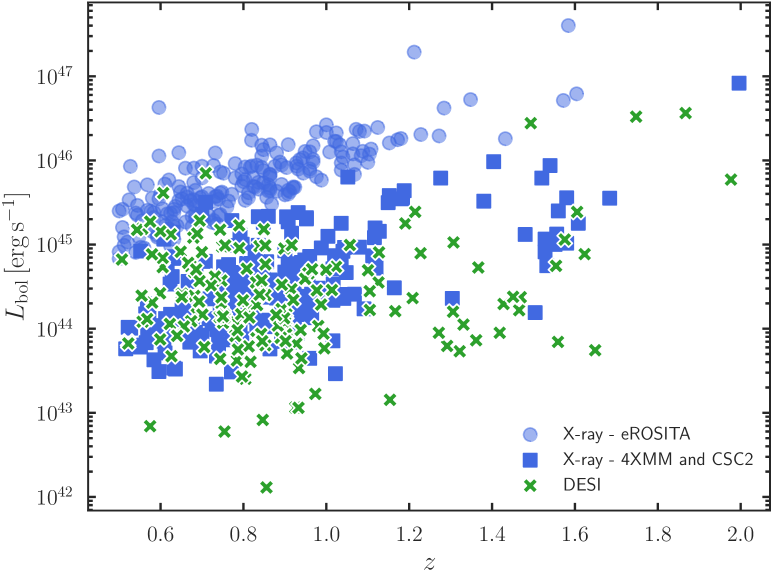
where , , , and . We show how evolves with redshift for DESI and X-ray AGN in Fig. 3. X-ray sources are shown separately to highlight the difference in the survey characteristics (RW25). 4XMM and CSC2 are deeper surveys compared to eROSITA, which covers a larger area but is biased toward brighter AGN ().
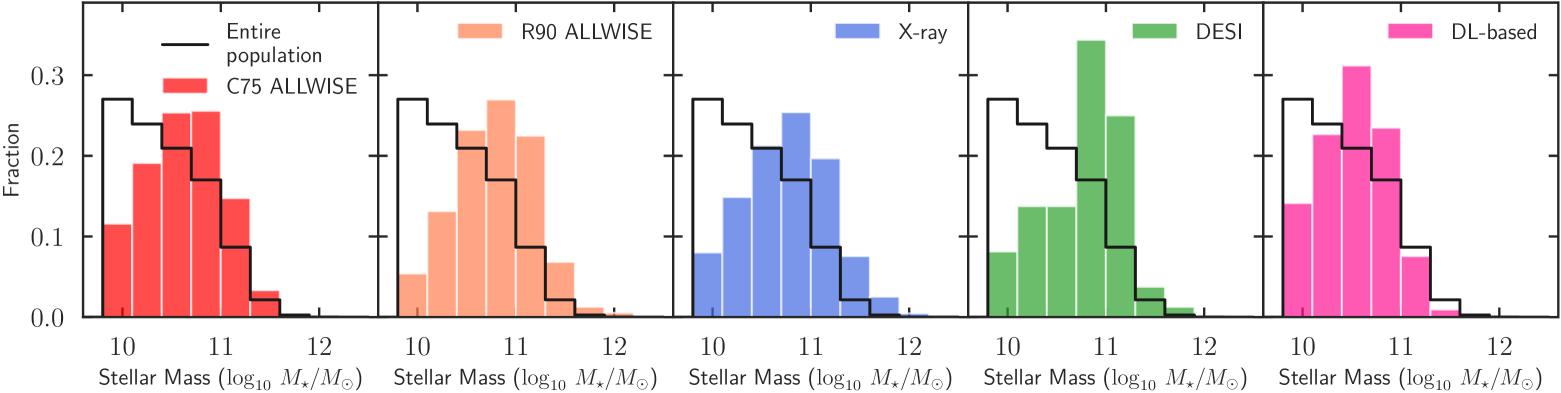
Different AGN selections correspond to different host galaxy properties (e.g., Silverman et al. 2008). We compare the stellar mass of the AGN candidates hosts for the different AGN selections in Fig. 4, top panels. Compared to the entire galaxy sample (active and non-active galaxies), AGN candidates reside in more massive galaxies, with their distribution peaking at –. Nevertheless, we should bear in mind that the stellar masses derived by Euclid Collaboration: Enia et al. (2025) or the official Euclid pipeline do not consider the AGN component, which could bias the estimates of the of AGN host galaxies. For example, the Euclid Collaboration: Enia et al. (2025) are systematically lower by 0.07 dex compared to those derived for the DESI sample, which included an AGN component in their SED fitting (Siudek et al. 2024).
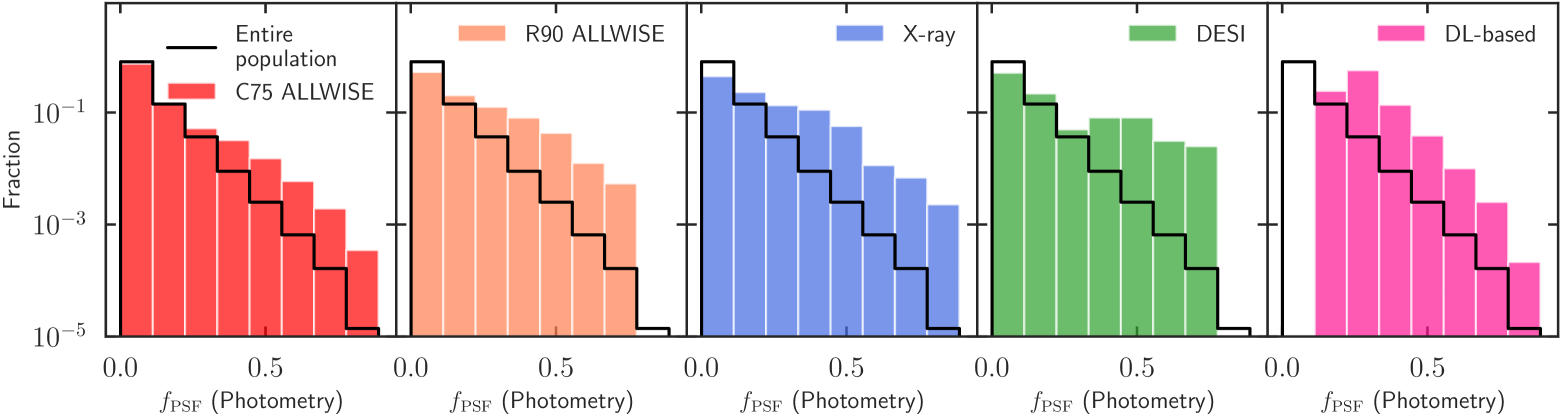
There are also some differences among the different AGN selections. DESI AGN live in extremely massive galaxies, with more than of these galaxies having . X-ray AGN and R90 MIR AGN tend to be in slightly less massive galaxies, with average , in agreement with previous studies (Bongiorno et al. 2012; Mountrichas et al. 2021). DL-based and C75 MIR AGN inhabit the least massive galaxies, with average . Also in this case, we found agreement with previous studies in the literature (e.g., Bornancini et al. 2022). These differences might be due to selection biases. DESI AGN are spectroscopically selected and so are naturally more likely to be in brighter, hence more massive, galaxies. Similarly, the difference between the stellar masses of R90 and C75 MIR AGN candidates hosts is expected because redder colours and brighter magnitudes are required (A18) to select more reliable samples of AGN. The DL algorithm used to identify AGN components was trained using galaxies down to . Thus, it is not surprising that this method allows us to select AGN in less massive galaxies than the other methods. In Fig. 4, bottom panels, we compare the distribution for the different AGN selections. As expected, all AGN types show a larger fraction of galaxies with higher values compared to the entire galaxy sample. It is not surprising that the largest fraction of galaxies is observed in DESI AGN, these being optically selected spectroscopic AGN. However, we might be missing the extremely dominant point sources () because CIGALE fails to estimate the stellar mass correctly when the AGN outshines the host galaxy. In Appendix C, we also compared the redshift distributions of each AGN selection.
4 Results
In this section, we first construct control samples of mergers and non-mergers and AGN and non-AGN galaxies. Then, we investigate the merger and AGN relation by adopting a binary AGN/non-AGN classification and exploring continuous AGN parameters. All experiments are divided into two redshift bins, which are , and , with roughly equal numbers of AGN.
4.1 Control pools
Proper control samples are crucial as AGN occurrence and the merger rate can depend on host galaxy properties such as stellar mass and redshift (e.g., Aird et al. 2012; Ferreira et al. 2020). Specifically, the merger and AGN control samples satisfy the following conditions,
| (6) | ||||
| (7) |
We chose these values according to the estimated normalised median absolute deviations for photo and (Euclid Collaboration: Enia et al. 2025). These two conditions ensure that each galaxy/AGN is compared with a sample of galaxies with similar redshift and stellar mass. For each galaxy/AGN in the original sample, we required at least 10 counterparts that satisfy these criteria. When more than 10 controls were found, we randomly picked 10 of them. If there are fewer than 10 controls, we iteratively increased our tolerances by a factor of 1.5 for each parameter. This operation is performed up to three times; otherwise, we rejected the galaxy/AGN. When constructing controls for AGN galaxies, we sampled from all galaxies that do not host any detected AGN, a pool of possible galaxies.
4.2 Merger and AGN relation using a binary AGN classification
In the first set of experiments, we investigated whether mergers can trigger AGN, by examining the incidence rate of AGN in mergers and non-merger controls, and whether they are the primary trigger, by comparing the merger fraction in AGN and non-AGN controls.
4.2.1 AGN frequency in mergers and non-mergers
| AGN type | M | NM (control) | Excess | M | NM (control) | Excess |
|---|---|---|---|---|---|---|
| X-ray | ||||||
| RW25 | (146/61 393) | (652/614 411) | (66/43 644) | (319/435 959) | ||
| DESI | ||||||
| Siudek et al. (2024) | (57/61 393) | (147/614 411) | (37/43 644) | (118/435 959) | ||
| DL-based | ||||||
| MB25 | (8196/61 393) | (26 779/614 411) | (4960/43 644) | (15 387/435 959) | ||
| C75 AllWISE | ||||||
| A18 | (420/61 393) | (2578/614 411) | (1902/43 644) | (11 195/435 959) | ||
| R90 AllWISE | ||||||
| A18 | (109/61 393) | (258/614 411) | (252/43 644) | (555/435 959) | ||
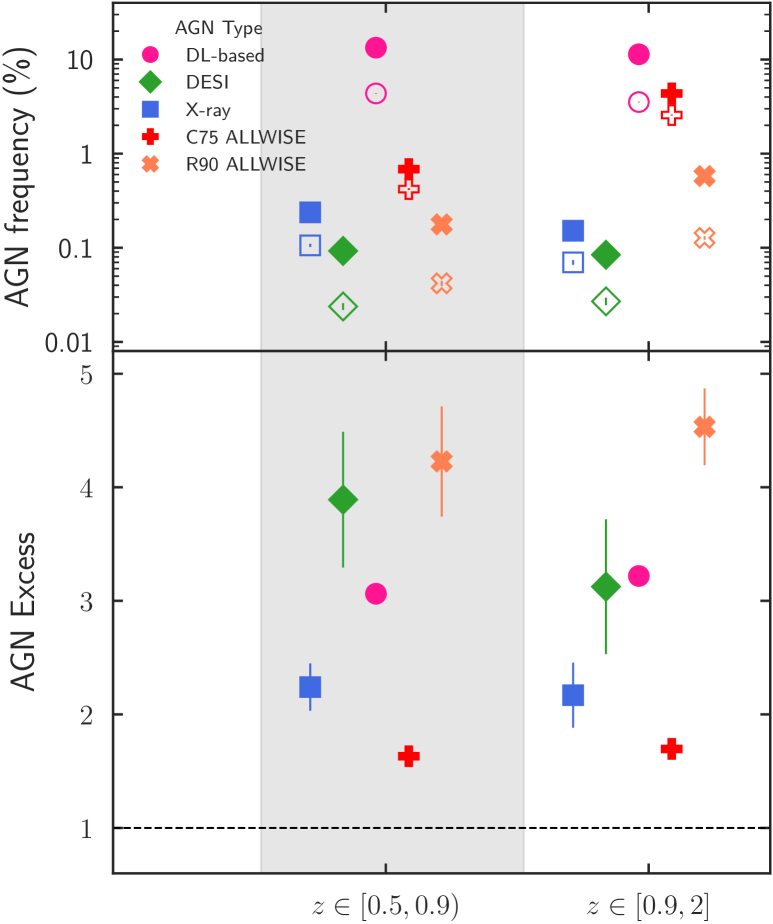
The frequency of AGN in mergers and respective non-merger controls, per AGN type, is reported in Table 4 and shown in Fig. 5. The frequencies and relative uncertainties are estimated using bootstrapping with resampling (1000 samples for each population). In both classes, the AGN frequency is defined as the ratio of identified AGN in the merger class to the total number of objects in the merger class:
| (8) |
For all AGN types, we observed a higher frequency of AGN in mergers than non-merger controls in both bins, demonstrating that mergers are a viable method to fuel accretion onto SMBHs. To show it more clearly, we calculated the AGN excess, defined as the ratio of the AGN frequency in mergers relative to non-mergers. The AGN excess is reported in Table 4 and the lower panel of Fig. 5. X-ray AGN show the same excess (2.2) relative to controls in both redshift bins. Similarly, DL-based, MIR C75 and R90 AGN have consistent excess in both bins, showing no clear signs of redshift evolution. On the contrary, DESI AGN go from an AGN excess of at , to at . However, this AGN selection shows larger uncertainties. Therefore one must be cautious in inferring any redshift trends. Interestingly, the two MIR AGN selections exhibit completely different AGN excesses, with a much higher excess in the purer R90 selection. This could indicate that the C75 selection is highly contaminated by non-AGN galaxies.
Our results are in agreement with previous studies that adopted the same AGN excess definition. The optical AGN excess we observed is consistent with the 3.7 AGN excess reported by Bickley et al. (2023) for similar AGN in post-mergers, but it is much higher than the upper bound of 1.5 for the optical AGN excess found by Gao et al. (2020) (sample selections in both works, and ). Regarding the X-ray AGN, the excess we found is comparable to the 1.8 excess found by Bickley et al. (2024, and ), the 1.9 excess found by La Marca et al. (2024, at and ), and the 2.2 excess reported by Lackner et al. (2014, and ). Nevertheless, La Marca et al. (2024) observed a much lower X-ray AGN excess of 1.3 at , while Secrest et al. (2020) found no statistically significant evidence for an X-ray AGN excess in post-mergers at and . However, the latter work showed a much larger excess for MIR-selected AGN, suggesting that AGN in post-mergers are more likely to be heavily obscured. In fact, several other studies reported a larger excess of MIR AGN in mergers compared to non-merger controls, reaching a factor of 3–7 (Goulding et al. 2018; Bickley et al. 2023; La Marca et al. 2024), which is in agreement with our results of the more reliable MIR AGN selection (R90).
Our results and previous studies allow for some robust conclusions and some speculation. These findings robustly imply that major mergers trigger and fuel AGN, independently of AGN selection and the redshift. Considering that the purest MIR AGN show a larger excess than other AGN selections, we could speculate that mergers are more strongly connected to the triggering of dust-obscured AGN. For example, a major merger could redistribute gas and dust within a galaxy, increasing the dust obscuration surrounding the central active nucleus. This obscuration, if particularly heavy, might also make the detection of optical and soft X-ray AGN more challenging, partially explaining the lower excesses for these AGN.
4.2.2 Merger fraction in AGN and non-AGN
| AGN type | (AGN) | (non-AGN controls) | (AGN) | (non-AGN controls) |
|---|---|---|---|---|
| X-ray | ||||
| RW25 | (146/288) | (726/2935) | (66/149) | (386/1435) |
| DESI | ||||
| Siudek et al. (2024) | (57/97) | (257/982) | (37/63) | (161/618) |
| DL-based | ||||
| MB25 | (8196/14 313) | (39 886/143 223) | (4906/9025) | (23 777/90 157) |
| C75 AllWISE | ||||
| A18 | (420/1041) | (2848/10 404) | (1902/4671) | (12 558/46 716) |
| R90 AllWISE | ||||
| A18 | (109/170) | (454/1705) | (252/386) | (1052/3855) |
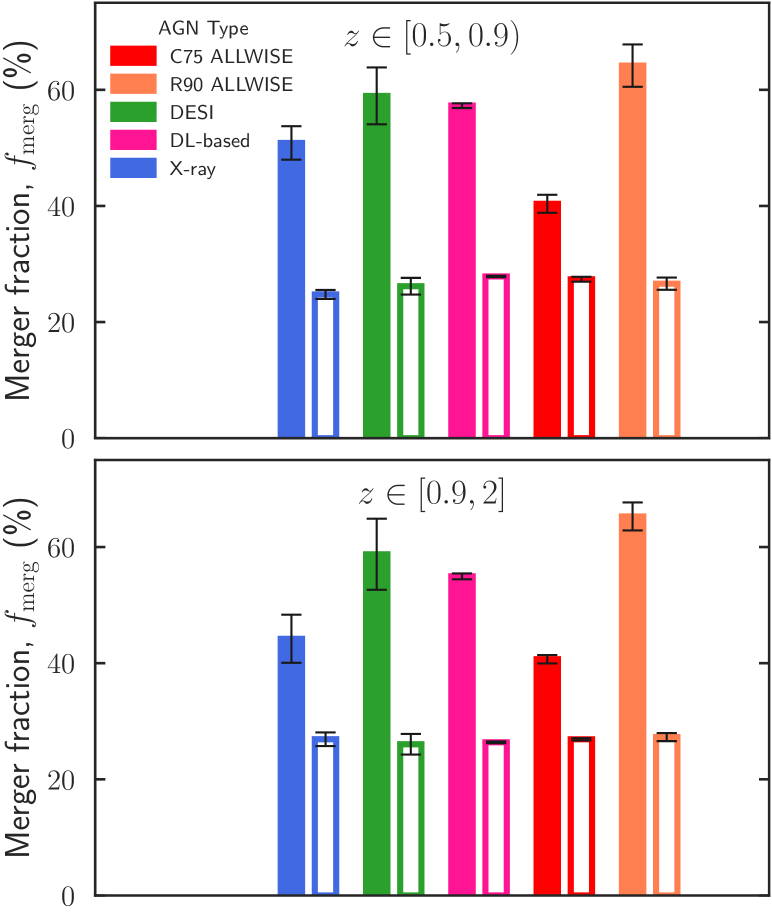
The merger fraction (, Eq. 2) in AGN and corresponding non-AGN controls is reported, by AGN type, in Table 5, and shown in Fig 6. In both bins, and for each AGN type, the fraction of mergers is higher for AGN than for non-AGN controls, strengthening the merger-AGN connection. For all AGN types, excluding the X-ray-selected ones, there is no sign of redshift evolution for the in AGN and respective controls. The difference in for X-ray AGN at and is within uncertainty. Across the entire redshift range, X-ray, DESI, DL-based, and R90 MIR AGN predominantly inhabit merging galaxies, with ranging from 44% to 65%. Only in the case of C75 MIR AGN, we reported a merger fraction of 40, which might indicate a possibly higher contamination degree in this selection. On the other hand, non-AGN controls are classified as mergers in 25–28 of the cases, about a factor of 2 less frequently than for the AGN host galaxies.
Low-redshift studies have found that the fraction of mergers in the MIR-selected AGN is a factor of 1.5–2.3 larger than that of non-AGN controls, in agreement with our results ( and ; Ellison et al. 2019; Gao et al. 2020; La Marca et al. 2024). Likewise, Donley et al. (2018) found that IR-only AGN out to are more likely to be classified as irregular, asymmetric, or interacting than as regular galaxies. For optically-selected AGN, Ellison et al. (2019) found a merger fraction in AGN twice as large as that in non-AGN, similar to what we observe for the DESI AGN. In contrast, Gao et al. (2020) reported an excess of in optical AGN of a factor below 1.5. For X-ray-selected AGN, Bickley et al. (2024) reported an excess of a factor of 2, while La Marca et al. (2024) found an excess of at and of at , close to our findings. At higher redshift (), other studies uncovered only a marginally higher fraction of mergers in X-ray AGN compared to non-AGN, comparable with no excess at all (; Cisternas et al. 2011; Kocevski et al. 2012; Marian et al. 2019), although these samples are limited to intermediate AGN luminosity (X-ray luminosity ). Recently, Villforth (2023) reviewed several studies in the literature about the merger fraction in AGN and non-AGN controls. They concluded that in X-ray-selected AGN are consistent with no excess over controls, in contrast with our findings, while for optically-selected AGN there is an excess over control samples, in agreement with our results for DESI AGN.
Although it may be tempting to infer that mergers are the main AGN triggering mechanism, we need to be cautious and make some further considerations. First, we observed an around the level of 25–28 also in the case of non-active control galaxies. Thus, only about half of the AGN may be really triggered by mergers. For example, considering the MIR R90 AGN, we would have 65% for in AGN, and 27% for in non-AGN controls, which is a difference, suggesting that mergers are not the primary triggering mechanism of AGN. Similar arguments could be applied to the other AGN types. Secondly, in this work, we are only focused on classified galaxies. Hence, the galaxy sample is incomplete and these merger fractions must not be taken as absolute values. To summarise, we cannot conclude the exact extent of the importance of mergers in triggering the different AGN types, but, nevertheless, these results strengthen the merger-AGN connection.
4.3 The merger and AGN connection using continuous parameters
In this second set of experiments, we examined the merger-AGN connection using continuous parameters, which characterise either the relative or the absolute AGN power. Specifically, we first analysed the PSF fraction, , which assesses the power of an AGN relative to its host galaxy. Then, we concentrated on the AGN luminosity for studying the absolute AGN power, that is the point source luminosity, , and the AGN bolometric luminosity obtained for the X-ray and DESI AGN.
4.3.1 Dependence on the relative AGN power
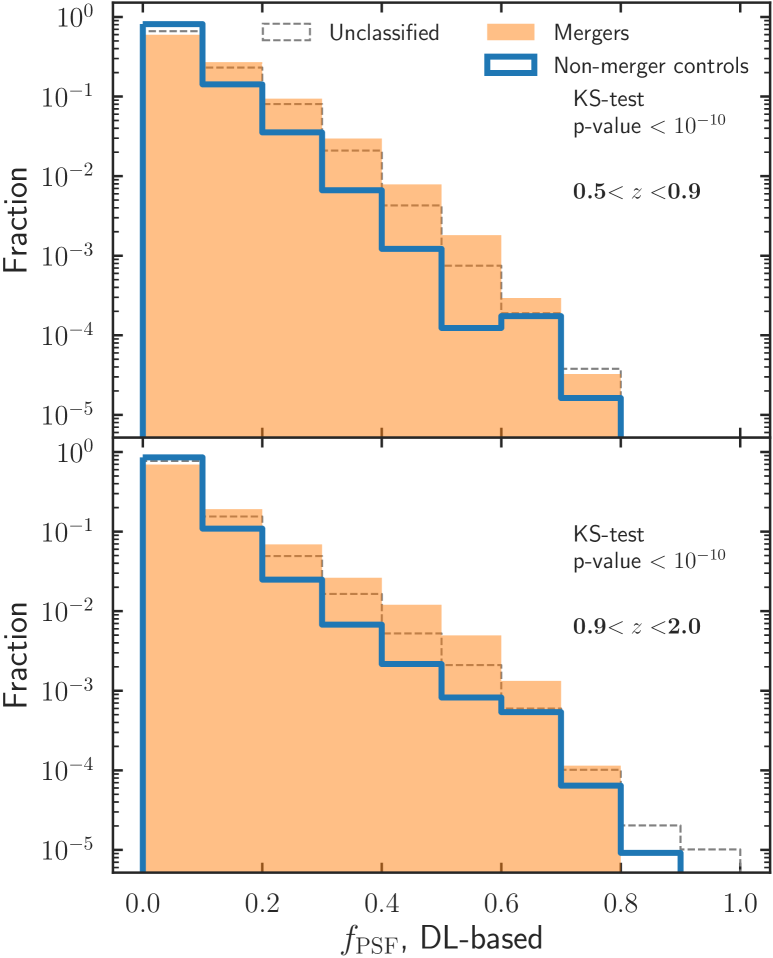
Here we analysed the connection between mergers and the PSF fraction parameter, , which measures the relative nuclear power. We reported the normalised distributions for mergers and relative non-merger control galaxies in Fig. 7. Mergers show a larger fraction of galaxies in the range than non-merger controls, in both redshift bins. The only exception is represented by the galaxies at To assess the statistical difference between the two populations, we ran a two-sample Kolmogorov-Smirnov test (KS test; Hodges 1958). The KS test determines whether two samples come from the same parent distribution (null hypothesis). The -value measures the probability of obtaining the observed difference between distributions, assuming the null hypothesis is true. If the -value is below the significance level (here we take it to be 0.05), the difference between two samples is statistically significant. We show the results in each panel of Fig. 7. The KS test output strongly excludes the null hypothesis, that is, the difference between the distribution for mergers and non-merger controls is statistically significant, in both bins. This hints toward a scenario where mergers fuel the accretion onto the SMBH, enhancing its accretion rate and, consequentially, the point-source luminosity and contribution to the total galaxy light.
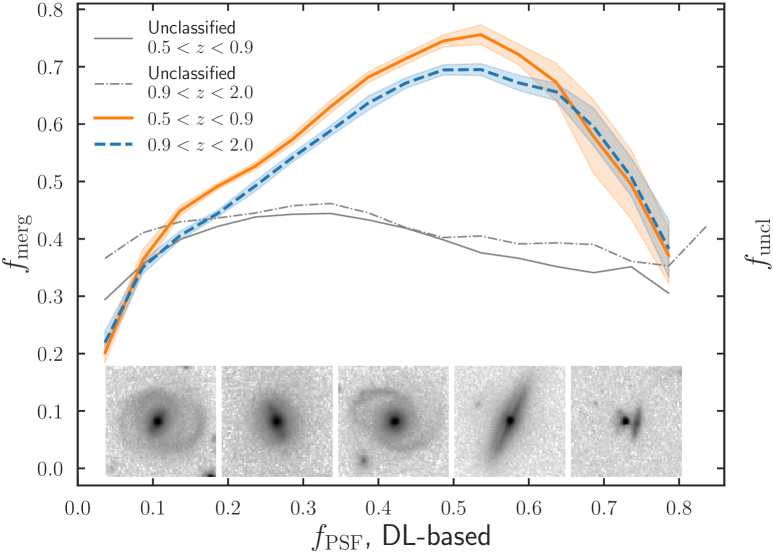
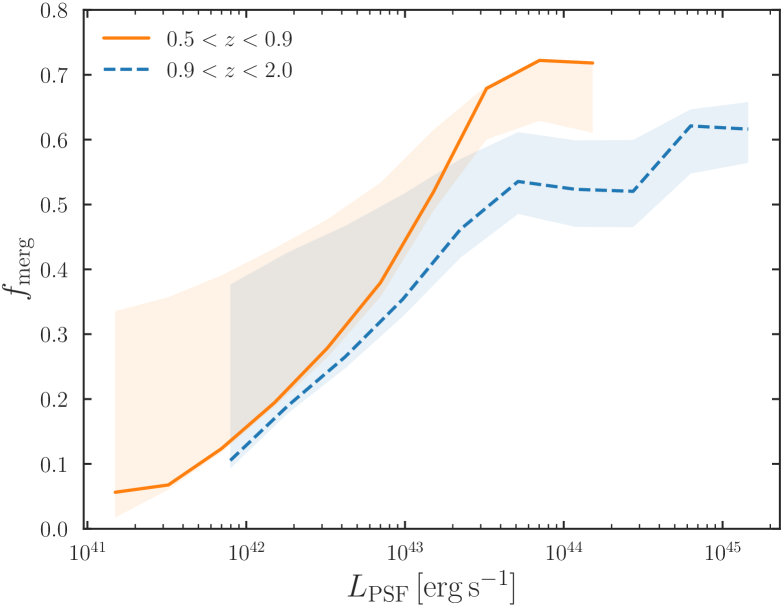
We present the merger fraction versus relationship for all galaxies in Fig. 8, divided into redshift bins. We calculated the merger fraction in bins, logarithmically spaced in the range 0–0.86 (the maximum in our sample). The number of bins is randomly sampled between 6 and 20. Bootstrapping with resampling is used (1000 samples for each population). The trends reported represent the running median of all outcomes, for each population. A clear trend emerges for both redshift bins. From up to , the fraction of mergers monotonically increases, from to . After this peak value, the merger fraction declines with increasing , down to at . Uncertainties become larger with increasing , mostly due to fewer galaxies in those bins. In the range mergers appear to be the dominant mechanism to trigger AGN ().
The trend inversion for , with a declining merger fraction, is hard to interpret. A tentative explanation could be that this inversion likely arises because, at high PSF dominance, the central point source outshines the underlying host galaxy, making morphological features – particularly those indicative of mergers – more challenging to identify. As a result, an increasing fraction of galaxies in this regime are classified as non-mergers, despite the potential presence of merger signatures that remain obscured by the central emission. Alternatively, we recall that is a relative quantity. Although extremely dominant, a point source could be faint in absolute terms, in which case mergers might play a minor role, as we show in the next section. However, further analysis is needed to quantify the impact of a dominant PSF contribution on merger classification.
To investigate possible differences among the various AGN selections, we analysed in Appendix D the versus relation for individual AGN types. The C75 MIR AGN show a trend similar to the whole galaxy population, while the trend is less clear in the case of the DESI and X-ray AGN, probably due to the lower number statistics. R90 MIR AGN have a very high () for the whole range.
In La Marca et al. (2024), the authors estimated the relative AGN power, the AGN fraction parameter (), through SED fitting. This is the fraction of light emitted by the AGN component over the total galaxy light, in the wavelength range 3–30 . They presented an versus relation with two regimes, for all AGN types considered: is rather flat as a function of for relatively subdominant AGN, then it steeply rises above for the most dominant AGN (). Although we estimated the AGN relative contribution through photometry, there are some similarities. First, for less dominant AGN (), mergers are not the main AGN triggering mechanism because their fraction represents less than of the sample. Second, major mergers are the principal pathway to fuel more dominant AGN. Yet, some differences exist. The versus relation does not show any flat regime, but rather constantly increases, and subsequentially decreases, as a function of . Overall, these results support the idea that mergers can enhance AGN fuelling and are the prevailing mechanism for producing dominant AGN with respect to their host galaxy. In contrast, less dominant AGN may be primarily fuelled by other mechanisms, such as secular processes (Garland et al. 2023).
4.3.2 Dependence on the absolute AGN power
Next, we analysed the AGN luminosity parameters, which trace the absolute AGN power. Specifically, we focused on the point source luminosity, , and the bolometric luminosity, , where the latter is available only for the X-ray and DESI AGN (see Sect. 3 for details on the derivation of ).
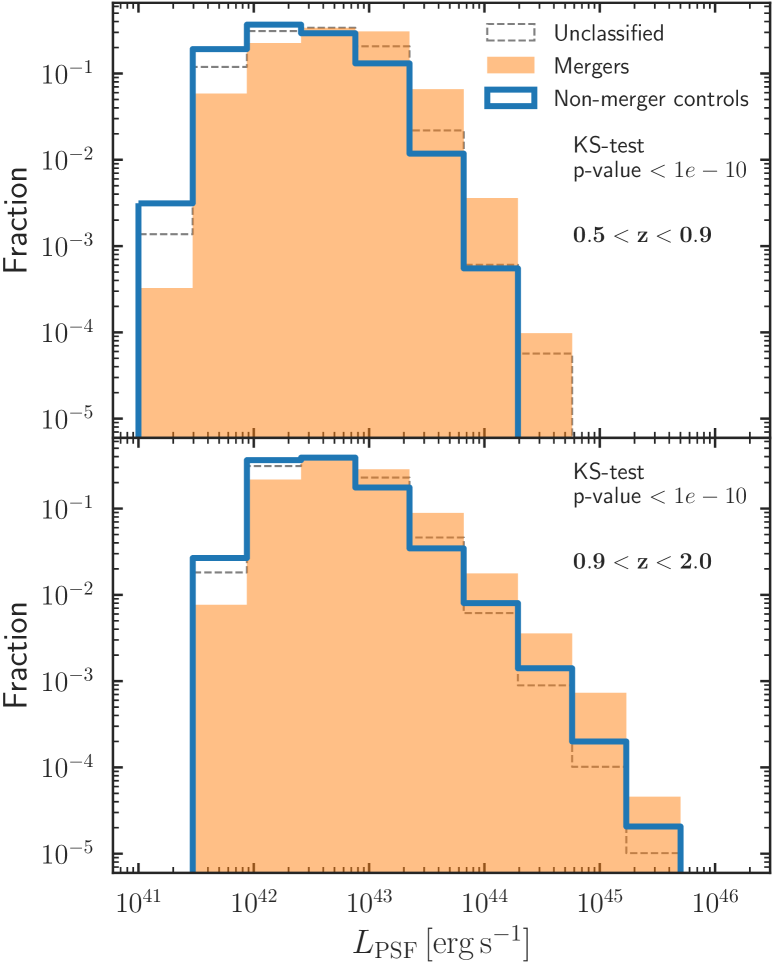
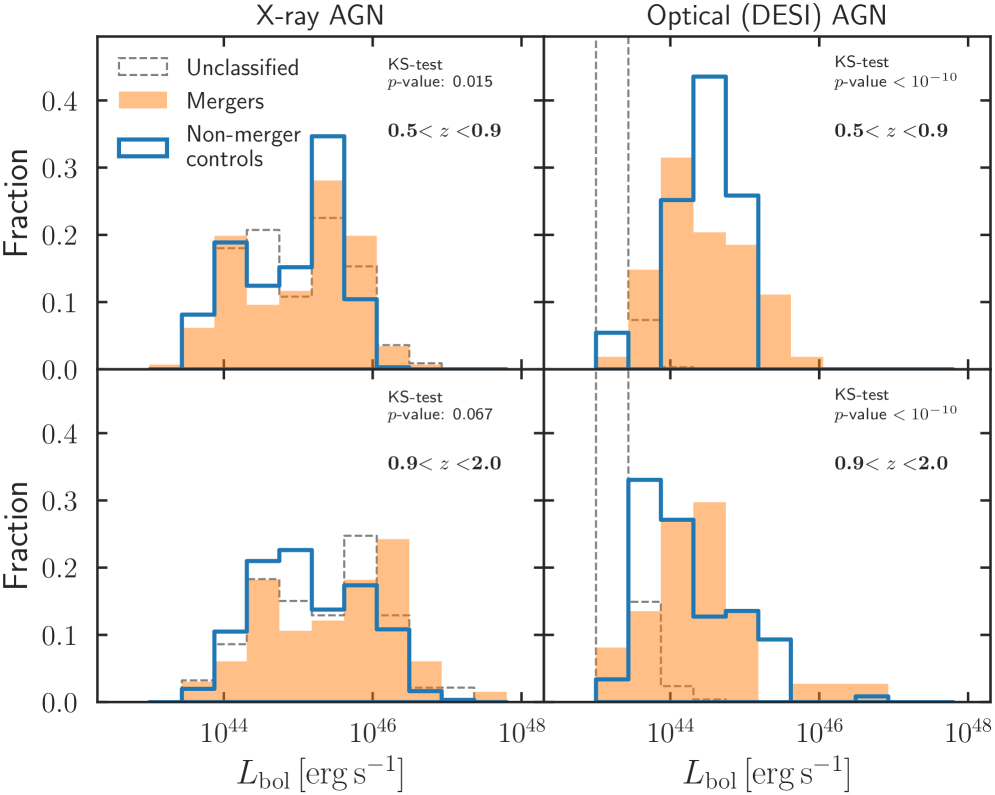
We present the normalised distributions of for mergers and non-merger controls in Fig. 9. In both redshift bins, we observed a higher fraction of mergers at compared to non-merger controls. Therefore, mergers are more likely to harbour a bright AGN than the relative non-merger control galaxies. We show the normalised distribution for mergers and non-merger controls in Fig. 10. In the case of the X-ray AGN, mergers and non-mergers have similar distributions, with some differences at the very bright end in both bins. Indeed, a relatively larger fraction of mergers host a bright AGN () compared to non-mergers. The KS test confirms such a difference at , but does not exclude the hypothesis that the distributions come from the same parent distribution at . In the case of the DESI AGN, this difference emerges at lower luminosities, at for the bin, and at for the bin. For both X-ray and DESI AGN, and redshift bins, the brightest AGN seem to inhabit almost exclusively interacting galaxies, hinting toward a picture where major mergers are responsible for fuelling the most powerful AGN. However, these differences are not highly significant given the limited sample size.
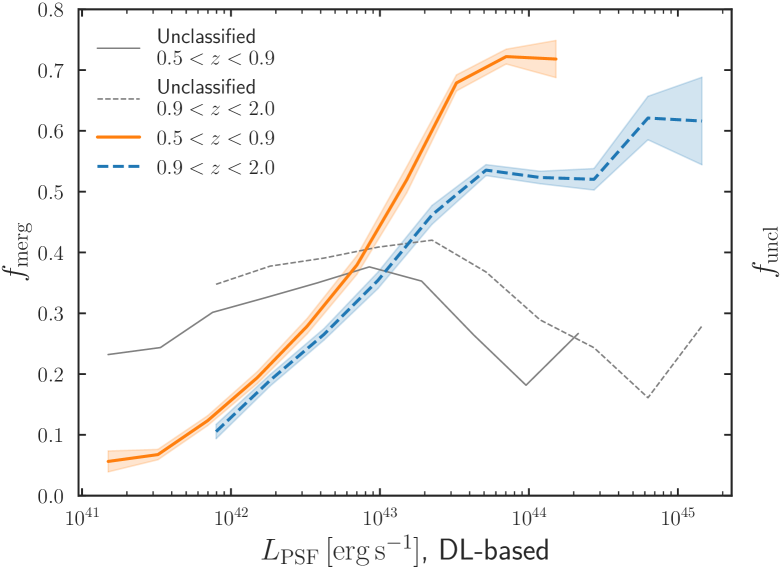
We calculated the central point source luminosity, , from the photometric measurement of the PSF fraction (see Sect. 3). We plot the merger fraction as a function of in Fig. 11. For both redshift bins, increases as a function . At , show a steeper monotonic rise, with most of the galaxies being in mergers at . This happens towards higher luminosities at , when we observe a flat in the range –, and mergers become prevalent only for the very bright end of the AGN population, . This might indicate that at higher redshift, when larger gas supplies are available within galaxies (Tacconi et al. 2010), major mergers are less important in fuelling bright AGN. At the same time, at , when less gas is available, mergers might be the sole viable path to fuel such powerful AGN. We perform the same analysis but for individual AGN selections in Appendix 21.
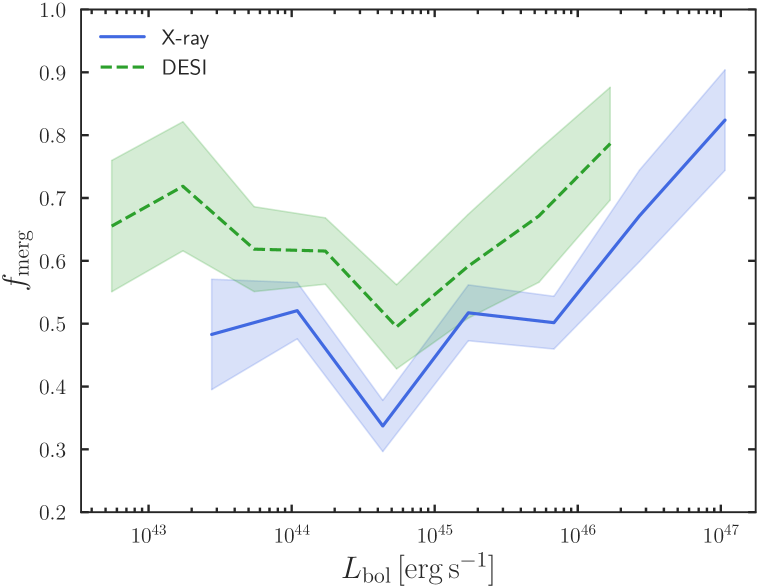
Finally, we present the merger fraction versus AGN bolometric luminosity relationship for DESI and X-ray AGN in Fig. 12. As for the and relation, we calculated the in -bins, randomly sampled in the range –. Bootstrapping with resampling was used to estimate uncertainties. In both cases, given the few numbers in each bin, we reported large uncertainties, of the order . These large uncertainties do not allow for strong conclusions to be drawn. X-ray AGN show a clear trend: the fraction of mergers increases with increasing luminosity. DESI AGN show a less clear trend, having an initially () decreasing merger fraction followed by a steady increase with increasing . In both cases, major mergers appear as the dominant triggering mechanism of the most luminous AGN. There is a broad agreement that the role of mergers becomes more important as we move toward brighter AGN (e.g., Treister et al. 2012; La Marca et al. 2024). For producing such powerful emissions, a large amount of matter must be fed to the central SMBH and major mergers are an efficient way of bringing large amounts of gas to the centres of galaxies (Blumenthal & Barnes 2018b).
5 Caveats discussion
In this section, we investigate the main factors that might influence the relationship between mergers and the AGN properties characterised by the continuous parameters and , potentially affecting our results and conclusions.
5.1 The unclassified galaxies
First, we examined the impact of the unclassified galaxies on the observed trends. Figure 7 presents the normalized distributions for the unclassified galaxies, which lie between the distributions of the non-merger controls and the mergers. This intermediate positioning likely reflects their mixed composition. However, mergers remain dominant over unclassified galaxies, with significantly higher fractions in the range –. To test whether unclassified galaxies influence the observed - trends, we analysed how the fraction of unclassified galaxies () varies with . The results, shown in Fig. 8, indicate that remains roughly constant in both redshift bins, varying very mildly within the range –. These findings suggest that unclassified objects do not significantly impact the relationship between major mergers and . Indeed, this result strengthens our overall conclusion that mergers are predominantly associated with relatively bright central point sources, serving as the primary mechanism for fuelling dominant AGN.
We also investigated the role of unclassified galaxies in the mergers and AGN luminosity relation. Figures 9 and 10 overlay the normalised and distributions for unclassified sources. These comparisons indicate that major mergers primarily trigger the most luminous AGN, since they exhibit a significant excess compared to both non-merger controls and unclassified galaxies. Interestingly, unclassified galaxies show a distinct distribution, hosting some of the faintest DESI AGN. Furthermore, we computed as a function of for both redshift bins (Fig. 11). The fraction remains relatively stable at 0.25–0.35 up to , before decreasing to 0.2 for brighter AGN. These marginal variations do not alter the main finding that mergers play an increasingly significant role in fuelling the most luminous AGN.
5.2 The effect of stellar mass
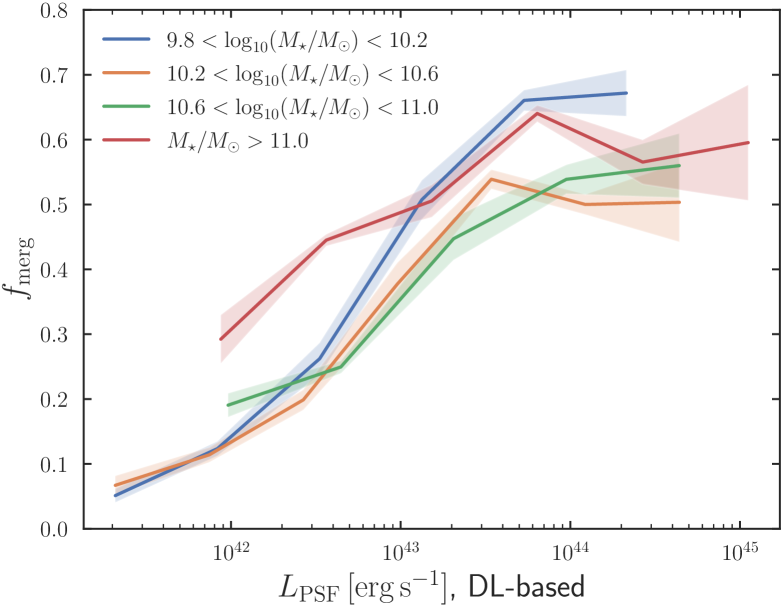
Another potential concern is whether brighter, and consequently more massive, galaxies are more likely to be classified as mergers. To assess whether the observed trends primarily arise from the galaxy stellar mass, we examined the - relation in four stellar mass bins, each containing a similar number of galaxies. The results (Fig. 13) confirm the general trend observed in Fig. 11: the merger fraction increases with and then flattens for the most luminous point sources (), where mergers constitute the majority of the population. The most massive galaxies () exhibit the highest on average, consistent with recent studies reporting a positive correlation between and stellar mass (e.g., Nevin et al. 2023). Thus, we conclude that stellar mass is not the primary driver of the - relation.
5.3 Systematics in the classification
Finally, we estimated uncertainties using bootstrapping under the assumption that our classifier perfectly distinguishes mergers from non-mergers. However, the model achieves precision scores of 0.8 and 0.72 and recall of 0.68 and 0.83 for mergers and non-mergers, respectively. To evaluate the impact of misclassification on the - relation, we performed a Monte Carlo (MC) simulation. In each of 1000 iterations, we randomly reassigned 20% of mergers and 28% of non-mergers to the opposite class, then recomputed the - relation. While calculating the in each bin, we gave different weights to merger and non-merger counts, to account for the non-perfect recall. Specifically, we gave a 1/0.68 weight to mergers, and a 1/0.83 weight to non-mergers. Figure 14 illustrates the MC results as shaded regions around the median trends presented in the previous section. The overall trend persists across all MC realizations: increases with before flattening at the high-luminosity end.
As expected, the MC simulations yield a broader range of values compared to the bootstrapping uncertainties. The scatter around the median trend is more pronounced at lower luminosities () and decreases at higher luminosities. At the extremely bright end, the trend reported in Sect. 4.3.2 for the redshift range occupies the upper limit of the MC results. This finding supports the idea that the brightest sources are dominated by mergers, as randomly flipping 28% of non-mergers into mergers never increases , whereas converting mergers into non-mergers consistently lowers it. Even in the most extreme low - scenario, the most luminous AGN predominantly reside in mergers in both redshift bins, with .
6 Summary and conclusions
In this paper, we performed the first detection of major mergers in the Euclid VIS -band imaging data and examined the merger and AGN connection at in the Q1 EDFs. We constructed a stellar mass-complete sample of galaxies () and employed a CNN, trained on mock Euclid observations generated from the Illustris-TNG simulations, to identify merging galaxies. We defined mergers in Illustris-TNG galaxies with a major merger event (a stellar mass ratio ) in the time interval spanning 800 Myr before to 300 Myr after coalescence. We exploited the rich multi-wavelength datasets for selecting AGN, using four different diagnostics to select AGN, via X-ray detections, optical spectroscopy (DESI data), two different MIR colour selections, and a DL-based imaging decomposition technique. We analysed the role of mergers in triggering AGN using a binary approach and a more refined approach that focuses on continuous AGN parameters. Our key findings are the following.
-
i)
A larger fraction of AGN in mergers than in non-merger controls, which results in an excess of AGN in mergers, regardless of the AGN selection used. X-ray and DL-based AGN show a factor of 2–3 excess in mergers, across the whole redshift range. DESI-selected AGN show a larger excess (3.9) at than at (3.1). MIR AGN show an excess that depends on the criterion adopted. For the more reliable selection, R90, the excess is much larger (a factor of 4.2–4.5) than that of the more complete selection C75 (1.7). This indicates that mergers can trigger all AGN types, but are likely to be more connected with dust-obscured AGN.
-
ii)
A higher merger fraction () in active galaxies, with a 15–25 percentage points larger fraction in AGN compared to non-AGN controls, for all AGN types. However, we cannot conclude with certainty whether mergers play a dominant role in triggering AGN.
-
iii)
A rising trend in the as a function of PSF relative contribution , measured in the -band, up to , followed by a decline. This trend is independent of the redshift. In the range –0.75, most galaxies are classified as mergers, hinting toward a scenario where mergers are the prevalent fuelling mechanism in relatively dominant AGN ().
-
iv)
A positive correlation between and the PSF luminosity, , where mergers represent more than of the galaxies at for , and at for . This confirms the idea that mergers are the main channel to fuel the brightest AGN.
In conclusion, our results provide clear evidence that mergers are closely linked to dust-obscured, relatively dominant and bright AGN. This suggests that mergers efficiently funnel gas to the central regions of galaxies, driving rapid accretion onto the SMBH while obscuring it with dust, making AGN more detectable in the MIR. For less dominant AGN, other fuelling mechanisms may play a more important role. Although mergers appear to be the primary – if not the sole – trigger for the most luminous AGN at , their influence may decline at higher redshifts, where galaxies typically have larger gas reservoirs capable of sustaining AGN activity without external triggers.
A key limitation of this study is the reliance on CNN-based merger classification, which, despite being trained on cosmological simulations, has inherent accuracy constraints. While the main trends remain robust, some level of misclassification is unavoidable. Future improvements in classification techniques will be essential to refine merger identification. This study, although based on only 63 , highlights the statistical power of Euclid in probing mergers and AGN fuelling. With upcoming Euclid releases, the sample size will increase dramatically, marking a transition from being limited by statistical uncertainties to a regime dominated by systematics, which must be understood to advance the field. Complementary datasets from XMM-Newton, eROSITA, JWST, and ancillary far-IR and radio observations will further expand the AGN sample, allowing for a more precise assessment of the role of mergers in AGN evolution. Crucially, these data will allow us to map the merger and AGN connection in a multidimensional space, simultaneously analysing it as a function of key galaxy properties such as stellar mass, redshift, gas content, star formation rate, and environment.
Acknowledgements.
This work has made use of the Euclid Quick Release Q1 data from the Euclid mission of the European Space Agency (ESA), 2025, https://doi.org/10.57780/esa-2853f3b. The Euclid Consortium acknowledges the European Space Agency and a number of agencies and institutes that have supported the development of Euclid, in particular the Agenzia Spaziale Italiana, the Austrian Forschungsförderungsgesellschaft funded through BMK, the Belgian Science Policy, the Canadian Euclid Consortium, the Deutsches Zentrum für Luft- und Raumfahrt, the DTU Space and the Niels Bohr Institute in Denmark, the French Centre National d’Etudes Spatiales, the Fundação para a Ciência e a Tecnologia, the Hungarian Academy of Sciences, the Ministerio de Ciencia, Innovación y Universidades, the National Aeronautics and Space Administration, the National Astronomical Observatory of Japan, the Netherlandse Onderzoekschool Voor Astronomie, the Norwegian Space Agency, the Research Council of Finland, the Romanian Space Agency, the State Secretariat for Education, Research, and Innovation (SERI) at the Swiss Space Office (SSO), and the United Kingdom Space Agency. A complete and detailed list is available on the Euclid web site (www.euclid-ec.org). Based on data from UNIONS, a scientific collaboration using three Hawaii-based telescopes: CFHT, Pan-STARRS, and Subaru www.skysurvey.cc . Based on data from the Dark Energy Camera (DECam) on the Blanco 4-m Telescope at CTIO in Chile https://www.darkenergysurvey.org . This publication is part of the project “Clash of the titans: deciphering the enigmatic role of cosmic collisions” (with project number VI.Vidi.193.113 of the research programme Vidi which is (partly) financed by the Dutch Research Council (NWO). This research makes use of ESA Datalabs (datalabs.esa.int), an initiative by ESA’s Data Science and Archives Division in the Science and Operations Department, Directorate of Science. We thank SURF (www.surf.nl) for the support in using the National Supercomputer Snellius. This research was supported by the International Space Science Institute (ISSI) in Bern, through ISSI International Team project #23-573 “Active Galactic Nuclei in Next Generation Surveys”. This work has benefited from the support of Royal Society Research Grant RGS\R1\231450. FR, VA acknowledge the support from the INAF Large Grant “AGN & Euclid: a close entanglement” Ob. Fu. 01.05.23.01.14. ALM is grateful for the indispensable discussion with Christopher Boettner and Scott C. Trager.References
- Abadi et al. (2016) Abadi, M., Agarwal, A., Barham, P., et al. 2016, arXiv e-prints:1603.04467
- Aird et al. (2017) Aird, J., Coil, A. L., & Georgakakis, A. 2017, MNRAS, 465, 3390
- Aird et al. (2012) Aird, J., Coil, A. L., Moustakas, J., et al. 2012, ApJ, 746, 90
- Alexander & Hickox (2012) Alexander, D. M. & Hickox, R. C. 2012, New Astronomy Reviews, 56, 93
- Allevato et al. (2011) Allevato, V., Finoguenov, A., Cappelluti, N., et al. 2011, ApJ, 736, 99
- Assef et al. (2018) Assef, R. J., Stern, D., Noirot, G., et al. 2018, ApJS, 234, 23
- Barnes & Hernquist (1996) Barnes, J. E. & Hernquist, L. 1996, ApJ, 471, 115
- Bianchi et al. (2017) Bianchi, L., Shiao, B., & Thilker, D. 2017, ApJS, 230, 24
- Bichang’a et al. (2024) Bichang’a, B., Kaviraj, S., Lazar, I., et al. 2024, MNRAS, 532, 613
- Bickley et al. (2023) Bickley, R. W., Ellison, S. L., Patton, D. R., & Wilkinson, S. 2023, MNRAS, 519, 6149
- Bickley et al. (2024) Bickley, R. W., Ellison, S. L., Salvato, M., et al. 2024, MNRAS, 533, 3068
- Blecha et al. (2018) Blecha, L., Snyder, G. F., Satyapal, S., & Ellison, S. L. 2018, MNRAS, 478, 3056
- Blumenthal & Barnes (2018a) Blumenthal, K. A. & Barnes, J. E. 2018a, MNRAS, 479, 3952
- Blumenthal & Barnes (2018b) Blumenthal, K. A. & Barnes, J. E. 2018b, MNRAS, 479, 3952
- Bongiorno et al. (2012) Bongiorno, A., Merloni, A., Brusa, M., et al. 2012, MNRAS, 427, 3103
- Boquien et al. (2019) Boquien, M., Burgarella, D., Roehlly, Y., et al. 2019, A&A, 622, A103
- Bornancini et al. (2022) Bornancini, C. G., Oio, G. A., Alonso, M. V., & García Lambas, D. 2022, A&A, 664, A110
- Bottrell et al. (2019) Bottrell, C., Hani, M. H., Teimoorinia, H., et al. 2019, MNRAS, 490, 5390
- Bruzual & Charlot (2003) Bruzual, G. & Charlot, S. 2003, MNRAS, 344, 1000
- Byrne-Mamahit et al. (2023) Byrne-Mamahit, S., Hani, M. H., Ellison, S. L., Quai, S., & Patton, D. R. 2023, MNRAS, 519, 4966
- Chollet (2023) Chollet, F. 2023, Keras, https://keras.io
- Cisternas et al. (2011) Cisternas, M., Jahnke, K., Inskip, K. J., et al. 2011, ApJ, 726, 57
- Comerford et al. (2024) Comerford, J. M., Nevin, R., Negus, J., et al. 2024, ApJ, 963, 53
- Darg et al. (2010) Darg, D. W., Kaviraj, S., Lintott, C. J., et al. 2010, MNRAS, 401, 1552
- DESI Collaboration et al. (2022) DESI Collaboration, Abareshi, B., Aguilar, J., et al. 2022, ApJ, 164, 207
- DESI Collaboration et al. (2024) DESI Collaboration, Adame, A. G., Aguilar, J., et al. 2024, AJ, 168, 58
- DESI Collaboration et al. (2016) DESI Collaboration, Aghamousa, A., Aguilar, J., et al. 2016, arXiv e-prints:1611.00036
- Dey et al. (2019) Dey, A., Schlegel, D. J., Lang, D., et al. 2019, AJ, 157, 168
- Di Matteo et al. (2003) Di Matteo, T., Croft, R. A. C., Springel, V., & Hernquist, L. 2003, ApJ, 593, 56
- Donley et al. (2018) Donley, J. L., Kartaltepe, J., Kocevski, D., et al. 2018, ApJ, 853, 63
- Draper & Ballantyne (2012) Draper, A. R. & Ballantyne, D. R. 2012, ApJ, 751, 72
- Driver et al. (2011) Driver, S. P., Hill, D. T., Kelvin, L. S., et al. 2011, MNRAS, 413, 971
- Ellison et al. (2019) Ellison, S. L., Viswanathan, A., Patton, D. R., et al. 2019, MNRAS, 487, 2491
- Euclid Collaboration: Aussel et al. (2025) Euclid Collaboration: Aussel, H., Tereno, I., Schirmer, M., et al. 2025, A&A, submitted
- Euclid Collaboration: Bisigello et al. (2024) Euclid Collaboration: Bisigello, L., Massimo, M., Tortora, C., et al. 2024, A&A, 691, A1
- Euclid Collaboration: Cropper et al. (2024) Euclid Collaboration: Cropper, M., Al Bahlawan, A., Amiaux, J., et al. 2024, A&A, accepted, arXiv:2405.13492
- Euclid Collaboration: Enia et al. (2025) Euclid Collaboration: Enia, A., Pozzetti, L., Bolzonella, M., et al. 2025, A&A, submitted
- Euclid Collaboration: Jahnke et al. (2024) Euclid Collaboration: Jahnke, K., Gillard, W., Schirmer, M., et al. 2024, A&A, accepted, arXiv:2405.13493
- Euclid Collaboration: Lusso et al. (2024) Euclid Collaboration: Lusso, E., Fotopoulou, S., Selwood, M., et al. 2024, A&A, 685, A108
- Euclid Collaboration: Margalef-Bentabol et al. (2025) Euclid Collaboration: Margalef-Bentabol, B., Wang, L., La Marca, A., et al. 2025, A&A, submitted
- Euclid Collaboration: Matamoro Zatarain et al. (2025) Euclid Collaboration: Matamoro Zatarain, T., Fotopoulou, S., Ricci, F., et al. 2025, A&A, submitted
- Euclid Collaboration: McCracken et al. (2025) Euclid Collaboration: McCracken, H., Benson, K., et al. 2025, A&A, submitted
- Euclid Collaboration: Mellier et al. (2024) Euclid Collaboration: Mellier, Y., Abdurro’uf, Acevedo Barroso, J., et al. 2024, A&A, accepted, arXiv:2405.13491
- Euclid Collaboration: Polenta et al. (2025) Euclid Collaboration: Polenta, G., Frailis, M., Alavi, A., et al. 2025, A&A, submitted
- Euclid Collaboration: Romelli et al. (2025) Euclid Collaboration: Romelli, E., Kümmel, M., Dole, H., et al. 2025, A&A, submitted
- Euclid Collaboration: Roster et al. (2025) Euclid Collaboration: Roster, W., Salvato, M., Buchner, J., et al. 2025, A&A, submitted
- Euclid Collaboration: Selwood et al. (2025) Euclid Collaboration: Selwood, M., Fotopoulou, S., Bremer, M. N., et al. 2025, A&A, 693, A250
- Euclid Collaboration: Tucci et al. (2025) Euclid Collaboration: Tucci, M., Paltani, S., Hartley, W., et al. 2025, A&A, submitted
- Euclid Collaboration: Walmsley et al. (2025) Euclid Collaboration: Walmsley, M., Huertas-Company, M., Quilley, L., et al. 2025, A&A, submitted
- Euclid Quick Release Q1 (2025) Euclid Quick Release Q1. 2025, https://doi.org/10.57780/esa-2853f3b
- Evans et al. (2024) Evans, I. N., Evans, J. D., Martínez-Galarza, J. R., et al. 2024, ApJS, 274, 22
- Fabian (2012) Fabian, A. C. 2012, A&A Rev., 50, 455
- Ferreira et al. (2020) Ferreira, L., Conselice, C. J., Duncan, K., et al. 2020, ApJ, 895, 115
- Fritz et al. (2006) Fritz, J., Franceschini, A., & Hatziminaoglou, E. 2006, MNRAS, 366, 767
- Gaia Collaboration et al. (2016) Gaia Collaboration, Prusti, T., de Bruijne, J. H. J., et al. 2016, A&A, 595, A1
- Gao et al. (2020) Gao, F., Wang, L., Pearson, W. J., et al. 2020, A&A, 637, A94
- Garland et al. (2023) Garland, I. L., Fahey, M. J., Simmons, B. D., et al. 2023, MNRAS, 522, 211
- Goulding et al. (2018) Goulding, A. D., Greene, J. E., Bezanson, R., et al. 2018, PASJ, 70, S37
- Grogin et al. (2005) Grogin, N. A., Conselice, C. J., Chatzichristou, E., et al. 2005, ApJ, 627, L97
- Grylls et al. (2020) Grylls, P. J., Shankar, F., & Conselice, C. J. 2020, MNRAS, 499, 2265
- Harrison et al. (2018) Harrison, C. M., Costa, T., Tadhunter, C. N., et al. 2018, Nature Astronomy, 2, 198
- Heckman & Best (2014) Heckman, T. M. & Best, P. N. 2014, A&A Rev., 52, 589
- Hewlett et al. (2017) Hewlett, T., Villforth, C., Wild, V., et al. 2017, MNRAS, 470, 755
- Hickox & Alexander (2018) Hickox, R. C. & Alexander, D. M. 2018, A&A Rev., 56, 625
- Hodges (1958) Hodges, J. L. 1958, Arkiv for Matematik, 3, 469
- Hopkins et al. (2008) Hopkins, P. F., Hernquist, L., Cox, T. J., & Kereš, D. 2008, ApJS, 175, 356
- Huertas-Company et al. (2019) Huertas-Company, M., Rodriguez-Gomez, V., Nelson, D., et al. 2019, MNRAS, 489, 1859
- Knapen et al. (2015) Knapen, J. H., Cisternas, M., & Querejeta, M. 2015, MNRAS, 454, 1742
- Kocevski et al. (2015) Kocevski, D. D., Brightman, M., Nandra, K., et al. 2015, ApJ, 814, 104
- Kocevski et al. (2012) Kocevski, D. D., Faber, S. M., Mozena, M., et al. 2012, ApJ, 744, 148
- Koulouridis et al. (2024) Koulouridis, E., Gkini, A., & Drigga, E. 2024, A&A, 684, A111
- Koulouridis et al. (2006) Koulouridis, E., Plionis, M., Chavushyan, V., et al. 2006, ApJ, 639, 37
- La Marca et al. (2024) La Marca, A., Margalef-Bentabol, B., Wang, L., et al. 2024, A&A, 690, A326
- Lackner et al. (2014) Lackner, C. N., Silverman, J. D., Salvato, M., et al. 2014, ApJ, 148, 137
- Laureijs et al. (2011) Laureijs, R., Amiaux, J., Arduini, S., et al. 2011, ESA/SRE(2011)12, arXiv:1110.3193
- Lecun et al. (1998) Lecun, Y., Bottou, L., Bengio, Y., & Haffner, P. 1998, Proceedings of the IEEE, 86, 2278
- Li et al. (2023) Li, W., Nair, P., Irwin, J., et al. 2023, ApJ, 944, 168
- Marconi et al. (2004) Marconi, A., Risaliti, G., Gilli, R., et al. 2004, MNRAS, 351, 169
- Margalef-Bentabol et al. (2024) Margalef-Bentabol, B., Wang, L., La Marca, A., et al. 2024, A&A, 687, A24
- Marian et al. (2019) Marian, V., Jahnke, K., Mechtley, M., et al. 2019, ApJ, 882, 141
- Marinacci et al. (2018) Marinacci, F., Vogelsberger, M., Pakmor, R., et al. 2018, MNRAS, 480, 5113
- Martin et al. (2018) Martin, G., Kaviraj, S., Volonteri, M., et al. 2018, MNRAS, 476, 2801
- Merloni et al. (2024) Merloni, A., Lamer, G., Liu, T., et al. 2024, A&A, 682, A34
- Miyazaki et al. (2018) Miyazaki, S., Komiyama, Y., Kawanomoto, S., et al. 2018, PASJ, 70, S1
- Moreno et al. (2019) Moreno, J., Torrey, P., Ellison, S. L., et al. 2019, MNRAS, 485, 1320
- Mountrichas et al. (2021) Mountrichas, G., Buat, V., Georgantopoulos, I., et al. 2021, A&A, 653, A70
- Moustakas et al. (2023) Moustakas, J., Scholte, D., Dey, B., & Khederlarian, A. 2023, FastSpecFit: Fast spectral synthesis and emission-line fitting of DESI spectra, Astrophysics Source Code Library, record ascl:2308.005
- Naiman et al. (2018) Naiman, J. P., Pillepich, A., Springel, V., et al. 2018, MNRAS, 477, 1206
- Navarro et al. (2024) Navarro, V., Del Rio, S., Diego, M. A., et al. 2024, in Space Data Management, ed. A. Cortesi, Vol. 141 (Singapore: Springer Nature Singapore), 1–13
- Nelson et al. (2018) Nelson, D., Pillepich, A., Springel, V., et al. 2018, MNRAS, 475, 624
- Nevin et al. (2019) Nevin, R., Blecha, L., Comerford, J., & Greene, J. 2019, ApJ, 872, 76
- Nevin et al. (2023) Nevin, R., Blecha, L., Comerford, J., et al. 2023, MNRAS, 522, 1
- Oke & Gunn (1983) Oke, J. B. & Gunn, J. E. 1983, ApJ, 266, 713
- Pierce et al. (2022) Pierce, J. C. S., Tadhunter, C. N., Gordon, Y., et al. 2022, MNRAS, 510, 1163
- Pillepich et al. (2018) Pillepich, A., Nelson, D., Hernquist, L., et al. 2018, MNRAS, 475, 648
- Pozzetti et al. (2010) Pozzetti, L., Bolzonella, M., Zucca, E., et al. 2010, A&A, 523, A13
- Predehl et al. (2021) Predehl, P., Andritschke, R., Arefiev, V., et al. 2021, A&A, 647, A1
- Ricci et al. (2017) Ricci, C., Bauer, F. E., Treister, E., et al. 2017, MNRAS, 468, 1273
- Ricci et al. (2021) Ricci, C., Privon, G. C., Pfeifle, R. W., et al. 2021, MNRAS, 506, 5935
- Rodriguez-Gomez et al. (2015) Rodriguez-Gomez, V., Genel, S., Vogelsberger, M., et al. 2015, MNRAS, 449, 49
- Salvato et al. (2018) Salvato, M., Buchner, J., Budavári, T., et al. 2018, MNRAS, 473, 4937
- Sanders et al. (1988) Sanders, D. B., Soifer, B. T., Elias, J. H., Neugebauer, G., & Matthews, K. 1988, ApJ, 328, L35
- Secrest et al. (2020) Secrest, N. J., Ellison, S. L., Satyapal, S., & Blecha, L. 2020, MNRAS, 499, 2380
- Shen et al. (2020) Shen, X., Hopkins, P. F., Faucher-Giguère, C.-A., et al. 2020, MNRAS, 495, 3252
- Silva et al. (2021) Silva, A., Marchesini, D., Silverman, J. D., et al. 2021, ApJ, 909, 124
- Silverman et al. (2008) Silverman, J. D., Mainieri, V., Lehmer, B. D., et al. 2008, ApJ, 675, 1025
- Siudek et al. (2024) Siudek, M., Pucha, R., Mezcua, M., et al. 2024, A&A, 691, A308
- Smethurst et al. (2023) Smethurst, R. J., Beckmann, R. S., Simmons, B. D., et al. 2023, MNRAS
- Somerville & Davé (2015) Somerville, R. S. & Davé, R. 2015, A&A Rev., 53, 51
- Springel et al. (2005) Springel, V., Di Matteo, T., & Hernquist, L. 2005, MNRAS, 361, 776
- Springel et al. (2018) Springel, V., Pakmor, R., Pillepich, A., et al. 2018, MNRAS, 475, 676
- Springel et al. (2001) Springel, V., White, S. D. M., Tormen, G., & Kauffmann, G. 2001, MNRAS, 328, 726
- Tacconi et al. (2010) Tacconi, L. J., Genzel, R., Neri, R., et al. 2010, Nature, 463, 781
- Tanaka et al. (2023) Tanaka, M., Koike, M., Naito, S., et al. 2023, PASJ, 75, 986
- Taylor (2006) Taylor, M. B. 2006, 351, 666
- The Dark Energy Survey Collaboration (2005) The Dark Energy Survey Collaboration. 2005, arXiv e-prints:astro-ph/0510346
- Toba et al. (2022) Toba, Y., Yamada, S., Matsubayashi, K., et al. 2022, PASJ, 74, 1356
- Treister et al. (2012) Treister, E., Schawinski, K., Urry, C. M., & Simmons, B. D. 2012, ApJ, 758, L39
- Villforth (2023) Villforth, C. 2023, The Open Journal of Astrophysics, 6, 34
- Villforth et al. (2017) Villforth, C., Hamilton, T., Pawlik, M. M., et al. 2017, MNRAS, 466, 812
- Walmsley et al. (2022) Walmsley, M., Scaife, A. M. M., Lintott, C., et al. 2022, MNRAS, 513, 1581
- Wang et al. (2020) Wang, L., Pearson, W. J., & Rodriguez-Gomez, V. 2020, A&A, 644, A87
- Webb et al. (2020) Webb, N. A., Coriat, M., Traulsen, I., et al. 2020, A&A, 641, A136
- Weigel et al. (2018) Weigel, A. K., Schawinski, K., Treister, E., Trakhtenbrot, B., & Sanders, D. B. 2018, MNRAS, 476, 2308
- Wright et al. (2010) Wright, E. L., Eisenhardt, P. R. M., Mainzer, A. K., et al. 2010, AJ, 140, 1868
- Yang et al. (2022) Yang, G., Boquien, M., Brandt, W. N., et al. 2022, ApJ, 927, 192
- Yang et al. (2020) Yang, G., Boquien, M., Buat, V., et al. 2020, MNRAS, 491, 740
Appendix A Comparison with Zoobot classification
We compared the predictions of the model trained in this work with the classification given by the Zoobot model (Euclid Collaboration: Walmsley et al. 2025) for the subsample of galaxies in common. We used two Zoobot catalogue columns to identify mergers, the merging merger fraction and the merging major-disturbance fraction, which allow us to select both pair galaxies and highly disturbed post-merging galaxies. As a first step, we removed possible artefacts from the Zoobot catalogue by setting problem artifact fraction AND problem star fraction AND problem zoom fraction . Then, we defined the mergers as those galaxies with merging merger fraction OR merging major-disturbance fraction , and the non-mergers as merging merger fraction AND merging major-disturbance fraction . We chose these criteria in order to obtain pure samples of mergers and non-mergers. In total, we found 40 847 galaxies in common. Of these, 27.8% are unclassified according to our model classification, which we removed to compare merger/non-merger classifications.
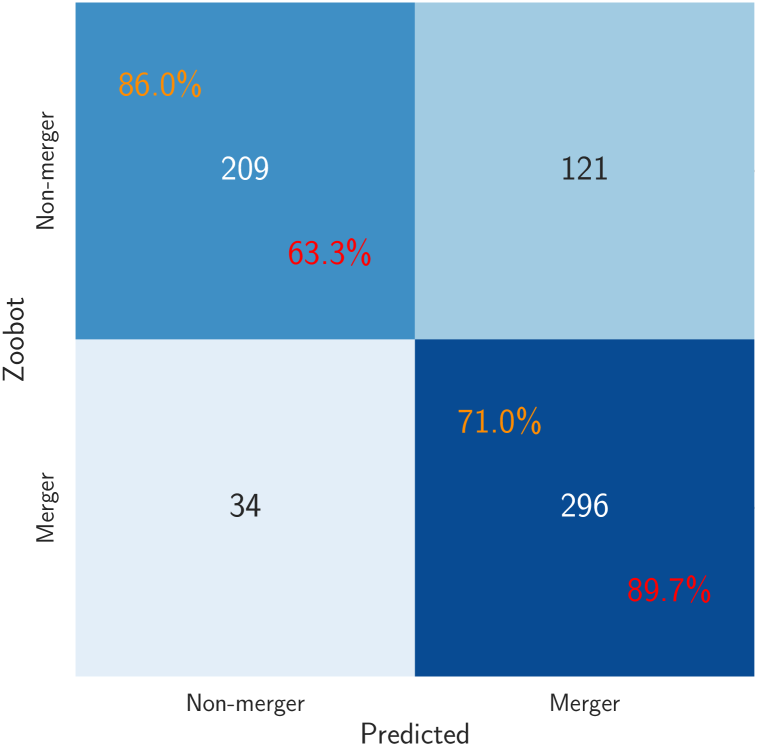
We created balanced samples of the Zoobot mergers and non-mergers by randomly selecting the same number of mergers among the available non-mergers. This operation was repeated 10 times, we report the average results in Fig. 15. Our model has a precision of 71% and 86% for mergers and non-mergers, respectively, when compared to the Zoobot labels. Compared to the performance on the TNG test set, we observed a lower precision for the merger class, but an improved precision for the non-mergers. At the same time, our model classification is highly complete with respect to Zoobot mergers, with a recall of 90%, but has a much lower recall for the non-mergers, 63%. Overall, the F1-scores for both classes are the same as for the TNG test set. Considering all Zoobot mergers in the common subsample, our model classifies as mergers 90% of them (75% if we do not exclude unclassified galaxies) demonstrating good agreement between our classification and labels obtained from a model trained on visual classification.
We visually inspected the cases where Zoobot and our CNN disagree. We observed that sometimes Zoobot misclassified mergers picked up by our CNN, but also the opposite is true (i.e., our CNN misclassified mergers correctly labelled by Zoobot). Nevertheless, we note that the comparison between our classifier and Zoobot is inherently dependent on the choice of classification thresholds in both approaches. Variations in these thresholds can significantly affect the reported merger fractions and the relative performance of the methods.
Appendix B Example of unclassified galaxies
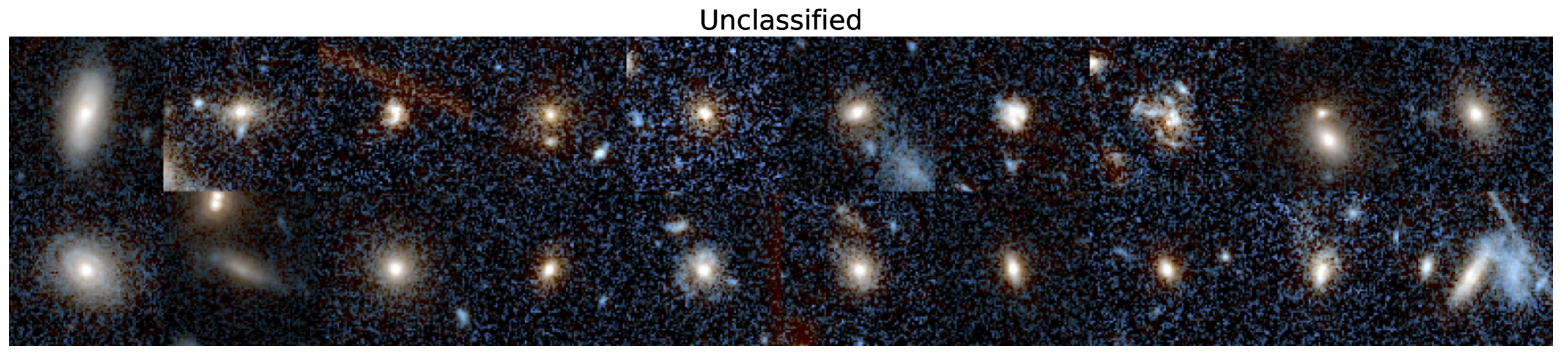
We show some randomly sampled examples of unclassified galaxies in Fig. 16. Unclassified galaxies are those objects with a predicted score between 0.35 and 0.59, inclusive. These unclassified objects appear as intermediate between mergers and non-mergers. While some look isolated and undisturbed, others appear to have close neighbours and an irregular morphology.
Appendix C AGN sample – additional information
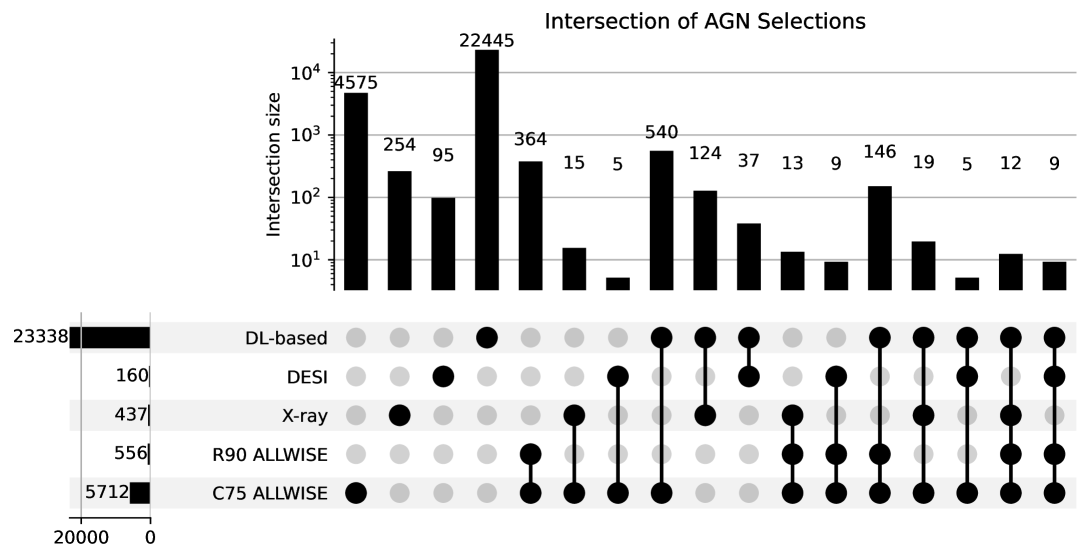
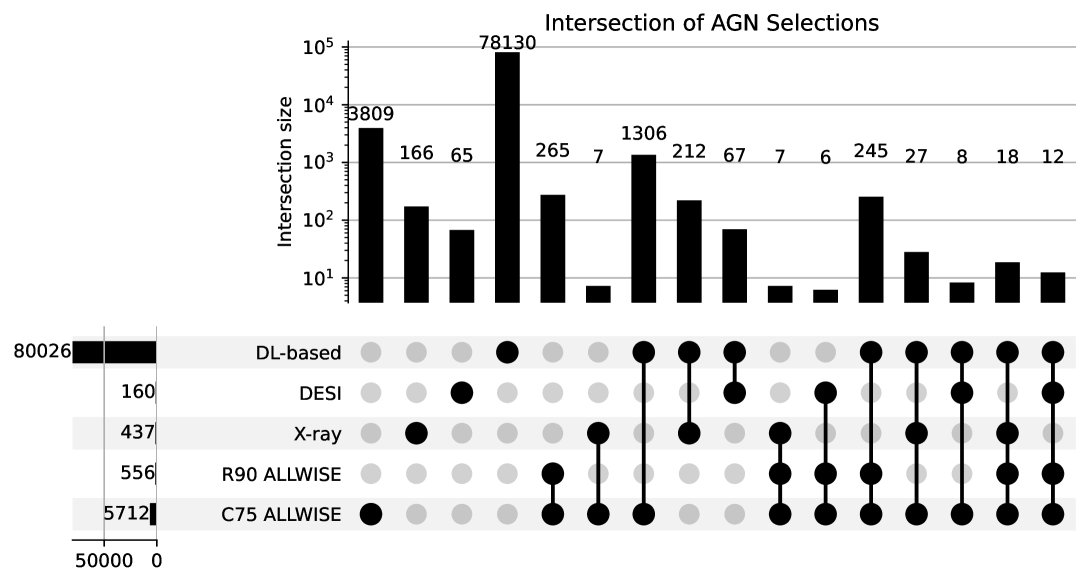
We show the various intersections of all AGN selection methods used in this work in Fig. 17 as an UpSet plot. This plot shows intersections in a matrix, with the rows corresponding to the AGN selections, and the columns to the intersections between these sets. The size of the sets and the intersections are shown as bar charts. The DL-based method correctly identifies about 25–30% of DESI, X-ray, and R90 MIR-selected AGN, while only about 10% of C75 MIR AGN. Relaxing the constraint to 0.1, the DL-based model recognises many more AGN (Fig. 18): it correctly identifies of DESI, X-ray and R90 AGN, and about 25% of C75 AGN. It is not surprising that the C75 selection method has the lowest identification ratio as this diagnostic is also the most contaminated one.
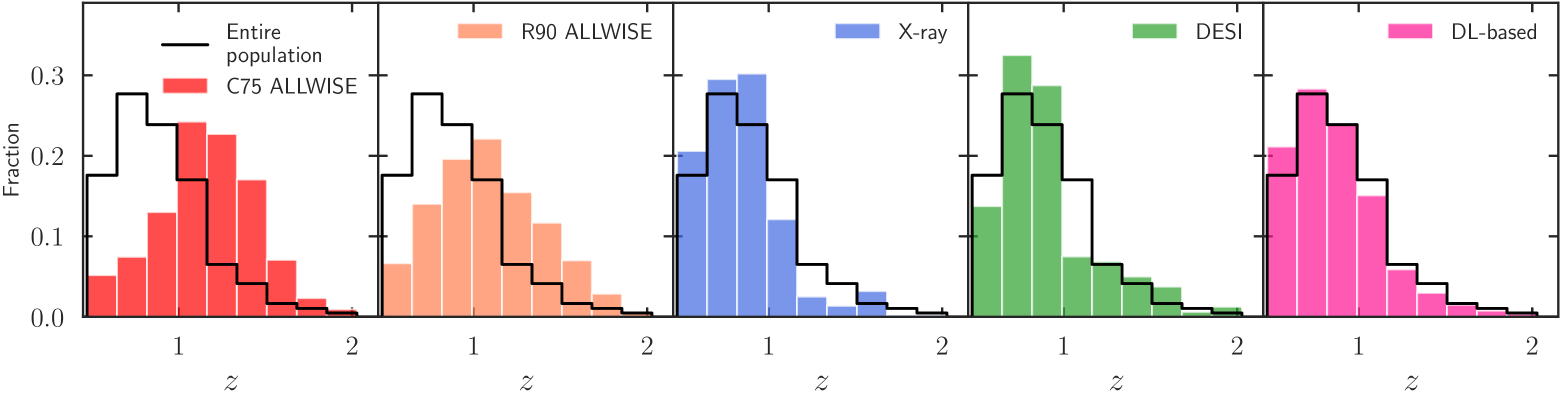
Figure 19 shows the normalised redshift distributions of all AGN types. X-ray and DESI AGN mostly inhabit galaxies, with very few individuals at higher redshift. MIR AGN, both the C75 and the R90 selections, on average have higher redshifts, with their distributions peaking at . DL-selected AGN mostly follow the same distribution of the full galaxy sample, which has its maximum at and then monotonically decreases toward higher redshifts. This behaviour is expected because the DL-based AGN population strongly depends on the original population of galaxies.
Appendix D as a function of and for individual AGN selections
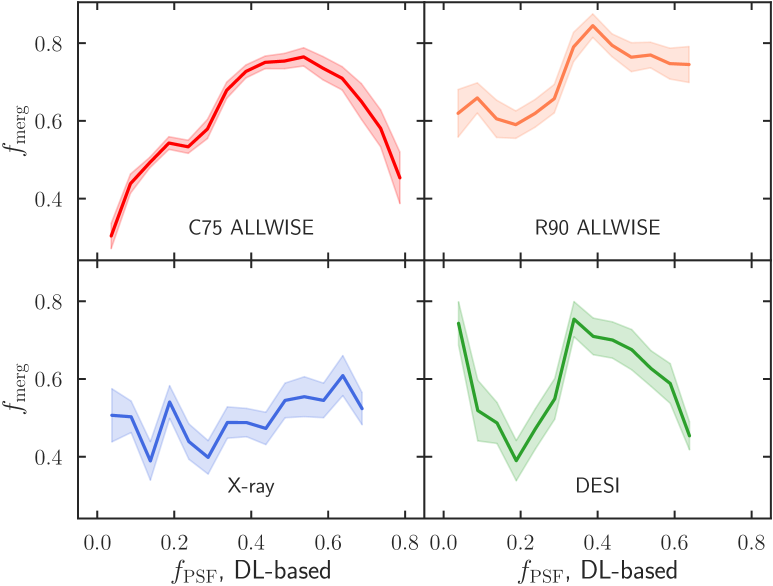
Here, we analyse the relation of the merger fraction with the point source fraction and luminosity for individual AGN selections, to study possible differences. We show the and relation for X-ray, DESI, and MIR colour selections in Fig. 20. X-ray and DESI AGN show larger fluctuations, mainly due to fewer objects compared to MIR and DL-based AGN selections. X-ray AGN show a rather flat trend, with a mild increase of as a function of . Regarding the MIR AGN, the R90-selected objects show a rising trend with increasing , centred at very high values (). The C75-selected AGN have a trend similar to that of the general population reported in Fig. 8: a sharp rise in up to , followed by a decreasing merger fraction.
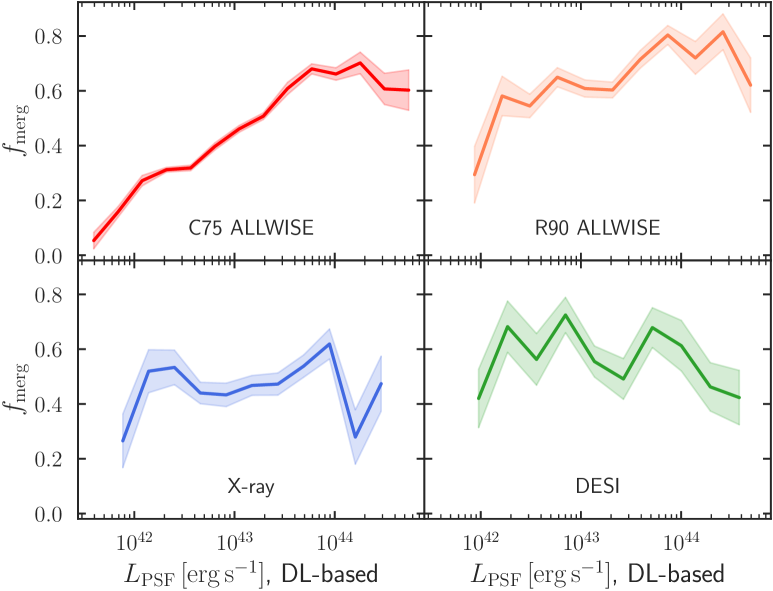
Likewise, we show the merger fraction and point source luminosity relations for the individual AGN selections in Fig. 21. X-ray and DESI AGN have a rather flat trend, around and , respectively. Although their trends are significantly different from those in Fig. 11, mergers appear as a dominant fuelling mechanism for both selections. On the other hand, both MIR colour selections show monotonic rising as a function of , with mergers becoming dominant for the brightest point sources (). In this case, the trends reported are similar to that of the general AGN population in Fig. 11.