SceneEval: Evaluating Semantic Coherence in Text-Conditioned
3D Indoor Scene Synthesis
Abstract
Despite recent advances in text-conditioned 3D indoor scene generation, there remain gaps in the evaluation of these methods. Existing metrics primarily assess the realism of generated scenes by comparing them to a set of ground-truth scenes, often overlooking alignment with the input text — a critical factor in determining how effectively a method meets user requirements. We present SceneEval, an evaluation framework designed to address this limitation. SceneEval includes metrics for both explicit user requirements, such as the presence of specific objects and their attributes described in the input text, and implicit expectations, like the absence of object collisions, providing a comprehensive assessment of scene quality. To facilitate evaluation, we introduce SceneEval-100, a dataset of scene descriptions with annotated ground-truth scene properties. We evaluate recent scene generation methods using SceneEval and demonstrate its ability to provide detailed assessments of the generated scenes, highlighting strengths and areas for improvement across multiple dimensions. Our results show that current methods struggle at generating scenes that meet user requirements, underscoring the need for further research in this direction.
SceneEval: Evaluating Semantic Coherence in Text-Conditioned
3D Indoor Scene Synthesis
Hou In Ivan Tam1, Hou In Derek Pun1, Austin T. Wang1, Angel X. Chang1,2, Manolis Savva1 1Simon Fraser University, 2Alberta Machine Intelligence Institute (Amii) {hit, hip4, atw7, angelx, msavva}@sfu.ca https://3dlg-hcvc.github.io/SceneEval/
1 Introduction
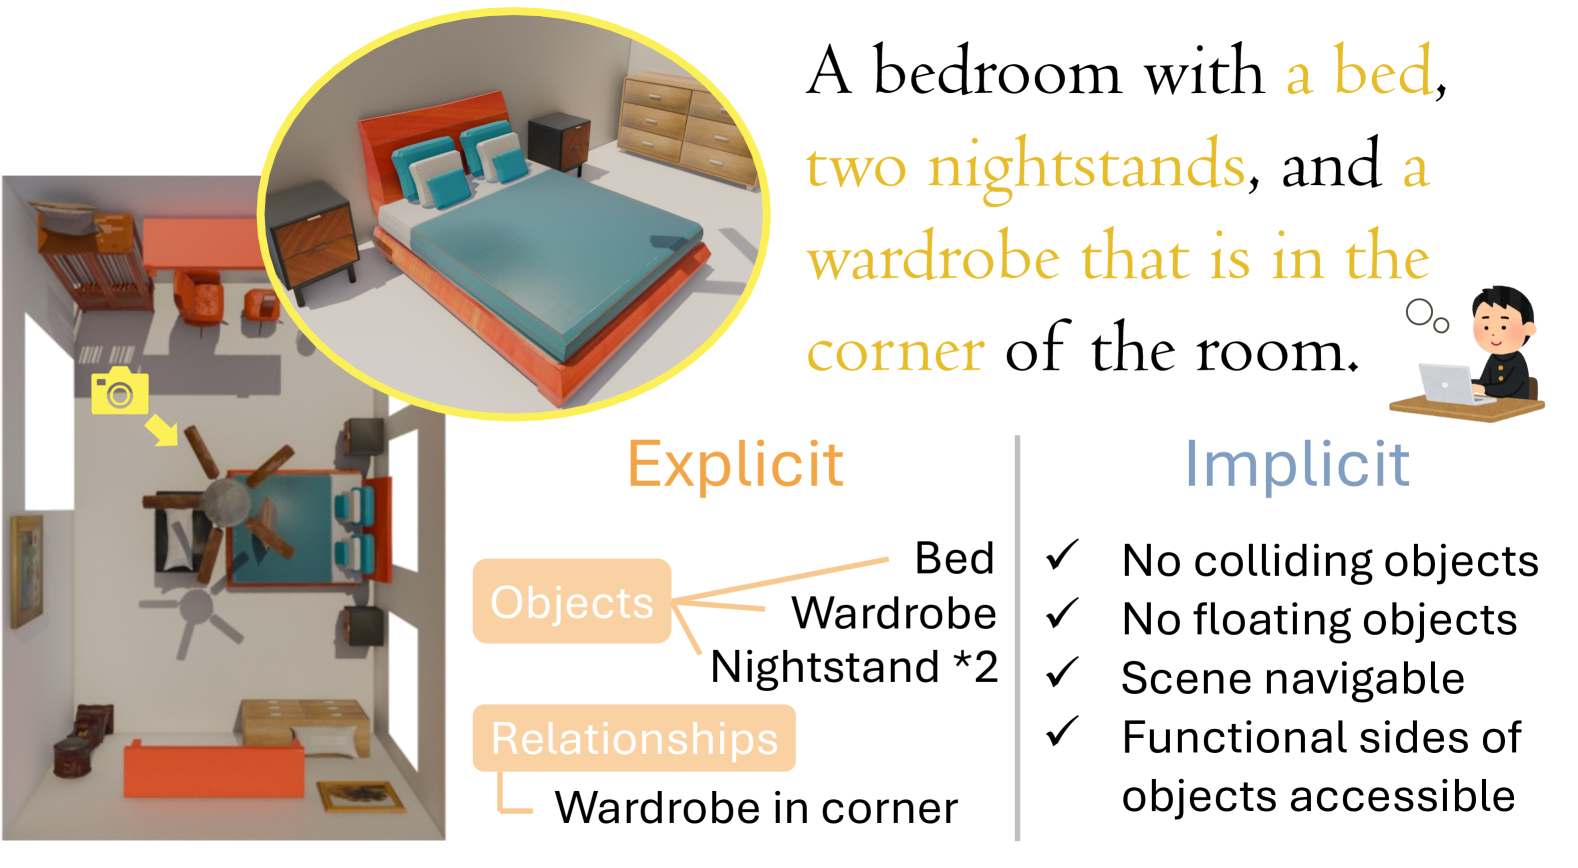
Digital 3D indoor scenes are essential for various applications, including robotics simulation, game development, and film production. However, authoring 3D scenes manually is laborious, making automatic scene synthesis a long-standing research problem. Scene synthesis faces two primary challenges: adhering to explicit user requirements and meeting implicit expectations, such as physical plausibility, which users often assume but do not explicitly specify. As shown in Fig.˜1, both are crucial for practical applications.
Text-conditioned generation has been a popular research direction, allowing users to specify scenes through natural language. Just as homeowners can convey their dream home to interior designers and scriptwriters can describe story scenes to set designers, natural language is an intuitive way for users to describe a desired scene to scene synthesis methods. Depending on user expertise and needs, these descriptions can be minimalistic (“a cozy living room”), or more detailed (“a living room with a brown sofa facing a TV and a dining table with four chairs”). The flexibility and expressiveness of text allows users to specify their desires without needing to understand the intricacies of 3D modeling. This flexibility also poses unique challenges for scene synthesis methods, as they must understand and interpret the text descriptions to generate scenes that meet user requirements. Users’ unspoken expectations, such as object placements adhering to the laws of physics, further complicate this process. Nonetheless, an ideal scene synthesis method should be able to generate scenes that satisfy both explicit and implicit user requirements.
Despite recent advances in scene generation methods, there is a lack of systematic evaluation of the fidelity of the generated scenes against the input text descriptions. Commonly used metrics (e.g., Fréchet Inception Distance (FID) Heusel et al. (2017)) primarily assess the distributional similarity between real and generated scenes, neglecting the explicit user input and making it hard to quantify how well current methods can actually understand and fulfill users’ needs. Moreover, evaluation against implicit expectations is also sparse, with little prior work reporting metrics regarding physical plausibility of the generated scenes. In contrast, text-conditioned generation in 2D modalities like image and video has seen more evaluation focusing on text alignment. However, 3D scene synthesis is fundamentally different from 2D modalities due to the additional spatial dimension and the physical constraints that come with it, making it non-trivial to apply 2D evaluation metrics to 3D scenes.
To better understand the performance of existing methods and support future research, we propose SceneEval, a comprehensive evaluation framework focused on measuring the fidelity of generated scenes against their input text descriptions. SceneEval includes four fidelity metrics: object count, object attribute, object-object relationship, and object-architecture relationship, designed to measure how well the generated scenes meet explicit user requirements. Additionally, SceneEval incorporates metrics for assessing implicit expectations, including object collision, support, accessibility, out-of-bound, and scene navigability, to better understand the physical plausibility of the generated scenes. To facilitate evaluation, we introduce SceneEval-100, a dataset of scene descriptions of varying complexities with annotated ground-truth scene properties. This dataset establishes a standardized evaluation of scene generation methods and enables SceneEval to assess how well the generated scenes meet explicit user requirements.
We evaluate five recent scene generation methods using SceneEval and demonstrate its effectiveness in providing better insights into their strengths and weaknesses. Our results reveal that significant gaps remain in current methods in generating scenes that fulfill explicit user requirements and meet implicit expectations, highlighting the need for further research in this area. We believe SceneEval will be a valuable contribution for building methods that better align with user needs.
2 Related Work
3D Indoor Scene Generation.
Digital 3D indoor scene generation has been an active research area for decades. Early work focused on developing systems to help users manually place objects in 3D scenes Bukowski and Séquin (1995); Shinya and Forgue (1995). Subsequent work has focused on automating the generation with rule-based Clay and Wilhelms (1996); Coyne and Sproat (2001); Yeh et al. (2012); Deitke et al. (2022); Raistrick et al. (2024), data-driven Yu et al. (2011); Fisher et al. (2012); Chang et al. (2015); Savva et al. (2016); Ma et al. (2018); Keshavarzi et al. (2020) and deep learning methods Wang et al. (2018); Li et al. (2019); Ritchie et al. (2019); Wang et al. (2019); Paschalidou et al. (2021); Tang et al. (2024); Lin and MU (2024); Zhai et al. (2024, 2023); Yang et al. (2024a); Hu et al. (2024a); Sun et al. (2024). These methods typically take a room type, floor plan shape, scene graph, or text description as input and aim to generate a 3D scene that satisfies the requirements. In particular, text-conditioned generation has always been a popular direction for the appeal of specifying scenes with natural language. With the advancement of large language models (LLMs), many recent works Aguina-Kang et al. (2024); Hu et al. (2024b); Feng et al. (2023); Çelen et al. (2024); Yang et al. (2024b); Fu et al. (2024); Wang et al. (2024b) incorporate LLMs as both a text parser and a spatial prior for generating scenes with varying success.
Evaluation of Text-conditioned Generation.
Text-conditioned generation is also a popular research direction in other modalities, including text-to-text, text-to-image, text-to-video, and text-to-3D-shape generation. For each modality, there exists metrics for evaluating the quality of the generated content against the input text condition directly. For example, BLEU Papineni et al. (2002), ROUGE Lin (2004), METEOR Banerjee and Lavie (2005), CIDEr Vedantam et al. (2015), SPICE Anderson et al. (2016), and BERTScore Zhang et al. (2020) are commonly used metrics for text generation. For images, CLIPScore Hessel et al. (2021) and VQAScore Lin et al. (2024) are used to evaluate text fidelity of the generated images. VBench Huang et al. (2024a) and VBench++ Huang et al. (2024b) are comprehensive evaluation suites for evaluating video generation that include components for text fidelity. Recently, GPTEval3D Wu et al. (2024) shows that GPT-4 Achiam et al. (2023) can be used to evaluate text-conditioned 3D shape generation on text alignment and other aspects. Unfortunately, these metrics are not directly applicable to 3D scenes. Compared to 2D images, text descriptions of 3D scenes are unique because the added dimensionality introduces ambiguities in their interpretation. For example, placing an object to the left of another object in 3D can be interpreted differently depending on the viewpoint. When specifying scenes, people often describe object relationships as if they are viewing from within the scene, rather than from a fixed outside viewpoint. This particularity, combined with the implicit expectations people have for 3D scenes, makes evaluating text-conditioned 3D scene generation a unique challenge.
Evaluation of Text-conditioned Scene Generation.
Despite advances in scene generation methods, metrics for evaluating scene generation have largely stayed the same, with an emphasis on distributional similarity between real and generated scenes. In particular, Fréchet Inception Distance (FID) Heusel et al. (2017), FID with CLIP features (FIDCLIP) Kynkäänniemi et al. (2023), Kernel Inception Distance (KID) Bińkowski et al. (2018), and scene classification accuracy (SCA) are commonly used metrics that compare rendered images from generated scenes against a set of real scene images. Categorical Kulback-Leibler divergence (CKL) is also used to determine the realism of the generated scenes in terms of object category distribution. These metrics do not evaluate the generated scenes against the input text descriptions directly and a user study is often required. To address this limitation, some recent works Yang et al. (2024b); Hu et al. (2024b); Wang et al. (2024b, a); Fu et al. (2024) use CLIPScore to evaluate text alignment of the generated scenes. Following GPTEval3D Wu et al. (2024), I-Design Çelen et al. (2024) uses GPT-4 Achiam et al. (2023) as an evaluator. These approaches evaluate the text descriptions as a whole against renderings of the generated scenes and do not provide insights into what aspects of the text descriptions are lost in the generation process. CommonScenes Zhai et al. (2023) and EchoScene Zhai et al. (2024) take scene graphs as input and use them to evaluate the generated scenes. InstructScene Lin and MU (2024) and RelScene Ye et al. (2024) annotate the 3D-FRONT Fu et al. (2021a) scene dataset with text descriptions for generation and ground-truth object relationships for evaluation. However, their scope is limited to three room types (bedroom, living room, dining room) within the dataset and do not include object attributes and object-architecture relationships. In contrast, SceneEval directly evaluates scenes against their input text descriptions in various aspects, providing a more comprehensive evaluation of the fidelity of the scenes. In addition, SceneEval includes metrics for implicit expectations like object accessibility and scene navigability, which are not the focus of prior work.
3 SceneEval
Our framework comprehensively evaluates scenes in terms of both fidelity (i.e. explicitly specified constraints) and plausibility (i.e. implicit expectations). For each generated scene, we assume we have a set of annotations that specify the expected properties of the scene, including ground-truth object count, object attributes, object-object relationships, and object-architecture relationships. Given a generated scene and its annotations, SceneEval first matches object instances in the generated scene to those in the annotations (Sec.˜3.2) and uses this matching to compute the fidelity (Sec.˜3.3) and plausibility metrics (Sec.˜3.4). Please refer to the appendix for more details on our dataset, the implementation details of our metrics, and the LLM prompts we use.
| Difficulty | Scenes | Words | Obj | ObjCount | ObjAttr | OORel | OARel |
| Easy | 40 | 22.58 | 3.40 | 3.03 | 1.50 | 1.23 | 1.55 |
| Medium | 40 | 38.63 | 6.68 | 5.00 | 2.40 | 3.53 | 1.80 |
| Hard | 20 | 76.45 | 15.70 | 10.05 | 5.90 | 7.95 | 5.70 |
3.1 SceneEval-100
| Difficulty | Scene Description | |||||||||||||
| Easy |
|
|||||||||||||
| Medium |
|
|||||||||||||
| Hard |
|
To facilitate evaluation, we introduce SceneEval-100, a dataset of scene descriptions with annotations on the expected scene properties. SceneEval-100 contains 100 scene descriptions covering eight room types: bedroom, living room, dining room, playroom, gaming room, kitchen, bathroom, and basement. We define three difficulty levels for the scene descriptions: easy, medium, and hard. The difficulty levels are defined based on the complexity of the descriptions in terms of the number of objects specified. We consider large furniture objects (e.g., bed, sofa) and small objects (e.g., cup, book) separately. Easy scene descriptions specify at most four objects with all being large furniture objects. Medium descriptions specify five to eight objects, with up to three small objects. Hard descriptions have at least nine objects in total, with no restrictions on the object types. In addition, hard descriptions may specify scenes with multiple rooms. See details in Appendix˜A.
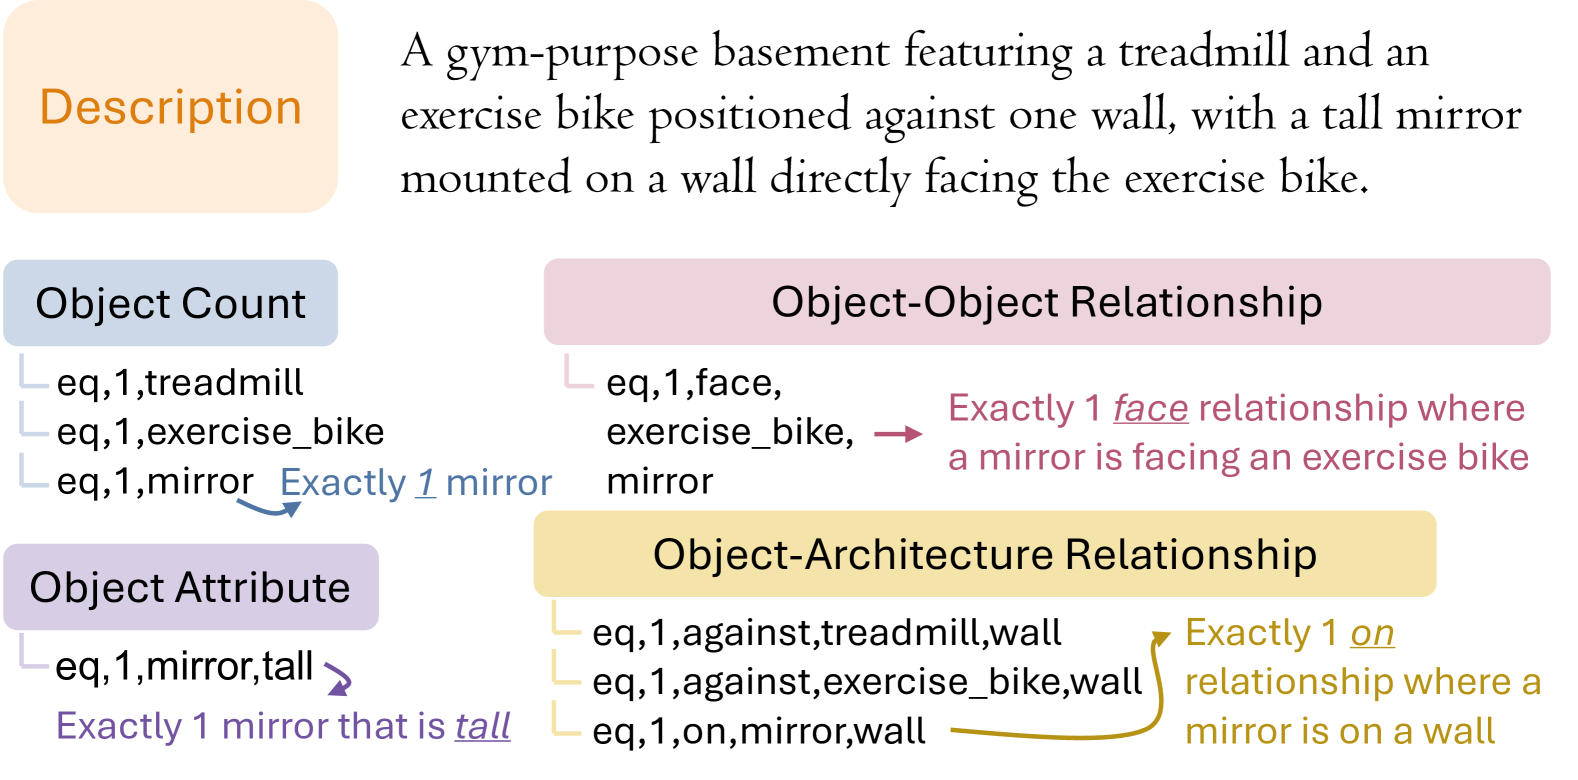
The authors manually formulate the descriptions based on personal experiences and online images of houses and apartments. Each description depicts an indoor scene with a focus on the objects and their spatial relationships. There is no predefined format for the descriptions, as we aim to capture the diversity of how people describe scenes. We manually annotate each description with its ground-truth annotations detailing the expected number of objects, their attributes, and their spatial relationships with other objects and architectural elements. The annotated number of objects can be exact or relative quantities (e.g., exactly zero, at least two). The attributes can be color, material, shape, size, style, and more specific properties like a sofa being four-seater. Tab.˜1 summarizes the statistics of our dataset. Fig.˜3 shows an example of an entry in SceneEval-100. The shortest description has 8 words and the longest has 226 words, with an average of 39.8 words. Six of the hard descriptions describe scenes with multiple rooms.
3.2 Object Matching
Given a generated scene and its annotated ground-truth properties as input, SceneEval first matches the object instances in the generated scene to the object categories specified in the annotations. We first render a front-view image for each object. We then provide an LLM with the rendered images and the specified categories and ask it to determine if the objects in the images belong to the categories. Each object category in the annotations can have zero or more corresponding object instances in the generated scene. Categories that do not have corresponding object instances remain unmatched. This mapping serves as the basis for all evaluations in the fidelity metrics.
3.3 Text Fidelity Metrics
Text fidelity is the extent to which a generated scene matches its input text description. SceneEval includes four metrics to evaluate text fidelity: object count, object attribute, object-object relationship, and object-architecture relationship.
Object Count (CNT) checks if the number of objects in the scene matches the quantities specified in the input text description. For example, a text description may specify that there should be two chairs and one table in a scene. The quantities can be exact or relative numbers (e.g., less than, more than). Using the object mapping, for each object category, we compare the instance counts in the scene to the annotated quantity and report the percentage of satisfied object count specifications.
Object Attribute (ATR) checks if objects in the scene have attributes that match what is specified in the input text description, for example, a red sofa or a wooden table. We render two images for each relevant object: one front view and one with a 170 cm human figure on the side for scale. We provide these images to an LLM along with the annotated attributes and ask it to evaluate if the objects satisfy them. Similar to object count, only if the number of objects with the correct attributes matches the expected quantities, the attribute specification is considered satisfied. It is automatically unsatisfied if no relevant object exists. We report the percentage of specifications that are satisfied.
Object-Object Relationship (OOR) checks if the object placements in the scene satisfy the spatial relationships specified in the input text description. For example, a sofa next to a coffee table or a office chair in front of a desk. We define 13 types of spatial relationships between objects: inside, outside, face, side_of, side_region, long_short_side, on_top, middle, surround, next_to, near, across, and far. See Sec.˜B.3 for more details about these relationships. The relationships in the annotations are open-vocabulary and are mapped to one or more predefined relationships using an LLM (e.g., “at the foot of the bed” would be mapped to front_of and next_to). We use techniques such as ray casting, point sampling, and position analysis to check the spatial relationships between objects. See details in Sec.˜B.2. As in previous metrics, we check if the expected quantities of relationships are met and report the percentage of satisfied specifications.
Object-Architecture Relationship (OAR) checks if the object placements in the scene satisfy the spatial relationships between objects and architectural elements specified in the input text description. For example, a sofa against a wall or a rug in the middle of a room. We define 10 types of spatial relationships between objects and architectural elements: next_to, near, across, far, inside_room, middle_room, corner_room, on_wall, against_wall, and hang_ceiling. See Sec.˜B.3 for more details. The architectural element in reference can be one of: room, wall, floor, ceiling, door, or window. We use a similar process as in OOR to evaluate the annotated relationships against all related objects and architectural elements and report the percentage of relationship specifications that are satisfied.
3.4 Plausibility Metrics
While text is a powerful medium for users to communicate scene specifications, there are implicit expectations for scenes that are often assumed by humans even if they are not explicitly stated. SceneEval includes five plausibility metrics to evaluate these implicit expectations: object collision, object support, scene navigability, object accessibility, and object out-of-bound.
Object Collision (COL) evaluates whether objects in a scene are colliding with each other. A scene should never have objects that are intersecting with each other, as this is physically implausible. We perform mesh-based collision tests between all pairs of object instances in the scene and report the percentage of objects in collision.
Object Support (SUP) evaluates whether objects are stably supported in a scene using ray casting. We classify objects into four types: ground, object, wall, and ceiling, by giving rendered images of the objects to an LLM and asking it to determine the support type. Based on the type, we use ray casting to check if objects are supported by other objects or architectural elements. We report the percentage of objects that are supported.
Scene Navigability (NAV) is a metric first proposed in PhyScene Yang et al. (2024a) to measure the navigability of a scene. It measures the ratio of the largest connected free space in a scene to the total free space in the scene. Here, free space is defined as the 2D floor area that is not occupied by objects or architectural elements. A scene with poor navigability indicates that the object placements divide the scene into isolated regions, making it impossible for an agent walking in the scene to reach certain areas. We follow PhyScene’s approach and use orthogonal projection to create a 2D occupancy mask of the scene and use connected component analysis to measure the navigability.
Object Accessibility (ACC) evaluates whether the functional sides of objects in a scene are accessible. Daily objects like sofas, beds, and wardrobes have functional sides that are meant to be interacted with and must not be blocked (e.g., the front of a sofa, the three sides of a bed, and the front of a wardrobe). For each object instance, we first let an LLM choose one or more functional sides based on the object’s description. Similar to NAV, we use orthogonal projection to create a 2D occupancy mask of the scene and check if the immediate areas outside the object’s bounding box in the chosen functional sides are free of obstacles. We report the ratio of the non-occupied area to the total area of the functional side in pixels as the accessibility score. If an object has multiple functional sides, we report the best score among them.
Object Out-of-Bounds (OOB) evaluates whether objects in a scene are within the scene boundary as defined by the floor plan shape. We sample points on an object’s surface and cast rays towards the floor. If less than 99% of the points hit the floor, the object is considered out-of-bounds.
4 Experiments
| Fidelity | Plausbility | Resource | |||||||||||
| CNT% | ATR% | OOR% | OAR% | COLob% | COLsc% | SUP% | NAV% | ACC% | OOB% | MemGB | Timesec | CLIPsim | |
| ATISS | 18.77 | 18.98 | 1.15 | 12.50 | 49.55 | 77.00 | 88.95 | 99.92 | 85.48 | 13.55 | 0.14 | 1.74 | 15.88 |
| DiffuScene | 19.92 | 17.88 | 6.88 | †9.27 | 28.63 | 53.00 | 78.16 | †98.80 | 83.79 | †21.84 | 1.72 | 11.84 | 16.76 |
| LayoutGPT | 20.69 | 19.34 | 2.29 | 6.05 | 12.96 | 30.00 | 28.63 | 100.00 | 46.69 | 73.31 | - | 9.96 | 16.84 |
| InstructScene | 25.48 | 25.55 | 10.89 | †10.08 | 51.18 | 84.00 | 75.34 | †99.53 | 77.06 | †22.92 | 1.58 | 6.42 | 16.91 |
| Holodeck | 42.72 | 41.97 | 18.91 | 47.98 | 17.32 | 73.00 | 61.31 | 99.44 | 90.04 | 1.13 | - | 102.88 | 18.33 |
| InstructScene | LayoutGPT | |||||
| FID | FIDCLIP | KID1e-3 | SCA | FID | ||
| Bedroom | ATISS | 119.73 | 6.95 | 0.39 | 59.17 | 30.02 |
| DiffuScene | 123.09 | 7.13 | 0.39 | 60.49 | - | |
| LayoutGPT | - | - | - | - | 29.88 | |
| InstructScene | 114.78 | 6.65 | 0.32 | 56.02 | - | |
| Living Room | ATISS | 117.67 | 6.08 | 17.60 | 69.38 | 85.40 |
| DiffuScene | 122.20 | 6.10 | 16.49 | 72.92 | - | |
| LayoutGPT | - | - | - | - | 78.60 | |
| InstructScene | 110.39 | 5.37 | 8.16 | 65.42 | - | |
| Dining Room | ATISS | 137.10 | 8.49 | 23.60 | 67.61 | - |
| DiffuScene | 145.48 | 8.63 | 24.08 | 70.57 | - | |
| LayoutGPT | - | - | - | - | - | |
| InstructScene | 129.76 | 7.67 | 13.24 | 64.20 | - | |
4.1 Evaluated Methods
We evaluate ATISS Paschalidou et al. (2021), DiffuScene Tang et al. (2024), InstructScene Lin and MU (2024), LayoutGPT Feng et al. (2023), and Holodeck Yang et al. (2024b).
ATISS is an early transformer-based model that generates indoor scenes conditioned on the room type and floor plan shape. While it cannot be conditioned on text descriptions, it is often used as a baseline in recent work, and we include it to evaluate the importance of being able to condition on text descriptions. DiffuScene models scene generation as a diffusion process and can be conditioned on text descriptions. InstructScene incorporates a semantic scene graph as an intermediate representation and uses graph diffusion to generate scenes conditioned on text descriptions. LayoutGPT is a pioneering work that uses LLM to generate indoor scenes given text descriptions. Following the trend of using LLMs for world knowledge, Holodeck is an extensive system designed to generate multi-room indoor scenes conditioned on text descriptions with the goal of creating virtual environments for embodied AI simulation.
ATISS, DiffuScene, and InstructScene are all trained on the 3D-FRONT dataset Fu et al. (2021a, b). While LayoutGPT does not involve training, it uses scenes from 3D-FRONT as in-context examples to guide an LLM to generate scenes. Holodeck does not require a pre-existing scene dataset and uses assets from Objaverse Deitke et al. (2023). All methods use retrieval to obtain 3D assets for the scenes, and we use the same asset sources as in the original work. DiffuScene and InstructScene cannot be conditioned on a floor plan shape, while the others can. Only Holodeck can generate architectural elements (floors, walls, windows, doors, and ceilings) in addition to objects. For other methods, we provide a 6 m 6 m square floor plan shape with walls as input. Generations requiring a GPU are run on a single NVIDIA RTX 4090 with 24 GB of VRAM, totaling less than 1 hour of GPU time across all methods. For all LLM usage, we use GPT-4o-2024-08-06 Achiam et al. (2023) with the default parameters. Note that while we choose to evaluate these five methods, SceneEval is a general evaluation framework applicable to a wide range of scene generation methods.
4.2 Analysis
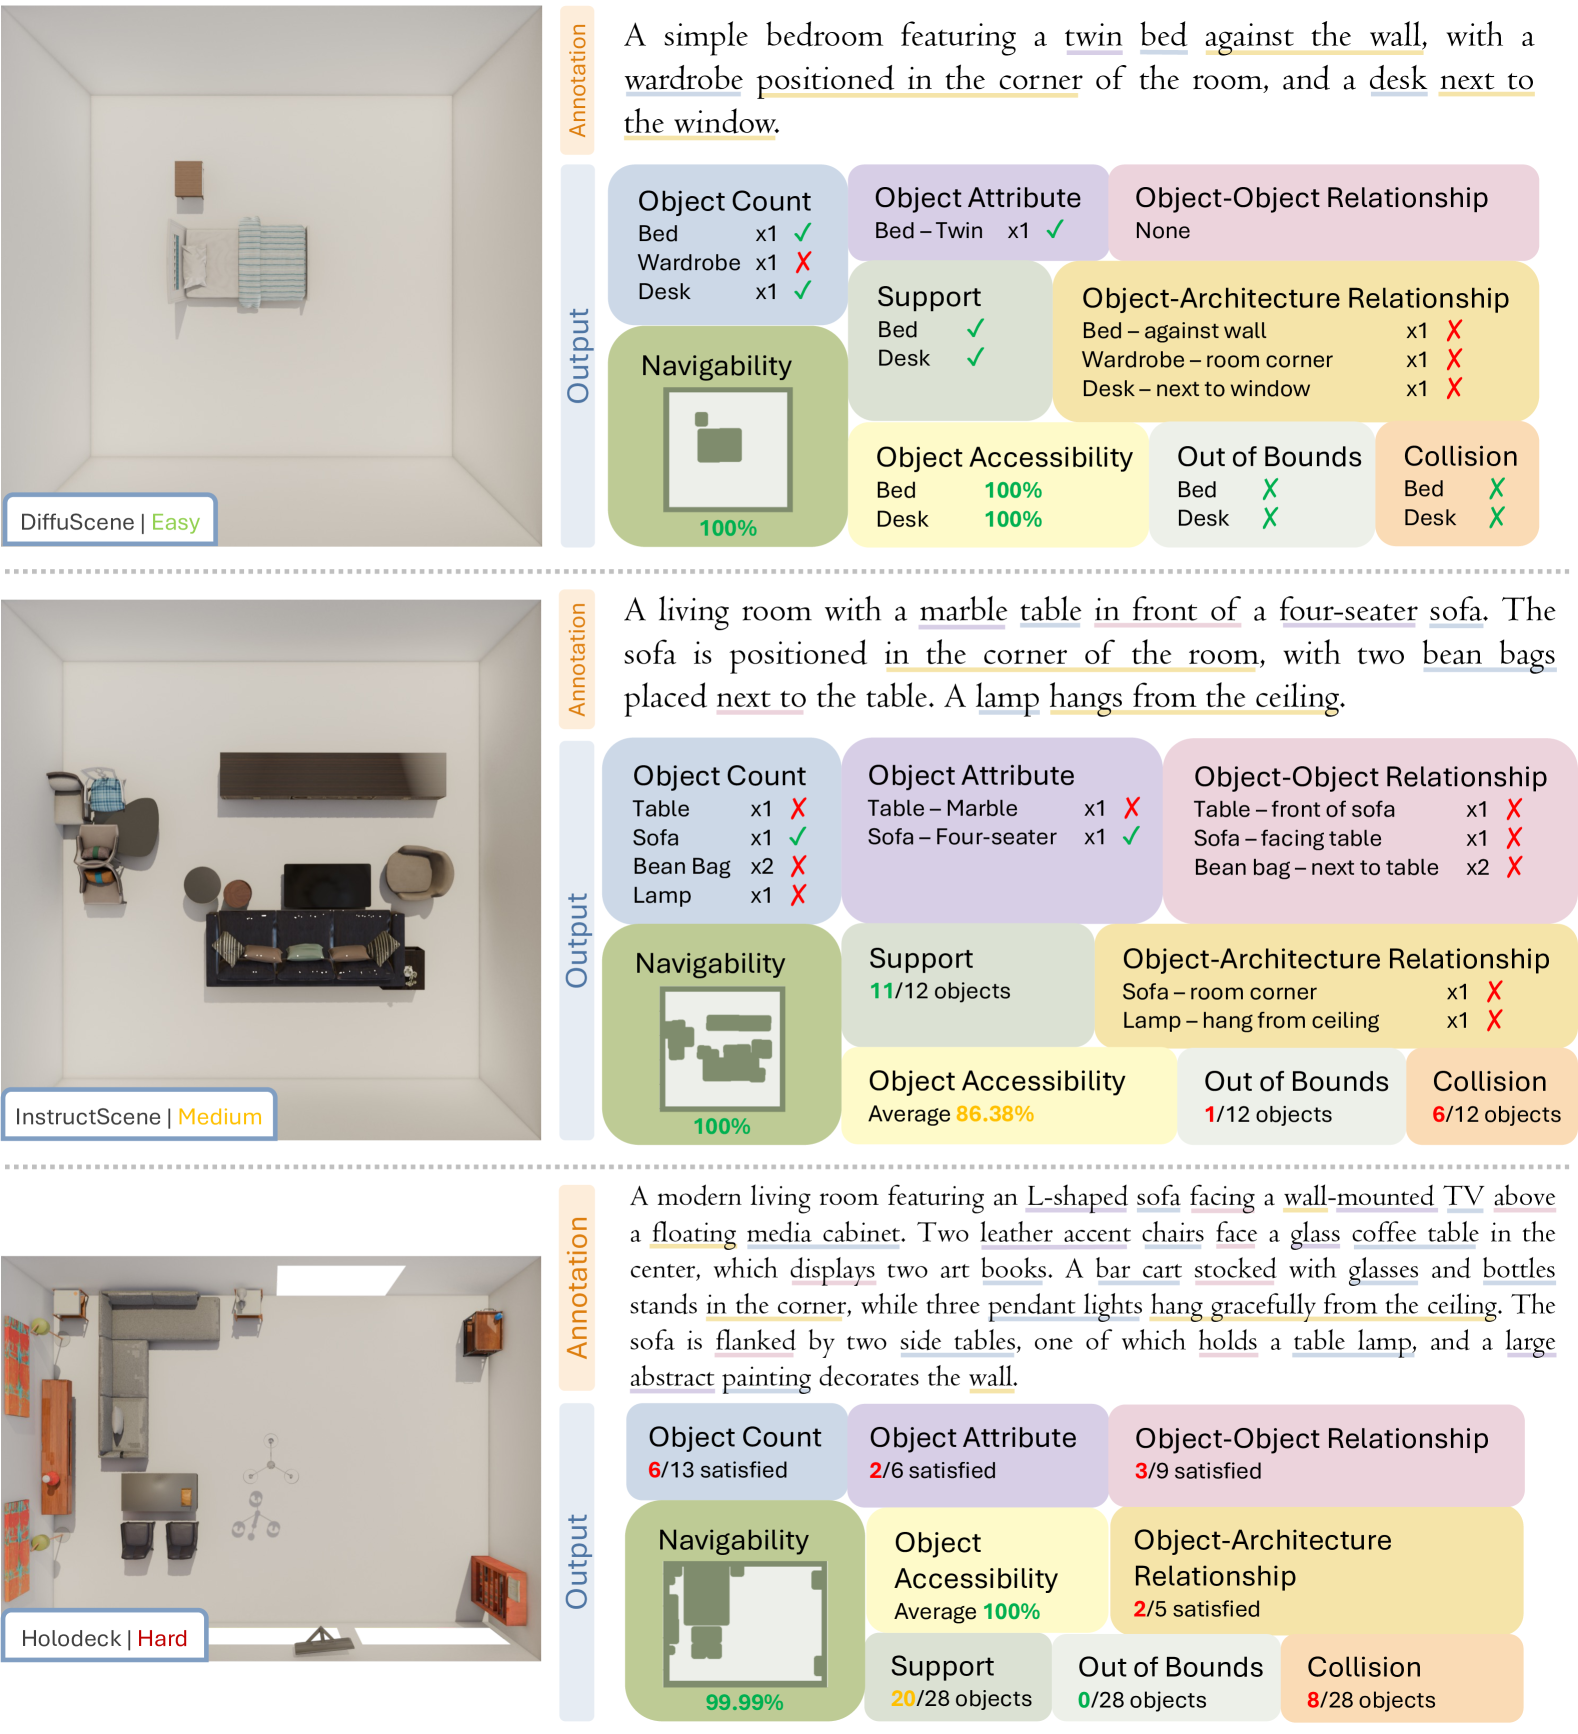
Fig.˜4 illustrates examples of generated scenes from the methods using text descriptions in SceneEval-100 as input and the corresponding SceneEval evaluation results on each of the metrics. Tab.˜3 shows the overall quantitative results. We also report the average peak GPU memory usage and the average generation time per scene, with a breakdown by description difficulty in Tab.˜5 in the appendix. Tab.˜4 shows commonly used metrics with values reported by InstructScene and LayoutGPT for reference. To validate whether SceneEval’s evaluations are aligned with human judgment, we manually evaluate 10% of the scenes generated by each method on the four fidelity aspects and found correlations of 94.3%, 86.7%, 93.3%, and 96.5% for CNT, ATR, OOR, and OAR, respectively, indicating that SceneEval is consistent with human judgment.
Holodeck has the best fidelity. Consistently across all fidelity metrics, Holodeck outperforms all other methods by non-trivial margins. Other methods struggle with simple constraints such as having the correct number of objects in the scene. A commonality among the other models is their reliance on the 3D-FRONT dataset, which may be a contributing factor to their poor performance due to the limited diversity of the 3D-FRONT dataset. While the 3D-FRONT dataset has been a valuable resource for training scene generation models, future work should investigate the effectiveness of this dataset in creating methods that align with actual user needs.
Poor object attribute compliance. All methods struggle to generate scenes with objects having the correct attributes. We hypothesize that the retrieval mechanisms used by the methods may be failing to retrieve objects with the right attributes. Furthermore, the datasets used for retrieval may not have enough diversity, preventing the methods from finding objects with the correct attributes. Methods retrieving from 3D-FUTURE Fu et al. (2021b) have consistently lower attribute compliance, compared to Holodeck which uses the more diverse Objaverse Deitke et al. (2023) dataset.
Low object-object relationship compliance. None of the methods achieve meaningful results in generating scenes with correct object-object relationships. Even Holodeck, which has the best overall fidelity, only satisfies less than 20% of the specified relationships in the input text descriptions. At this rate, users have little to no control over how objects are placed with respect to each other, which is a critical limitation for practical applications. More research is needed to develop methods that better capture and fulfill these requirements.
Scene plausibility can be improved. At first glance, LayoutGPT appears to perform best in plausibility, with the highest score in both object collision and scene navigability. However, LayoutGPT has the highest out-of-bounds rate and the lowest support rate, indicating that its high scores are the result of not properly respecting the scene boundaries. By placing objects outside the scene boundaries, its scenes have fewer collisions and more free space for navigation. This demonstrates the importance of a comprehensive evaluation of plausibility, which SceneEval provides, as a high score in one metric does not necessarily give the full picture of a method’s performance.
SceneEval metrics are more interpretable. While CLIPsim in Tab.˜3 (computed with Long-CLIP-L Zhang et al. (2024)) and other metrics from prior work in Tab.˜4 allow for relative comparison of the performance of the methods in generating scenes that match the input descriptions or the set of ground truth scenes, these metrics give little insight into the scene quality. For example, the higher FID or lower CLIPsim of DiffuScene does not illuminate whether this is due to poor scene layout, unrealistic object appearances, or other visual inconsistencies. Conversely, it is hard to interpret how much the fidelity of Holodeck scenes improves on InstructScene with +1.42 CLIPsim. Reliance on specific scene datasets for evaluation also renders prior metrics inapplicable for evaluating models that do not have a reference dataset, which is often the case for newer LLM-based methods. In contrast, SceneEval provides a more direct evaluation of a method’s ability to follow the input text description in a less dataset-dependent way, suitable for evaluating a wider range of methods.
5 Conclusion
We presented SceneEval, a comprehensive evaluation framework for 3D indoor scene generation that provides a rich set of metrics for evaluating both explicit user requirements and implicit expectations. Compared to commonly used metrics that focus on distributional similarity between generated and ground-truth scenes, SceneEval provides a more direct evaluation of the fidelity of generated scenes against input text descriptions, enabling better understanding of the performance of existing methods in respecting user intent. In addition, SceneEval includes metrics for assessing implicit expectations that are often assumed but not explicitly stated by users, which are crucial for generating realistic scenes. We constructed SceneEval-100, a dataset of 100 3D indoor scene descriptions with detailed annotations of expected scene properties, to facilitate our evaluations. Our experiments demonstrated that scene generation methods struggle to generate scenes that are faithful to the input text descriptions and meet implicit expectations. These limitations are detrimental to deployment of these methods in real-world applications, highlighting the need for further research. We believe SceneEval will be a valuable tool for building scene generation methods that better align with user needs and expectations.
6 Limitations
While our dataset and metrics provide a better coverage of important aspects of scene generation compared to existing metrics, they are not perfect.
First, our metrics currently do not consider whether objects in the generated scenes are placed according to “common sense” expectations, even if they are not explicitly specified in the input text descriptions. For example, large furniture items, like bookshelves, are typically placed against walls, except when they are used to divide spaces. Such common sense expectations are crucial for realism of the generated scenes and is an important aspect for evaluating scene generation models. Unfortunately, such expectations are less well-defined. As a result, incorporating them into the evaluation metrics is challenging and requires further research.
Second, SceneEval’s execution time currently scales with the number of objects in the scene. As scenes get more complex, the time required to perform object matching and compute the metrics also increases, as there are more objects to process. Exploring parallelization and other optimization techniques to reduce the execution time is an important direction for future work.
Third, while our dataset covers more room types than existing datasets, it is still limited in the number of descriptions and the diversity of scenes. Expanding the dataset to include more room types and more diverse scene descriptions would make the evaluations more comprehensive and provide a broader understanding of the strengths and weaknesses of scene generation models.
Lastly, the people who wrote the descriptions and annotations in our dataset are primarily from Asia, with experience living in Western countries. None of them are professional interior designers or architects. This may introduce biases in the dataset, as the descriptions may reflect cultural norms and expectations that are not universal.
Acknowledgments
This work was funded in part by the Sony Research Award Program, a CIFAR AI Chair, a Canada Research Chair, NSERC Discovery Grants, and enabled by support from the Digital Research Alliance of Canada. We thank Nao Yamato, Yotaro Shimose, and other members on the Sony team for their feedback. We also thank Qirui Wu, Xiaohao Sun, and Han-Hung Lee for helpful discussions.
References
- Achiam et al. (2023) Josh Achiam, Steven Adler, Sandhini Agarwal, Lama Ahmad, Ilge Akkaya, Florencia Leoni Aleman, Diogo Almeida, Janko Altenschmidt, Sam Altman, Shyamal Anadkat, et al. 2023. GPT-4 technical report. arXiv preprint arXiv:2303.08774.
- Aguina-Kang et al. (2024) Rio Aguina-Kang, Maxim Gumin, Do Heon Han, Stewart Morris, Seung Jean Yoo, Aditya Ganeshan, R Kenny Jones, Qiuhong Anna Wei, Kailiang Fu, and Daniel Ritchie. 2024. Open-universe indoor scene generation using LLM program synthesis and uncurated object databases. arXiv preprint arXiv:2403.09675.
- Anderson et al. (2016) Peter Anderson, Basura Fernando, Mark Johnson, and Stephen Gould. 2016. SPICE: Semantic propositional image caption evaluation. In Proceedings of the European Conference on Computer Vision (ECCV), pages 382–398.
- Banerjee and Lavie (2005) Satanjeev Banerjee and Alon Lavie. 2005. METEOR: An automatic metric for MT evaluation with improved correlation with human judgments. In Proceedings of the ACL Workshop on Intrinsic and Extrinsic Evaluation Measures for Machine Translation and/or Summarization, pages 65–72.
- Bińkowski et al. (2018) Mikołaj Bińkowski, Dougal J. Sutherland, Michael Arbel, and Arthur Gretton. 2018. Demystifying MMD GANs. In Proceedings of the International Conference on Learning Representations (ICLR).
- Bukowski and Séquin (1995) Richard W Bukowski and Carlo H. Séquin. 1995. Object associations: A simple and practical approach to virtual 3D manipulation. In Proceedings of the 1995 Symposium on Interactive 3D Graphics, pages 131–ff.
- Çelen et al. (2024) Ata Çelen, Guo Han, Konrad Schindler, Luc Van Gool, Iro Armeni, Anton Obukhov, and Xi Wang. 2024. I-Design: Personalized LLM interior designer. arXiv preprint arXiv:2404.02838.
- Chang et al. (2015) Angel Chang, Will Monroe, Manolis Savva, Christopher Potts, and Christopher D Manning. 2015. Text to 3D scene generation with rich lexical grounding. In Proceedings of the 53rd Annual Meeting of the Association for Computational Linguistics and the 7th International Joint Conference on Natural Language Processing (Volume 1: Long Papers), pages 53–62.
- Clay and Wilhelms (1996) Sharon Rose Clay and Jane Wilhelms. 1996. Put: Language-based interactive manipulation of objects. IEEE Computer Graphics and Applications, 16(2):31–39.
- Coyne and Sproat (2001) Bob Coyne and Richard Sproat. 2001. WordsEye: An automatic text-to-scene conversion system. In Proceedings of the 28th Annual Conference on Computer Graphics and Interactive Techniques, pages 487–496.
- Deitke et al. (2023) Matt Deitke, Dustin Schwenk, Jordi Salvador, Luca Weihs, Oscar Michel, Eli VanderBilt, Ludwig Schmidt, Kiana Ehsani, Aniruddha Kembhavi, and Ali Farhadi. 2023. Objaverse: A universe of annotated 3D objects. In Proceedings of the IEEE Conference on Computer Vision and Pattern Recognition (CVPR), pages 13142–13153.
- Deitke et al. (2022) Matt Deitke, Eli VanderBilt, Alvaro Herrasti, Luca Weihs, Kiana Ehsani, Jordi Salvador, Winson Han, Eric Kolve, Aniruddha Kembhavi, and Roozbeh Mottaghi. 2022. ProcTHOR: Large-scale embodied AI using procedural generation. In Advances in Neural Information Processing Systems, pages 5982–5994.
- Feng et al. (2023) Weixi Feng, Wanrong Zhu, Tsu-jui Fu, Varun Jampani, Arjun Akula, Xuehai He, Sugato Basu, Xin Eric Wang, and William Yang Wang. 2023. LayoutGPT: Compositional visual planning and generation with large language models. In Advances in Neural Information Processing Systems, volume 36, pages 18225–18250.
- Fisher et al. (2012) Matthew Fisher, Daniel Ritchie, Manolis Savva, Thomas Funkhouser, and Pat Hanrahan. 2012. Example-based synthesis of 3D object arrangements. ACM Transactions on Graphics (TOG), 31(6):1–11.
- Fu et al. (2021a) Huan Fu, Bowen Cai, Lin Gao, Ling-Xiao Zhang, Jiaming Wang, Cao Li, Qixun Zeng, Chengyue Sun, Rongfei Jia, Binqiang Zhao, et al. 2021a. 3D-FRONT: 3D furnished rooms with layouts and semantics. In Proceedings of the IEEE International Conference on Computer Vision (ICCV), pages 10913–10922.
- Fu et al. (2021b) Huan Fu, Rongfei Jia, Lin Gao, Mingming Gong, Binqiang Zhao, Steve Maybank, and Dacheng Tao. 2021b. 3D-FUTURE: 3D furniture shape with texture. International Journal of Computer Vision (IJCV), 129:3313–3337.
- Fu et al. (2024) Rao Fu, Zehao Wen, Zichen Liu, and Srinath Sridhar. 2024. AnyHome: Open-vocabulary generation of structured and textured 3D homes. In Proceedings of the European Conference on Computer Vision (ECCV), pages 52–70.
- Hessel et al. (2021) Jack Hessel, Ari Holtzman, Maxwell Forbes, Ronan Le Bras, and Yejin Choi. 2021. CLIPScore: A reference-free evaluation metric for image captioning. In Proceedings of the Conference on Empirical Methods in Natural Language Processing (EMNLP).
- Heusel et al. (2017) Martin Heusel, Hubert Ramsauer, Thomas Unterthiner, Bernhard Nessler, and Sepp Hochreiter. 2017. GANs trained by a two time-scale update rule converge to a local nash equilibrium. In Advances in Neural Information Processing Systems, volume 30.
- Hu et al. (2024a) Siyi Hu, Diego Martin Arroyo, Stephanie Debats, Fabian Manhardt, Luca Carlone, and Federico Tombari. 2024a. Mixed diffusion for 3D indoor scene synthesis. arXiv preprint arXiv:2405.21066.
- Hu et al. (2024b) Ziniu Hu, Ahmet Iscen, Aashi Jain, Thomas Kipf, Yisong Yue, David A Ross, Cordelia Schmid, and Alireza Fathi. 2024b. SceneCraft: An LLM agent for synthesizing 3D scenes as Blender code. In Proceedings of the International Conference on Machine Learning (ICML), volume 235, pages 19252–19282.
- Huang et al. (2024a) Ziqi Huang, Yinan He, Jiashuo Yu, Fan Zhang, Chenyang Si, Yuming Jiang, Yuanhan Zhang, Tianxing Wu, Qingyang Jin, Nattapol Chanpaisit, et al. 2024a. VBench: Comprehensive benchmark suite for video generative models. In Proceedings of the IEEE Conference on Computer Vision and Pattern Recognition (CVPR), pages 21807–21818.
- Huang et al. (2024b) Ziqi Huang, Fan Zhang, Xiaojie Xu, Yinan He, Jiashuo Yu, Ziyue Dong, Qianli Ma, Nattapol Chanpaisit, Chenyang Si, Yuming Jiang, et al. 2024b. VBench++: Comprehensive and versatile benchmark suite for video generative models. arXiv preprint arXiv:2411.13503.
- Keshavarzi et al. (2020) Mohammad Keshavarzi, Aakash Parikh, Xiyu Zhai, Melody Mao, Luisa Caldas, and Allen Y Yang. 2020. SceneGen: Generative contextual scene augmentation using scene graph priors. arXiv preprint arXiv:2009.12395.
- Kynkäänniemi et al. (2023) Tuomas Kynkäänniemi, Tero Karras, Miika Aittala, Timo Aila, and Jaakko Lehtinen. 2023. The role of ImageNet classes in Fréchet inception distance. In Proceedings of the International Conference on Learning Representations (ICLR).
- Li et al. (2019) Manyi Li, Akshay Gadi Patil, Kai Xu, Siddhartha Chaudhuri, Owais Khan, Ariel Shamir, Changhe Tu, Baoquan Chen, Daniel Cohen-Or, and Hao Zhang. 2019. GRAINS: Generative recursive autoencoders for indoor scenes. ACM Transactions on Graphics (TOG), 38(2):1–16.
- Lin and MU (2024) Chenguo Lin and Yadong MU. 2024. InstructScene: Instruction-driven 3D indoor scene synthesis with semantic graph prior. In Proceedings of the International Conference on Learning Representations (ICLR).
- Lin (2004) Chin-Yew Lin. 2004. ROUGE: A package for automatic evaluation of summaries. In Text Summarization Branches Out, pages 74–81.
- Lin et al. (2024) Zhiqiu Lin, Deepak Pathak, Baiqi Li, Jiayao Li, Xide Xia, Graham Neubig, Pengchuan Zhang, and Deva Ramanan. 2024. Evaluating text-to-visual generation with image-to-text generation. In Proceedings of the European Conference on Computer Vision (ECCV), pages 366–384.
- Ma et al. (2018) Rui Ma, Akshay Gadi Patil, Matthew Fisher, Manyi Li, Sören Pirk, Binh-Son Hua, Sai-Kit Yeung, Xin Tong, Leonidas Guibas, and Hao Zhang. 2018. Language-driven synthesis of 3D scenes from scene databases. ACM Transactions on Graphics (TOG), 37(6):1–16.
- Papineni et al. (2002) Kishore Papineni, Salim Roukos, Todd Ward, and Wei-Jing Zhu. 2002. BLEU: A method for automatic evaluation of machine translation. In Proceedings of the 40th annual meeting of the Association for Computational Linguistics, pages 311–318.
- Paschalidou et al. (2021) Despoina Paschalidou, Amlan Kar, Maria Shugrina, Karsten Kreis, Andreas Geiger, and Sanja Fidler. 2021. ATISS: Autoregressive transformers for indoor scene synthesis. In Advances in Neural Information Processing Systems, volume 34, pages 12013–12026.
- Raistrick et al. (2024) Alexander Raistrick, Lingjie Mei, Karhan Kayan, David Yan, Yiming Zuo, Beining Han, Hongyu Wen, Meenal Parakh, Stamatis Alexandropoulos, Lahav Lipson, et al. 2024. Infinigen Indoors: Photorealisltic indoor scenes using procedural generation. In Proceedings of the IEEE Conference on Computer Vision and Pattern Recognition (CVPR), pages 21783–21794.
- Ritchie et al. (2019) Daniel Ritchie, Kai Wang, and Yu-an Lin. 2019. Fast and flexible indoor scene synthesis via deep convolutional generative models. In Proceedings of the IEEE Conference on Computer Vision and Pattern Recognition (CVPR), pages 6175–6183.
- Savva et al. (2016) Manolis Savva, Angel X Chang, Pat Hanrahan, Matthew Fisher, and Matthias Nießner. 2016. Pigraphs: Learning interaction snapshots from observations. ACM Transactions on Graphics (TOG), 35(4):1–12.
- Shinya and Forgue (1995) Mikio Shinya and Marie-Claire Forgue. 1995. Laying out objects with geometric and physical constraints. The Visual Computer, 11:188–201.
- Sun et al. (2024) Qi Sun, Hang Zhou, Wengang Zhou, Li Li, and Houqiang Li. 2024. Forest2Seq: Revitalizing order prior for sequential indoor scene synthesis. In Proceedings of the European Conference on Computer Vision (ECCV), pages 251–268.
- Tang et al. (2024) Jiapeng Tang, Yinyu Nie, Lev Markhasin, Angela Dai, Justus Thies, and Matthias Nießner. 2024. DiffuScene: Denoising diffusion models for generative indoor scene synthesis. In Proceedings of the IEEE Conference on Computer Vision and Pattern Recognition (CVPR), pages 20507–20518.
- Vedantam et al. (2015) Ramakrishna Vedantam, C Lawrence Zitnick, and Devi Parikh. 2015. CIDEr: Consensus-based image description evaluation. In Proceedings of the IEEE Conference on Computer Vision and Pattern Recognition (CVPR), pages 4566–4575.
- Wang et al. (2024a) Can Wang, Hongliang Zhong, Menglei Chai, Mingming He, Dongdong Chen, and Jing Liao. 2024a. Chat2Layout: Interactive 3D furniture layout with a multimodal LLM. arXiv preprint arXiv:2407.21333.
- Wang et al. (2019) Kai Wang, Yu-An Lin, Ben Weissmann, Manolis Savva, Angel X Chang, and Daniel Ritchie. 2019. PlanIT: Planning and instantiating indoor scenes with relation graph and spatial prior networks. ACM Transactions on Graphics (TOG), 38(4):1–15.
- Wang et al. (2018) Kai Wang, Manolis Savva, Angel X Chang, and Daniel Ritchie. 2018. Deep convolutional priors for indoor scene synthesis. ACM Transactions on Graphics (TOG), 37(4):1–14.
- Wang et al. (2024b) Yian Wang, Xiaowen Qiu, Jiageng Liu, Zhehuan Chen, Jiting Cai, Yufei Wang, Tsun-Hsuan Wang, Zhou Xian, and Chuang Gan. 2024b. Architect: Generating vivid and interactive 3D scenes with hierarchical 2D inpainting. In Advances in Neural Information Processing Systems, volume 37, pages 67575–67603.
- Wu et al. (2024) Tong Wu, Guandao Yang, Zhibing Li, Kai Zhang, Ziwei Liu, Leonidas Guibas, Dahua Lin, and Gordon Wetzstein. 2024. GPT-4V(ision) is a human-aligned evaluator for text-to-3D generation. In Proceedings of the IEEE Conference on Computer Vision and Pattern Recognition (CVPR), pages 22227–22238.
- Yang et al. (2024a) Yandan Yang, Baoxiong Jia, Peiyuan Zhi, and Siyuan Huang. 2024a. PhyScene: Physically interactable 3D scene synthesis for embodied AI. In Proceedings of the IEEE Conference on Computer Vision and Pattern Recognition (CVPR), pages 16262–16272.
- Yang et al. (2024b) Yue Yang, Fan-Yun Sun, Luca Weihs, Eli VanderBilt, Alvaro Herrasti, Winson Han, Jiajun Wu, Nick Haber, Ranjay Krishna, Lingjie Liu, et al. 2024b. Holodeck: Language guided generation of 3D embodied AI environments. In Proceedings of the IEEE Conference on Computer Vision and Pattern Recognition (CVPR), pages 16277–16287.
- Ye et al. (2024) Zhaoda Ye, Xinhan Zheng, Yang Liu, and Yuxin Peng. 2024. RelScene: A benchmark and baseline for spatial relations in text-driven 3D scene generation. In Proceedings of the 32nd ACM International Conference on Multimedia, pages 10563–10571.
- Yeh et al. (2012) Yi-Ting Yeh, Lingfeng Yang, Matthew Watson, Noah D Goodman, and Pat Hanrahan. 2012. Synthesizing open worlds with constraints using locally annealed reversible jump MCMC. ACM Transactions on Graphics (TOG), 31(4):1–11.
- Yu et al. (2011) Lap Fai Yu, Sai Kit Yeung, Chi Keung Tang, Demetri Terzopoulos, Tony F Chan, and Stanley J Osher. 2011. Make it Home: Automatic optimization of furniture arrangement. ACM Transactions on Graphics (TOG), 30(4).
- Zhai et al. (2024) Guangyao Zhai, Evin Pınar Örnek, Dave Zhenyu Chen, Ruotong Liao, Yan Di, Nassir Navab, Federico Tombari, and Benjamin Busam. 2024. EchoScene: Indoor scene generation via information echo over scene graph diffusion. In Proceedings of the European Conference on Computer Vision (ECCV), pages 167–184.
- Zhai et al. (2023) Guangyao Zhai, Evin Pınar Örnek, Shun-Cheng Wu, Yan Di, Federico Tombari, Nassir Navab, and Benjamin Busam. 2023. CommonScenes: Generating commonsense 3D indoor scenes with scene graphs. In Advances in Neural Information Processing Systems, volume 36, pages 30026–30038.
- Zhang et al. (2024) Beichen Zhang, Pan Zhang, Xiaoyi Dong, Yuhang Zang, and Jiaqi Wang. 2024. Long-CLIP: Unlocking the long-text capability of CLIP. In Proceedings of the European Conference on Computer Vision (ECCV), page 310–325.
- Zhang et al. (2020) Tianyi Zhang, Varsha Kishore, Felix Wu, Kilian Q Weinberger, and Yoav Artzi. 2020. BERTScore: Evaluating text generation with BERT. In Proceedings of the International Conference on Learning Representations (ICLR).
Appendices
In this appendix, we provide details about our SceneEval-100 dataset in Appendix˜A, the implementation details of our metrics in Appendix˜B, the large language model (LLM) prompts we used in Appendix˜C, and information about scientific artifacts involved and AI assistant usage in this work in Appendices˜D and E.
| Fidelity | Plausbility | ||||||||||
| Difficulty | CNT% | ATR% | OOR% | OAR% | COLob% | COLsc% | SUP% | NAV% | ACC% | OOB% | |
| ATISS | Easy | 19.01 | 15.00 | 0.00 | 6.45 | 55.60 | 82.50 | 89.22 | 99.91 | 82.32 | 14.22 |
| Medium | 21.50 | 19.79 | 0.71 | 11.11 | 46.51 | 72.50 | 90.23 | 99.93 | 89.39 | 10.70 | |
| Hard | 15.92 | 20.34 | 1.89 | 16.66 | 42.98 | 75.00 | 85.96 | 99.96 | 84.77 | 17.54 | |
| DiffuScene | Easy | 25.62 | 16.67 | 4.08 | †4.84 | 29.67 | 52.50 | 78.67 | †99.04 | 85.87 | †19.33 |
| Medium | 21.50 | 19.79 | 9.22 | †6.94 | 28.88 | 60.00 | 76.71 | †98.66 | 82.95 | †24.84 | |
| Hard | 14.93 | 16.95 | 5.66 | †13.16 | 25.58 | 40.00 | 80.62 | †98.61 | 81.11 | †20.16 | |
| LayoutGPT | Easy | 30.58 | 16.67 | 4.08 | 6.45 | 9.17 | 25.00 | 28.44 | 100.00 | 46.35 | 72.48 |
| Medium | 23.00 | 28.13 | 2.84 | 2.78 | 16.59 | 35.00 | 25.59 | 100.00 | 42.68 | 77.25 | |
| Hard | 12.44 | 13.56 | 1.26 | 7.89 | 13.64 | 30.00 | 36.36 | 100.00 | 57.11 | 65.91 | |
| InstructScene | Easy | 27.27 | 21.67 | 8.16 | †4.84 | 51.51 | 85.00 | 74.39 | †99.95 | 76.90 | †25.60 |
| Medium | 27.00 | 26.04 | 14.18 | †8.33 | 47.40 | 82.50 | 69.72 | †99.17 | 74.34 | †29.36 | |
| Hard | 22.39 | 27.97 | 8.81 | †14.04 | 58.78 | 85.00 | 89.86 | †99.41 | 83.26 | †2.70 | |
| Holodeck | Easy | 45.45 | 35.00 | 10.20 | 46.77 | 14.24 | 65.00 | 80.35 | 99.46 | 90.16 | 1.29 |
| Medium | 43.50 | 45.83 | 22.70 | 36.11 | 19.65 | 72.50 | 59.26 | 99.47 | 91.53 | 1.03 | |
| Hard | 40.30 | 42.37 | 18.24 | 56.14 | 17.87 | 90.00 | 65.64 | 99.35 | 87.83 | 1.08 | |
Appendix A Dataset Details
We provide additional details about our SceneEval-100 dataset below, including the annotation schema (Sec.˜A.1) and the data collection process (Sec.˜A.2).
A.1 Annotation Schema
| Field | Schema | Example | Meaning |
| Object Count | quantifier, quantity, object category | ge,2,bed | At least two beds. |
| Object Attribute | quantifier, quantity, object category, attribute | eq,1,bed,king-size | Exactly one bed that is king-size. |
| Object-Object Relationship | quantifier, quantity, relationship, object category 1, … | eq,1,left,0,bed,lamp | Exactly one lamp to the left of a bed. |
| Object-Architecture Relationship | quantifier, quantity, relationship, object category, architecture type | gt,2,against,bookshelf,wall | More than two bookshelves against wall. |
SceneEval-100 contains four annotation fields: object count, object attribute, object-object relationships, and object-architecture relationships. Tab.˜6 shows the annotation schema for each field along with examples. We describe the schema below.
Quantifier and quantity are used to specify the count of an annotation entry. For example, they are used to specify the number of objects in the scene for the object count field and the number of objects that have a specific attribute for the object attribute field. The quantifier can be one of the following: eq (equal), gt (greater than), lt (less than), ge (greater than or equal), or le (less than or equal). The quantity is an non-negative integer.
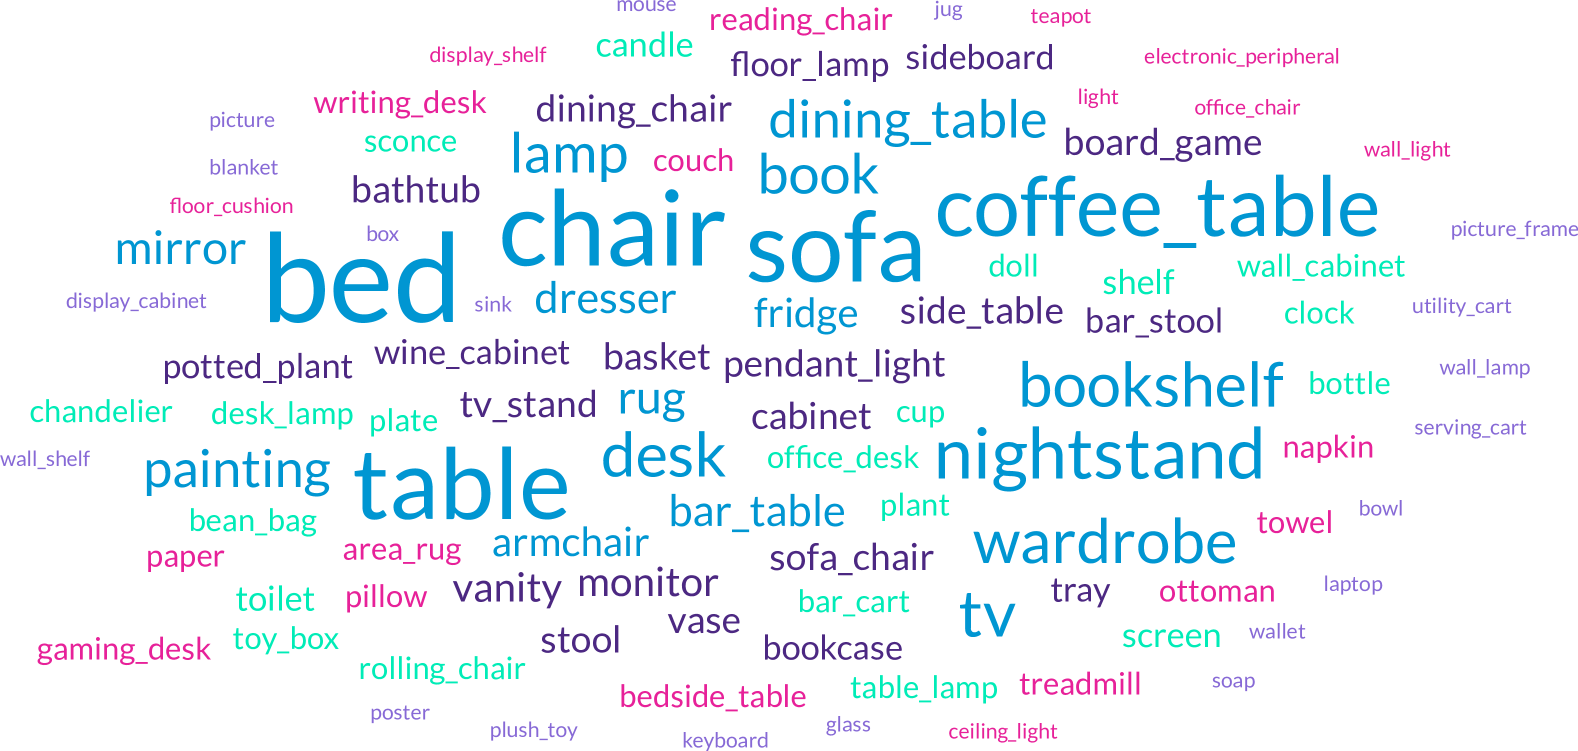
Object category specifies the object category of interest in an annotation entry. It is an open-vocabulary string that specifies exactly one object category using a noun (e.g., bed) or a noun phrase (e.g., office chair). In object-object relationships, multiple object categories are used to specify what objects are involved in a relationship, with the first object category being the anchor object that the relationship is based on. Fig.˜5 shows the most frequent object categories in SceneEval-100.
Attribute specifies the attribute of an object in an object attribute annotation entry. It is an open-vocabulary string that specifies exactly one attribute using an adjective. For example, it can be color (e.g., red), material (e.g., wooden), shape (e.g., round), size (e.g., large), style (e.g., modern), or more specific attributes (e.g., queen-size).
Architecture type specifies the type of architectural element in an object-architecture relationship annotation entry. It can be one of the following: wall, floor, ceiling, window, door, or room. It can also be a more specific room type (e.g., bedroom, kitchen) for scenes with multiple rooms.
Relationship specifies the relationship between objects in an object-object relationship annotation entry and the relationship between an object and an architectural element in an object-architecture relationship annotation entry. It is an open-vocabulary string that specifies exactly one relationship using a preposition (e.g., in front of, against), a verb (e.g., face, hang), or a prepositional phrase (e.g., at the foot of, at the corner of).
A.2 Data Collection Process
All of the scene descriptions and annotations in SceneEval-100 are written by the authors in English. The annotators are primarily from Asia, aged between 20 and 30, have lived in Western countries, and speak English as their second language. They have backgrounds in computer science, are familiar with the task of scene generation, and have been informed of the purpose of the dataset.
During the data collection process, the annotators were first given the definition of the difficulty levels, the annotation schema, and the target number of scenes to guide the annotation process. They were then asked to write scene descriptions that are diverse and cover a wide range of object categories and relationships, drawing inspiration from their daily lives or from online sources. At the same time, they were asked to annotate the scenes they wrote according to the annotation schema. Both the scene descriptions and annotations were validated by the authors to ensure quality and consistency. In addition, the scene descriptions were passed through an LLM to check for grammatical errors and typos. No personal identifiable information was collected during the whole data collection process.
Appendix B Metric Implementation Details
We provide details about about the object renderings used in SceneEval in Sec.˜B.1, additional implementation details for our metrics in Sec.˜B.2, and details about the predefined spatial relationships used in our object-object relationship and object-architecture relationship metrics in Sec.˜B.3.
B.1 Object Renderings
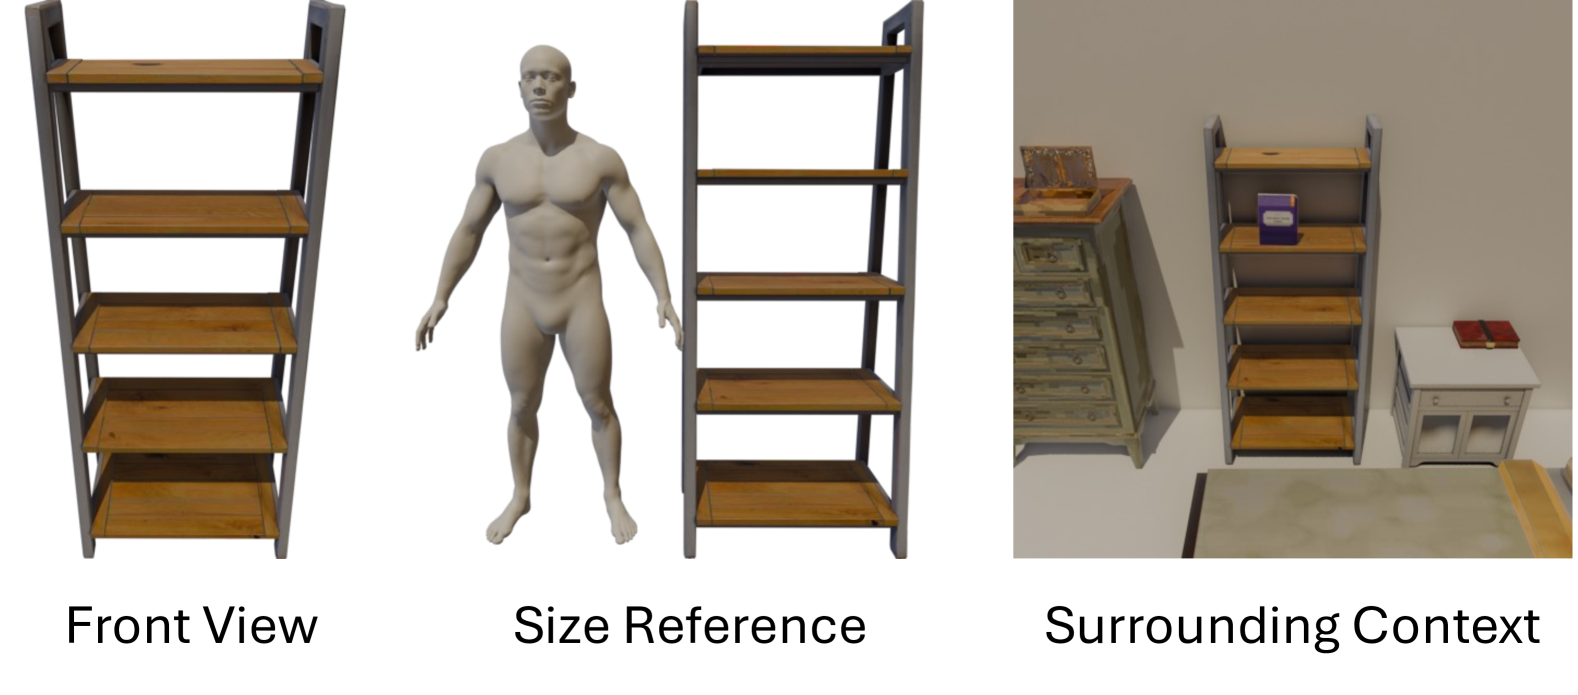
In SceneEval, we use three types of object renderings across our metrics: 1) Front View: The object is positioned in the center of the image, zoomed in, and rendered from the front with no other objects visible. 2) Size Reference: The object is rendered with a 170 cm tall human figure on the left side for size reference. 3) Surrounding Context: The object is positioned in the center of the image and zoomed out to show the surrounding context. These renderings help an LLM to understand the object’s appearance, size, and context, respectively, for various evaluation tasks. Fig.˜6 shows example renderings of these three rendering types.
B.2 Implementation Details
We provide additional details for object-object relationship and object support metrics below.
B.2.1 Object-Object Relationship
For each object-object relationship in the annotations, we first map the annotated relationship into one or more of the 13 predefined spatial relationships (see Sec.˜B.3) using an LLM. After mapping, we locate all objects in the scene that match the categories specified in the relationship. We consider all possible object combinations and compute a relationship score for each of them using the predefined spatial relationships. All mapped relationships must be satisfied for an object combination to satisfy the original specification.
B.2.2 Object Support
To evaluate whether an object is stably supported, we first give two rendered images (front view and surrounding context) to an LLM and ask it to determine the support type of the object (one of: ground, object, wall, or ceiling). Based on the type, we determine the object’s support direction in its local frame (e.g., downward for ground and backward for wall) and cast rays towards that direction, from the object mesh vertices that are closest in that direction, and check for ray contacts with other geometries in the scene within 1 cm. Wall and ceiling objects are considered supported if there are any valid contact points. (e.g., a ceiling lamp hanging from one point on the ceiling). For ground and object types, we construct a convex hull from the contact points and project the object centroid in the gravity direction. The object is considered supported if the projection is within the hull. We repeat this process for all object instances and report the percentage of objects that are supported.
B.3 Predefined Spatial Relationships
B.3.1 Object-Object Relationships
Our object-object relationship metric uses a set of 13 predefined spatial relationships between objects. We describe the implementation details of these relationships below. Unless otherwise specified, we use a threshold of 0.5 to determine if a relationship is positive or negative.
Inside and Outside determine whether an object A is inside or outside another object B (e.g., a cup is inside a cabinet). We sample points within object A’s bounding box and compute a score based on the percentage of points that are inside object B’s bounding box.
Face determines whether an object A is facing another object B (e.g., a sofa is facing a TV). We sample points within object A’s bounding box and shoot rays from these points in the direction of object A’s front vector. If there are no intersections with object B, the relationship is negative. Otherwise, we take the mean coordinates of all intersection points and compute a score based on the angle between the front vector of object A and the vector from object A’s centroid to the mean intersection point (ignoring the vertical axis). The score is 1.0 if the angle is 0.0, and drops to 0.0 as the angle approaches 30.0 degrees.
Side_of determines whether an object A is on one of the six sides (top, bottom, left, right, front, back) of another object B (e.g., a nightstand is on the left side of a bed). We sample points within object A’s bounding box and compute a score based on the percentage of points that are on the specific side of object B’s bounding box (in object B’s local coordinate frame), excluding points that are inside object B’s bounding box. Object B’s bounding box is extended by 25% in each dimension to account for slight misalignment.
Side_region determines whether an object A is in one of the six side regions of another object B (e.g., a book is on the left side of a bookshelf). The difference between this relationship and side_of is that object A can be inside object B’s bounding box. The implementation is the same as side_of, except that points inside object B’s bounding box are not excluded and no extension is applied to object B’s bounding box.
Long_short_side determines whether an object A is on the long or short side of another object B (e.g., a chair is on the long side of a table). The long and short sides are determined based on object B’s bounding box dimensions. We sample points within object A’s bounding box and compute a score based on the percentage of points that are on the long or short sides of object B.
On_top determines whether an object A is on top of another object B (e.g., a book is on top of a table). This relationship is specific for objects that are precisely placed on top of another object. The implementation is the same as side_of, with the top side of object B as the reference side, and no extension is applied to object B’s bounding box.
Middle_of determines whether an object A is in the middle of another object B (e.g., a pillow is in the middle of a bed). We compute the distance between the centroids of object A and object B in 2D (ignoring the vertical axis) and apply a Gaussian with mean 0.0 and standard deviation 0.25 to compute the score.
Surround determines whether a group of objects surrounds a central object B (e.g., two chairs and two armchairs surround a table). First, we calculate the ideal angle for uniformly distributing the objects in around object B as and the mean distance between the centroids of objects in and object B. Next, we compute the distance deviation and angle deviation from the ideal distance and angle for each object in . Each deviation is normalized by and , respectively, and clipped to be within . Finally, the score is computed as:
| (1) |
Next_to, Near, Across, and Far determine whether an object A is within a certain distance from another object B (e.g., a TV is near a plant). next_to is defined as , near is defined as , across is defined as , and far is defined as , where is the distance in meters between the closest points of the two objects. The score is 1 if falls within the specified range, and drops as deviates from the range using a Gaussian with mean 0.0 and standard deviation 0.25.
B.3.2 Object-Architecture Relationships
Our object-architecture relationship metric uses a set of 10 predefined spatial relationships between objects and architecture. We describe the implementation details of these relationships below. Same as the object-object relationships, we use a threshold of 0.5 to determine if a relationship is positive or negative.
Next_to, Near, Across, and Far are defined the same as in the object-object relationships.
Inside_room determines whether an object A is inside a room (e.g., a chair is inside a living room). We sample points within object A’s bounding box and cast rays towards the room’s floor plane. The score is computed based on the percentage of points that intersect with the room’s floor plane.
Middle_room determines whether an object A is in the middle of a room (e.g., a rug is in the middle of a room). We compute the distance between the centroid of object A and the room’s centroid in 2D (ignoring the vertical axis) and apply a Gaussian with mean 0.0 and standard deviation , where is the longer side of the object’s 2D dimensions, and is the mean 2D room dimensions to compute the score, taking into account the object’s size and the room’s size.
Corner_room determines whether an object A is in a corner of a room (e.g., a plant is in a corner of a room). For every pair of walls in the room, we compute the distance scores between object A and the two walls similar to the next_to relationship but with a range of in meters and a Gaussian with mean 0.0 and standard deviation 0.25. We also compute the dot product between the front vectors of the two walls to determine if they are perpendicular. If they are perpendicular, the score for this pair of walls is the product of the two distance scores. The final score is the maximum score among all pairs of walls.
On_wall determines whether an object A is on a wall (e.g., a painting is on a wall). We first compute a score based on the percentage of points sampled within object A’s bounding box that lie in front of the wall. Next, we compute a score based on the closest distance between object A and the wall similar to the next_to relationship but with a range of in meters and a Gaussian function of mean 0.0 and standard deviation 0.01. The final score is the product of and .
Against_wall determines whether an object A is against a wall (e.g., a sofa is against a wall). The implementation is the same as on_wall, except that the range for is and the Gaussian function has a standard deviation of 0.1.
Hang_ceiling determines whether an object A is hanging from the ceiling (e.g., a light is hanging from the ceiling). The implementation is similar to next_to, except that the reference element is the ceiling, the range for is , and the Gaussian function has a standard deviation of 0.03.
Appendix C LLM Prompts
SceneEval uses an LLM to assist in parts of the evaluation framework. We provide the system prompt in Sec.˜C.1 and the evaluation task prompts in Sec.˜C.2.
C.1 System Prompt
The system prompt provides the LLM with the overall context about the tasks and the role it plays in the evaluation framework.
C.2 Evaluation Task Prompts
There are six tasks in SceneEval that use an LLM for assistance. We provide the prompts for each task below.
C.2.1 Object Matching
This task asks the LLM to match objects in the scene to the object categories specified in the ground truth annotation. Given a front-view image of an object and the object categories, the LLM is asked to determine if the object belongs to any of the specified categories and provide a justification.
C.2.2 Object Attribute
This task asks the LLM to determine if the objects in the scene satisfy the attribute requirements in the annotations. For each object of interest, the LLM is provided with two images: one from the front view and one with a human model on the side for scale. The LLM is asked to determine if the object satisfies the attribute requirements and provide a reason for its decision.
C.2.3 Object Support Type
This task asks the LLM to identify the support type of objects in the scene. For each object, the LLM is provided with two images: one from the front view and one slightly zoomed out to show the surrounding area. The LLM is asked to pick the support type of the object from the predefined types and provide a reason for its decision.
C.2.4 Object Functional Sides
This task asks the LLM to identify the functional sides of objects in the scene. The functional sides of an object are the sides that need to be accessible for the object to be used properly. The LLM is provided with descriptions of the objects in the scene and asked to identify the functional sides of each object with a justification.
C.2.5 Object Relationship Mapping
This task asks the LLM to map open-vocabulary object-object relationships in the annotations to predefined spatial relationship types. For each input relationship, the LLM can choose multiple relationship types if multiple types are required to fully describe the relationship. The prompt provides the definition of the predefined spatial relationship types, with examples and guidelines for mapping the relationships. The LLM is asked to provide the mapped relationship types for each input relationship along with the necessary information.
C.2.6 Architectural Relationship Mapping
This task asks the LLM to map open-vocabulary relationships between objects and architectural elements in the annotations to predefined spatial relationship types. Similar to the object relationship mapping task, the LLM is provided with the definitions of the predefined spatial relationship types, with examples and guidelines for mapping the relationships. The LLM is asked to provide the mapped relationship types for each input relationship along with the necessary information.
Appendix D Scientific Artifacts
The licenses for the datasets and code used in this work are as follows. For datasets, 3D-FRONT Fu et al. (2021a) and 3D-FUTURE Fu et al. (2021b) are available under their respective terms of use1113D-FRONT Terms of Use,2223D-FUTURE Terms of Use. Objaverse Deitke et al. (2023) is available under the ODC-By v1.0 license. For code, ATISS Paschalidou et al. (2021) is available under its NVIDIA Source Code License333ATISS NVIDIA Source Code License. DiffuScene Tang et al. (2024) is under its terms of use444DiffuScene Terms of Use. Holodeck Yang et al. (2024b) and Long-CLIP Zhang et al. (2024) are available under Apache License 2.0. InstructScene Lin and MU (2024) and LayoutGPT Feng et al. (2023) are available under the MIT License. GPT-4o Achiam et al. (2023) is under the OpenAI terms of use555https://openai.com/policies/terms-of-use/. Our use of these datasets and code is in compliance with their respective licenses.
Appendix E AI Assistant Usage
GPT-4o Achiam et al. (2023) is used in this work in parts of the evaluation framework. We also used GitHub Copilot666https://github.com/features/copilot and ChatGPT777https://chat.openai.com/ to assist in writing code and checking for grammatical errors and typos in the paper.