11email: m.busmann@physik.lmu.de 22institutetext: McWilliams Center for Cosmology and Astrophysics, Department of Physics, Carnegie Mellon University, Pittsburgh, PA 15213, USA
22email: boconno2@andrew.cmu.edu 33institutetext: Excellence Cluster ORIGINS, Boltzmannstr. 2, 85748 Garching, Germany 44institutetext: Department of Natural Sciences, The Open University of Israel, P.O Box 808, Ra’anana 43537, Israel 55institutetext: Astrophysics Research Center of the Open university (ARCO), The Open University of Israel, P.O Box 808, Ra’anana 43537, Israel 66institutetext: Department of Physics, The George Washington University, Washington, DC 20052, USA 77institutetext: Instituto de Radioastronomía y Astrofísica, Universidad Nacional Autónoma de México, Antigua Carretera a Pátzcuaro 8701, Ex-Hda. San José de la Huerta, Morelia, Michoacán, C.P. 58089, México 88institutetext: Astrophysics Science Division, NASA Goddard Space Flight Center, Mail Code 661, Greenbelt, MD 20771, USA 99institutetext: NASA Postdoctoral Program Fellow, NASA Goddard Space Flight Center, Greenbelt, MD 20771, USA 1010institutetext: Max-Planck-Institut für Extraterrestrische Physik, Giessenbachstraße 1, 85748 Garching, Germany 1111institutetext: Department of Physics, University of Rome “Tor Vergata”, via della Ricerca Scientifica 1, I-00133 Rome, Italy 1212institutetext: Department of Astronomy and Astrophysics, The Pennsylvania State University, 525 Davey Lab, University Park, PA 16802, USA 1313institutetext: INAF-Istituto di Radioastronomia, Via Gobetti 101, I-40129 Bologna, Italy 1414institutetext: Center for Space Sciences and Technology, University of Maryland, Baltimore County, Baltimore, MD 21250, USA 1515institutetext: Center for Research and Exploration in Space Science and Technology, NASA/GSFC, Greenbelt, Maryland 20771, USA 1616institutetext: Perimeter Institute for Theoretical Physics, Waterloo, Ontario N2L 2Y5, Canada 1717institutetext: University of Texas, Hobby–Eberly Telescope, McDonald Observatory, TX 79734, USA
The curious case of EP241021a: Unraveling the mystery of its exceptional rebrightening
Abstract
Context. Fast X-ray Transients (FXTs) are a rare and poorly understood phenomenon with a variety of possible progenitors. The launch of the Einstein Probe (EP) mission has facilitated a rapid increase in the real-time discovery and follow-up of FXTs.
Aims. We focus on the recent EP discovered transient EP241021a, which shows a peculiar panchromatic behavior, with the aim to understand it origin.
Methods. We obtained optical and near-infrared multi-band imaging and spectroscopy with the Fraunhofer Telescope at Wendelstein Observatory, the Hobby-Eberly Telescope, and the Very Large Telescope, of the new EP discovered transient EP241021a over the first 100 days of its evolution.
Results. EP241021a was discovered by EP as a soft X-ray trigger, but was not detected at gamma-ray frequencies. The observed soft X-ray prompt emission spectrum is consistent with non-thermal radiation, which requires at least a mildly relativistic outflow with bulk Lorentz factor . The optical and near-infrared lightcurve displays a two component behavior where an initially fading component turns to a rise steeper than after a few days before peaking at an absolute magnitude mag and quickly returning to the initial decay. The peak absolute magnitude is the most luminous optical emission associated to an FXT, superseding EP240414a. Standard supernova models are unable to reproduce either the absolute magnitude or rapid timescale ( d) of the rebrightening. The X-ray, optical and near-infrared spectral energy distributions display a red color mag, and point to a non-thermal origin ( ) for the broadband emission. By considering a gamma-ray burst as a plausible scenario, we favor a refreshed shock as the cause of the rebrightening. This is consistent with the inference of an at least mildly relativistic outflow based on the prompt trigger.
Conclusions. Our results suggest a likely link between EP discovered FXTs and low luminosity gamma-ray bursts.
Key Words.:
X-rays: general – X-rays: bursts – Gamma-ray burst: general – Stars: jets1 Introduction
The Einstein probe (EP) is a new soft X-ray mission (Yuan et al., 2015, 2022, 2025) with wide-field capabilities. The Wide-field X-ray Telescope (WXT) has an instantaneous field-of-view (FOV) of 3,600 deg2 observing in the soft X-ray band between keV. This revolutionary wide-field X-ray survey capability, and on-board triggering, is able to unlock the previously hidden transient X-ray sky, acting in a similar fashion for X-ray transients as gamma-ray monitors such as the Neil Gehrels Swift Observatory (Gehrels et al., 2004) and Fermi Gamma-ray Space Telescope (Meegan et al., 2009) do for gamma-ray bursts (GRBs).
In the first year since its launch, EP has rapidly identified a number of rare X-ray transients, allowing for key follow-up at other wavelengths. Many of these on-board triggers are found to be extragalactic transients, such as GRBs. These include EP240219a (Yin et al., 2024), EP240315a/GRB 240315C (Levan et al., 2024; Liu et al., 2024; Gillanders et al., 2024; Ricci et al., 2024b) and EP240414a (Srivastav et al., 2024; van Dalen et al., 2024; Bright et al., 2024; Sun et al., 2024), EP240801a (Jiang et al., 2025), among others (e.g., Yin et al., 2024; Liu et al., 2024). The interpretation of some other EP transients has been less clear, and some may represent a new class of high-energy transients (e.g., EP240408a; O’Connor et al., 2025; Zhang et al., 2025). Comprehensive multi-wavelength follow-up is urgently required for revealing the nature and astrophysical diversity of these events.
Of particular interest regarding EP240414a ( ) are its multiple optical emission components (Srivastav et al., 2024; van Dalen et al., 2024; Sun et al., 2024), including clear evidence for a supernova (SN), see van Dalen et al. (2024). The fast timescale of the optical transient can be linked to Fast Blue Optical Transients (FBOTs; Drout et al., 2014; Pursiainen et al., 2018; Prentice et al., 2018; Margutti et al., 2019; Perley et al., 2019; Ho et al., 2023a) while the lack of a gamma-ray trigger and low peak energy (Sun et al., 2024) match characteristics of low luminosity GRBs (Galama et al., 1998; Malesani et al., 2004; Sakamoto et al., 2004; Soderberg et al., 2004a, b, 2006; Starling et al., 2011; Izzo et al., 2019; H. E. S. S. Collaboration et al., 2021). Therefore, EP240414a appears to potentially be the missing link between multiple classes of high-energy sources, though the connection is still inconclusive (Srivastav et al., 2024). This is challenging to solidify as the production of low luminosity GRBs is still not well understood (see, e.g., Irwin & Hotokezaka, 2024c, b, a). An alternative interpretation is that EP240414a represents an entirely different class of transient that had not been previously observed.
In this manuscript, we present our multi-wavelength campaign of the recently discovered EP241021a. We find that EP241021a presents a similar behavior to EP240414a in its multiple, clearly distinct emission episodes. Localized to redshift (Pugliese et al., 2024; Pérez-Fournon et al., 2024; Zheng et al., 2024a), EP241021a has a peak absolute magnitude of mag, making this the most luminous optical emission from a fast X-ray transient, and a timescale of only a few days after the peak. We analyze the X-ray, optical, near-infrared and radio dataset of EP241021a to determine whether it requires multiple emission components or can potentially be explained by the same outflow. We further connect EP241021a to the previous peculiar EP transient EP240414a and discuss the possible interpretations for their multiwavelength behavior.
Throughout the manuscript we adopt a standard CDM-cosmology (Planck Collaboration et al., 2020). We also adopt the convention for the flux density where is the temporal index and is the spectral index. All upper limits are reported at the level and all magnitudes are in the AB system.
2 Observations
2.1 Prompt X-ray Trigger and Gamma-ray Limits
The Wide-field X-ray Telescope (WXT) onboard the Einstein Probe (EP; Yuan et al. 2015, 2022, 2025) triggered on EP241021a on 2024-10-21 at 05:07:56 UT (Hu et al., 2024). The source had a duration of 100 s with a time-averaged X-ray flux ( keV) of erg cm-2 s-1 (90% confidence level; CL). The soft X-ray fluence is approximately erg cm-2, yielding an estimate of the isotropic-equivalent energy ( keV) of erg at (Pugliese et al., 2024; Pérez-Fournon et al., 2024; Zheng et al., 2024a).
At the time of the EP trigger Konus-Wind was observing the entire sky, but did not detect EP241021a in gamma-rays (Svinkin et al., 2024). The 90% confidence upper limit to the peak gamma-ray flux ( keV) is erg cm-2 s-1 assuming a timescale of 2.944 s (Svinkin et al., 2024). We adopt a typical long GRB spectrum characterized by a Band function (Band et al., 1993) with peak energy keV and low and high spectral indices and , respectively. This is roughly consistent with the photon index determined from the initial EP trigger, at the 90% CL (Hu et al., 2024). This bolometric correction yields an upper limit to the isotropic-equivalent gamma-ray energy of erg for the gamma-ray fluence in the keV energy range. We discuss these implications further in §4.5.
2.2 Fraunhofer Telescope Wendelstein (FTW)
We observed the optical and near-infrared (OIR) counterpart of EP241021a with the Three Channel Imager (3KK; Lang-Bardl et al. 2016) on the 2.1 m Fraunhofer Telescope at Wendelstein Observatory (FTW; Hopp et al. 2014) located on Mt. Wendelstein at the northern edge of the Alps. 3KK can observe a FOV in three channels simultaneously. The blue channel can observe either in the u’, g’ or r’ band, the red channel in the i’ or z’ band, and the NIR channel supports the Y, J, H and bands. Data were obtained 22 times between 2024-10-23T02:12:17 UT (2.8 d after the EP-WXT trigger) and 2024-12-01T18:26:38 UT (43 d after the EP-WXT trigger) in the r’, i’, z’, J, and H band. The majority of observations were obtained simultaneously in the r’z’J filters.
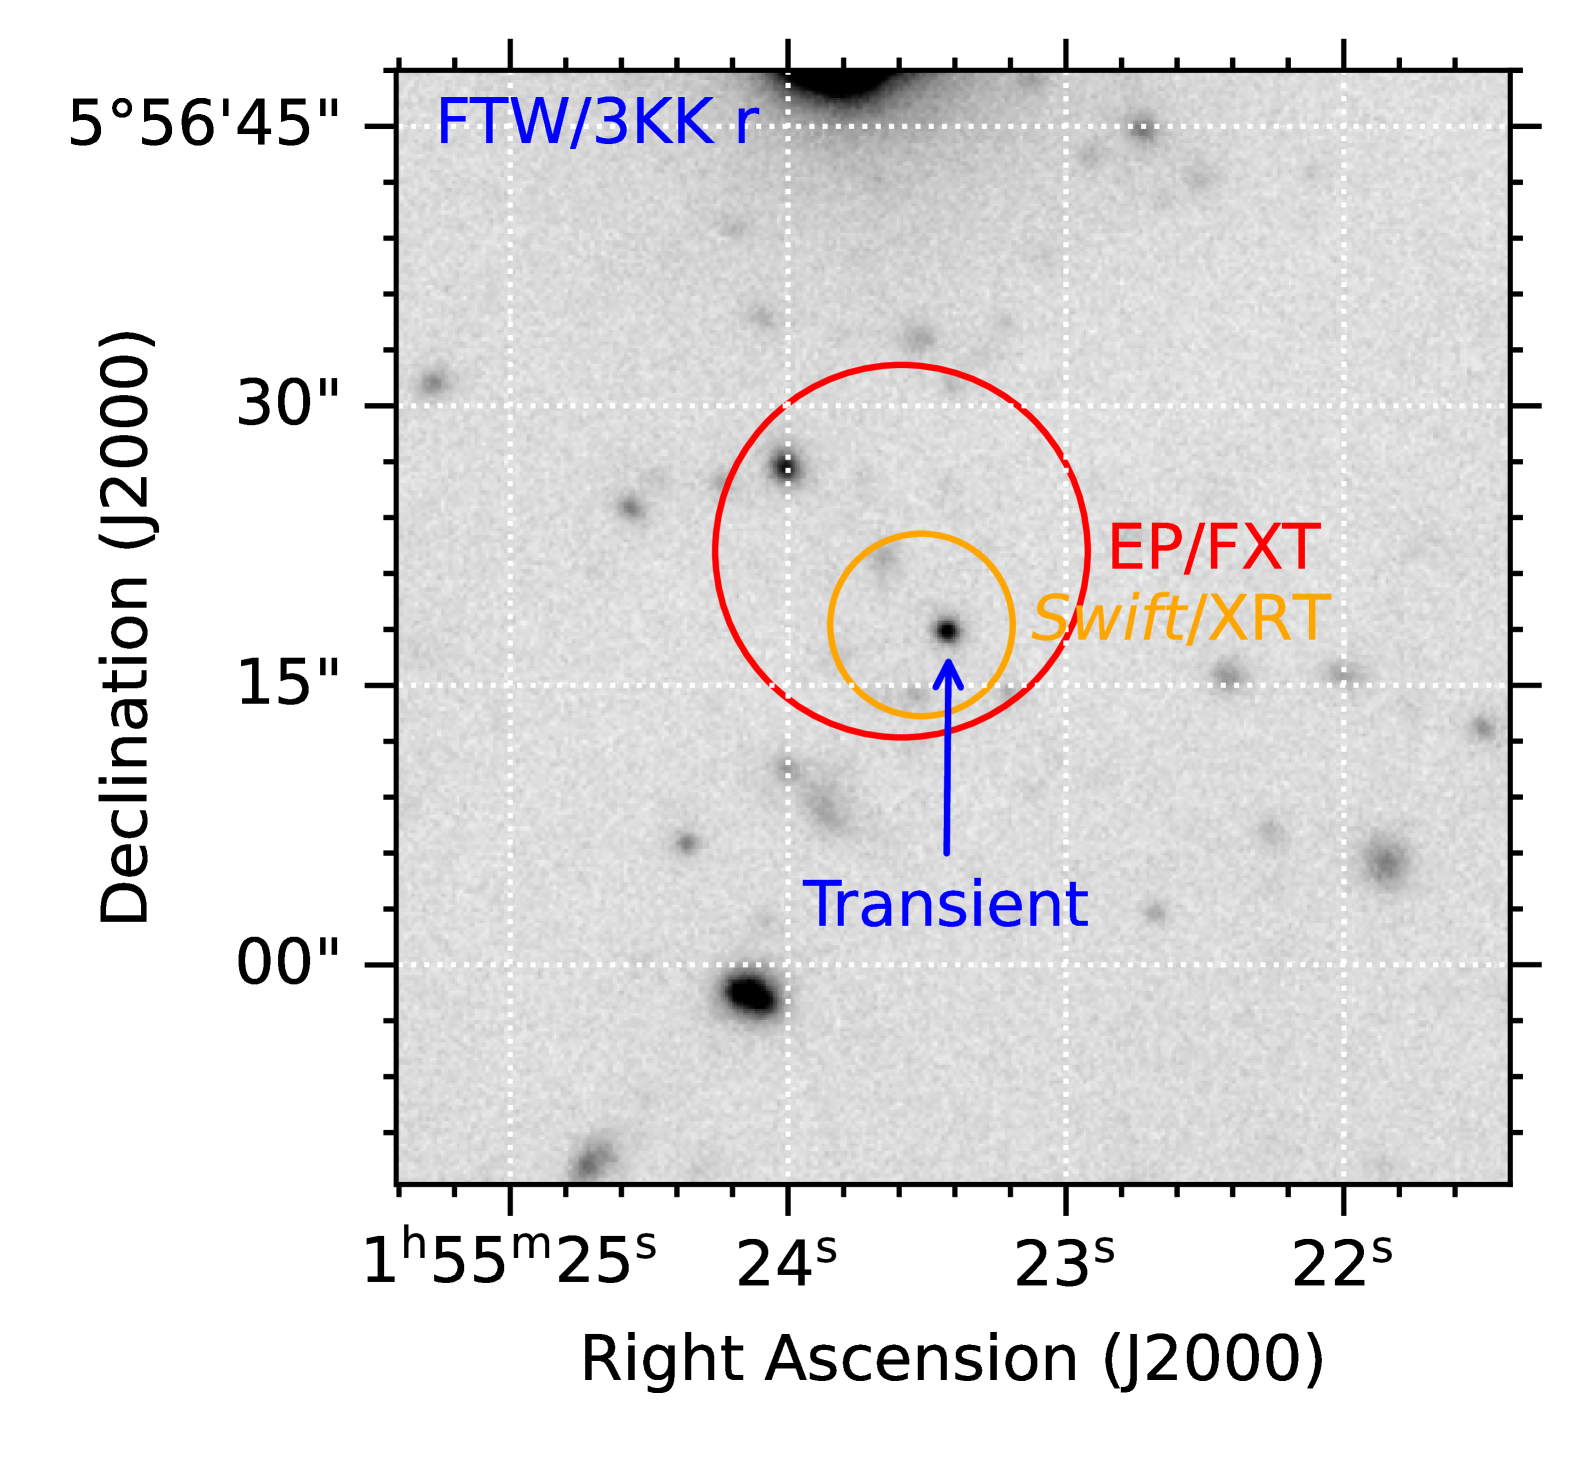
The data were reduced and analyzed using a custom data analysis pipeline based on Gössl & Riffeser (2002) that applies standard image processing techniques such as bias and dark subtraction, flat-fielding, cosmic ray rejection, among other corrections. The images were stacked using tools from the AstrOmatic software suite (Bertin & Arnouts, 1996; Bertin et al., 2002; Bertin, 2006). The OIR counterpart is detected throughout our observations (see Figure 1), which include a net 38.1 hr of exposure with the 3KK imager. Archival observations as part of the DESI Legacy Surveys do not reveal an underlying galaxy to deep limits (Fu et al., 2024b), and as such we do not perform difference imaging due to the lack of existing templates or a known host galaxy brightness. Aperture photometry of the OIR counterpart was computed using Photutils (Bradley et al., 2024) and calibrated to the 2MASS (Skrutskie et al., 2006) and PS1 (Chambers et al., 2016) catalogs. The photometry is tabulated in Table LABEL:tab:_observationsPhot and displayed in Figure 2.
2.3 Hobby-Eberly Telescope (HET)
We observed EP241021a with the 11 m Hobby-Eberly Telescope (HET; Ramsey et al. 1998; Hill et al. 2021) at McDonald Observatory through program M24-3-005 (PI: Gruen) on 2024-10-25, 2024-10-29, and 2024-11-26 (see Table 2). The observations were scheduled using the HET’s queue scheduling system (Shetrone et al., 2007). We used the low-resolution integral-field spectrograph (LRS2; Chonis et al. 2014, 2016) to obtain spectra in both wavelength channels with LRS2-B (370-700 nm) and LRS2-R (650-1050 nm). LRS2-B data were obtained on 2024-10-25 and LRS2-R on both 2024-10-29 and 2024-11-26 (Table 2). The raw LRS2 data are initially processed with Panacea111https://github.com/grzeimann/Panacea, which carries out bias subtraction, dark subtraction, fiber tracing, fiber wavelength evaluation, fiber extraction, fiber-to-fiber normalization, source detection, source extraction, and flux calibration for each channel. The absolute flux calibration comes from default response curves and measures of the mirror illumination as well as the exposure throughput from guider images. We extracted the flux-calibrated one-dimensional spectrum with the LRS2Multi222https://github.com/grzeimann/LRS2Multi package to integrate over the fibers in a aperture centered on EP241021a. The signal-to-noise (SNR) ratio in these observations is quite low and we are only able to confirm the [OII] emission line at 6519 Å corresponding to , as previously reported as the redshift of underlying emission lines and absorption lines in the transient spectra (Pugliese et al., 2024; Pérez-Fournon et al., 2024; Zheng et al., 2024a). These features provide a secure redshift for EP241021a. We do not identify any supernova-like features in these HET spectra, though, as noted, the SNR of the continuum emission is quite low.
2.4 Very Large Telescope (VLT)
We carried out multi-band observations of EP241021a with the Very Large Telescope (VLT) at Cerro Paranal, Chile using the FORS2 (Appenzeller et al., 1998) and HAWK-I (Kissler-Patig et al., 2008) instruments under program 114.27LW (PI: Troja). Data were obtained on 2024-12-05 and 2024-12-28 in -band (1200 s) with FORS2, and 2024-12-05 and 2024-12-22 in -band (900 s) with HAWK-I. Additional data was obtained on 2025-01-23 in both filters with exposures of 1200 s. The data were reduced using the standard ESO Data Reduction Pipelines and the individual images were combined using SWarp (Bertin, 2010) to create a stacked image. Photometry was performed with SExtractor (Bertin & Arnouts, 1996) and calibrated to the 2MASS (Skrutskie et al., 2006) and PS1 (Chambers et al., 2016) catalogs.
2.5 Neil Gehrels Swift Observatory
The position of EP241021a was observed by the Neil Gehrels Swift Observatory (hereafter Swift; Gehrels et al. 2004) X-ray Telescope (XRT; Burrows et al., 2005a) between 2024-10-24 and 2024-11-15 (ObsIDs: 21725 and 1889) for seven visits totaling 17.5 ks in Photon Counting (PC) mode. We used the Swift/XRT data products generator333https://www.swift.ac.uk/user_objects/ to analyze these data. An X-ray source is detected on 2024-10-29, 2024-11-07, and 2024-11-15 and localized to RA, DEC (J2000) = , with uncertainty of (90% CL). This position is consistent with the optical localization of the transient.
The X-ray source is weak and the spectrum is not well-constrained. A fit to the time-averaged X-ray spectrum with an absorbed powerlaw model yields a photon index of and an unabsorbed energy conversion factor of erg cm-2 cts-1 with the hydrogen column density fixed to the line-of-sight Galactic value ( cm-2, Willingale et al., 2013). The log of X-ray observations is reported in Table 3.
The Swift Ultra-Violet Optical Telescope (UVOT; Roming et al. 2005) observed EP241021a simultaneously to XRT. The source is detected only in a single epoch on 2024-10-29, as previously reported by Klingler et al. (2024). We extracted upper limits at the source position in all other epochs using the uvotsource task within the HEASoft software. The results are presented in Table LABEL:tab:_observationsPhot.
3 Analysis and Results
3.1 Temporal Evolution
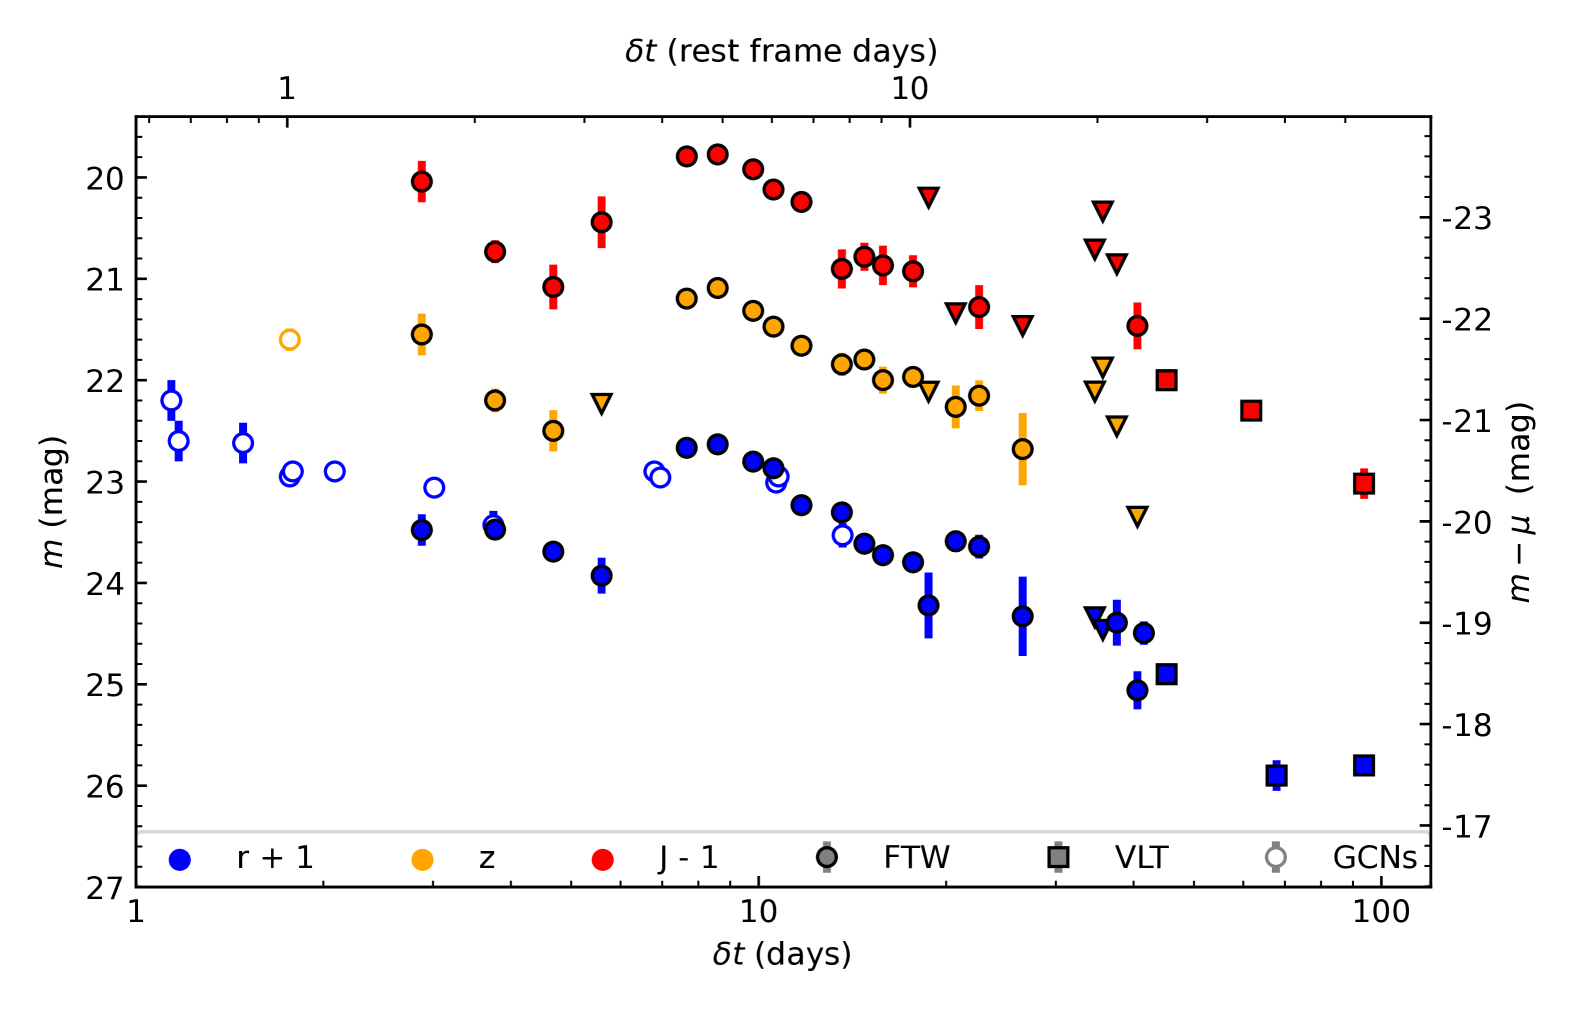
The optical and near-infrared lightcurve of EP241021a displays two clear emission episodes (Figure 2). Around a day after the EP trigger the optical emission was found to be rapidly fading (e.g., Fu et al., 2024b, a; Li et al., 2024c; Ror et al., 2024; Li et al., 2024b), but at 7 d (observer frame; e.g., Quirola-Vasquez et al. 2024; Freeburn et al. 2024a) the transient was observed to have rapidly brightened by mag, peaking by 8 d (observer frame). After the peak, the transient again returned to a steep decay. Our observations with FTW began at 2.9 d (observer frame), see Table LABEL:tab:_observationsPhot. We supplemented our dataset with early time photometry reported in GCN Circulars444https://gcn.nasa.gov/, as shown in Figure 2.
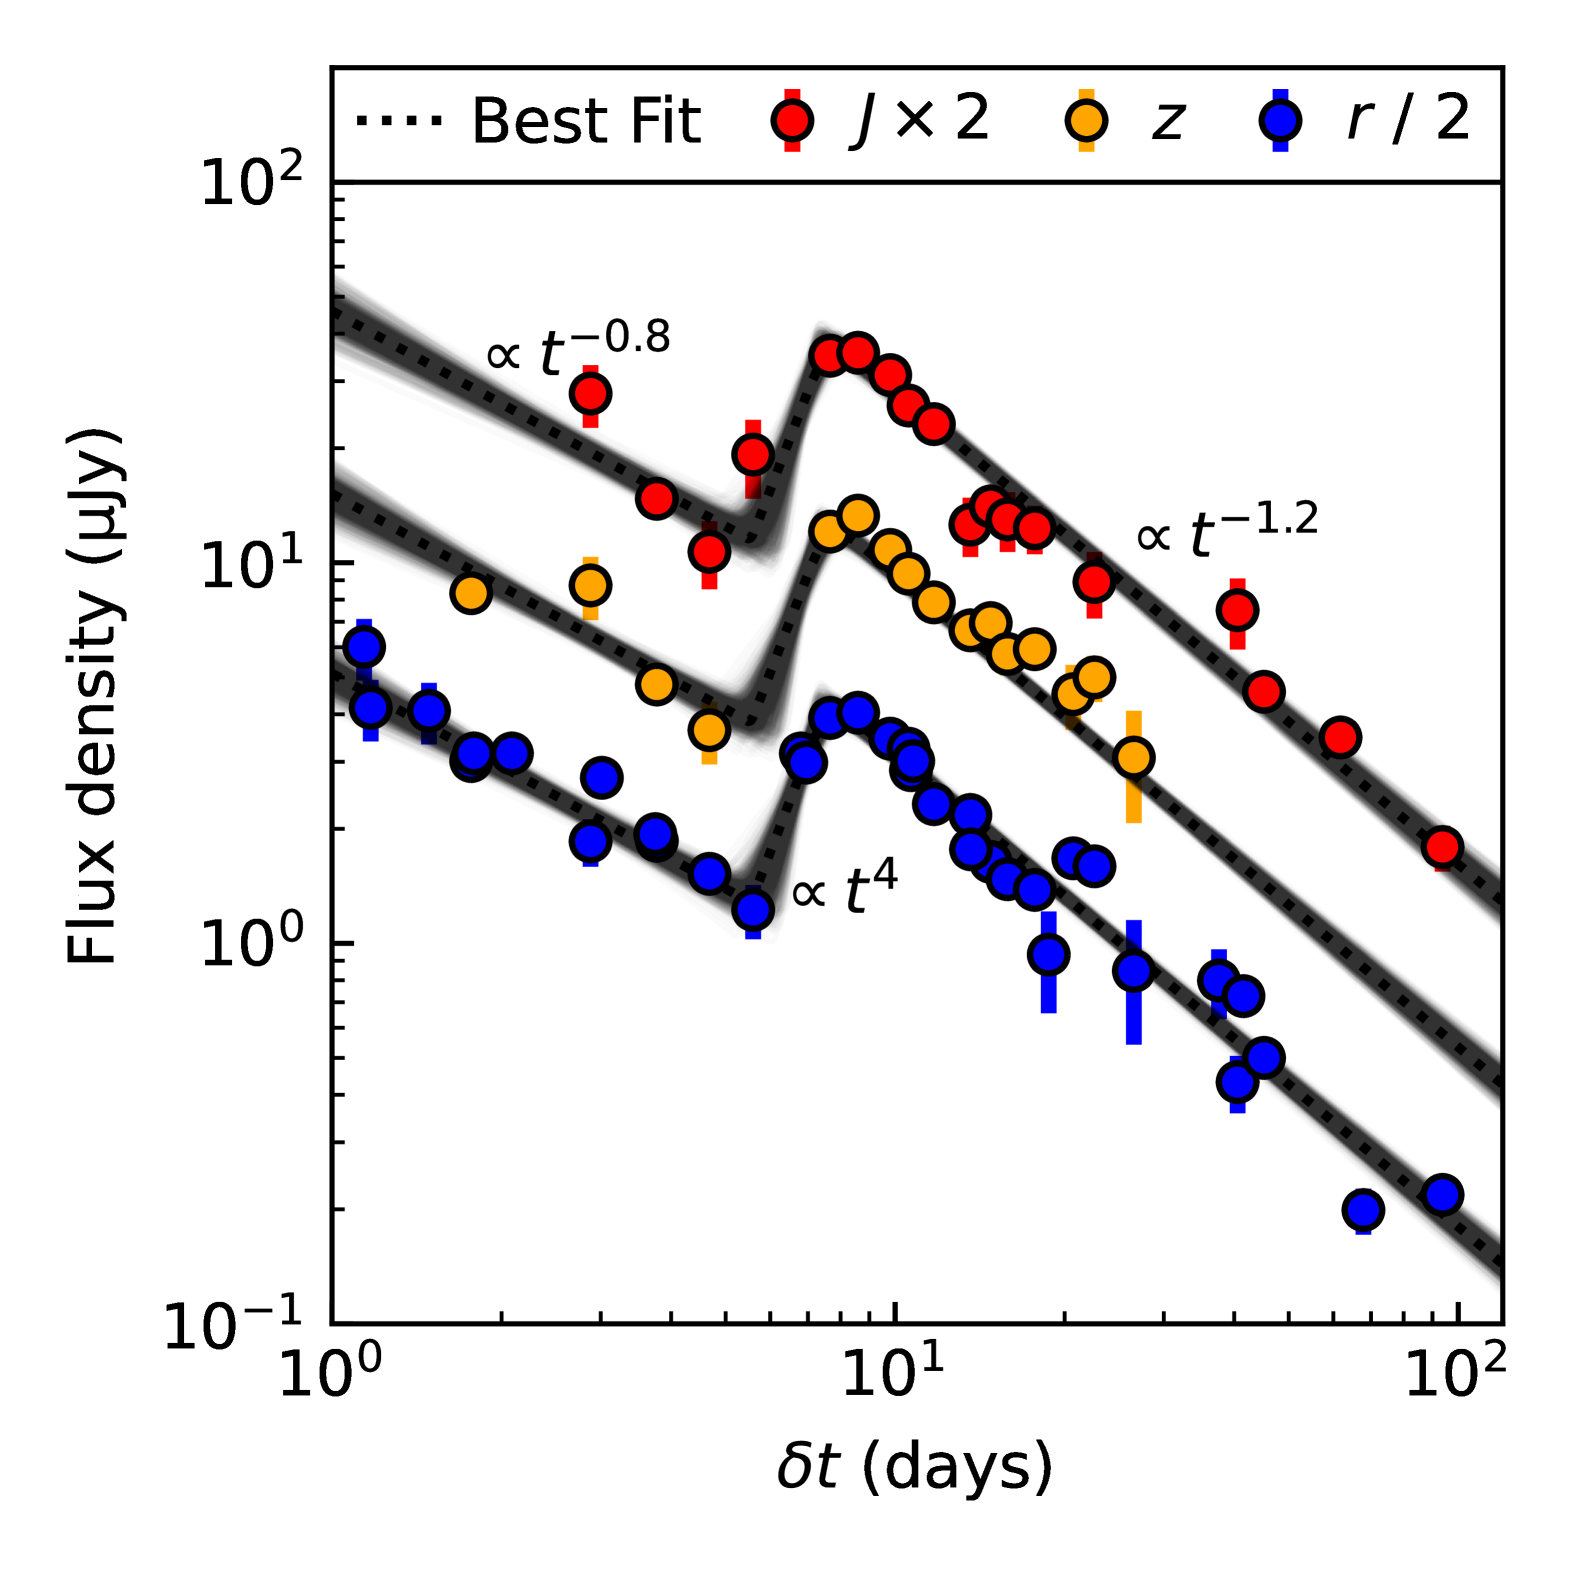
As described above, the lightcurve behavior can be clearly separated into two components (Figure 2), which we refer to as the first and second component, respectively. We roughly separate these by defining the first component as the early fading behavior at d (observer frame), and the second component as all other OIR data obtained between d. To constrain the temporal behavior, we model the OIR lightcurve, including both components, with a double smoothly broken powerlaw with temporal slope . Parameter estimation was performed using the emcee (Foreman-Mackey et al., 2013) and ChainConsumer (Hinton, 2016) packages. The results of our temporal fit to the lighcurves are shown in Figure 3. The initial segment shows a decay of , followed by a steep rise of . The exact rising phase is not well constrained by the data, but the 90% confidence lower limit to the rising slope is found to be . The rise starts at d and then peaks at d followed again by another decline of . For the full corner plot, see Figure 9.
If instead we require that the initial decaying slope and final decaying slope are the fixed to the same value, we find . This provides a similarly good description of the multi-band OIR data. The reduced chi-squared values for both fits are .
The -band photometry obtained with the VLT at 68 and 94 d (§2.4) after the EP trigger appear consistent with a flat evolution. While the measurement obtained at 68 d is a marginal deviation from the model ( ), we also consider the possibility that this represents a significant contribution from the underlying host galaxy flux. We therefore also performed the same temporal fit outlined above after artificially subtracting this flux level from the lightcurve, and excluding the last two points from the fit. This does not change either or , but does lead to a steeper decaying slope of the second segment with .
We note that a longer baseline is required to conclusively determine whether this is indeed the host galaxy contribution. In particular, the -band measurement at 68 d was obtained under poor seeing (full width at half maximum of ), whereas all other data had better image quality with seeing of . Therefore the marginal deviation of the 68 d photometry may be due to the poor conditions.
We likewise model the combined EP/FXT and Swift/XRT X-ray lightcurve with a single powerlaw, which yields a temporal index . While this is not as well constrained, it differs significantly from the decay observed at OIR wavelengths, and, despite the large errors on the X-ray data, may imply they arise from separate emission components, as we explore later on. We cannot, however, completely exclude that the X-ray behavior has the same rebrightening as observed at optical wavelengths, which could appear as a flat lightcurve due to poor temporal coverage and low signal-to-noise.
3.2 Spectral Evolution
EP241021a displays a consistent, red color mag throughout its entire evolution (see Figure 2). There is marginal evidence for deviation from this value, but the large photometric errors at these phases do not allow for any possible evolution to be confirmed. The red color of the transient is similar to EP240414a, which had mag (Srivastav et al., 2024; van Dalen et al., 2024; Sun et al., 2024). These values are also found for the non-thermal afterglow emission from GRBs.
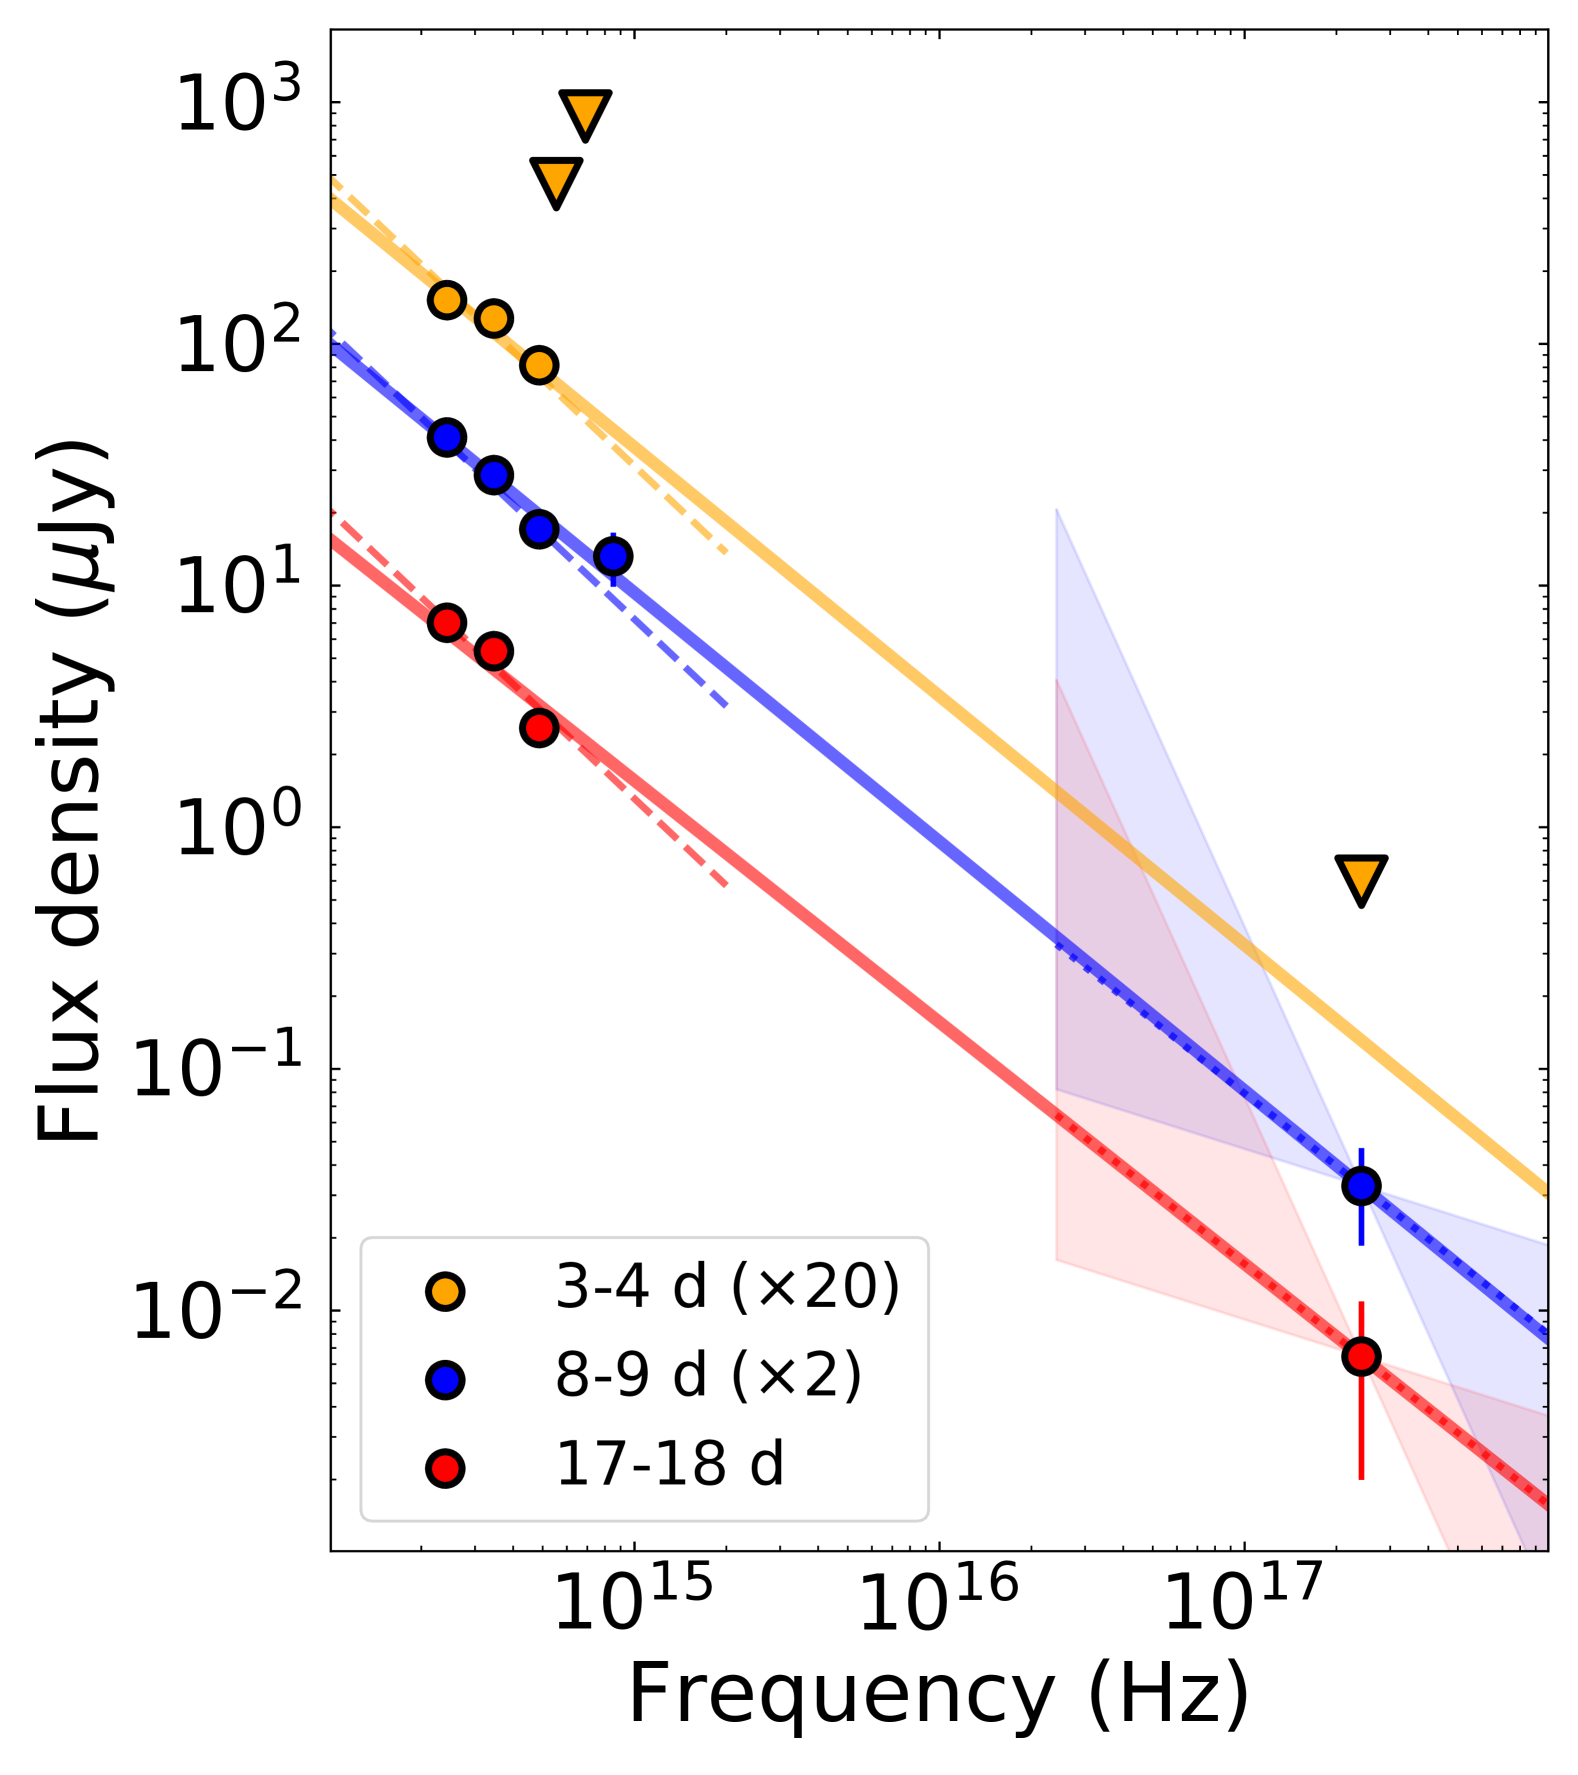
This motivates us to model the near-simultaneous broadband (X-ray to near-infrared) spectral energy distribution (SED) across multiple epochs using an absorbed powerlaw with spectral index . We correct the photometry for Galactic extinction mag (Schlafly & Finkbeiner, 2011) and further shifted the OIR data to the mid-time of the X-ray observations (Table 3) using the best-fit temporal index (§3.1).
In Figure 4, we show the XOIR SEDs at observer frame times of , , , and d (observer frame) after the EP trigger. We find (solid lines in Figure 4) is roughly consistent with the data lying on the same spectral powerlaw segment. This interpretation is complicated by i) the sparse X-ray data with large error bars on the flux measurements and lack of a well-constrained photon index ( ) and ii) the lack of a similar temporal evolution in the X-ray and OIR bands.
Instead, by modeling the optical data alone we find a spectral index of (dashed lines in Figure 4). This provides a consistent description of the optical color throughout the evolution of the second component (peak and post-peak of the lightcurve; Figure 2), whereas our data do not provide strong constraints on the pre-peak spectral index. This spectral index is steeper than shown by the solid lines in Figure 4, but does not significantly underpredict the X-ray data by more than . Therefore the deviation is not well constrained, and while we can conclude the X-ray and optical data are marginally consistent with arising from the same emission component, the sparse data precludes a robust inference.
In either case, the spectral slope very significantly overpredicts the near-simultaneous radio observations (e.g., Yadav et al., in preparation; Schroeder et al., 2024; Ricci et al., 2024a), which either signifies a spectral break, or multiple emission mechanisms. The radio data strongly imply the presence of non-thermal radiation (Yadav et al., in preparation).
4 Discussion
4.1 The multi-wavelength properties of EP241021a
Here we briefly summarize the results of our analysis in terms of the multi-wavelength properties of EP241021a:
- •
- •
- •
-
•
The presence of luminous X-ray and radio emission strengthens the evidence for a significant non-thermal component.
These properties make EP241021a rather unique among both high-energy transients and fast optical transients. The main takeaways from this multi-wavelength behavior is that any scenario to explain EP241021a requires either multiple emission components, potentially due to multiple outflows, or a mechanism to produce a rebrightening phase (e.g., energy injection, long-lived central engine activity, refreshed shock, reverse shock; see §4.7 for further discussion). In the next section, we explore the possible relation to EP240414a, which has shown a roughly similar multi-wavelength behavior.
4.2 A new class of transients: Comparison to EP240414a
Here we summarize the properties of EP240414a, a twin to EP241021a, based on the analyses reported in the literature (Srivastav et al., 2024; van Dalen et al., 2024; Bright et al., 2024; Sun et al., 2024):
- •
- •
-
•
The OIR emission was initially slowly fading before rebrightening to mag after 2 d (rest frame). This fast timescale is consistent with known FBOTs, but the consistently red color ( mag) clearly separates EP240414a from that class of events (e.g., Drout et al., 2014; Perley et al., 2019; Ho et al., 2019; Margutti et al., 2019; Ho et al., 2020; Coppejans et al., 2020; Perley et al., 2021).
-
•
A third component ( mag) appeared after 15 d (rest frame), which was spectroscopically confirmed as a Type Ic-BLe supernova (van Dalen et al., 2024), consistent with the canonical GRB-SN (e.g., Cano et al., 2017) SN 1998bw (e.g., Galama et al., 1998). This secured a massive star as the progenitor, despite the unusually large offset from the center of the host galaxy.
-
•
A luminous radio counterpart peaking after d (rest frame) revealed the presence of a mildly relativistic outflow with bulk Lorentz factor and energy erg (Bright et al., 2024).
This was the first such source discovered with this behavior, and was suggested as either a new class of transients or as providing the missing link between multiple known classes (e.g., van Dalen et al., 2024). The most promising interpretation is afterglow emission following a low luminosity GRB (Srivastav et al., 2024; Sun et al., 2024), although there is disagreement as to whether the XOIR SEDs are consistent with an afterglow origin (Srivastav et al., 2024; van Dalen et al., 2024). Srivastav et al. (2024) favored a refreshed shock origin for the second component, whereas van Dalen et al. (2024) argues that the SED was inconsistent with the X-ray and optical emission arising from the same process. Instead, van Dalen et al. (2024) favored a mildly relativistic outflow to create the X-ray and radio emission (see Bright et al., 2024), and the combination of a cocoon to produce the first component and the interaction between supernova ejecta and the circumstellar material (CSM) to produce the second component.
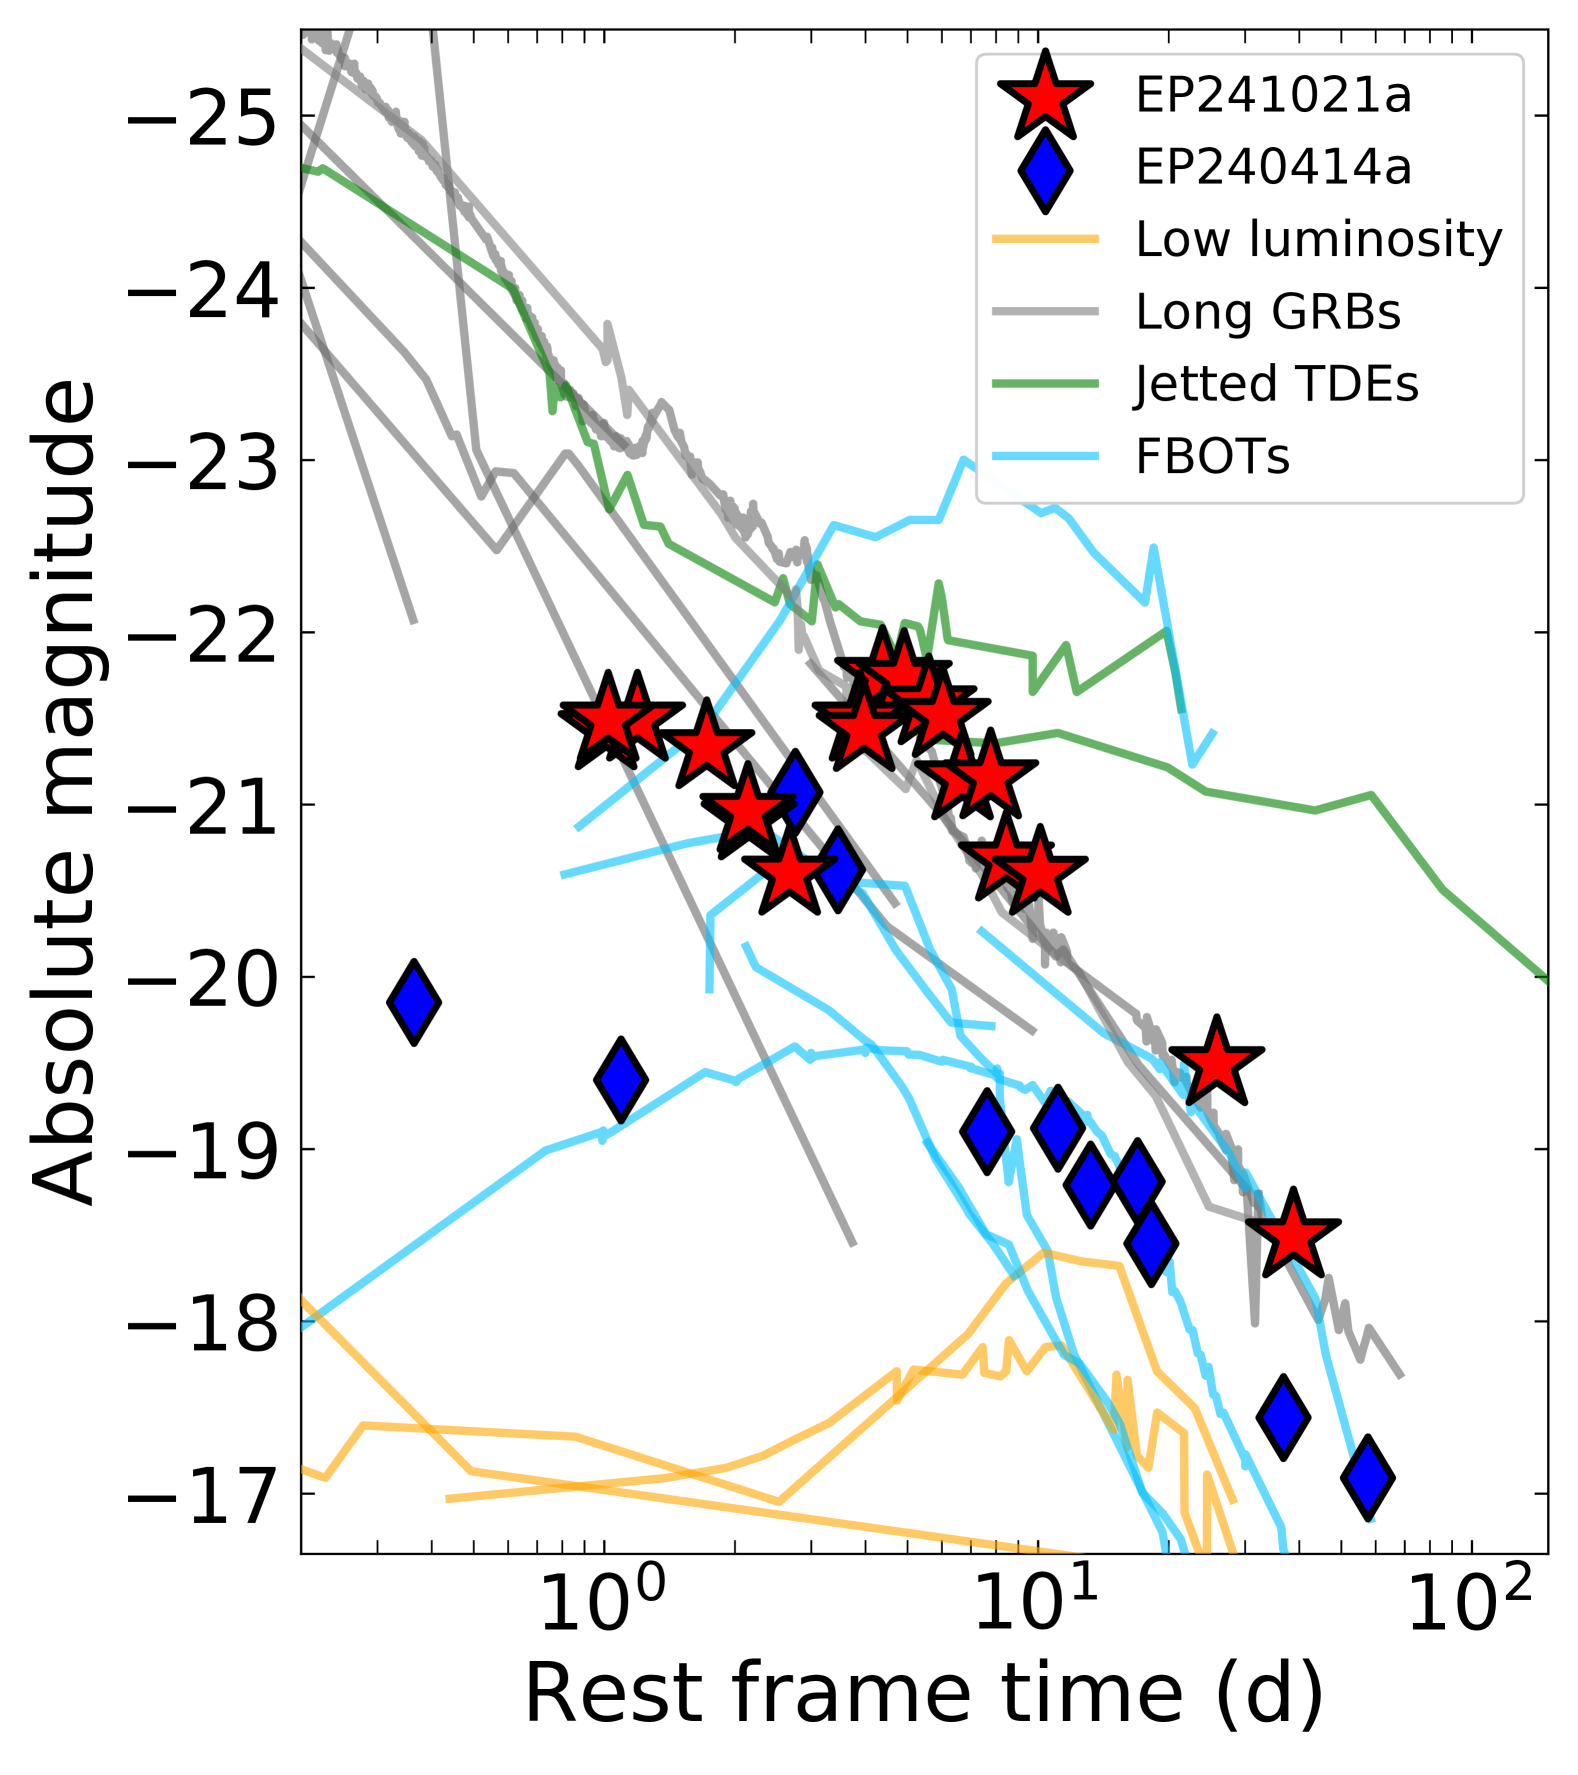
While the lack of gamma-ray emission, multiple optical emission components, long-lived and rather flat X-ray lightcurve, and luminous, late-peaking radio emission are all shared between EP240414a and EP241021a, the two events display some clear differences. For starters, the peak of the second component is significantly more luminous in EP241021a ( mag for EP240414a versus mag for EP241021a), see Figure 5. In fact, due to its red color, EP241021a is even more extreme at near-infrared wavelengths ( mag). Furthermore, while EP240414a showed a clear third component which was spectroscopically confirmed as a SN (van Dalen et al., 2024), typical of those seen in GRBs (Iwamoto et al., 1998; Galama et al., 1998), instead EP241021a is significantly more luminous by nearly 2 magnitudes (Figure 5).
In addition to the differing absolute magnitudes, the timescales of the optical lightcurve’s multiple components are significantly longer for EP241021a (Figure 5). These differences could be explained by outflows of different energies and Lorentz factors, especially in a refreshed shock model (see §4.7). Future discoveries of potentially similar events will aid in understanding the continuum of transient behavior linking these events, and potentially linking other classes of known transients. As we consider it likely these two events are of similar nature, and EP240414a is conclusively associated to the death of a massive star, albeit in a strange environment (e.g., van Dalen et al., 2024), we only consider a massive star progenitor scenario for EP241021a and do not explore other possible explanations (e.g., a tidal disruption event by an intermediate mass black hole).
4.3 Comparison to Other Fast Optical Transients
There is a diverse zoo of fast optical transients discovered by wide-field surveys in the last two decades. The classification of these transients is largely phenomenologically defined, without clear boundaries. These objects come from a variety of classes, but are regularly found to belong to either FBOTs (e.g., Drout et al., 2014; Vinkó et al., 2015; Pursiainen et al., 2018), “orphan” GRB afterglows (e.g., Cenko et al., 2013; Law et al., 2018; Ho et al., 2023b, 2022; Lipunov et al., 2022; Mooley et al., 2022), or stripped-envelope supernovae (e.g., Yao et al., 2020; Clark et al., 2020; Das et al., 2024; Moore et al., 2024).
The distinction between FBOTs and other fast optical transients lies in their initially blue colors ( mag), initially featureless optical spectra, and luminous non-thermal X-ray and radio emission. Many FBOTs are found to display thermal optical emission (e.g., Perley et al., 2019), with some also having clearly non-thermal, self-absorbed radio emission out to more than a hundred days (e.g., Ho et al., 2020; Margutti et al., 2019). In Figure 5 we compare a zoo of optical transients to EP240414a and EP241021a. While FBOTs typically display optical emission with both fast rise ( d) and decay timescales ( d) that are consistent with EP240414a and EP241021a, the direct connection to FBOTs is unclear due to their different optical colors (red versus blue). As we do not find a direct analog to any previously known optical transients, we therefore explore other possible origins below.
4.4 Comparison to Dirty Fireballs and Orphan GRBs
Recent years have seen a variety of non-gamma-ray triggered GRB afterglow discoveries (e.g., Lipunov et al., 2022; Ho et al., 2022; Perley et al., 2024; Li et al., 2024a; Srinivasaragavan et al., 2025), largely through wide-field optical surveys such as the Zwicky Transient Facility (ZTF), though other attempts have been made (Freeburn et al., 2024b). These “orphan” afterglows (Nakar et al., 2002; Huang et al., 2002; Dalal et al., 2002; Totani & Panaitescu, 2002; Levinson et al., 2002; Rhoads, 2003) are generally observed as fast fading red transients and found at cosmological distances around (e.g., Ho et al., 2022). A general issue, due largely to the lack of direct knowledge of the onset time of the initial GRB or afterglow, is whether these events truly lack gamma-ray emission, whether it was simply missed by gamma-ray monitors, or whether the gamma-ray emission is simply underluminous or having a low peak energy . They are often suggested to be mildly relativistic outflows (e.g., Perley et al., 2024; Li et al., 2024a; Srinivasaragavan et al., 2025), candidate dirty fireballs (Rhoads, 2003), though slightly off-axis viewing angles cannot be ruled out as an alternative explanation (e.g., Li et al., 2024a).
The clearly non-thermal emission at X-ray, OIR, and radio wavelengths produced by EP241021a is suggestive of the afterglow of a relativistic jet (e.g., Granot & Sari, 2002). Therefore, drawing a connection to these “orphan” GRBs that are also lacking gamma-rays is natural. As these events were detected prior to the launch of EP, it is difficult to rule out that they also produced soft energy X-ray emission. A GRB can lack gamma-ray emission for a few reasons, most naturally being a viewing angle outside of the jet’s core half-opening angle or a low Lorentz factor (see, e.g., O’Connor et al., 2024, for a discussion). It is thought that non-gamma-ray triggered events may trace a continuum of outflow Lorentz factors, potentially caused by a continuum of failed stellar explosions (i.e., where the jet breaks out of the progenitor star with varying success). Future observations of these events, especially coincident with EP triggers, is critical to understand this possible continuum. In what follows we consider possible GRB afterglow origins for EP241021a.
4.5 The Prompt Emission
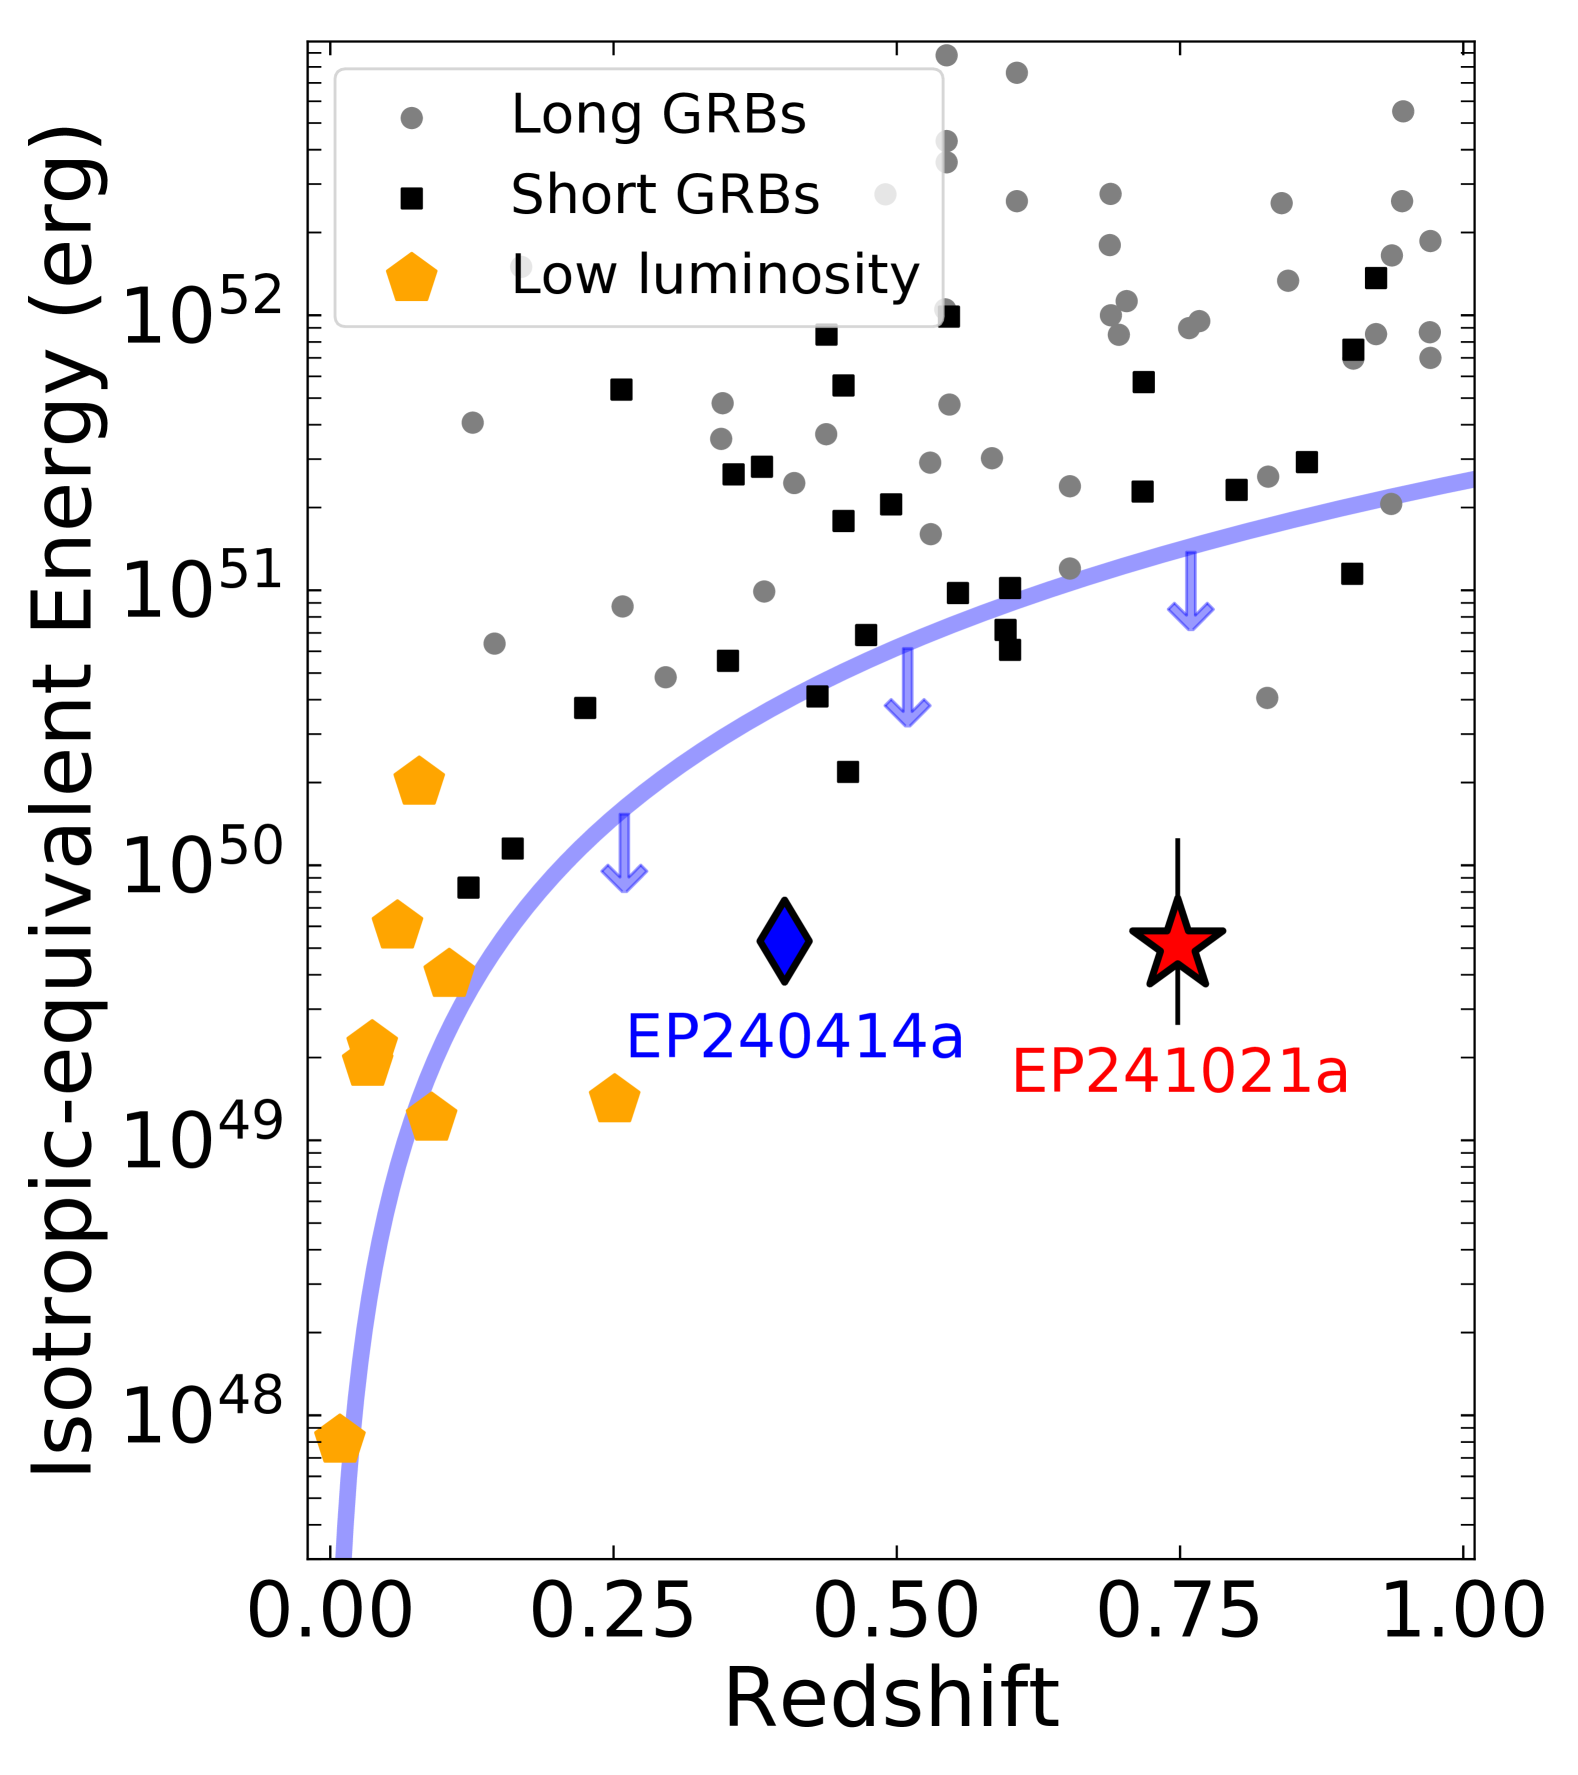
The high energy detection of EP241021a and the non-thermal SED are reminiscent of cosmological gamma-ray bursts, which are the most commonly observed class of high-energy transients. As such, we compare the high energy properties of EP241021a to typical gamma-ray bursts. In Figure 6 (left panel), we show the approximate isotropic-equivalent keV energy released by EP241021a during the initial EP trigger (§2.1; Hu et al. 2024) versus different classes of gamma-ray bursts. The non-detection of EP241021a by Konus-Wind (§2.1) is easily explained if the peak energy is low, as was the case for EP240414a (Sun et al., 2024). In comparing the reported photon indices based on power-law spectral fits to the EP triggers (Hu et al., 2024; Sun et al., 2024), the spectrum of EP241021a ( at 90% CL; consistent with a non-thermal spectrum) appears substantially harder than EP240414a ( at CL; Sun et al. 2024) which had an extremely low peak energy keV (Sun et al., 2024), an outlier for a gamma-ray burst. Instead, EP241021a does not require such a low peak energy to be consistent with the non-detection of prompt gamma-ray emission (see also O’Connor et al., 2025). Using the energy constraints from Konus-Wind (Figure 6), we determine that for a typical long GRB spectrum ( and ) extrapolating the prompt EP trigger ( keV) with a standard bolometric correction requires keV to not overproduce the Konus-Wind limits ( keV) for the same spectral shape. This is a reasonable limit to the peak energy and consistent with the values observed for many long GRBs and their location on the Amati relation which conservatively suggests keV (e.g., Amati, 2006).
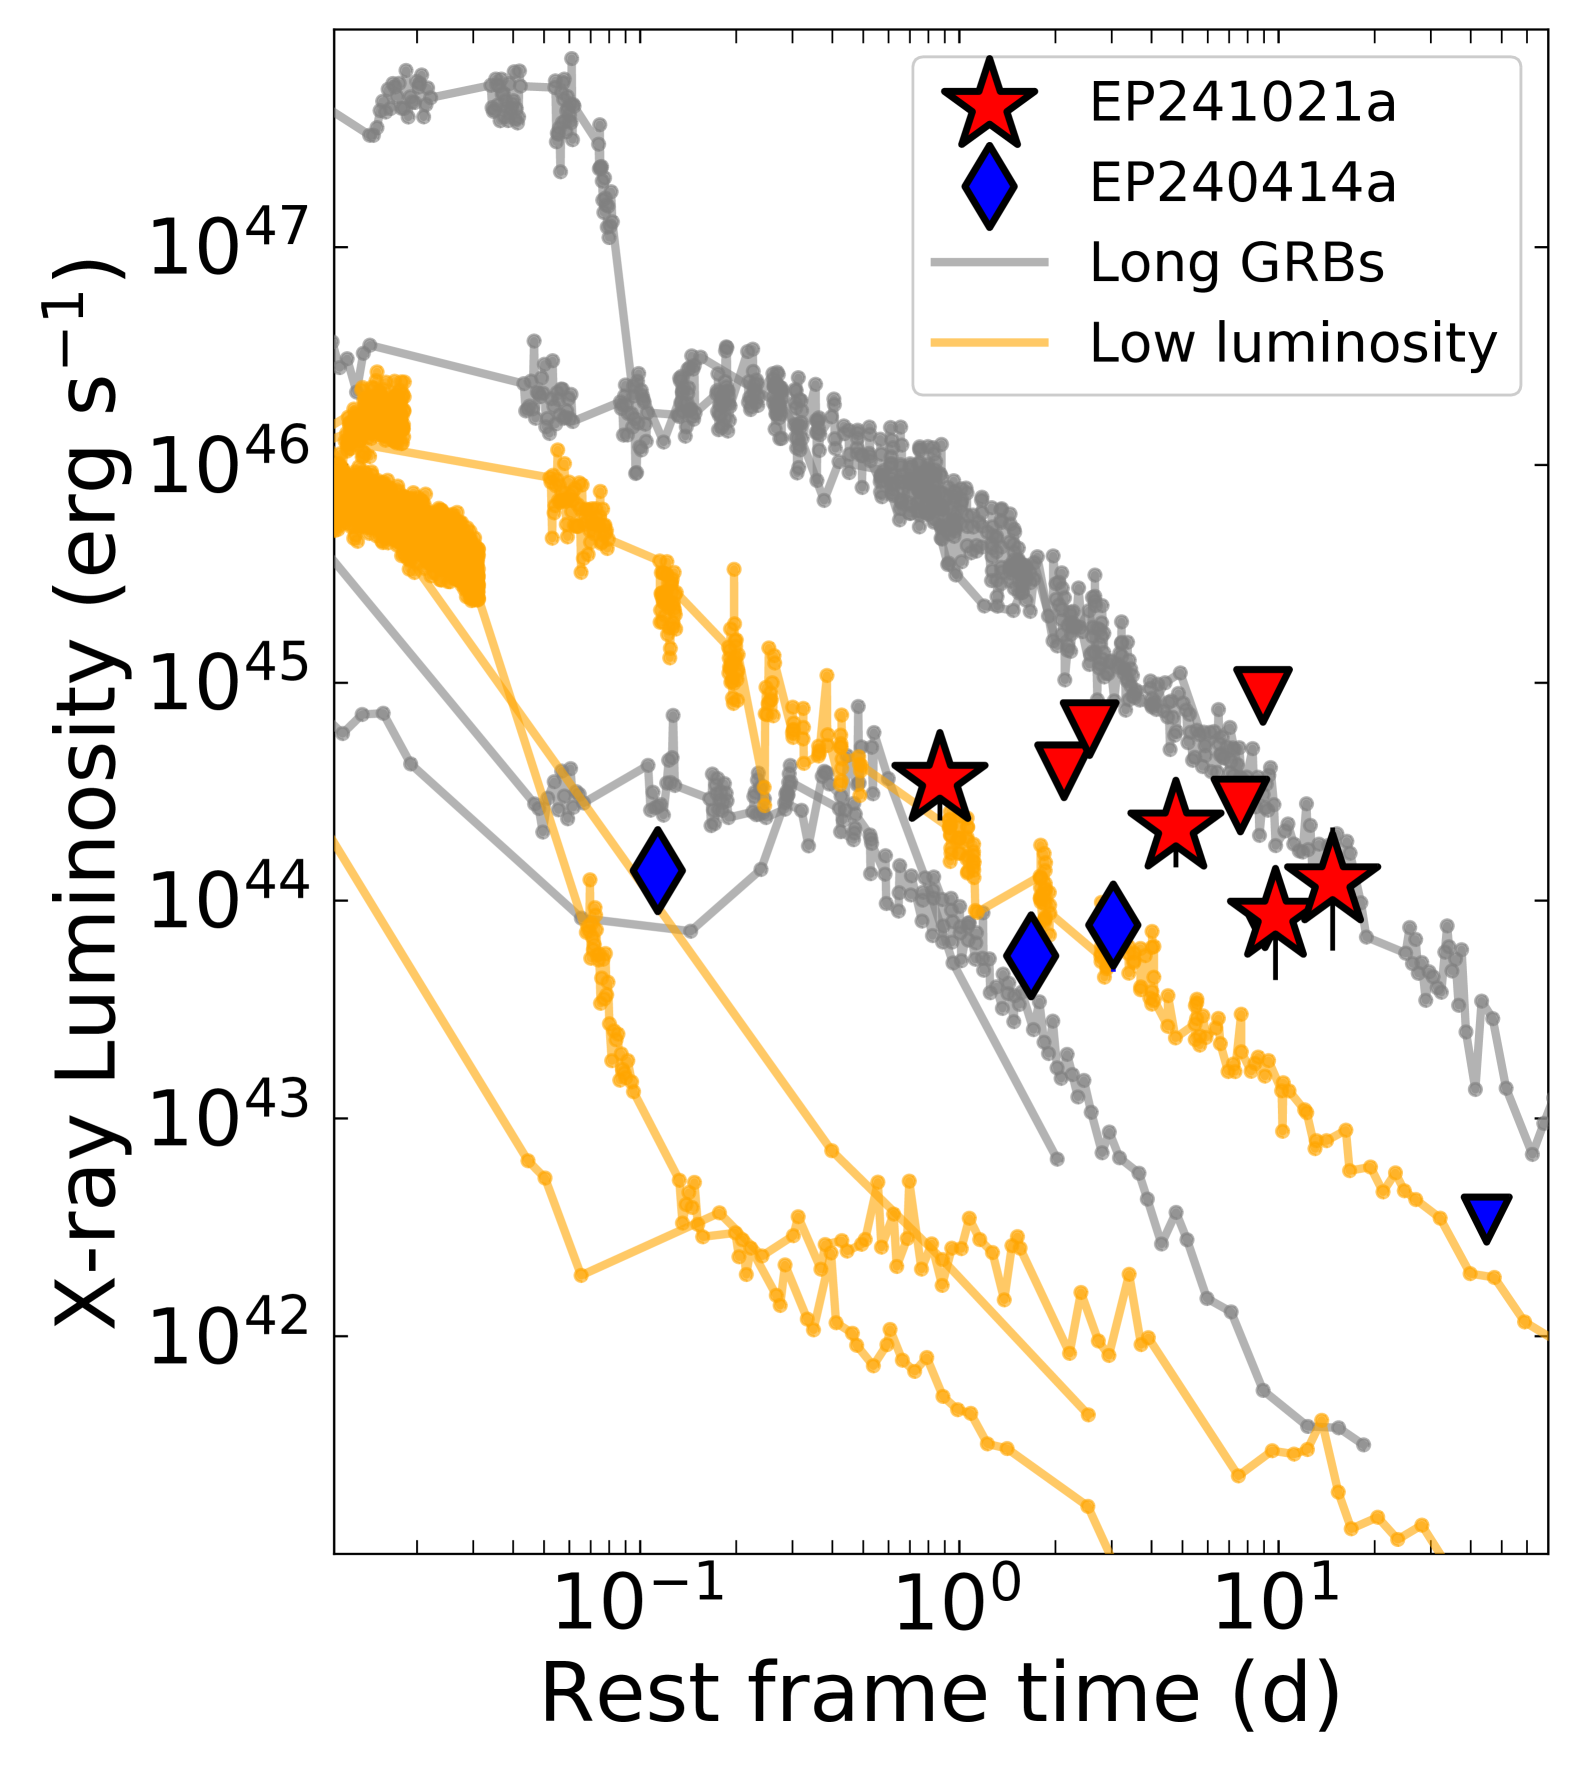
In any case, the general energetics of these two events clearly lie within those of the class of low luminosity GRBs (e.g., Iwamoto et al., 1998; Galama et al., 1998, 1999; Malesani et al., 2004; Sakamoto et al., 2004; Soderberg et al., 2004a, b, 2006; Ofek et al., 2007; Starling et al., 2011; Cano et al., 2011; D’Elia et al., 2018; Izzo et al., 2019; H. E. S. S. Collaboration et al., 2021; Dichiara et al., 2022; Irwin & Hotokezaka, 2024c), which could be easily missed by Konus-Wind depending on the uncertain spectral shape of the prompt emission. On the other hand, the X-ray emission has more luminous long-lived plateaus than observed in other low luminosity GRBs (Figure 6; right panel), e.g., GRB 171205A (D’Elia et al., 2018). Moreover, the optical lightcurve (Figure 5) is significantly different from the typically supernova dominated lightcurves of low luminosity GRBs (e.g., Soderberg et al., 2006; Starling et al., 2011; Cano et al., 2011; D’Elia et al., 2018; Izzo et al., 2019).
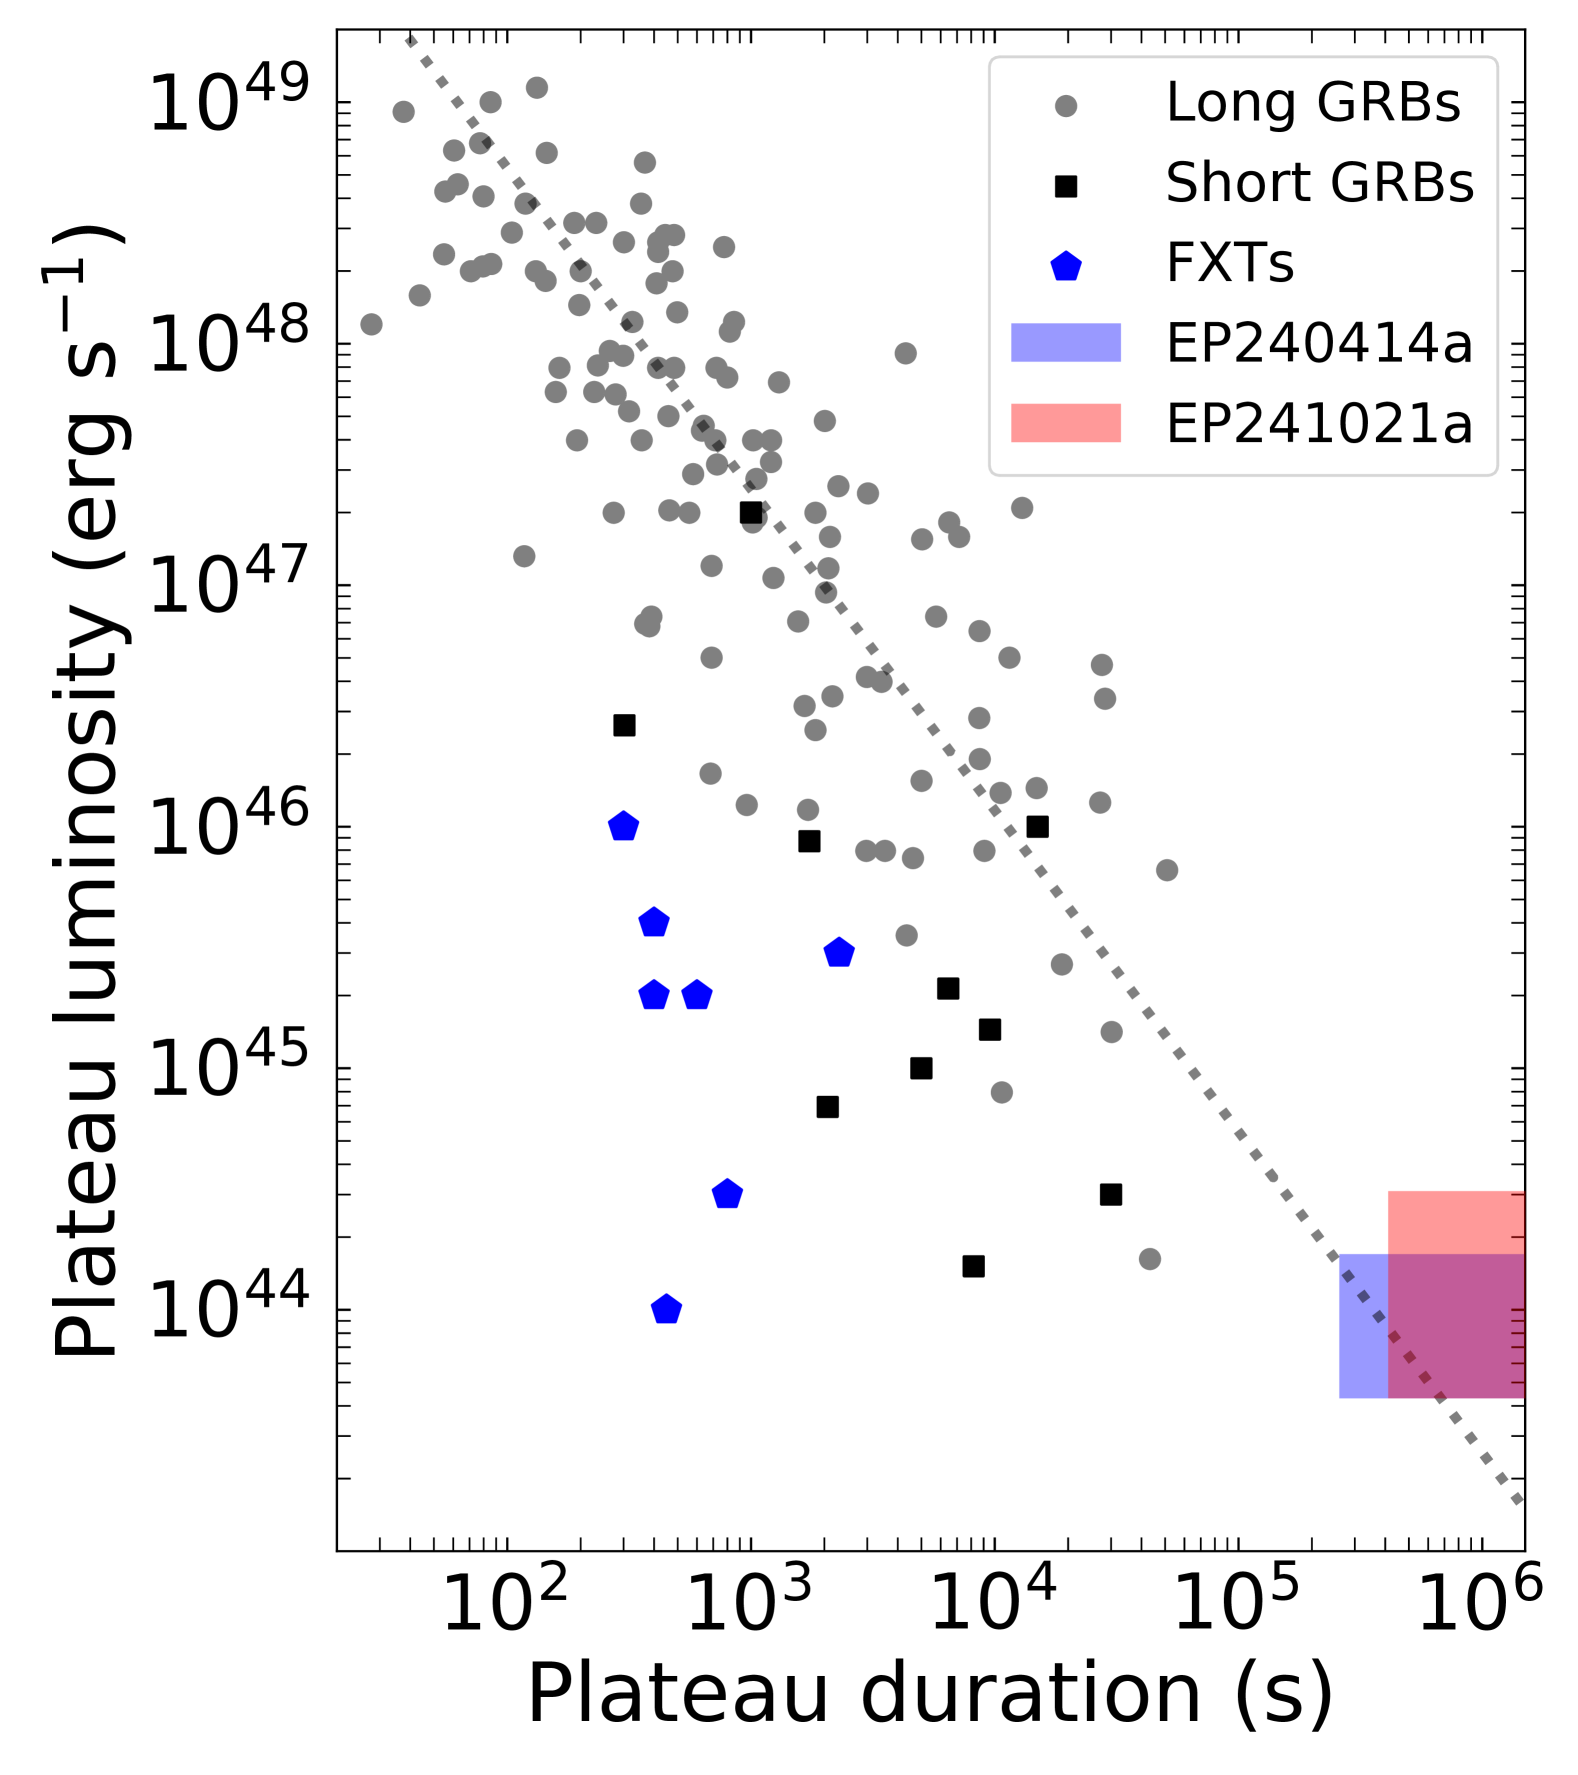
We note that the observed X-ray plateaus from EP240414a and EP241021a do appear to be consistent with an extension of the typical rest-frame GRB X-ray plateau correlations between luminosity and duration (Figure 7; e.g., Dainotti et al. 2008; Tang et al. 2019; Xu et al. 2021), which supports the interpretation of EP240414a and EP241021a in the context of GRBs. Due to their sparsely sampled X-ray lightcurves, when compared to typical GRBs (Figure 6; right panel), we display the allowed range of X-ray plateau luminosity and duration as shaded regions. The exact end time of the plateau is not well constrained for either source. These shaded regions (Figure 7) appear consistent with extrapolating the observed behavior of GRBs to lower luminosities and longer durations. If confirmed, these would be the longest plateaus detected from a GRB-like outflow.
Both the energetics and X-ray emission are significantly higher than found for the FXTs discovered prior to the launch of EP (e.g., Alp & Larsson, 2020; Quirola-Vásquez et al., 2022, 2023) suggesting a separation between the two classes, or, potentially, a continuum. The lack of clear multi-wavelength detections of pre-EP FXTs complicates this connection. Further observations of EP transients are required before drawing strong conclusions regarding any potential connection to classical pre-EP FXTs.
4.6 Constraints on the Initial Lorentz Factor
4.6.1 Lorentz Factor Limits from the Prompt Emission
The prompt emission spectrum observed by EP appears consistent with non-thermal emission ( at 90% CL; Hu et al. 2024), though there is significant uncertainty on the true photon index. Producing a non-thermal, likely synchrotron, spectrum requires that the energy is dissipated at a radius that is at least as large as the photosphere of the outflow (e.g., Goodman, 1986; Thompson, 1994). Thus, we require that the emission occurs at a low optical depth . Based on the EP trigger, a minimum energy release is erg ( keV) over the s trigger (Hu et al., 2024), which is potentially much higher in larger energy bands. In addition, the true isotropic kinetic energy of the outflow is also likely much larger when accounting for radiation efficiency, and likely exceeds erg. If the source is non-relativistic then and the radius as a function of time for a given outflow velocity is given by . The optical depth of the outflow to Thomson scattering is then where is the opacity. As the optical depth decreases rapidly with an increase in velocity, we conservatively assume a non-relativistic outflow ( , such that and relativistic effects can be ignored), which produces an extremely high optical depth of order hundreds. This would produce a thermal spectrum in sharp contrast to the observed prompt X-ray spectrum.
The optical depth can be decreased by assuming a higher velocity outflow. Expanding this calculation to the transrelativistic case, the optical depth is given by
| (1) |
where we have applied the convention that is the isotropic-equivalent energy and is the prompt emission duration. By requiring , we find an initial bulk Lorentz factor of . If instead the isotropic-equivalent energy were higher, we would likewise require a larger Lorentz factor. While we cannot rule out efficient dissipation in the mildly optically thick regime with at of a few, these calculations provide support for at least a mildly relativistic outflow to produce the prompt X-ray trigger of EP241021a.
4.6.2 Lorentz Factor Limits from Jet Deceleration
If we assume the multi-wavelength emission from EP241021a is related to the interaction of a relativistic jet with its surrounding environment we can constrain the initial bulk Lorentz factor of the outflow. For an on-axis observer, the afterglow emission will be observed to be declining after the jet has decelerated (see, e.g., O’Connor et al., 2020, 2024, for a discussion of the impact of the viewing angle). Therefore, based on the declining optical lightcurve starting at 1.14 d ( d in the rest frame; Zheng et al., 2024b), we can set a lower limit to the initial bulk Lorentz factor of material at the jet’s core. A relativistic jet propagating into an external environment , where represents a uniform density environment and for a stellar wind environment, begins to decelerate after a dynamical timescale given by (Sari & Piran, 1999; Molinari et al., 2007; Ghisellini et al., 2010; Ghirlanda et al., 2012; Nava et al., 2013; Nappo et al., 2014; Ghirlanda et al., 2018)
| (2) |
where is the initial bulk Lorentz factor at the jet’s core, is the kinetic energy, , is the density, is the proton mass, and is the speed of light. Equation 2 simplifies to
| (5) |
where , /10, and with cm such that . The constraint on the Lorentz factor is degenerate with the kinetic energy of the blastwave and the density of the surrounding environment, but roughly we can assume lower limits to the Lorentz factor in the range to be reasonable. It is important to note that there are no robust constraints on the exact start time of the jet’s deceleration, and as such it is rather unconstrained and an extremely early deceleration, typical of cosmological GRBs, cannot be excluded.
4.7 Possible origins of EP241021a
4.7.1 A Rare Supernova
Motivated by the similarities of the second bump to the timescale of FBOTs and the peak absolute magnitudes of superluminous supernovae (SLSN), we consider a range of supernova-like models that have been applied to both classes of events. We note that none of these models naturally explains the fast multi-peaked lightcurve of EP241021a (Figure 2) without an added component. As such, we consider only the data corresponding to the rebrightening phase.
We used the Modular Open Source Fitter for Transients (MOSFiT; Nicholl et al., 2017; Guillochon et al., 2018) to fit the OIR lightcurve shown in Figure 2. Motivated by possible explanations for the most luminous supernovae, we consider models that include the decay of 56Ni, the spin-down of a magnetar, and CSM interactions. We compare the fitted lightcurves, and analyze potential explanations for the morphology of the second component in the light curve ( d; observer frame). We applied five different MOSFiT models: i) default (Nadyozhin, 1994), ii) csm (Chatzopoulos et al., 2013; Villar et al., 2017), iii) csmni, iv) magnetar (Nicholl et al., 2017), and v) magni. The csmni and magni models combine their respective basic engines and the default model. The default model is based on the radioactive decay of 56Ni being the main source of the lightcurve morphology.
To fit the second component starting from , we fix the explosion time to the EP trigger, such that prior to the onset of the rebrightening. The -ray opacity () was fixed to cm2 g-1 (Cappellaro et al., 1997). We perform the fit using the dynamic nested sampling approach implemented in MOSFiT using the dynesty package (Speagle, 2020; Koposov et al., 2024). For the magnetar model, we set similar priors as Gomez et al. (2022) to model superluminous supernovae, but decreased the range of the magnetar spin period to . Instead of log-flat priors for , , and we chose a flat prior. For csm and csmni, we apply similar priors as in Nicholl et al. (2020); Suzuki et al. (2021); Chen et al. (2023). For a more detailed overview of the priors for each model see 4. Relevant posteriors are listed in 5.
Within a general supernova framework where the decay of 56Ni serves as the primary energy source, the Arnett (1982) model primarily fits two parameters: the ejecta mass of 56Ni and the characteristic diffusion timescale . Here, governs the width of the light curve, and is determined as
| (6) |
with , , , and being the optical opacity, the speed of light, and the bulk velocity of the ejected material, and a constant (Arnett, 1982), respectively. In order to match the observed lightcurve, we need to achieve an extreme luminosity ( mag), while still maintaining a fast evolution of the OIR lightcurve’s rising and declining phases. According to Equation 6, a low ejected bulk mass and/or a high velocity of the ejected material would contribute to a rapid evolution in the light curve. However, it can be challenging to obtain rapidly evolving, luminous transients when including the contribution of 56Ni decay.
In Figure 8, we display the best fit to this second component of the lightcurve for each of the five MOSFiT models. While we have performed these fits to the multi-band lightcurve, we display the fit results only for the best sampled band – the -band – for readability purposes and to avoid a cluttered figure. Each color in Figure 8 represents a single model applied to the data compared to the -band lightcurve. We find that none of these models are capable of reproducing the observed shape (even for extreme parameters), and, furthermore, none of them would capture the initial decaying phase at d. The closest match comes from the csmni model, but this predicts a much slower decay, and, importantly, this model significantly overpredicts the late time -band photometry.
These MOSFiT models are based on cooling thermal emission, and are based on the assumption that the OIR spectral energy distribution is well matched to the shape of a blackbody. In Figure 8 we have only shown the model fits to the -band, despite having modeled the multi-band lightcurves. Due to the underlying assumption of a cooling blackbody, the model fits (default, magnetar, and magni) to the other bands are quite poor and do not provide a good match to the lightcurves. On the other hand, the csmni and csm models can provide a rough match to the post-peak behavior in all bands (similar to that shown in Figure 8 for the -band). However, in order to match the observed non-thermal spectral shape of EP241021a ( ; Figure 4), the csmni and csm in MOSFiT require large amounts of dust ( mag) that push the transient to extreme absolute magnitudes ( to mag) that are not observed from supernovae. For example, the most luminous SLSNe peak at (e.g., DES16C2nm, SCP06F6; Gomez et al., 2024), and these are already significant outliers from the rest of the population (e.g., Gomez et al., 2024).
In addition to not performing well to fit the light curves (and still requiring an additional component at early times), multiple other arguments provide evidence against a SLSN interpretation, including the fast timescale, red color (whereas SLSNe are initially blue ; Gomez et al. 2024), non-thermal SED, and lack of clear SN features in the optical spectra (§2.3; Pugliese et al., 2024; Pérez-Fournon et al., 2024; Zheng et al., 2024a). Moreover, the luminous non-thermal radio emission observed from EP241021a ( erg cm-2 s-1 Hz-1; Yadav et al., in preparation) is in sharp contrast to observations of SLSNe which show no radio emission to depths between orders of magnitude lower (e.g., Coppejans et al., 2018; Eftekhari et al., 2019).
4.7.2 An Off-axis Structured Jet
The clearly double peaked optical and near-infrared lightcurve (Figure 2) is not observed in standard GRB afterglows. However, Beniamini et al. (2020, 2022) showed that double-peaked afterglow lightcurves can be produced by a combination of line-of-sight material (producing the first peak) and the jet’s core emission (producing the second peak). The major factor dictating whether an observer views a single or double peaked lightcurve is the lowest latitude of the jet , from which material is initially beamed towards the observer ( ; see discussions in Beniamini et al. 2020, 2022 and Figure 8 of Beniamini et al. 2022). If then the the observer is continuously receiving emission from decreasing angles until finally observing the core, producing a single peaked lightcurve. The alternative case, where produces a double peaked lightcurve as initially the observer is viewing material far away from the core that will decelerate before the observer is able to receive emission from the core (due to relativistic beaming), producing a first peak at approximately (see, e.g., O’Connor et al., 2024). The secondary peak occurs once the core is de-beamed to the observer, and is the more standard peak for off-axis GRBs in the literature (e.g., GW170817; Mooley et al. 2018; Ghirlanda et al. 2019; Ryan et al. 2023). The relative significance of the second peak is dictated by the slope of the structured jet with . Steeper jets and a uniform density environment serve to substantially pronounce the second peak (see Figure 11 of Beniamini et al. 2022). While this may be able to match the timescale and flux ratio of the double peaked lightcurve, the observed rise to the second peak is too steep to naturally fit with this interpretation. We therefore disfavor a forward shock from an off-axis structured jet as the cause of EP241021a’s rebrightening.
However, an alternative possibility is that the rebrightening is due to a reverse shock from off-axis material in a shallow structured jet (e.g., O’Connor et al., 2023; Gill & Granot, 2023; Zhang et al., 2024). This does not necessarily require an off-axis viewing angle for the observer. Material at an off-axis angle would be moving with lower Lorentz factors and also be delayed with regard to photons reaching the observer (due to relativistic beaming). This may provide a natural explanation for the observed delayed brightness increase in EP240414a and EP2141021a. Recently Abdikamalov & Beniamini (2025) performed a comprehensive investigation of the possible lightcurve behaviors of reverse and forward shock emission for steep off-axis jets. They found a variety of possible double-peaked lightcurve profiles, due to de-beamed emission from the reverse shock. Future work will extend these considerations to shallow structured jets, and may reveal the capability to reproduce the observed behavior of EP241021a due to emission from a reverse shock from an off-axis angle.
4.7.3 A Refreshed Shock
Over the past two decades observations of GRBs have revealed a variety of peculiar, unexpected late-time behaviors. These include long-lived X-ray (e.g., Zhang et al., 2006; Troja et al., 2007) and optical (Panaitescu & Vestrand, 2011; Knust et al., 2017) plateaus, late-time X-ray (Burrows et al., 2005b; Curran et al., 2008; Margutti et al., 2011; Bernardini et al., 2011) and optical (Swenson et al., 2013; Kumar et al., 2022) flares, and rapid episodes of rebrightening (e.g., Covino et al., 2008; Melandri et al., 2014; Dichiara et al., 2022; Moss et al., 2023). In many cases these phenomena have been attributed to long-lived central engine activity (Burrows et al., 2005b; Zhang et al., 2006; Curran et al., 2008; Margutti et al., 2011), but other explanations are plausible (Panaitescu, 2008; Beniamini & Kumar, 2016; Beniamini & Mochkovitch, 2017; Lamberts & Daigne, 2018; Ayache et al., 2020; Duque et al., 2022).
Late-time rebrightening is often attributed to refreshed shocks (Rees & Mészáros, 1998; Sari & Mészáros, 2000; Kumar & Panaitescu, 2000; Jóhannesson et al., 2006), such as observed in the afterglows of GRBs 030329 (Granot et al., 2003; Moss et al., 2023), 071010A (Covino et al., 2008), GRB 120326A (Melandri et al., 2014), and GRB 160821B (Lamb et al., 2019), among others, though in some cases a reverse shock is also possible (e.g., Dichiara et al., 2022). We note that extreme rebrightening episodes have also been observed in X-ray flashes (XRFs) such as XRF 050416a (Soderberg et al., 2007) at d (rest frame), which may also have been due to a refreshed shock. In the standard refreshed shock model (Sari & Mészáros, 2000; Kumar & Panaitescu, 2000), promptly launched and rapid ( ) material decelerates as it sweeps up circumburst material in an external shock at the front of the outflow, eventually becoming slow enough for an initially less relativistic shell ( ) to catch up and merge into a single blastwave, producing the increase in brightness, which is related to the energy added to the shock.
However, the rebrightening observed in EP241021a is at significantly later times ( s; observer frame), and is difficult to obviously connect to the behavior observed in on-axis cosmological GRBs, especially in terms of the relative significance of the rebrightening (i.e., by more than a magnitude). The time of the rebrightening can be related to the time of the shell collision when , which in a uniform density environment occurs at (Moss et al., 2023):
| (7) |
This timescale occurs for if the (isotropic-equivalent) kinetic energy is erg, which is likely on the extreme end of the possible values. If instead we consider a lower energy of erg with fixed density cm-3, the Lorentz factor of the slower moving material is then due to the rather weak dependence on energy in Equation 7. Instead, in a wind environment, where (Moss et al., 2023), we find for erg. Regardless, in either case, the trailing ejecta would have to at least be mildly relativistic, requiring that the initial outflow is also relativistic.
The rebrightening timescale of EP241021a is consistent with , similar to the observations of GRB 030329 (Granot et al., 2003; Moss et al., 2023). To good approximation, the rise time is the same as the reverse shock (RS) crossing time (Sari & Piran, 1995), which is determined by the ratio of Lorentz factors (e.g, Moss et al., 2023) such that to order unity corrections, where is the difference in Lorentz factors across the slower moving ejecta shell. We do not consider either a density enhancement (e.g., Ramirez-Ruiz et al., 2001; Dai & Lu, 2002; Nakar et al., 2003; Nakar & Granot, 2007; van Eerten et al., 2009), or complex density profile (potentially due to the progenitor star’s mass loss history), or long-lived central engine activity to explain the rebrightening, as none of these explanations are capable of easily producing the variability timescale ( ) and extremely steep rise required by the rebrightening of the OIR afterglow (steeper than at 90% CL; see §3.1).
The OIR temporal and spectral indices (§3.1 and §3.2) are capable of matching standard afterglow closure relations for either a uniform density or wind environment (Granot & Sari, 2002). In a wind environment, as expected for a massive star progenitor, the X-ray, optical, and near-infrared data would be above the cooling frequency ( ) such that the temporal index and spectral index are = and = for (Granot & Sari, 2002). These indices are roughly consistent with the values inferred in §3.1 and §3.2. We note that for emission above the cooling frequency the closure relation is unchanged between a uniform density or wind environment. An additional possibility for a uniform density environment is a steep value of such that = and =. While the temporal slope has a better match for , it is less consistent with the observed spectral index. In either scenario, the radio data is below the injection frequency (Yadav et al., in preparation).
The refreshed shock interpretation naturally explains the steep rise observed at OIR wavelengths (Figure 5), as well as the flat X-ray lightcurve555In this scenario where the X-ray and optical behavior is linked to the same emission mechanism or outflow, then the observed X-ray lightcurve is not a true plateau (only appearing so due to the sparse X-ray data), and would not apply in the manner shown in Figure 7. Higher cadence (and higher signal-to-noise) X-ray data is required for future events to either prove or disprove this hypothesis. (Figure 6; right panel). A refreshed relativistic shockwave produces a non-thermal spectrum that provides a better description of the data than CSM interaction with non-relativistic supernova ejecta, which is commonly thought to produce a blackbody-like spectrum that is not observed (see Figure 4 and §4.7.1). Moreover, the possible consistency between the early and late temporal slopes and with (see §3.1 for details) is suggestive of the refreshed shock scenario, as other models would not necessarily produce such behavior without fine tuning.
As our data do not show a clear jet-break out to late-times ( d; observer frame), we can set a constraint on the opening angle of the jet. Assuming an on-axis jet, the jet’s half-opening angle is larger than (Sari et al., 1999; Rhoads, 1999; Frail et al., 2001; Chevalier & Li, 2000; Bloom et al., 2003):
| (10) |
where we have already applied the redshift corrections using . Not unexpectedly given the late time of any jet break, these half-opening angles are rather large, for a GRB jet, especially for where deg, but they are not completely unprecedented (e.g., Frail et al., 2001; Wang et al., 2018; Rouco Escorial et al., 2022; O’Connor et al., 2023). However, different assumptions for the kinetic energy and density can decrease this opening angle slightly. As the trailing ejecta is likely more collimated than the initial outflow, a larger angle more easily favors the production of a rebrightening episode with ; see Moss et al. (2023) for a discussion.
However, a weakness of the refreshed shock model is the lack of similar rebrightening in the optical lightcurves of on-axis cosmological GRBs. Figure 5 shows EP241021a is at the extreme end of GRB optical luminosities, and comparable to the brightest-of-all-time GRB 221009A at a similar timescale (e.g., O’Connor et al., 2023; Laskar et al., 2023). Such behavior would be hard to miss in past GRBs, implying that EP240414a and EP241021a would have unique central engine properties, potentially resulting from either a failed or marginally successful jet breakout, which can also explain the lack of gamma-rays. As EP240414a and EP241021a are clearly different from typical GRBs, it is possible that other properties of their outflows are atypical, such as their Lorentz factors being mildly relativistic and the presence of trailing ejecta with sufficient energy to lead to a significant bump. Further exploration of the detectability of similar refreshed shocks in typical cosmological GRBs is left for future work, and will aid in determining the uniqueness of this refreshed shock model for EP241021a.
5 Conclusions
We have presented the results of our multi-wavelength follow-up campaign of EP241021a over the first 100 days of its evolution, including long-term monitoring with the FTW, VLT, and HET. Here, we summarize our main conclusions:
-
•
We determine that both EP241021a and EP240414a are likely produced by the same type of progenitor system, which is related to the death of a massive star.
-
•
The non-thermal prompt soft X-ray emission detected by EP requires at least a mildly relativistic outflow with bulk Lorentz factor . This interpretation is supported by the luminous radio emission (Yadav et al., in preparation).
-
•
The lack of gamma-rays may be due either to the limited sensitivity of the available gamma-ray telescopes, a low peak energy , or a low gamma-ray efficiency, potentially caused by a low outflow Lorentz factor.
- •
Future observations of similar events are required to build a sample, which will aid in determining the progenitor system, emission mechanisms, and diversity of their outflows. In particular, a refined X-ray dataset and multi-wavelength observations at d would provide strong constraints on the available models and the onset of the first component and its Lorentz factor.
Acknowledgements.
M. B. is supported by a Student Grant from the Wübben Stiftung Wissenschaft. B. O. is supported by the McWilliams Postdoctoral Fellowship at Carnegie Mellon University. P. B. is supported by a grant (no. 2020747) from the United States-Israel Binational Science Foundation (BSF), Jerusalem, Israel, by a grant (no. 1649/23) from the Israel Science Foundation and by a grant (no. 80NSSC 24K0770) from the NASA astrophysics theory program. M. M.’s research was supported by an appointment to the NASA Postdoctoral Program at the NASA Goddard Space Flight Center, administered by Oak Ridge Associated Universities under contract with NASA. E. T., Y.-H. Y., and M. Y. are supported by the European Research Council through the Consolidator grant BHianca (grant agreement ID 101002761). This paper contains data obtained at the Wendelstein Observatory of the Ludwig-Maximilians University Munich. This research has made use of the XRT Data Analysis Software (XRTDAS) developed under the responsibility of the ASI Science Data Center (ASDC), Italy. This research has made use of data and/or software provided by the High Energy Astrophysics Science Archive Research Center (HEASARC), which is a service of the Astrophysics Science Division at NASA/GSFC. This paper contains data from observations obtained with the Hobby-Eberly Telescope (HET), which is a joint project of the University of Texas at Austin, the Pennsylvania State University, Ludwig-Maximillians-Universität München, and Georg-August Universität Göttingen. The HET is named in honor of its principal benefactors, William P. Hobby and Robert E. Eberly. We thank Cassie Crowe, Nathan McReynolds, Stephen Odewahn, Justen Pautzke, Amy Ray, Sergey Rostopchin and Amy Westfall from the HET staff for obtaining the observations. We acknowledge the Texas Advanced Computing Center (TACC) at The University of Texas at Austin for providing high performance computing, visualization, and storage resources that have contributed to the results reported within this paper. The Low Resolution Spectrograph 2 (LRS2) was developed and funded by the University of Texas at Austin McDonald Observatory and Department of Astronomy, and by Pennsylvania State University. We thank the Leibniz-Institut fur Astrophysik Potsdam (AIP) and the Institut fur Astrophysik Goettingen (IAG) for their contributions to the construction of the integral field units. This research has made use of the Astrophysics Data System, funded by NASA under Cooperative Agreement 80NSSC21M00561. This research has made use of adstex (https://github.com/yymao/adstex). This work made use of the catalog presented by Dainotti et al. (2024). This work made use of the Astro-COLIBRI platform (Reichherzer et al., 2021).References
- Abdikamalov & Beniamini (2025) Abdikamalov, E. & Beniamini, P. 2025, arXiv e-prints, arXiv:2502.12757
- Alp & Larsson (2020) Alp, D. & Larsson, J. 2020, ApJ, 896, 39
- Amati (2006) Amati, L. 2006, MNRAS, 372, 233
- Appenzeller et al. (1998) Appenzeller, I., Fricke, K., Fürtig, W., et al. 1998, The Messenger, 94, 1
- Arnett (1982) Arnett, W. D. 1982, ApJ, 253, 785
- Atteia et al. (2017) Atteia, J. L., Heussaff, V., Dezalay, J. P., et al. 2017, ApJ, 837, 119
- Ayache et al. (2020) Ayache, E. H., van Eerten, H. J., & Daigne, F. 2020, MNRAS, 495, 2979
- Band et al. (1993) Band, D., Matteson, J., Ford, L., et al. 1993, ApJ, 413, 281
- Beniamini et al. (2022) Beniamini, P., Gill, R., & Granot, J. 2022, MNRAS, 515, 555
- Beniamini et al. (2020) Beniamini, P., Granot, J., & Gill, R. 2020, MNRAS, 493, 3521
- Beniamini & Kumar (2016) Beniamini, P. & Kumar, P. 2016, MNRAS, 457, L108
- Beniamini & Mochkovitch (2017) Beniamini, P. & Mochkovitch, R. 2017, A&A, 605, A60
- Bernardini et al. (2011) Bernardini, M. G., Margutti, R., Chincarini, G., Guidorzi, C., & Mao, J. 2011, A&A, 526, A27
- Bertin (2006) Bertin, E. 2006, in Astronomical Society of the Pacific Conference Series, Vol. 351, Astronomical Data Analysis Software and Systems XV, ed. C. Gabriel, C. Arviset, D. Ponz, & S. Enrique, 112
- Bertin (2010) Bertin, E. 2010, SWarp: Resampling and Co-adding FITS Images Together
- Bertin & Arnouts (1996) Bertin, E. & Arnouts, S. 1996, A&AS, 117, 393
- Bertin et al. (2002) Bertin, E., Mellier, Y., Radovich, M., et al. 2002, in Astronomical Society of the Pacific Conference Series, Vol. 281, Astronomical Data Analysis Software and Systems XI, ed. D. A. Bohlender, D. Durand, & T. H. Handley, 228
- Bloom et al. (2003) Bloom, J. S., Frail, D. A., & Kulkarni, S. R. 2003, ApJ, 594, 674
- Bochenek & Perley (2024a) Bochenek, A. & Perley, D. A. 2024a, GRB Coordinates Network, 37869, 1
- Bochenek & Perley (2024b) Bochenek, A. & Perley, D. A. 2024b, GRB Coordinates Network, 38030, 1
- Bradley et al. (2024) Bradley, L., Sipőcz, B., Robitaille, T., et al. 2024, astropy/photutils: 2.0.2
- Bright et al. (2024) Bright, J. S., Carotenuto, F., Fender, R., et al. 2024, arXiv e-prints, arXiv:2409.19055
- Burrows et al. (2005a) Burrows, D. N., Hill, J. E., Nousek, J. A., et al. 2005a, Space Sci. Rev., 120, 165
- Burrows et al. (2005b) Burrows, D. N., Romano, P., Falcone, A., et al. 2005b, Science, 309, 1833
- Cano et al. (2011) Cano, Z., Bersier, D., Guidorzi, C., et al. 2011, ApJ, 740, 41
- Cano et al. (2017) Cano, Z., Wang, S.-Q., Dai, Z.-G., & Wu, X.-F. 2017, Advances in Astronomy, 2017, 8929054
- Cappellaro et al. (1997) Cappellaro, E., Mazzali, P. A., Benetti, S., et al. 1997, A&A, 328, 203
- Cenko et al. (2013) Cenko, S. B., Kulkarni, S. R., Horesh, A., et al. 2013, ApJ, 769, 130
- Chambers et al. (2016) Chambers, K. C., Magnier, E. A., Metcalfe, N., et al. 2016, arXiv e-prints, arXiv:1612.05560
- Chatzopoulos et al. (2013) Chatzopoulos, E., Wheeler, J. C., Vinko, J., Horvath, Z. L., & Nagy, A. 2013, ApJ, 773, 76
- Chen et al. (2023) Chen, Z. H., Yan, L., Kangas, T., et al. 2023, ApJ, 943, 42
- Chevalier & Li (2000) Chevalier, R. A. & Li, Z.-Y. 2000, ApJ, 536, 195
- Chonis et al. (2014) Chonis, T. S., Hill, G. J., Lee, H., Tuttle, S. E., & Vattiat, B. L. 2014, in Society of Photo-Optical Instrumentation Engineers (SPIE) Conference Series, Vol. 9147, Ground-based and Airborne Instrumentation for Astronomy V, ed. S. K. Ramsay, I. S. McLean, & H. Takami, 91470A
- Chonis et al. (2016) Chonis, T. S., Hill, G. J., Lee, H., et al. 2016, in Society of Photo-Optical Instrumentation Engineers (SPIE) Conference Series, Vol. 9908, Ground-based and Airborne Instrumentation for Astronomy VI, ed. C. J. Evans, L. Simard, & H. Takami, 99084C
- Clark et al. (2020) Clark, P., Maguire, K., Inserra, C., et al. 2020, MNRAS, 492, 2208
- Coppejans et al. (2018) Coppejans, D. L., Margutti, R., Guidorzi, C., et al. 2018, ApJ, 856, 56
- Coppejans et al. (2020) Coppejans, D. L., Margutti, R., Terreran, G., et al. 2020, ApJ, 895, L23
- Covino et al. (2008) Covino, S., D’Avanzo, P., Klotz, A., et al. 2008, MNRAS, 388, 347
- Curran et al. (2008) Curran, P. A., Starling, R. L. C., O’Brien, P. T., et al. 2008, A&A, 487, 533
- Dai & Lu (2002) Dai, Z. G. & Lu, T. 2002, ApJ, 565, L87
- Dainotti et al. (2008) Dainotti, M. G., Cardone, V. F., & Capozziello, S. 2008, MNRAS, 391, L79
- Dainotti et al. (2024) Dainotti, M. G., De Simone, B., Malik, R. F. M., et al. 2024, MNRAS[arXiv:2405.02263]
- Dalal et al. (2002) Dalal, N., Griest, K., & Pruet, J. 2002, ApJ, 564, 209
- Das et al. (2024) Das, K. K., Fremling, C., Kasliwal, M. M., et al. 2024, ApJ, 969, L11
- D’Elia et al. (2018) D’Elia, V., Campana, S., D’Aì, A., et al. 2018, A&A, 619, A66
- Dichiara et al. (2022) Dichiara, S., Troja, E., Lipunov, V., et al. 2022, MNRAS, 512, 2337
- Drout et al. (2014) Drout, M. R., Chornock, R., Soderberg, A. M., et al. 2014, ApJ, 794, 23
- Duque et al. (2022) Duque, R., Beniamini, P., Daigne, F., & Mochkovitch, R. 2022, MNRAS, 513, 951
- Eftekhari et al. (2019) Eftekhari, T., Berger, E., Margalit, B., et al. 2019, ApJ, 876, L10
- Foreman-Mackey et al. (2013) Foreman-Mackey, D., Hogg, D. W., Lang, D., & Goodman, J. 2013, PASP, 125, 306
- Frail et al. (2001) Frail, D. A., Kulkarni, S. R., Sari, R., et al. 2001, ApJ, 562, L55
- Freeburn et al. (2024a) Freeburn, J., Andreoni, I., & Carney, J. 2024a, GRB Coordinates Network, 37942, 1
- Freeburn et al. (2024b) Freeburn, J., Cooke, J., Möller, A., et al. 2024b, arXiv e-prints, arXiv:2405.11949
- Fu et al. (2024a) Fu, S. Y., Tinyanont, S., Anutarawiramkul, R., et al. 2024a, GRB Coordinates Network, 37842, 1
- Fu et al. (2024b) Fu, S. Y., Zhu, Z. P., An, J., et al. 2024b, GRB Coordinates Network, 37840, 1
- Galama et al. (1998) Galama, T. J., Vreeswijk, P. M., van Paradijs, J., et al. 1998, Nature, 395, 670
- Galama et al. (1999) Galama, T. J., Vreeswijk, P. M., van Paradijs, J., et al. 1999, A&AS, 138, 465
- Gehrels et al. (2004) Gehrels, N., Chincarini, G., Giommi, P., et al. 2004, ApJ, 611, 1005
- Ghirlanda et al. (2012) Ghirlanda, G., Ghisellini, G., Nava, L., et al. 2012, MNRAS, 422, 2553
- Ghirlanda et al. (2018) Ghirlanda, G., Nappo, F., Ghisellini, G., et al. 2018, A&A, 609, A112
- Ghirlanda et al. (2019) Ghirlanda, G., Salafia, O. S., Paragi, Z., et al. 2019, Science, 363, 968
- Ghisellini et al. (2010) Ghisellini, G., Ghirlanda, G., Nava, L., & Celotti, A. 2010, MNRAS, 403, 926
- Gill & Granot (2023) Gill, R. & Granot, J. 2023, MNRAS, 524, L78
- Gillanders et al. (2024) Gillanders, J. H., Rhodes, L., Srivastav, S., et al. 2024, ApJ, 969, L14
- Gomez et al. (2022) Gomez, S., Berger, E., Nicholl, M., Blanchard, P. K., & Hosseinzadeh, G. 2022, ApJ, 941, 107
- Gomez et al. (2024) Gomez, S., Nicholl, M., Berger, E., et al. 2024, MNRAS, 535, 471
- Goodman (1986) Goodman, J. 1986, ApJ, 308, L47
- Gössl & Riffeser (2002) Gössl, C. A. & Riffeser, A. 2002, A&A, 381, 1095
- Granot et al. (2003) Granot, J., Nakar, E., & Piran, T. 2003, Nature, 426, 138
- Granot & Sari (2002) Granot, J. & Sari, R. 2002, ApJ, 568, 820
- Guillochon et al. (2018) Guillochon, J., Nicholl, M., Villar, V. A., et al. 2018, ApJS, 236, 6
- H. E. S. S. Collaboration et al. (2021) H. E. S. S. Collaboration, Abdalla, H., Aharonian, F., et al. 2021, Science, 372, 1081
- Hill et al. (2021) Hill, G. J., Lee, H., MacQueen, P. J., et al. 2021, AJ, 162, 298
- Hinton (2016) Hinton, S. R. 2016, The Journal of Open Source Software, 1, 00045
- Hjorth & Bloom (2012) Hjorth, J. & Bloom, J. S. 2012, in Chapter 9 in ”Gamma-Ray Bursts, ed. C. Kouveliotou, R. A. M. J. Wijers, & S. Woosley, 169–190
- Ho et al. (2023a) Ho, A. Y. Q., Perley, D. A., Chen, P., et al. 2023a, Nature, 623, 927
- Ho et al. (2023b) Ho, A. Y. Q., Perley, D. A., Gal-Yam, A., et al. 2023b, ApJ, 949, 120
- Ho et al. (2020) Ho, A. Y. Q., Perley, D. A., Kulkarni, S. R., et al. 2020, ApJ, 895, 49
- Ho et al. (2022) Ho, A. Y. Q., Perley, D. A., Yao, Y., et al. 2022, ApJ, 938, 85
- Ho et al. (2019) Ho, A. Y. Q., Phinney, E. S., Ravi, V., et al. 2019, ApJ, 871, 73
- Hopp et al. (2014) Hopp, U., Bender, R., Grupp, F., et al. 2014, in Society of Photo-Optical Instrumentation Engineers (SPIE) Conference Series, Vol. 9145, Ground-based and Airborne Telescopes V, ed. L. M. Stepp, R. Gilmozzi, & H. J. Hall, 91452D
- Hu et al. (2024) Hu, J. W., Wang, Y., He, H., et al. 2024, GRB Coordinates Network, 37834, 1
- Huang et al. (2002) Huang, Y. F., Dai, Z. G., & Lu, T. 2002, MNRAS, 332, 735
- Irwin & Hotokezaka (2024a) Irwin, C. M. & Hotokezaka, K. 2024a, arXiv e-prints, arXiv:2412.06733
- Irwin & Hotokezaka (2024b) Irwin, C. M. & Hotokezaka, K. 2024b, arXiv e-prints, arXiv:2412.06734
- Irwin & Hotokezaka (2024c) Irwin, C. M. & Hotokezaka, K. 2024c, arXiv e-prints, arXiv:2412.06736
- Iwamoto et al. (1998) Iwamoto, K., Mazzali, P. A., Nomoto, K., et al. 1998, Nature, 395, 672
- Izzo et al. (2019) Izzo, L., de Ugarte Postigo, A., Maeda, K., et al. 2019, Nature, 565, 324
- Jiang et al. (2025) Jiang, S.-Q., Xu, D., van Hoof, A. P. C., et al. 2025, arXiv e-prints, arXiv:2503.04306
- Jóhannesson et al. (2006) Jóhannesson, G., Björnsson, G., & Gudmundsson, E. H. 2006, ApJ, 647, 1238
- Kissler-Patig et al. (2008) Kissler-Patig, M., Pirard, J. F., Casali, M., et al. 2008, A&A, 491, 941
- Klingler et al. (2024) Klingler, N., Oates, S. R., Eyles-Ferris, R., & Swift-UVOT Team. 2024, GRB Coordinates Network, 37990, 1
- Knust et al. (2017) Knust, F., Greiner, J., van Eerten, H. J., et al. 2017, A&A, 607, A84
- Koposov et al. (2024) Koposov, S., Speagle, J., Barbary, K., et al. 2024, joshspeagle/dynesty: v2.1.4
- Kumar et al. (2022) Kumar, H., Gupta, R., Saraogi, D., et al. 2022, MNRAS, 513, 2777
- Kumar & Panaitescu (2000) Kumar, P. & Panaitescu, A. 2000, ApJ, 541, L51
- Lamb et al. (2019) Lamb, G. P., Tanvir, N. R., Levan, A. J., et al. 2019, ApJ, 883, 48
- Lamberts & Daigne (2018) Lamberts, A. & Daigne, F. 2018, MNRAS, 474, 2813
- Lang-Bardl et al. (2016) Lang-Bardl, F., Bender, R., Goessl, C., et al. 2016, in Society of Photo-Optical Instrumentation Engineers (SPIE) Conference Series, Vol. 9908, Ground-based and Airborne Instrumentation for Astronomy VI, ed. C. J. Evans, L. Simard, & H. Takami, 990844
- Laskar et al. (2023) Laskar, T., Alexander, K. D., Margutti, R., et al. 2023, ApJ, 946, L23
- Law et al. (2018) Law, C. J., Gaensler, B. M., Metzger, B. D., Ofek, E. O., & Sironi, L. 2018, ApJ, 866, L22
- Levan et al. (2024) Levan, A. J., Jonker, P. G., Saccardi, A., et al. 2024, arXiv e-prints, arXiv:2404.16350
- Levinson et al. (2002) Levinson, A., Ofek, E. O., Waxman, E., & Gal-Yam, A. 2002, ApJ, 576, 923
- Li et al. (2024a) Li, M. L., Ho, A. Y. Q., Ryan, G., et al. 2024a, arXiv e-prints, arXiv:2411.07973
- Li et al. (2024b) Li, W. X., Sun, N. C., Maund, J., Wang, Y. N., & Wiersema, K. 2024b, GRB Coordinates Network, 37846, 1
- Li et al. (2024c) Li, W. X., Xue, S. J., Andrews, M., et al. 2024c, GRB Coordinates Network, 37844, 1
- Lien et al. (2016) Lien, A., Sakamoto, T., Barthelmy, S. D., et al. 2016, ApJ, 829, 7
- Lipunov et al. (2022) Lipunov, V., Kornilov, V., Zhirkov, K., et al. 2022, MNRAS, 516, 4980
- Liu et al. (2024) Liu, Y., Sun, H., Xu, D., et al. 2024, arXiv e-prints, arXiv:2404.16425
- Malesani et al. (2004) Malesani, D., Tagliaferri, G., Chincarini, G., et al. 2004, ApJ, 609, L5
- Margutti et al. (2011) Margutti, R., Bernardini, G., Barniol Duran, R., et al. 2011, MNRAS, 410, 1064
- Margutti et al. (2019) Margutti, R., Metzger, B. D., Chornock, R., et al. 2019, ApJ, 872, 18
- Meegan et al. (2009) Meegan, C., Lichti, G., Bhat, P. N., et al. 2009, ApJ, 702, 791
- Melandri et al. (2014) Melandri, A., Virgili, F. J., Guidorzi, C., et al. 2014, A&A, 572, A55
- Molinari et al. (2007) Molinari, E., Vergani, S. D., Malesani, D., et al. 2007, A&A, 469, L13
- Mooley et al. (2018) Mooley, K. P., Deller, A. T., Gottlieb, O., et al. 2018, Nature, 561, 355
- Mooley et al. (2022) Mooley, K. P., Margalit, B., Law, C. J., et al. 2022, ApJ, 924, 16
- Moore et al. (2024) Moore, T., Gillanders, J. H., Nicholl, M., et al. 2024, arXiv e-prints, arXiv:2405.13596
- Moss et al. (2023) Moss, M. J., Mochkovitch, R., Daigne, F., Beniamini, P., & Guiriec, S. 2023, MNRAS, 525, 5224
- Nadyozhin (1994) Nadyozhin, D. K. 1994, ApJS, 92, 527
- Nakar & Granot (2007) Nakar, E. & Granot, J. 2007, MNRAS, 380, 1744
- Nakar et al. (2002) Nakar, E., Piran, T., & Granot, J. 2002, ApJ, 579, 699
- Nakar et al. (2003) Nakar, E., Piran, T., & Granot, J. 2003, New A, 8, 495
- Nappo et al. (2014) Nappo, F., Ghisellini, G., Ghirlanda, G., et al. 2014, MNRAS, 445, 1625
- Nava et al. (2013) Nava, L., Sironi, L., Ghisellini, G., Celotti, A., & Ghirlanda, G. 2013, MNRAS, 433, 2107
- Nicholl et al. (2020) Nicholl, M., Blanchard, P. K., Berger, E., et al. 2020, Nature Astronomy, 4, 893
- Nicholl et al. (2017) Nicholl, M., Guillochon, J., & Berger, E. 2017, ApJ, 850, 55
- O’Connor et al. (2024) O’Connor, B., Beniamini, P., & Gill, R. 2024, MNRAS[arXiv:2406.05297]
- O’Connor et al. (2020) O’Connor, B., Beniamini, P., & Kouveliotou, C. 2020, MNRAS, 495, 4782
- O’Connor et al. (2025) O’Connor, B., Pasham, D., Andreoni, I., et al. 2025, ApJ, 979, L30
- O’Connor et al. (2023) O’Connor, B., Troja, E., Ryan, G., et al. 2023, Science Advances, 9, eadi1405
- Ofek et al. (2007) Ofek, E. O., Cenko, S. B., Gal-Yam, A., et al. 2007, ApJ, 662, 1129
- Panaitescu (2008) Panaitescu, A. 2008, MNRAS, 383, 1143
- Panaitescu & Vestrand (2011) Panaitescu, A. & Vestrand, W. T. 2011, MNRAS, 414, 3537
- Pérez-Fournon et al. (2024) Pérez-Fournon, I., Sun, N. C., Li, W., et al. 2024, GRB Coordinates Network, 37858, 1
- Perley et al. (2024) Perley, D. A., Ho, A. Y. Q., Fausnaugh, M., et al. 2024, arXiv e-prints, arXiv:2401.16470
- Perley et al. (2021) Perley, D. A., Ho, A. Y. Q., Yao, Y., et al. 2021, MNRAS, 508, 5138
- Perley et al. (2019) Perley, D. A., Mazzali, P. A., Yan, L., et al. 2019, MNRAS, 484, 1031
- Planck Collaboration et al. (2020) Planck Collaboration, Aghanim, N., Akrami, Y., et al. 2020, A&A, 641, A6
- Prentice et al. (2018) Prentice, S. J., Maguire, K., Smartt, S. J., et al. 2018, ApJ, 865, L3
- Pugliese et al. (2024) Pugliese, G., Xu, D., Izzo, L., et al. 2024, GRB Coordinates Network, 37852, 1
- Pursiainen et al. (2018) Pursiainen, M., Childress, M., Smith, M., et al. 2018, MNRAS, 481, 894
- Quirola-Vásquez et al. (2024) Quirola-Vásquez, J., Bauer, F. E., Jonker, P. G., et al. 2024, A&A, 683, A243
- Quirola-Vásquez et al. (2023) Quirola-Vásquez, J., Bauer, F. E., Jonker, P. G., et al. 2023, A&A, 675, A44
- Quirola-Vásquez et al. (2022) Quirola-Vásquez, J., Bauer, F. E., Jonker, P. G., et al. 2022, A&A, 663, A168
- Quirola-Vasquez et al. (2024) Quirola-Vasquez, J. A., Malesani, D. B., Levan, A. J., Bauer, F. E., & Jonker, P. G. 2024, GRB Coordinates Network, 37930, 1
- Ramirez-Ruiz et al. (2001) Ramirez-Ruiz, E., Dray, L. M., Madau, P., & Tout, C. A. 2001, MNRAS, 327, 829
- Ramsey et al. (1998) Ramsey, L. W., Adams, M. T., Barnes, T. G., et al. 1998, in Society of Photo-Optical Instrumentation Engineers (SPIE) Conference Series, Vol. 3352, Advanced Technology Optical/IR Telescopes VI, ed. L. M. Stepp, 34–42
- Rees & Mészáros (1998) Rees, M. J. & Mészáros, P. 1998, ApJ, 496, L1
- Reichherzer et al. (2021) Reichherzer, P., Schüssler, F., Lefranc, V., et al. 2021, ApJS, 256, 5
- Rhoads (1999) Rhoads, J. E. 1999, ApJ, 525, 737
- Rhoads (2003) Rhoads, J. E. 2003, ApJ, 591, 1097
- Ricci et al. (2024a) Ricci, R., Bruni, G., Carotenuto, F., Gianfagna, G., & Yao, Y. 2024a, GRB Coordinates Network, 37949, 1
- Ricci et al. (2024b) Ricci, R., Troja, E., Yang, Y., et al. 2024b, arXiv e-prints, arXiv:2407.18311
- Roming et al. (2005) Roming, P. W. A., Kennedy, T. E., Mason, K. O., et al. 2005, Space Sci. Rev., 120, 95
- Ror et al. (2024) Ror, A. K., Gupta, A., Tripathi, T., Pandey, S. B., & Mishra, K. 2024, GRB Coordinates Network, 37845, 1
- Rouco Escorial et al. (2022) Rouco Escorial, A., Fong, W.-f., Berger, E., et al. 2022, arXiv e-prints, arXiv:2210.05695
- Ryan et al. (2023) Ryan, G., van Eerten, H., Troja, E., et al. 2023, arXiv e-prints, arXiv:2310.02328
- Sakamoto et al. (2011) Sakamoto, T., Barthelmy, S. D., Baumgartner, W. H., et al. 2011, ApJS, 195, 2
- Sakamoto et al. (2004) Sakamoto, T., Lamb, D. Q., Graziani, C., et al. 2004, ApJ, 602, 875
- Sari & Mészáros (2000) Sari, R. & Mészáros, P. 2000, ApJ, 535, L33
- Sari & Piran (1995) Sari, R. & Piran, T. 1995, ApJ, 455, L143
- Sari & Piran (1999) Sari, R. & Piran, T. 1999, ApJ, 520, 641
- Sari et al. (1999) Sari, R., Piran, T., & Halpern, J. P. 1999, ApJ, 519, L17
- Schlafly & Finkbeiner (2011) Schlafly, E. F. & Finkbeiner, D. P. 2011, ApJ, 737, 103
- Schneider & Adami (2024a) Schneider, B. & Adami, C. 2024a, GRB Coordinates Network, 38071, 1
- Schneider & Adami (2024b) Schneider, B. & Adami, C. 2024b, GRB Coordinates Network, 38022, 1
- Schroeder et al. (2024) Schroeder, G., Srinivasaragavan, G., Ho, A., et al. 2024, GRB Coordinates Network, 38640, 1
- Shetrone et al. (2007) Shetrone, M., Cornell, M. E., Fowler, J. R., et al. 2007, PASP, 119, 556
- Skrutskie et al. (2006) Skrutskie, M. F., Cutri, R. M., Stiening, R., et al. 2006, AJ, 131, 1163
- Soderberg et al. (2004a) Soderberg, A. M., Kulkarni, S. R., Berger, E., et al. 2004a, ApJ, 606, 994
- Soderberg et al. (2004b) Soderberg, A. M., Kulkarni, S. R., Berger, E., et al. 2004b, Nature, 430, 648
- Soderberg et al. (2006) Soderberg, A. M., Kulkarni, S. R., Nakar, E., et al. 2006, Nature, 442, 1014
- Soderberg et al. (2007) Soderberg, A. M., Nakar, E., Cenko, S. B., et al. 2007, ApJ, 661, 982
- Speagle (2020) Speagle, J. S. 2020, MNRAS, 493, 3132
- Srinivasaragavan et al. (2025) Srinivasaragavan, G. P., Perley, D. A., Ho, A. Y. Q., et al. 2025, MNRAS[arXiv:2501.03337]
- Srivastav et al. (2024) Srivastav, S., Chen, T. W., Gillanders, J. H., et al. 2024, arXiv e-prints, arXiv:2409.19070
- Starling et al. (2011) Starling, R. L. C., Wiersema, K., Levan, A. J., et al. 2011, MNRAS, 411, 2792
- Sun et al. (2024) Sun, H., Li, W. X., Liu, L. D., et al. 2024, arXiv e-prints, arXiv:2410.02315
- Suzuki et al. (2021) Suzuki, A., Nicholl, M., Moriya, T. J., & Takiwaki, T. 2021, ApJ, 908, 99
- Svinkin et al. (2024) Svinkin, D., Frederiks, D., & Konus-Wind team. 2024, GRB Coordinates Network, 38034, 1
- Swenson et al. (2013) Swenson, C. A., Roming, P. W. A., De Pasquale, M., & Oates, S. R. 2013, ApJ, 774, 2
- Tang et al. (2019) Tang, C.-H., Huang, Y.-F., Geng, J.-J., & Zhang, Z.-B. 2019, ApJS, 245, 1
- Thompson (1994) Thompson, C. 1994, MNRAS, 270, 480
- Totani & Panaitescu (2002) Totani, T. & Panaitescu, A. 2002, ApJ, 576, 120
- Troja et al. (2007) Troja, E., Cusumano, G., O’Brien, P. T., et al. 2007, ApJ, 665, 599
- van Dalen et al. (2024) van Dalen, J. N. D., Levan, A. J., Jonker, P. G., et al. 2024, arXiv e-prints, arXiv:2409.19056
- van Eerten et al. (2009) van Eerten, H. J., Meliani, Z., Wijers, R. A. M. J., & Keppens, R. 2009, MNRAS, 398, L63
- Villar et al. (2017) Villar, V. A., Berger, E., Metzger, B. D., & Guillochon, J. 2017, ApJ, 849, 70
- Vinkó et al. (2015) Vinkó, J., Yuan, F., Quimby, R. M., et al. 2015, ApJ, 798, 12
- Wang et al. (2018) Wang, X.-G., Zhang, B., Liang, E.-W., et al. 2018, ApJ, 859, 160
- Willingale et al. (2013) Willingale, R., Starling, R. L. C., Beardmore, A. P., Tanvir, N. R., & O’Brien, P. T. 2013, MNRAS, 431, 394
- Xu et al. (2021) Xu, F., Tang, C.-H., Geng, J.-J., et al. 2021, ApJ, 920, 135
- Yao et al. (2020) Yao, Y., De, K., Kasliwal, M. M., et al. 2020, ApJ, 900, 46
- Yin et al. (2024) Yin, Y.-H. I., Zhang, B.-B., Yang, J., et al. 2024, arXiv e-prints, arXiv:2407.10156
- Yuan et al. (2025) Yuan, W., Dai, L., Feng, H., et al. 2025, arXiv e-prints, arXiv:2501.07362
- Yuan et al. (2022) Yuan, W., Zhang, C., Chen, Y., & Ling, Z. 2022, in Handbook of X-ray and Gamma-ray Astrophysics, 86
- Yuan et al. (2015) Yuan, W., Zhang, C., Feng, H., et al. 2015, arXiv e-prints, arXiv:1506.07735
- Zhang et al. (2006) Zhang, B., Fan, Y. Z., Dyks, J., et al. 2006, ApJ, 642, 354
- Zhang et al. (2024) Zhang, B., Wang, X.-Y., & Zheng, J.-H. 2024, Journal of High Energy Astrophysics, 41, 42
- Zhang et al. (2025) Zhang, W., Yuan, W., Ling, Z., et al. 2025, Science China Physics, Mechanics, and Astronomy, 68, 219511
- Zheng et al. (2024a) Zheng, W., Brink, T. G., Filippenko, A. V., Yang, Y., & KAIT GRB Team. 2024a, GRB Coordinates Network, 38294, 1
- Zheng et al. (2024b) Zheng, W., Han, X., Zhang, P., Filippenko, V., A., & KAIT GRB team. 2024b, GRB Coordinates Network, 37849, 1
Appendix A Log of Observations
Here we report the list of observations of EP241021a analyzed as part of this work. The observations are tabulated in Table LABEL:tab:_observationsPhot and 2.
| Start Time (UT) | (d) | Telescope | Instrument | Exposure (s) | Filter | AB magnitude | (mag) |
|---|---|---|---|---|---|---|---|
| Wendelstein Observatory | |||||||
| 2024-10-24T02:12:17 | FTW | 3KK | r | p m 0.16 | |||
| 2024-10-24T02:12:17 | FTW | 3KK | z | p m 0.21 | |||
| 2024-10-24T02:12:31 | FTW | 3KK | J | p m 0.21 | |||
| 2024-10-24T23:42:00 | FTW | 3KK | r | p m 0.10 | |||
| 2024-10-24T23:42:00 | FTW | 3KK | z | p m 0.12 | |||
| 2024-10-24T23:42:14 | FTW | 3KK | J | p m 0.12 | |||
| 2024-10-25T21:27:05 | FTW | 3KK | r | p m 0.10 | |||
| 2024-10-25T21:27:05 | FTW | 3KK | z | p m 0.21 | |||
| 2024-10-25T21:27:20 | FTW | 3KK | J | p m 0.23 | |||
| 2024-10-26T19:25:35 | FTW | 3KK | r | p m 0.18 | |||
| 2024-10-26T19:25:35 | FTW | 3KK | z | ¿22.2 | |||
| 2024-10-26T19:25:49 | FTW | 3KK | J | p m 0.26 | |||
| 2024-10-28T21:04:27 | FTW | 3KK | r | p m 0.10 | |||
| 2024-10-28T21:04:27 | FTW | 3KK | z | p m 0.10 | |||
| 2024-10-28T21:08:46 | FTW | 3KK | J | p m 0.10 | |||
| 2024-10-29T19:23:45 | FTW | 3KK | r | p m 0.10 | |||
| 2024-10-29T19:23:45 | FTW | 3KK | z | p m 0.10 | |||
| 2024-10-29T19:23:59 | FTW | 3KK | J | p m 0.10 | |||
| 2024-10-31T00:20:10 | FTW | 3KK | r | p m 0.10 | |||
| 2024-10-31T00:20:10 | FTW | 3KK | z | p m 0.10 | |||
| 2024-10-31T00:20:24 | FTW | 3KK | J | p m 0.10 | |||
| 2024-10-31T18:40:04 | FTW | 3KK | r | p m 0.10 | |||
| 2024-10-31T18:40:04 | FTW | 3KK | z | p m 0.10 | |||
| 2024-10-31T18:40:18 | FTW | 3KK | J | p m 0.10 | |||
| 2024-11-01T22:17:50 | FTW | 3KK | r | p m 0.10 | |||
| 2024-11-01T22:17:50 | FTW | 3KK | z | p m 0.10 | |||
| 2024-11-01T22:18:04 | FTW | 3KK | J | p m 0.10 | |||
| 2024-11-03T19:34:27 | FTW | 3KK | r | p m 0.10 | |||
| 2024-11-03T19:34:27 | FTW | 3KK | z | p m 0.12 | |||
| 2024-11-03T19:34:41 | FTW | 3KK | J | p m 0.20 | |||
| 2024-11-04T23:53:42 | FTW | 3KK | r | p m 0.10 | |||
| 2024-11-04T23:53:42 | FTW | 3KK | z | p m 0.10 | |||
| 2024-11-04T23:53:56 | FTW | 3KK | J | p m 0.14 | |||
| 2024-11-06T01:11:18 | FTW | 3KK | r | p m 0.10 | |||
| 2024-11-06T01:11:18 | FTW | 3KK | z | p m 0.14 | |||
| 2024-11-06T01:11:32 | FTW | 3KK | J | p m 0.20 | |||
| 2024-11-07T21:53:13 | FTW | 3KK | r | p m 0.10 | |||
| 2024-11-07T21:53:13 | FTW | 3KK | z | p m 0.11 | |||
| 2024-11-07T21:53:27 | FTW | 3KK | J | p m 0.16 | |||
| 2024-11-08T22:55:09 | FTW | 3KK | r | p m 0.3 | |||
| 2024-11-08T22:55:09 | FTW | 3KK | z | ¿22.1 | |||
| 2024-11-08T23:02:27 | FTW | 3KK | J | ¿21.2 | |||
| 2024-11-10T22:29:33 | FTW | 3KK | r | p m 0.11 | |||
| 2024-11-10T22:29:33 | FTW | 3KK | z | p m 0.22 | |||
| 2024-11-10T22:29:47 | FTW | 3KK | J | ¿22.3 | |||
| 2024-11-12T19:22:13 | FTW | 3KK | r | p m 0.12 | |||
| 2024-11-12T19:22:13 | FTW | 3KK | z | p m 0.16 | |||
| 2024-11-12T19:22:28 | FTW | 3KK | J | p m 0.22 | |||
| 2024-11-16T18:12:12 | FTW | 3KK | r | p m 0.4 | |||
| 2024-11-16T18:12:12 | FTW | 3KK | z | p m 0.4 | |||
| 2024-11-16T18:12:26 | FTW | 3KK | J | ¿22.5 | |||
| 2024-11-24T20:59:23 | FTW | 3KK | r | ¿23.3 | |||
| 2024-11-24T20:59:23 | FTW | 3KK | z | ¿22.1 | |||
| 2024-11-24T20:59:37 | FTW | 3KK | J | ¿21.7 | |||
| 2024-11-25T21:53:13 | FTW | 3KK | r | ¿23.5 | |||
| 2024-11-25T21:53:13 | FTW | 3KK | z | ¿21.9 | |||
| 2024-11-25T21:53:27 | FTW | 3KK | J | ¿21.3 | |||
| 2024-11-27T19:31:59 | FTW | 3KK | r | p m 0.23 | |||
| 2024-11-27T19:31:59 | FTW | 3KK | z | ¿22.5 | |||
| 2024-11-27T19:32:13 | FTW | 3KK | J | ¿21.9 | |||
| 2024-11-30T18:51:08 | FTW | 3KK | r | p m 0.19 | |||
| 2024-11-30T18:51:08 | FTW | 3KK | z | ¿23.3 | |||
| 2024-11-30T18:51:22 | FTW | 3KK | J | p m 0.23 | |||
| 2024-12-01T18:26:24 | FTW | 3KK | r | p m 0.12 | |||
| 2024-12-01T18:26:24 | FTW | 3KK | i | p m 0.15 | |||
| 2024-12-01T18:26:38 | FTW | 3KK | H | ¿22.3 | |||
| Very Large Telescope | |||||||
| 2024-12-05T01:48:40 | VLT | FORS2 | R | p m 0.1 | |||
| 2024-12-05T02:13:04 | VLT | HAWK-I | J | p m 0.1 | |||
| 2024-12-22T01:02:41 | VLT | HAWK-I | J | p m 0.1 | |||
| 2024-12-28T02:12:42 | VLT | FORS2 | R | p m 0.15 | |||
| 2025-01-23T01:04:23 | VLT | HAWK-I | J | p m 0.15 | |||
| 2025-01-23T01:32:49 | VLT | FORS2 | R | p m 0.1 | |||
| Swift/UVOT | |||||||
| 2024-10-24T20:58:13 | Swift | UVOT | v | ¿20.5 | |||
| 2024-10-24T21:08:18 | Swift | UVOT | b | ¿19.8 | |||
| 2024-10-25T15:30:30 | Swift | UVOT | uvm2 | ¿22.4 | |||
| 2024-10-29T09:32:49 | Swift | UVOT | u | p m 0.23 | |||
| 2024-11-03T02:25:38 | Swift | UVOT | u | ¿22.3 | |||
| 2024-11-05T20:24:14 | Swift | UVOT | u | ¿21.7 | |||
| 2024-11-07T02:15:17 | Swift | UVOT | u | ¿22.3 | |||
| 2024-11-15T19:08:48 | Swift | UVOT | u | ¿22.0 | |||
| Start Time (UT) | (d) | Telescope | Instrument | Exposure (s) |
|---|---|---|---|---|
| 2024-10-25T04:25 | HET | LRS-B | ||
| 2024-10-29T07:43 | HET | LRS-R | ||
| 2024-11-26T05:43 | HET | LRS-R |
| Start Time (UT) | (d) | Telescope | Instrument | Exposure (s) | Flux (erg cm-2 s-1) |
|---|---|---|---|---|---|
| 2024-10-24T20:54:12 | Swift | XRT | 2770 | ||
| 2024-10-25T15:26:02 | Swift | XRT | 1380 | ||
| 2024-10-29T09:30:13 | Swift | XRT | 4385 | ||
| 2024-11-03T02:22:02 | Swift | XRT | 3120 | ||
| 2024-11-05T20:21:02 | Swift | XRT | 1005 | ||
| 2024-11-07T02:13:02 | Swift | XRT | 3180 | ||
| 2024-11-15T19:06:02 | Swift | XRT | 1710 |
Appendix B Corner Plot Results of OIR Lightcurve Fitting
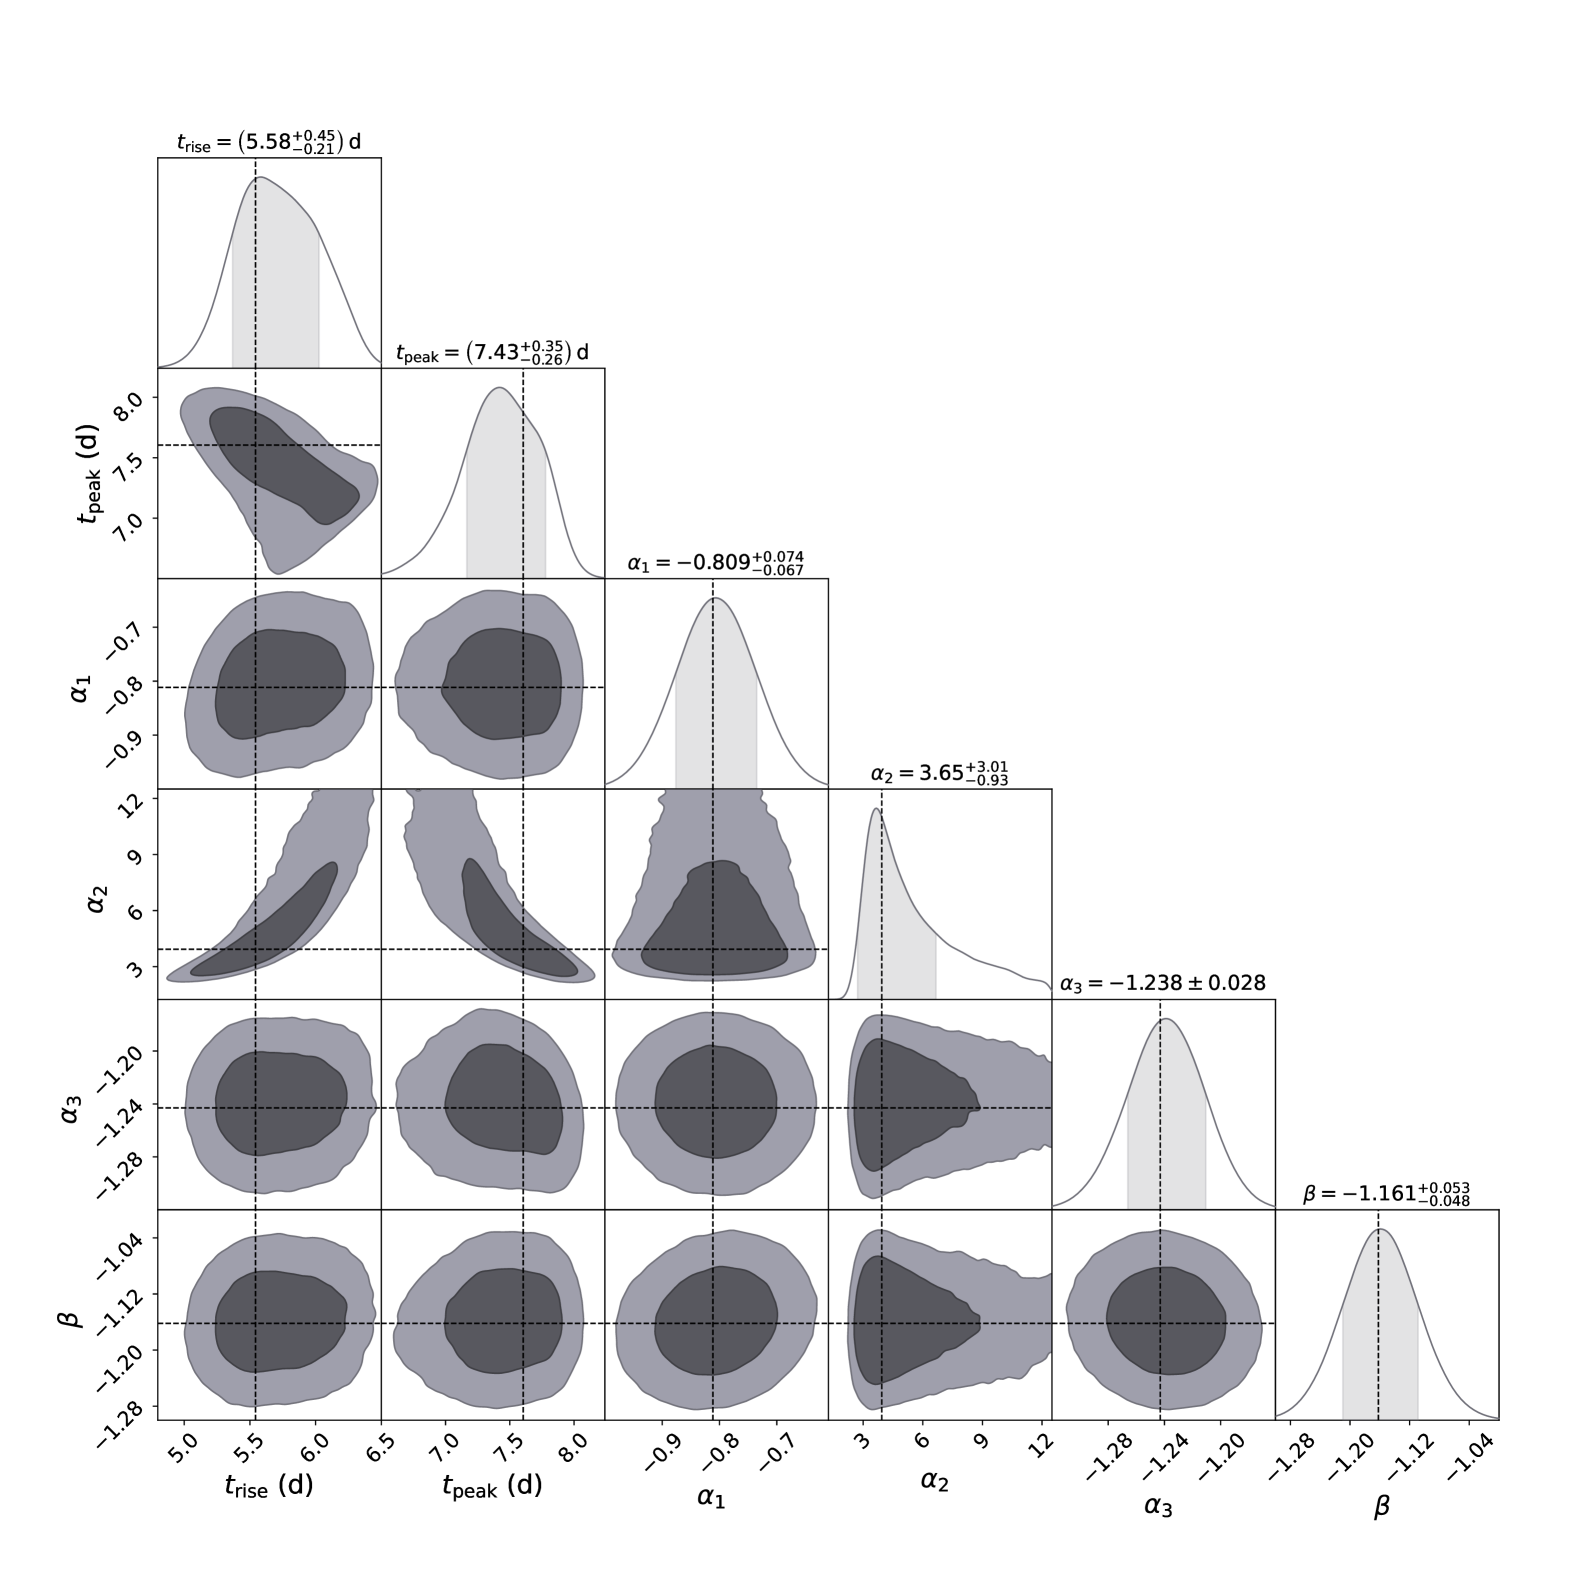
Appendix C Supernova Model Fitting
In Table 4, we display the priors used in our MOSFiT modeling (see also §4.7.1). In Table 5, the posteriors from each model fitted by MOSFiT are displayed.
| Prior | default | magni | csmni |
|---|---|---|---|
| Parameter | default | magnetar | magni | csm | csmni |
| - | - | - | |||
| - | |||||
| - | - | - | - | ||
| - | - | - | |||
| - | - | - | |||
| - | - | - | |||
| - | - | - | |||
| - | - | - | |||
| - | - | ||||