XL-Calibur measurements of polarised hard X-ray emission from the Crab
Abstract
We report measurements of the linear polarisation degree (PD) and angle (PA) for hard X-ray emission from the Crab pulsar and wind nebula. Measurements were made with the XL-Calibur (15–80 keV) balloon-borne Compton-scattering polarimeter in July 2024. The polarisation parameters are determined using a Bayesian analysis of Stokes parameters obtained from X-ray scattering angles. Well-constrained (8.5) results are obtained for the polarisation of the 19–64 keV signal integrated over all pulsar phases: PD=(25.12.9)% and PA=(129.83.2)∘. In the off-pulse (nebula-dominated) phase range, the PD is constrained at 4.5 and is compatible with the phase-integrated result. The PA of the nebular hard X-ray emission aligns with that measured by IXPE in the 2–8 keV band for the toroidal inner region of the pulsar wind nebula, where the hard X-rays predominantly originate. For the main pulsar peak, PD=(32.8)% and PA=(156.0 21.7)∘, while for the second peak (inter-pulse), PD=(0.0)% and PA=(154.5 34.5)∘. A low level of polarisation in the pulsar peaks likely does not favour emission originating from the inner regions of the pulsar magnetosphere. Discriminating between Crab pulsar emission models will require deeper observations, e.g. with a satellite-borne hard X-ray polarimeter.
keywords:
instrumentation: polarimeters – X-rays: Crab – methods: statistical1 Introduction
The Crab, comprising a rotation-powered pulsar and wind nebula (PWN), is one of the brightest persistent sources of celestial X-rays (Bühler & Blandford, 2014). The pulsar is a highly magnetised (1012 G) neutron star with a rotation period 33.8 ms. A small fraction of the rotational energy powers a relativistic leptonic wind, which illuminates the nebulous supernova remnant yielding synchrotron and inverse Compton emission across the electromagnetic spectrum (Gaensler & Slane, 2006; Hester, 2008). The Crab has been extensively studied using spectroscopy, timing and imaging, but the addition of X-ray polarimetry allows the emission to be studied in a systematically new way. The linear polarisation of the emission is described by a polarisation degree (PD, %) and a polarisation angle (PA, ∘)111All source-related angles reported in our paper are defined relative to celestial north, going anticlockwise (i.e. to the East).. In the soft X-ray band, 2–8 keV, the linear polarisation of the X-ray emission was recently measured by the IXPE satellite mission (Bucciantini et al., 2023; Wong et al., 2023; Mizuno et al., 2023; Wong et al., 2024; González-Caniulef et al., 2025). Here, we present complementary measurements in the neighbouring hard X-ray band, 19–64 keV, from the balloon-borne mission XL-Calibur.
The pulsar X-ray light-curve has two peaks, as is the case across the electromagnetic spectrum. The main pulse (P1) is separated from a second pulse (P2, also referred to as the inter-pulse) by a bridge region. The remaining off-pulse (OP) region is dominated by nebula emission. A fundamental understanding of the emission locale and field geometry for the pulsar is lacking (Harding, 2019). The evolution of PD and PA across the light curve elucidates the geometry of regions where accelerated particles dissipate their energy, e.g. potentially discriminating between emission from just inside the light cylinder and proximate to the magnetospheric current sheet (Cerutti et al., 2016; Harding & Kalapotharakos, 2017), and that outside the magnetosphere in the inner nebula (Pétri, 2013; Harding & Kalapotharakos, 2017).
Spectroscopic and spectro-polarimetric images of the Crab constrain the structure of the PWN, the process of particle acceleration at relativistic shocks, and the propagation of particles in the downstream plasma. Chandra images (Weisskopf et al., 2000) reveal complex structure in the inner nebula, including time-varying polar jets, an equatorial torus and shock structures. Two concentric magnetic tori are centred on the pulsar. The inner torus lies in a plane perpendicular to the pulsar spin-axis, which has a sky-projected angle of (124.00.1)∘ (Ng & Romani, 2004).
In a phase-resolved analysis of IXPE data (300 ks), Wong et al. (2024) revealed a +40∘ PA swing throughout P1, where the maximum PD15% is reached close to the peak phase. The phase-dependence of polarisation parameters was found to differ significantly from the optical band, indicating that different mechanisms or locations are responsible for the polarised emission in the two bands. In contrast, González-Caniulef et al. (2025) present a phenomenological model connecting the polarisation properties in the soft X-ray and optical bands. This suggests a common underlying emission mechanism for both bands.
In Bucciantini et al. (2023) (92 ks), IXPE reports PD=(19.00.2)% and PA=(145.50.3)∘ for phase-integrated emission measured within 2.5 arcmin of the pulsar. Similar off-pulse values are found for the region. The polarisation map follows expectations for synchrotron emission in the 100-150 G toroidal magnetic field estimated in Mizuno et al. (2023). Local enhancement of the PD in several regions (up to 40–50% to the north and south of the inner nebula) is attributed to variations in the amount of magnetic turbulence within the nebula. For the nebula-dominated off-pulse region measured within 20 arcsec of the pulsar, Bucciantini et al. (2023) reports PD=(24.10.8)% and PA=(133.61.0)∘. In the deeper IXPE observations reported in Wong et al. (2024), the polarisation map of the inner nebula confirms the presence of a toroidal magnetic field. A spatial correlation is found between polarisation parameters and photon spectral index, which informs the interpretation of XL-Calibur observations presented here, where the magnetic field orientations are sampled by higher-energy electrons in the inner region of the PWN.
A review of Crab polarisation measurements in the hard X-ray band is given in Chattopadhyay (2021). Results are generally weakly constrained. Hitherto, the most precise measurement was provided by PoGO+ (20–160 keV), where a phase integrated PD=(20.95.0)% and PA=(131.36.8)∘ was found (Chauvin et al., 2017). In this paper, we report XL-Calibur results in the 19–64 keV range, averaged over the full pulsar phase as well as for phase selections, including the off-pulse emission, the two pulsar peaks, and the intervening bridge region. When combined with IXPE, our results provide a broadband view of the polarisation properties of Crab X-ray emission.
2 XL-Calibur
The XL-Calibur (Abarr et al., 2021) balloon-borne polarimeter comprises a 12 m long optical bench (truss), pointed with arcsecond precision by the Wallops ArcSecond Pointer (WASP) (Stuchlik, 2017). A 45 cm diameter X-ray mirror (Tsunemi et al., 2014) is mounted at one end of the truss, with a polarimeter/anticoincidence-shield assembly at the other end. The mirror focuses X-rays by Bragg reflection from multi-layer platinum and carbon foils. With a field-of-view of 5 arcmin, the effective area is 350 cm2 at 15 keV and 50 cm2 at 60 keV. A sharp reduction at 78 keV results from the K absorption edge of platinum. The half-power diameter of the point-spread function (PSF) is 2 arcmin, reaching 7.3 mm diameter in the focal plane of the mirror. Prior to the flight, the shape of the PSF was measured at the SPring-8 synchrotron beam facility (Kamogawa et al., 2022).
Focused X-rays pass through a tungsten collimator and impinge on a beryllium (Be) rod with diameter 12 mm and length 80 mm. A fraction of incident X-rays (85% at 30 keV) will undergo Compton scattering from the Be rod into a circumadjacent assembly of 0.8 mm thick CdZnTe (CZT) detectors (each 20 mm 20 mm area, 2.5 mm pixel pitch), arranged four-high around the rod in a square geometry. The energy resolution is 5.9 keV at 40 keV (full width at half maximum). To mitigate measurement background from atmospheric X-/-rays and neutrons, the polarimeter is housed in a 3–4 cm thick Bi4Ge3O12 anticoincidence shield (Iyer et al., 2023), operated with a veto threshold of 50 keV. The polarimeter/shield assembly rotates around the viewing axis twice per minute to eliminate systematic errors arising from non-uniform CZT detector response.
The Klein-Nishina differential Compton-scattering cross-section depends on polarisation as
| (1) |
where denotes the polar scattering angle, and is the azimuthal angle between the photon scattering direction and the polarisation (electric field) vector of the incident X-ray. By reconstructing the distribution of azimuthal scattering angles, the linear polarisation of the incident beam can be estimated (Del Monte et al., 2022; Bernard et al., 2022). The resulting modulation curve, , is a harmonic function with 180∘ periodicity:
| (2) |
where and are the amplitude and phase of the modulation curve, respectively, and is the mean. The modulation response to a 100% polarised beam is , so that . Since X-rays preferentially scatter in a direction perpendicular to the orientation of the polarisation vector, .
Reconstructed polarisation parameters are subject to a systematic error arising from movement of the focal point on the Be rod during observations, e.g. due to thermal or gravitational deformation of the truss (Aoyagi et al., 2024). For in-flight monitoring of the mirror alignment, an embedded back-looking camera (BLC) is used. Prior to flight, the direction of the mirror X-ray axis was determined at ISAS/JAXA and NASA Goddard Space Flight Center. At the launch site, the polarimeter-mirror alignment was confirmed using the BLC to image parallel beams of laser light focused by the mirror. X-rays that pass the Be rod impinge an imaging CZT. The profile of the X-ray beam reconstructed in this detector is used to determine the mean scattering position within the Be rod, which defines the interaction point assumed when calculating scattering angles.
3 Observations and data analysis
XL-Calibur was launched on a 1.1 million-cubic-metre helium-filled balloon from the Esrange Space Center, Kiruna, Sweden (68.89∘N, 21.11∘E), on July 9th, 2024, at 03:04 UT. Crab observations were conducted on July 11th, 12th and 13th, at a median altitude of 39.4 km (line-of-sight column density of 5.55 g/cm2). The black-hole X-ray binary Cygnus X-1 was also observed222Publication in preparation.. The flight followed a trajectory of approximately constant latitude before termination close to Kugluktuk, Nunavut, Canada, on July 14th, 2024, at 22:34 UT.
During the commissioning phase, arcminute-level offsets were introduced to Crab pointing solutions to centre the focused X-ray beam on the Be rod, based on feedback from the imaging CZT. The resulting mean interaction-point offset, reconstructed within the perimeter of the 12 mm diameter Be rod, is (0.99, 0.21) mm (zenith, starboard) when averaged across all observations, corresponding to a net offset of 17 arcsec.
The pointing direction alternated between the Crab location (on-source observations) and background fields offset by 1∘ (off-source observations). Off-source pointings were conducted in a cross-pattern around the source, with excursions in azimuth or elevation. An on/off ratio of 25 minutes/5 minutes was employed for the majority of observations.
The X-ray interaction time in the polarimeter is determined with microsecond precision relative to GPS Universal Time using an on-board oscillator synchronised to a GPS pulse-per-second (PPS) signal. A phase-folded light-curve is obtained with a barycentre timing correction using the closest preceding ephemeris from the Jodrell Bank Observatory333https://www.jb.man.ac.uk/pulsar/crab.html (Lyne et al., 2014): June 15th 2024. Phase selections are used when determining polarisation parameters for the pulsar. The off-pulse emission is subtracted from the pulsar-peak phase range, along with measurement background. As the GPS timing system experienced thermal-management problems on July 11th and 13th, phase-dependent studies are only possible for 63% of the total signal integration-time.
Events comprising an above-threshold energy deposit (median threshold 15.4 keV, standard deviation 4.7 keV) in a single CZT pixel and no coincident activity in the shield during a 3 s window were used in the polarisation analysis. Noisy pixels were removed from the data based on measured scaler rates and inspection of pixel-by-pixel spectra, individually calibrated prior to flight using X-ray lines from a 152Eu source. To maximise the signal-to-background ratio, events with detected energy in the range 15–60 keV were kept. At lower energies, the signal rate diminishes due to atmospheric attenuation and pixel-by-pixel energy thresholds, while at higher energies the source flux drops below the background level. The selected range corresponds to 18.5–63.5 keV incident energy, after taking into account the average energy loss in the Be rod upon Compton scattering. The energy response was determined using Geant4 (Agostinelli et al., 2003) Monte-Carlo simulations (Aoyagi et al., 2024), where a Crab spectrum is generated and folded through the atmospheric attenuation and mirror response.
For each valid detector event, the azimuthal scattering angle is first transformed from the rotating polarimeter frame to the non-rotating truss reference frame. Scattering angles are then converted to a coordinate system referenced to celestial north, using the truss orientation determined by the WASP system. The focal-point offset was accounted for by assuming scattering from the day-by-day-averaged interaction point, as measured with the imaging CZT. The endpoint was randomized within the 2.5-mm width of the hit wall-CZT pixel, as described in Aoyagi et al. (2024). Resulting scattering-angle distributions are shown in Figure 1.
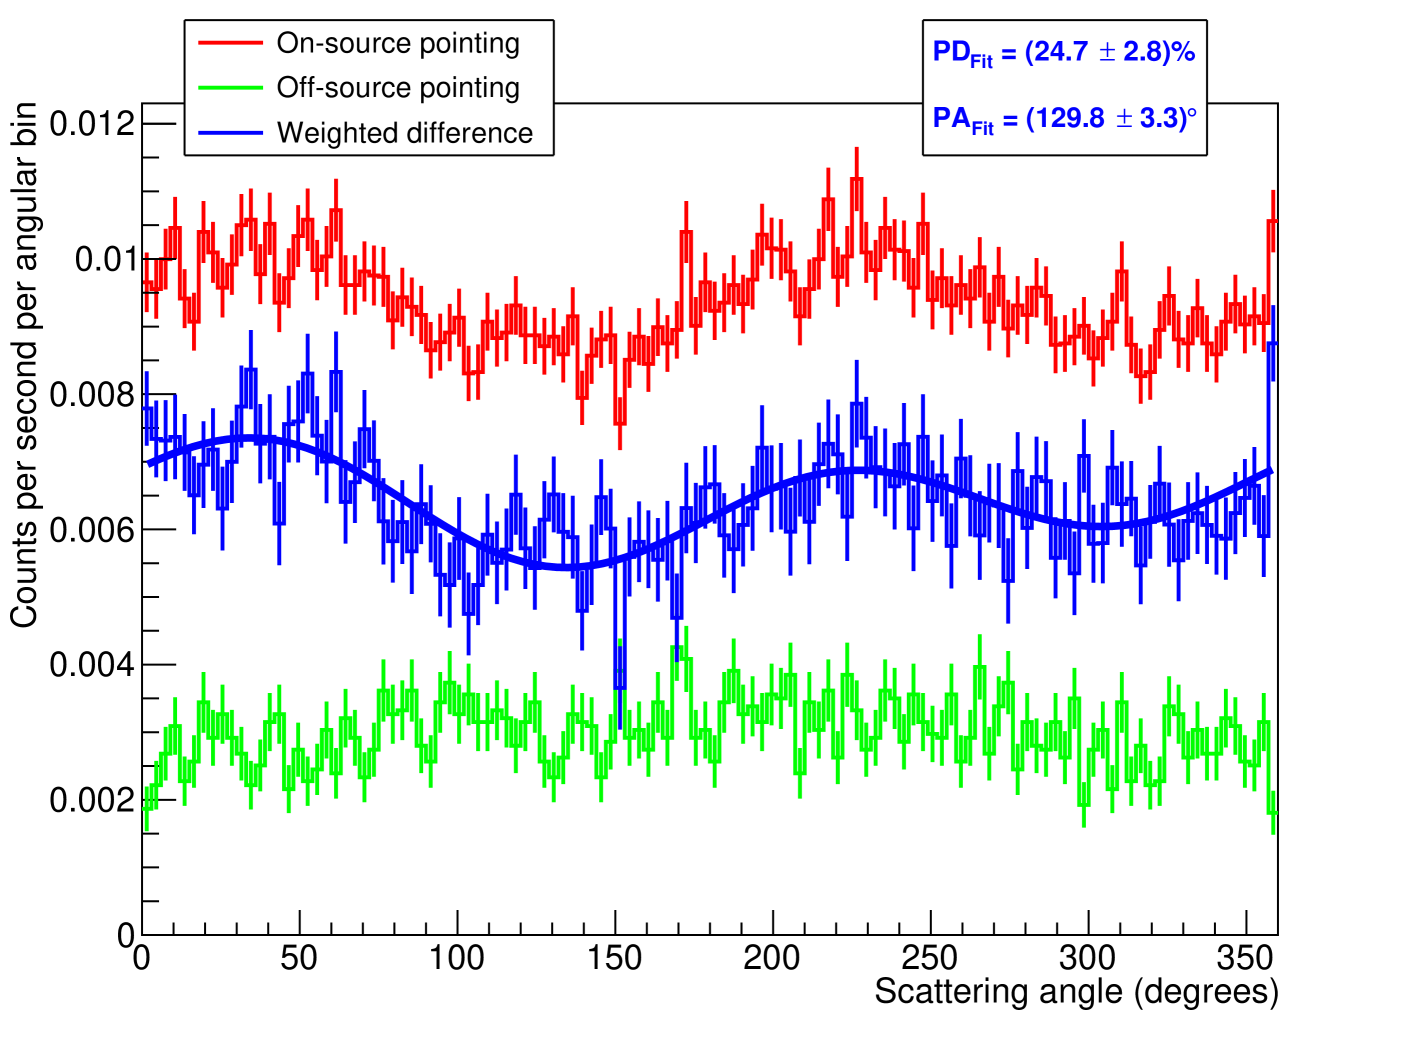
For the polarisation analysis, selected events are used to form exposure-weighted sums of intensity ()-normalised and Stokes parameters ( and ), following the procedure detailed in Kislat et al. (2015). Reconstructed Stokes parameters and additionally take the modulation response into account, e.g. . The additive nature of Stokes parameters makes it straight-forward to account for measurement backgrounds using on-source and exposure-weighted off-source observations, whereby polarisation parameters are defined as444Equation (3) is sometimes seen with an extra factor 2 (e.g., Kislat et al. (2015); Chauvin et al. (2017); Kiss & Pearce (2024)). Following Baldini et al. (2022) and Kislat & Spooner (2024), we have here absorbed the factor two into the definition of the Stokes parameters themselves.
| (3) |
| (4) |
Since PD is a positive-definite quantity, the measurement may be subject to bias (Quinn, 2012; Maier et al., 2014; Mikhalev, 2018). Equation (3) is therefore applicable only when PD MDP, i.e., when the measured polarisation degree exceeds the Minimum Detectable Polarisation (Weisskopf et al., 2010). Defined at 99% confidence level and using the formalism of Kislat et al. (2015),
| (5) |
where , and are the signal rate, background rate and observation time, respectively, and is the fraction of time spent observing off-source (background) fields. For a simulated 100% polarised Crab beam (Aoyagi et al., 2024), 0.1)%.
We use a Bayesian framework for the polarisation analysis (see examples in Chauvin et al. (2017); Abarr et al. (2020); Kiss & Pearce (2024)). The uninformative Jeffreys prior (uniform in Stokes Q and U) tends to overestimate the true PD (Maier et al., 2014). Following the reasoning in Quinn (2012), we instead assume a prior that is uniform in polar coordinates (PD, PA). Our posterior is evaluated in (PD, PA) space, as defined in Chauvin et al. (2017). The maximum a posteriori (MAP) estimate is the mode (most probable value) of the two-dimensional Bayesian posterior, and corresponds to Eq. (3) and Eq. (4). While the MAP PD is a biased estimator, marginalising over PA prevents the point-estimate for from becoming biased (Mikhalev, 2018). Our reported PD and PA values, as well as their credible regions (uncertainties) are derived by marginalization over the posterior. The Bayesian method provides asymmetric credible regions ensuring that the physical requirement PD [0, 1] is fulfilled.
4 Results
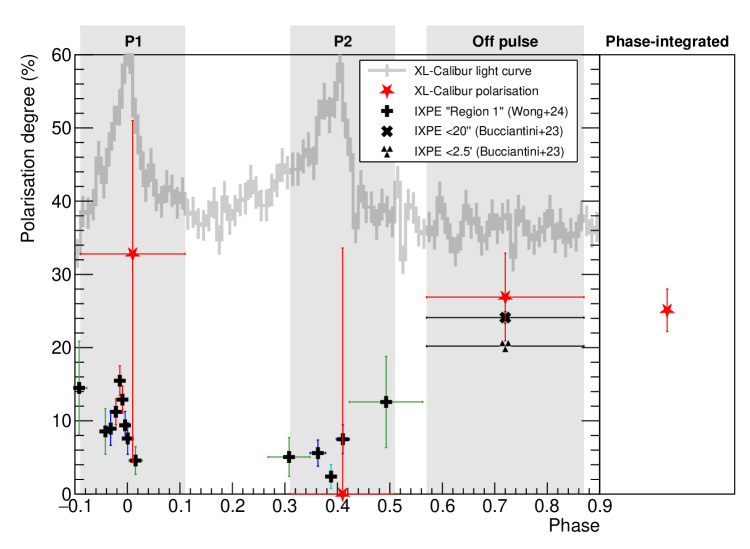
The total on-source observation time was 49.7 ks, interspersed with 17.1 ks of off-source observations. On-source rates vary depending on the Crab elevation and observing altitude, with an average of 1.1 counts per second observed, while the background rate of 0.36 counts per second remained constant during observations. The resulting mean signal-to-background ratio of 3 is 20 times higher than PoGO+ (Chauvin et al., 2017). Observation statistics are summarised in Table 1. The XL-Calibur light-curve is defined with the measured peak of P1 at phase 0. We then adopt the same phase intervals as IXPE for the off-pulse/bridge (Bucciantini et al., 2023) and P1/P2 (Wong et al., 2024). Marginalised polarisation parameters are shown superimposed on the measured pulsar light-curve in Figure 2. The pulsed fraction is (14.61.0)%, matching Eckert et al. (2010). Results are summarised in Table 2.
| Observation | Phase range | Detected events | Exposure (s) | Remarks |
|---|---|---|---|---|
| Full Crab on-source dataset | N/A | 56054 | 49716 | No requirement on PPS timing |
| Crab on-source with PPS timing | to | 34523 | 31273 | Subset of preceding entry |
| Off-pulse region | to | 9280 | 9382 | Interval from Bucciantini et al. (2023) |
| Bridge region | to | 6690 | 6255 | Interval from Bucciantini et al. (2023) |
| P1 ("main pulse") | to | 7686 | 6255 | Interval from Wong et al. (2024) |
| P2 ("inter-pulse") | to | 7673 | 6255 | Interval from Wong et al. (2024) |
| Crab off-source (background) dataset | N/A | 6162 | 17144 | No requirement on PPS timing |
| Phase | MAP (%, ∘) | PD (%) | PA (∘) | MDP (%) | ||
|---|---|---|---|---|---|---|
| Full Crab on-source dataset | -0.045 0.017 | -0.249 0.017 | (25.3, 129.8) | 25.1 2.9 | 129.8 3.2 | 8.7 |
| Crab on-source with PPS timing | -0.065 0.022 | -0.277 0.022 | (28.5, 128.4) | 28.3 3.4 | 128.4 3.4 | 10 |
| Off-pulse region ("nebula") | -0.099 0.043 | -0.257 0.043 | (27.5, 124.5) | 26.9 6.0 | 124.5 6.4 | 18 |
| Bridge region | -0.006 0.050 | -0.267 0.050 | (26.7, 134.4) | 25.9 6.6 | 134.4 7.3 | 20 |
| P1 ("main pulse") | 0.290 0.086 | -0.322 0.086 | (43.3, 156.0) | 32.8 | 156.0 21.7 | 73 |
| P2 ("inter-pulse") | 0.178 0.086 | -0.219 0.086 | (28.2, 154.5) | 0.0 | 154.5 34.5 | 74 |
The PD is constrained at 1 level for P1. For P2, the marginalised PD peaks at 0%. Upper limits at 99% Confidence Level are 90.1% and 78.5%, respectively. As shown in Figure 2, our observations are in line with IXPE, where (in the lower 2–8 keV band) the overall PD level for P1 appears to be higher than P2 (Wong et al., 2024).
XL-Calibur measures the polarisation of the phase-averaged and off-pulse emissions with high statistical significances of 8.6 and 4.5, respectively. The two results are compatible within the statistical accuracy of the measurements, as expected if the overall pulsar contribution is only weakly polarised. We do not find evidence for a change of the PD and PA between 15–31 keV and 31–60 keV (Table 3). Our phase-averaged results for PD and PA are compatible with PoGO+ observations conducted in 2016 (Chauvin et al., 2017). This may indicate that the overall magnetic configuration of the inner emission region was similar when the two observations were made. Between these measurements, an excursion in soft X-ray on-pulse PD was reported by PolarLight (3.0–4.5 keV) (Feng et al., 2020; Long et al., 2021).
| Energy (keV) | Nsignal | PD (%) | PA (∘) | MDP (%) |
|---|---|---|---|---|
| 19405 | 24.2 3.9 | 128.3 4.5 | 11.6 | |
| 18779 | 28.0 4.3 | 128.3 4.3 | 13.0 |
5 Discussion
By combining a large-area X-ray mirror with a compact and well-shielded polarimeter, XL-Calibur measures the polarisation of the 19–64 keV X-ray emission of the Crab pulsar and PWN with unprecedented sensitivity. The systematic error on our measurements stems from (i) the focal-point offset correction, (ii) the uncertainty on , and (iii) background subtraction. For (i), with no offset correction applied, the PD only changes by 0.7 percentage points. Since the uncertainty on from simulations is negligible, (ii) is dictated by knowledge of the PSF. For two independent PSF measurements, the simulated varies by only 0.2 percentage points. The systematic error arising from background subtraction (iii) is minimal since signal and background observations are interspersed. We therefore expect the overall systematic error to be significantly smaller than the statistical error.
Our observations indicate a low level of polarisation when integrating across the pulsar peaks. As noted in Bucciantini et al. (2023), this contrasts with many inner magnetospheric models, where high-energy emission arises from accelerated particles emitting synchrotron emission within plasma-starved gaps in the magnetosphere. In the striped-wind picture of Pétri (2013), emission outside the light cylinder (LC) generates strong reductions in the PD at and following each pulse peak. The plasma simulations of Cerutti et al. (2016) at the current sheet inside the LC display a modest anti-correlation between PD and intensity, and can have large variations in PA. For a force-free magnetic geometry, Harding & Kalapotharakos (2017) demonstrate that synchrotron radiation from regions just outside the LC exhibit PDs at the measured levels, however the accompanying PA variations at various phases are strong. Higher-significance PD measurements within the pulsar peaks are required to discriminate between these various scenarios.
For XL-Calibur this is not a straight-forward proposition. Even when assuming fully efficient observations with purely on-source pointing during a week-long flight555This is currently the maximum observation time for high-latitude balloon missions observing the northern sky., MDP20% is expected when integrating across P1 or P2. To accurately track the phase-dependence of polarisation parameters, the MDP must be improved by an order of magnitude. Further reducing the already low measurement background is not a feasible approach. The signal rate can be enhanced by increasing the effective area of the X-ray mirror. To be practical, this would require multiple mirror assemblies – a significant engineering challenge, since XL-Calibur is already close to the payload mass-limit for the current balloon. Work is in progress to allow phase-folding of data from July 11th and 13th when GPS timing was unavailable. While this may lead to a modest reduction in the PD uncertainty for the pulsar peaks, our overall conclusions will not be affected.
A comparison to previous phase-integrated X-/-ray measurements is shown in Figure 3.
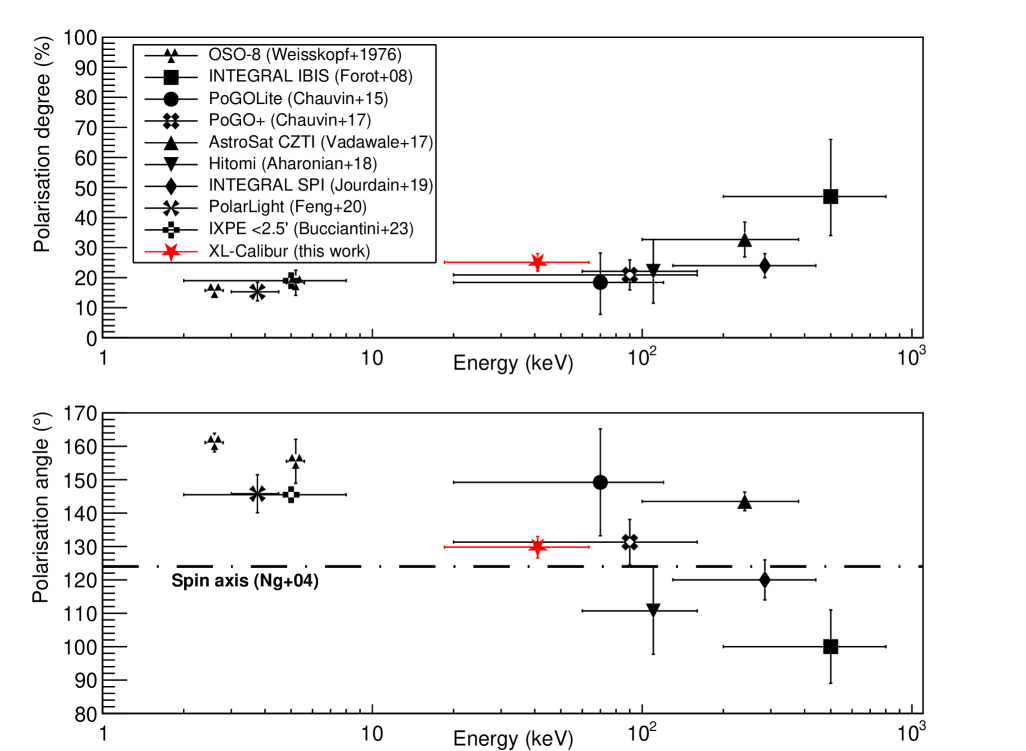
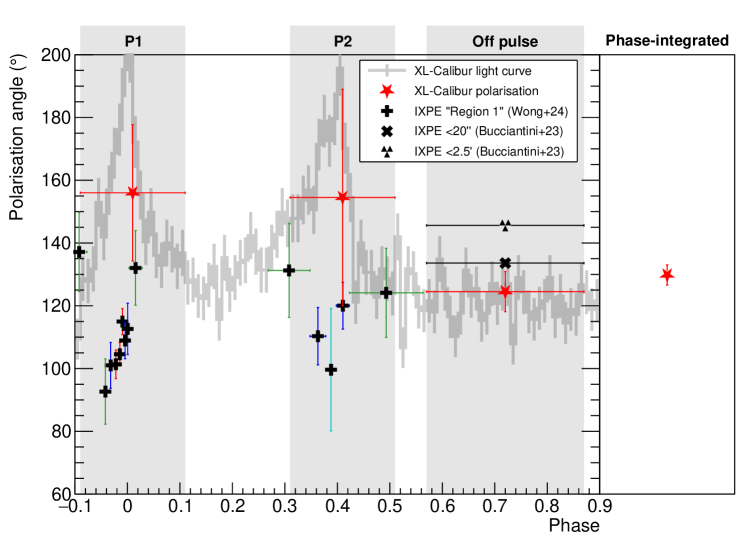
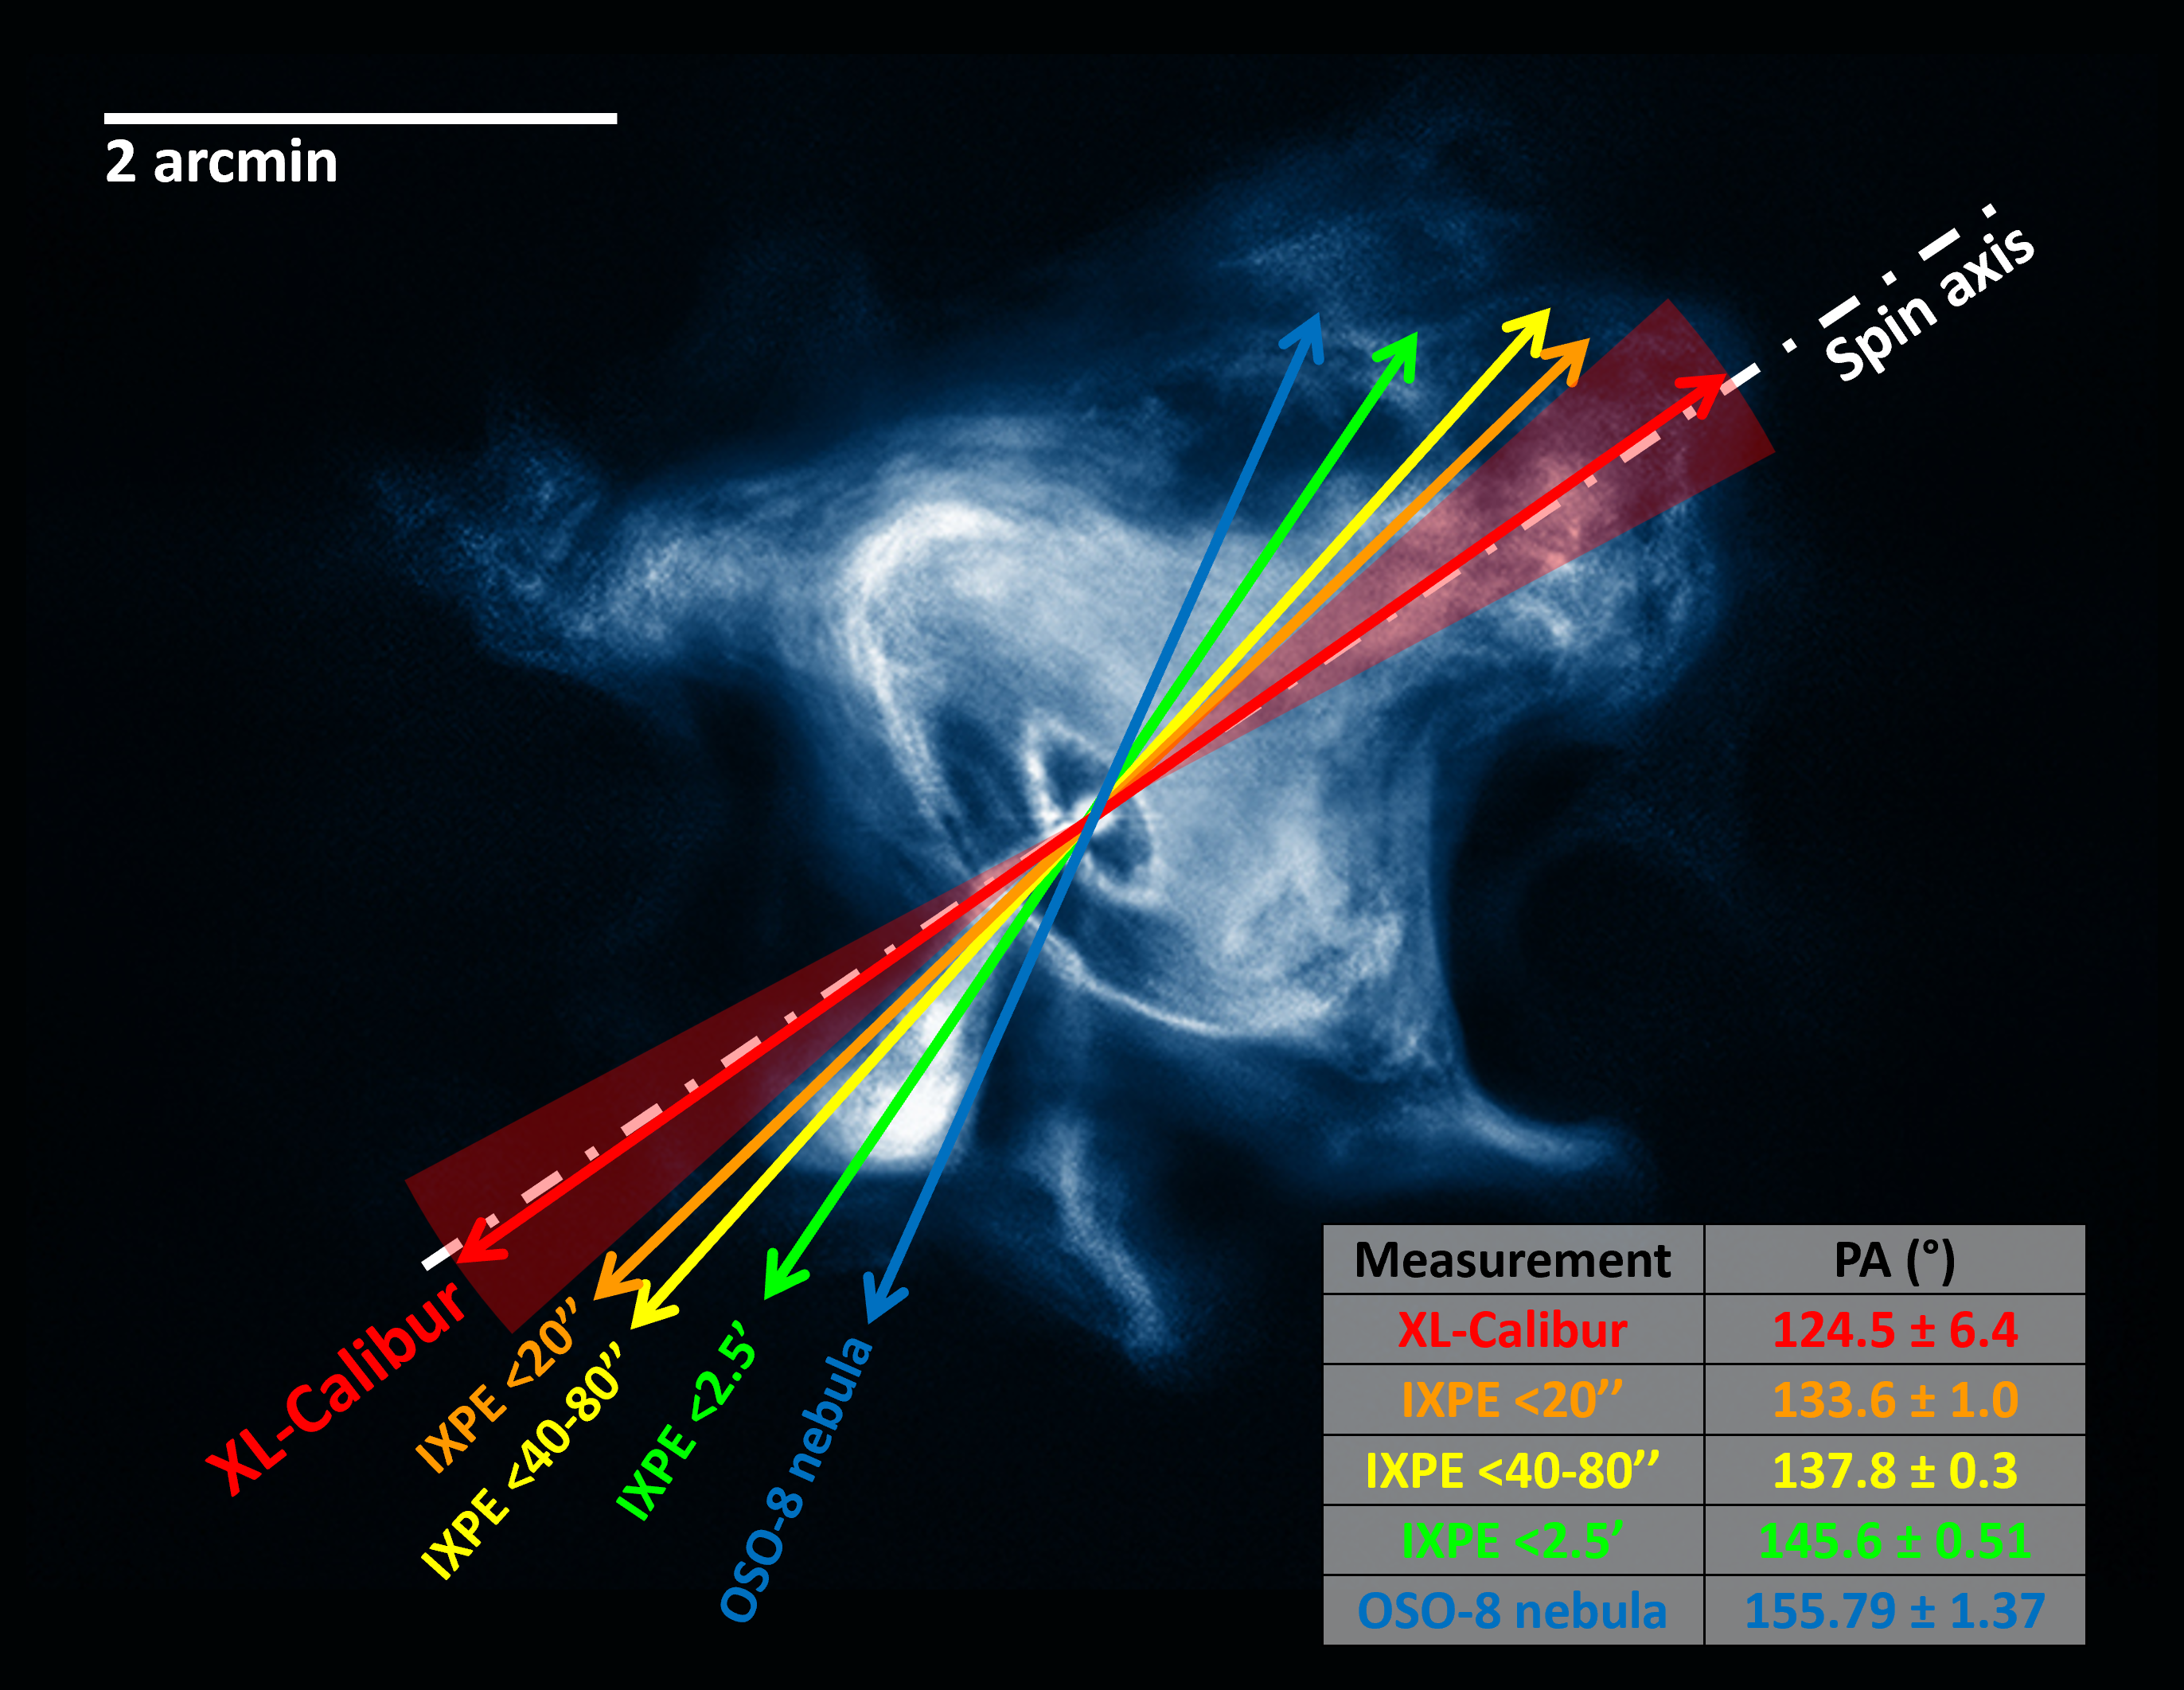
Our phase-averaged PD=(25.12.9)% and PA=(129.83.2)∘ differ from the PD=(19.00.19)% and PA=(145.50.3)∘ measured by IXPE within 2.5 arcmin of the pulsar (Bucciantini et al., 2023). While the regions viewed by both missions are comparable, the higher energy band of XL-Calibur (19–64 keV) compared to IXPE (2–8 keV) means that the emission originates closer to the central toroidal region of the PWN, since the synchrotron radiative lifetime for outflowing electrons is inversely proportional to energy. This is shown by NuSTAR, where 3–8 keV observations reveal inner nebula emission from a larger region (7540 arcsec) than at 20–80 keV (6025 arcsec) (Madsen et al., 2015). Hitomi HXT, 15–70 keV, confirms this trend (Morii et al., 2024). We note that IXPE off-pulse measurements for (i) an elliptical region extending 80 arcsec (40 arcsec) along the toroidal (jet) axis (Wong et al., 2024), referred to as "Region 1", and (ii) within 20 arcsec of the pulsar (Bucciantini et al., 2023), are more compatible with XL-Calibur off-pulse results. This is illustrated in Figure 4, showing that the XL-Calibur PA is aligned with the pulsar spin axis, indicating that the harder X-rays measured by XL-Calibur are dominated by the central region of the PWN. For OSO-8 measurements encompassing the full nebula (Weisskopf et al., 1978), the PA (155.791.37)∘ at 2.6 keV and 5.2 keV combined lies even further away from the XL-Calibur PA.
As discussed by Madsen et al. (2015), the imaging-spectroscopic NuSTAR observations of the Crab PWN are compatible with downstream leptons propagating sub-relativistically mostly through advection (Kennel & Coroniti, 1984a, b) rather than through diffusion (Gratton, 1972; Wilson & Shakeshaft, 1972). Detailed 3D modeling of the combined Chandra, IXPE, NuSTAR and XL-Calibur data with magnetohydrodynamics (e.g. Porth et al. (2013)) and Particle in Cell (e.g. Cerutti & Giacinti (2021)) codes is outside of the scope of this paper but could give new constraints on the structure of PWN, and their relativistic shocks, for the Crab and more generally.
Acknowledgements
XL-Calibur is funded in the US by the NASA APRA (Astrophysics Research and Analysis) program through grants 80NSSC20K0329 and 80NSSC24K0205. FK acknowledges funding from NASA ADAP award 80NSSC24K0636 and NASA IXPE GO Cycle 1 award 80NSSC24K1762. The Japanese Society for the Promotion of Science (JSPS) has supported this work through KAKENHI Grant Numbers 19H01908, 19H05609, 20H00175 (HM), 20H00178 (HM), 21K13946 (YU), 22H01277 (YM), 23H00117 and 23H00128 (HM). KTH authors are supported by the Swedish National Space Agency (2022-00178). MP also acknowledges funding from the Swedish Research Council (2021-05128). We thank the NASA-WASP team for campaign support and pointing operations. We are very grateful to colleagues at NASA-CSBF and Esrange Space Center who provided balloon launch, operations and recovery services. H. Tsunemi and A. Furuzawa are thanked for their role in the construction of the mirror. T. Enoto, Y. Fukazawa, S. Gunji, T. Mizuno and Y. Saito are thanked for advice and discussions. M. Aoyagi, K. Ishiwata, W. Kamogawa, H. Matake, N. Sakamoto are thanked for work on previous mirror calibration activities. J. Wong is thanked for providing tabulated IXPE results for reference. No AI was used in the data analysis presented here, nor for the writing of this paper.
Data Availability
The XL-Calibur data underlying this article will be made available via the NASA HEASARC data archive, at https://heasarc.gsfc.nasa.gov/docs/xlcalibur/.
References
- Abarr et al. (2020) Abarr Q., et al., 2020, The Astrophysical Journal, 891, 70
- Abarr et al. (2021) Abarr Q., et al., 2021, Astroparticle Physics, 126, 102529
- Agostinelli et al. (2003) Agostinelli S., et al., 2003, Nuclear Instruments and Methods in Physics Research Section A: Accelerators, Spectrometers, Detectors and Associated Equipment, 506, 250
- Aharonian et al. (2018) Aharonian F., et al., 2018, Publications of the Astronomical Society of Japan, 70, 113
- Aoyagi et al. (2024) Aoyagi M., et al., 2024, Astroparticle Physics, 158, 102944
- Baldini et al. (2022) Baldini L., et al., 2022, SoftwareX, 19, 101194
- Bernard et al. (2022) Bernard D., Chattopadhyay T., Kislat F., Produit N., 2022, in Bambi C., Santangelo A., eds, , Handbook of X-ray and Gamma-ray Astrophysics. Springer Nature Singapore, Singapore, pp 1–42, doi:10.1007/978-981-16-4544-0_52-1, https://doi.org/10.1007/978-981-16-4544-0_52-1
- Bucciantini et al. (2023) Bucciantini N., et al., 2023, Nature Astronomy, 7, 602
- Bühler & Blandford (2014) Bühler R., Blandford R., 2014, Reports on Progress in Physics, 77, 066901
- Cerutti & Giacinti (2021) Cerutti B., Giacinti G., 2021, Astronomy & Astrophysics, 656, A91
- Cerutti et al. (2016) Cerutti B., Mortier J., Philippov A. A., 2016, Monthly Notices of the Royal Astronomical Society: Letters, 463, L89
- Chattopadhyay (2021) Chattopadhyay T., 2021, Journal of Astrophysics and Astronomy, 42, 106
- Chauvin et al. (2015) Chauvin M., et al., 2015, Monthly Notices of the Royal Astronomical Society: Letters, 456, L84
- Chauvin et al. (2017) Chauvin M., et al., 2017, Scientific Reports, 7, 7816
- Del Monte et al. (2022) Del Monte E., Fabiani S., Pearce M., 2022, in Bambi C., Santangelo A., eds, , Handbook of X-ray and Gamma-ray Astrophysics. Springer Nature Singapore, Singapore, pp 1–42, doi:10.1007/978-981-16-4544-0_27-1, https://doi.org/10.1007/978-981-16-4544-0_27-1
- Eckert et al. (2010) Eckert D., Savchenko V., Produit N., Ferrigno C., 2010, Astronomy & Astrophysics, 509, A33
- Feng et al. (2020) Feng H., et al., 2020, Nature Astronomy, 4, 511
- Forot et al. (2008) Forot M., Laurent P., Grenier I., Gouiffès C., Lebrun F., 2008, The Astrophysical Journal, 688, L29
- Gaensler & Slane (2006) Gaensler B. M., Slane P. O., 2006, Annual Review of Astronomy and Astrophysics, 44, 17
- González-Caniulef et al. (2025) González-Caniulef D., Heyl J., Fabiani S., Soffitta P., Costa E., Bucciantini N., Kirmizibayrak D., Xie F., 2025, A&A, 693, A152
- Gratton (1972) Gratton L., 1972, Astrophysics and Space Science, 16, 81
- Harding (2019) Harding A. K., 2019, in Mignani R., Shearer A., Słowikowska A., Zane S., eds, , Astronomical Polarisation from the Infrared to Gamma Rays. Springer International Publishing, Cham, pp 277–299, doi:10.1007/978-3-030-19715-5_11, https://doi.org/10.1007/978-3-030-19715-5_11
- Harding & Kalapotharakos (2017) Harding A. K., Kalapotharakos C., 2017, The Astrophysical Journal, 840, 73
- Hester (2008) Hester J. J., 2008, Annual Review of Astronomy & Astrophysics, 46, 127
- Iyer et al. (2023) Iyer N., et al., 2023, Nuclear Instruments and Methods in Physics Research Section A: Accelerators, Spectrometers, Detectors and Associated Equipment, 1048, 167975
- Jourdain & Roques (2019) Jourdain E., Roques J.-P., 2019, The Astrophysical Journal, 882, 129
- Kamogawa et al. (2022) Kamogawa W., et al., 2022, Space Telescopes and Instrumentation 2022: Ultraviolet to Gamma Ray, 12181, 164
- Kennel & Coroniti (1984a) Kennel C. F., Coroniti F. V., 1984a, The Astrophysical Journal, 283, 694
- Kennel & Coroniti (1984b) Kennel C. F., Coroniti F. V., 1984b, The Astrophysical Journal, 283, 710
- Kislat & Spooner (2024) Kislat F., Spooner S., 2024, in Bambi C., Santangelo A., eds, , Handbook of X-ray and Gamma-ray Astrophysics. Springer Nature Singapore, Singapore, pp 5853–5869, doi:10.1007/978-981-19-6960-7_146, https://doi.org/10.1007/978-981-19-6960-7_146
- Kislat et al. (2015) Kislat F., Clark B., Beilicke M., Krawczynski H., 2015, Astroparticle Physics, 68, 45
- Kiss & Pearce (2024) Kiss M., Pearce M., 2024, in Bambi C., Santangelo A., eds, , Handbook of X-ray and Gamma-ray Astrophysics. Springer Nature Singapore, Singapore, pp 5683–5716, doi:10.1007/978-981-19-6960-7_141, https://doi.org/10.1007/978-981-19-6960-7_141
- Long et al. (2021) Long X., et al., 2021, The Astrophysical Journal Letters, 912, L28
- Lyne et al. (2014) Lyne A. G., Jordan C. A., Graham-Smith F., Espinoza C. M., Stappers B. W., Weltevrede P., 2014, Monthly Notices of the Royal Astronomical Society, 446, 857
- Madsen et al. (2015) Madsen K. K., et al., 2015, The Astrophysical Journal, 801, 66
- Maier et al. (2014) Maier D., Tenzer C., Santangelo A., 2014, Publications of the Astronomical Society of the Pacific, 126, 459
- Mikhalev (2018) Mikhalev V., 2018, Astronomy & Astrophysics, 615, A54
- Mizuno et al. (2023) Mizuno T., Ohno H., Watanabe E., Bucciantini N., Gunji S., Shibata S., Slane P., Weisskopf M. C., 2023, Publications of the Astronomical Society of Japan, 75, 1298
- Morii et al. (2024) Morii M., Maeda Y., Awaki H., Hagino K., Ishida M., Mori K., 2024, Publications of the Astronomical Society of Japan, 76, 272
- Ng & Romani (2004) Ng C.-Y., Romani R. W., 2004, The Astrophysical Journal, 601, 479
- Porth et al. (2013) Porth O., Komissarov S. S., Keppens R., 2013, Monthly Notices of the Royal Astronomical Society, 438, 278
- Pétri (2013) Pétri J., 2013, Monthly Notices of the Royal Astronomical Society, 434, 2636
- Quinn (2012) Quinn J. L., 2012, Astronomy & Astrophysics, 538, A65
- Stuchlik (2017) Stuchlik D., 2017, The NASA Wallops Arc-Second Pointer (WASP) System for Precision Pointing of Scientific Balloon Instruments and Telescopes. American Institute of Aeronautics and Astronautics (https://arc.aiaa.org/doi/pdf/10.2514/6.2017-3609), doi:10.2514/6.2017-3609, https://arc.aiaa.org/doi/abs/10.2514/6.2017-3609
- Tsunemi et al. (2014) Tsunemi H., et al., 2014, Space Telescopes and Instrumentation 2014: Ultraviolet to Gamma Ray, pp 91442R–91442R–11
- Vadawale et al. (2017) Vadawale S. V., et al., 2017, Nature Astronomy, pp 1 – 6
- Weisskopf et al. (1976) Weisskopf M., Cohen G., Kestenbaum H., Long K., Novick R., Wolff R., 1976, Astrophysical Journal, vol. 208, Sept. 15, 1976, pt. 2, p. L125-L128., 208, L125
- Weisskopf et al. (1978) Weisskopf M., Silver E., Kestenbaum H., Long K., Novick R., 1978, Astrophysical Journal, Part 2-Letters to the Editor, vol. 220, Mar. 15, 1978, p. L117-L121., 220, L117
- Weisskopf et al. (2000) Weisskopf M. C., et al., 2000, The Astrophysical Journal Letters, 536, L81
- Weisskopf et al. (2010) Weisskopf M. C., Elsner R. F., O’Dell S. L., 2010, in Space Telescopes and Instrumentation 2010: Ultraviolet to Gamma Ray. pp 98–102
- Wilson & Shakeshaft (1972) Wilson A. S., Shakeshaft J. R., 1972, Monthly Notices of the Royal Astronomical Society, 160, 355
- Wong et al. (2023) Wong J., Romani R. W., Dinsmore J. T., 2023, The Astrophysical Journal, 953, 28
- Wong et al. (2024) Wong J., et al., 2024, Analysis of Crab X-ray Polarization using Deeper IXPE Observations (arXiv:2407.12779), https://arxiv.org/abs/2407.12779