Large-area Tomographic Tactile Skin with Air Pressure Sensing for Improved Force Estimation
Abstract
This paper presents a dual-channel tactile skin that integrates Electrical Impedance Tomography (EIT) with air pressure sensing to achieve accurate multi-contact force detection. The EIT layer provides spatial contact information, while the air pressure sensor delivers precise total force measurement. Our framework combines these complementary modalities through: deep learning-based EIT image reconstruction, contact area segmentation, and force allocation based on relative conductivity intensities from EIT. The experiments demonstrated 15.1% average force estimation error in single-contact scenarios and 20.1% in multi-contact scenarios without extensive calibration data requirements. This approach effectively addresses the challenge of simultaneously localizing and quantifying multiple contact forces without requiring complex external calibration setups, paving the way for practical and scalable soft robotic skin applications.
I INTRODUCTION
Large-area tactile sensors have emerged as a promising research topic due to their potential to enhance both robot’s and human user’s safety in dynamic environments [1, 2, 3, 4]. Seamlessly covering a robot’s complex and three-dimensional body surfaces is required to perceive contact positions and forces over the complete body. To handle this nontrivial problem, multiple arrays of sensors have been commonly suggested [5, 6]. However, these approaches deploy a large number of sensing modules, which can increase manufacturing costs and compromise the sensors’ flexibility and stretchability.
To address these limitations, reconstruction-based methods such as electrical impedance tomography (EIT) have emerged as a promising alternative. EIT-based tactile sensors reconstruct pressure-induced conductivity distributions of a large sensing area using a few electrodes. This approach offers a stretchable, cost-effective, and feasible solution for large-area tactile sensing [7, 8, 9]. Despite these advantages, EIT-based tactile sensors have few challenges related to the non-uniform sensitivity distribution [10], which is mainly caused by the electric field’s electrode placement dependency [11] and measurement noise and model inaccuracy susceptibility [12].
As the non-uniform sensitivity directly impacts the sensor’s contact force and location estimation, it has been studied by several researchers by using reliable ground-truth contact data for improving physics-based model calibration or as training data for machine learning. Lee et al. [13] introduced a single-point indentation testbed to obtain a coefficient field. This coefficient field was then used to calibrate the conductivity image into a pressure field, ensuring approximately constant sensitivity across all locations and thereby improving force detection accuracy. Later, they developed a sophisticated multi-point indenter and sim-to-real transfer learning pipeline for multi-contact prediction [12]. Chen and Liu leveraged the symmetry of the sensor structure [10]. They proposed the intensity scaling method to correct reconstructed conductivity magnitudes, achieving a more uniform sensitivity distribution. Similarly, Chen et al. [14] introduced a pseudo-array method based on single-contact experiment data. This approach equally divided the EIT-based sensor’s surface into a pseudo-array unit, obtained a force-to-conductivity mapping relationship for each unit, and developed the Jacobian vector correction method, which enabled near-uniform sensitivity across the sensing area without extensive calibration data [15]; however, their work was limited to single-point contact force detection.
All the aforementioned EIT-based tactile sensors require additional calibration apparatus to obtain ground truth contact locations and force magnitudes, such as an XYZ stage or a motion capture device with a loadcell, even multi-point indenter systems. The use of these apparatuses hinders the real-world application of the above methods because the contact experiment is cumbersome, time-consuming, and difficult to scale, especially when the robot skin consistently deforms or is installed on complex robot body surfaces where data collection system cannot reach.
Integrating additional modalities or force measurement channels can be a good option to avoid this calibration challenge. Chen et al. [16] introduced a multimodal EIT sensor system with two stacked EIT layers: one layer with a spacer mesh to control pressure estimation sensitivity, and another layer for the structural modality sensing, which provides contact geometric information. In this way, one sensor could complement another. Although this approach is inspiring, it still requires two layers of EIT sensors that complicate sensor design. As a practical alternative, a soft pneumatic sensor introduced by Park et al. [17] can be used to provide nearly ground-truth contact force while preventing design complications.
Reliable sensing of pressure or force magnitude is key in some application areas, such as safe human-robot collaboration. Air pressure sensors like AIRSKIN are being deployed on industrial robots, making them collaborative (see [18] for an empirical assessment of the effects), and it is possible to acquire the necessary safety ratings.
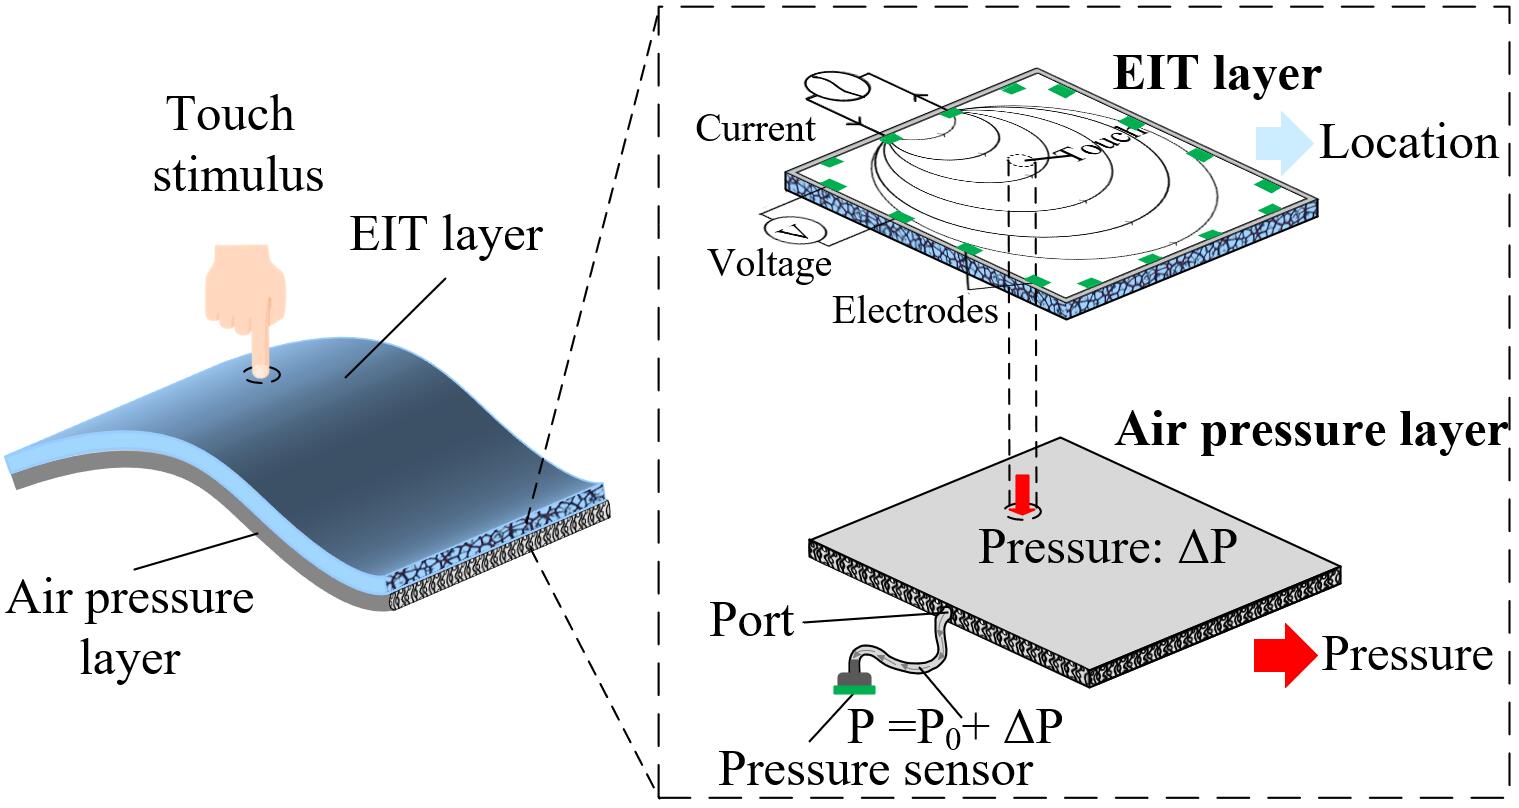
In this work, we propose a multi-channel sensor system that integrates an air pressure sensing layer into an EIT sensor, as shown in Figure 1 and its reconstruction framework to enhance contact force estimation. This hybrid design leverages the complementary strengths of both sensing modalities: the EIT sensor offers the possibility of multiple contact localization, and the soft pneumatic sensor provides accurate total external contact force estimation, replacing impractical external calibration setups.
II Sensor System Design
The design of the EIT sensing layer and air pressure sensing layer are mostly adopted from Chen et al.’s work [19] and Park et al.’s work [17], respectively. Since the details about each sensor’s fabrication, electronics, material characteristics, and signal processing can be found in the literature, this section focuses on the integration of the two sensors in hardware design.
II-A Dual-channel Tactile Skin
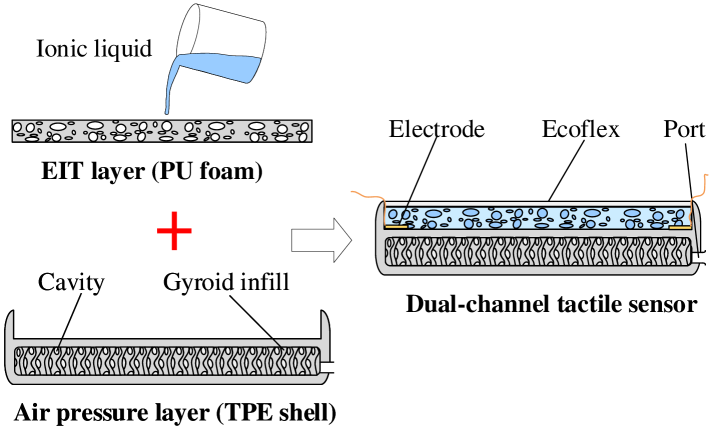
In order to make the dual-channel tactile skin, the air-pressure sensing layer and the EIT layer are fabricated separately. The EIT layer is then integrated into the air-pressure sensing layer that has a slot for encapsulation, as illustrated in the Figure 2.
II-A1 EIT layer
The EIT layer, which estimates pressure-induced conductivity distribution, is made of a porous structure and ionic liquid [19]. The porous structure is polyurethane (PU) foam made by the foaming method. On the boundary of the PU foam, sixteen electrodes that are made of silver tape are attached. These electrodes are used to inject an alternating current of 40 kHz and measure voltages. The PU foam has a square shape with a length of 100 mm and a thickness of 5 mm, and the electrodes have a 5 mm length with 25 mm apart one another.
After the PU foam is made, ionic liquid is poured into the foam. The ionic liquid is saline water with 125-300 S/cm conductivity. To prevent evaporation of the liquid, an additional elastomer (Ecoflex 00-30, Smooth-On, USA) is then placed to seal the PU foam.
The local impedance change is measured by the well-established EIT technique. A customized EIT acquisition board is utilized, featuring 16 electrodes, 4 analog multiplexers (ADG706), an AD5940 impedance measurement integrated circuit (IC), and an STM32 microcontroller unit (MCU). The AD5940 is responsible for current injection and voltage measurement. The multiplexers enable sequential electrode addressing, while the MCU controls the multiplexers, coordinates the AD5940, and transfers data to a computer. Data acquisition follows a two-terminal scheme, where current injection and voltage measurement are performed simultaneously at each electrode pair. With 16 electrodes, voltage data between all pairs are measured sequentially without repetition, generating 120 independent values per frame. The details of the circuitry are explained in the literature [19].
II-A2 Air pressure sensing layer
The air pressure sensing layer is created using Fused Filament Fabrication with thermoplastic elastomer (TPE) filament (RUBBERJet-TPE 32, Filament PM, Czech Republic) with a shore hardness of 81A. The air cavity dimensions are 100 100 5 , with a shell thickness of 1 and an infill gyroid pattern density of 5.
The TPE-based shell has a hole which is connected to the air pressure sensor (XGZP6847A005KPG, CFSensor, China) through a pneumatic tube. As the measurement of the air pressure sensor is known to be proportional to the external contact force in isothermal case [17], its accurate relationship was determined from indentation experiment. The air pressure sensing layer is pressed with an indenter with a load cell to provide ground-truth contact force.
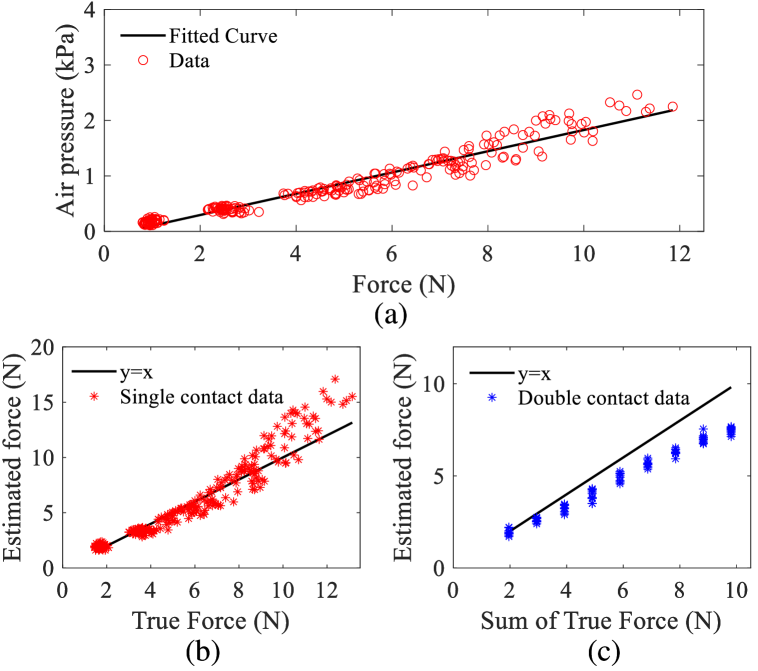
To generalize the relationship across the sensing area, 245 contact points on the entire sensing surface are pressed with a randomly chosen contact force between 1 to 12 . Figure 3 (a) shows the result of the indentation experiment, showing an approximately linear relationship. We regressed a linear curve converting the air pressure sensor’s value into external contact force using the following equation:
| (1) |
where represents the change in pressure, denotes the applied force, and the coefficients and were determined to be 0.192 and -0.088 respectively (r=0.94).
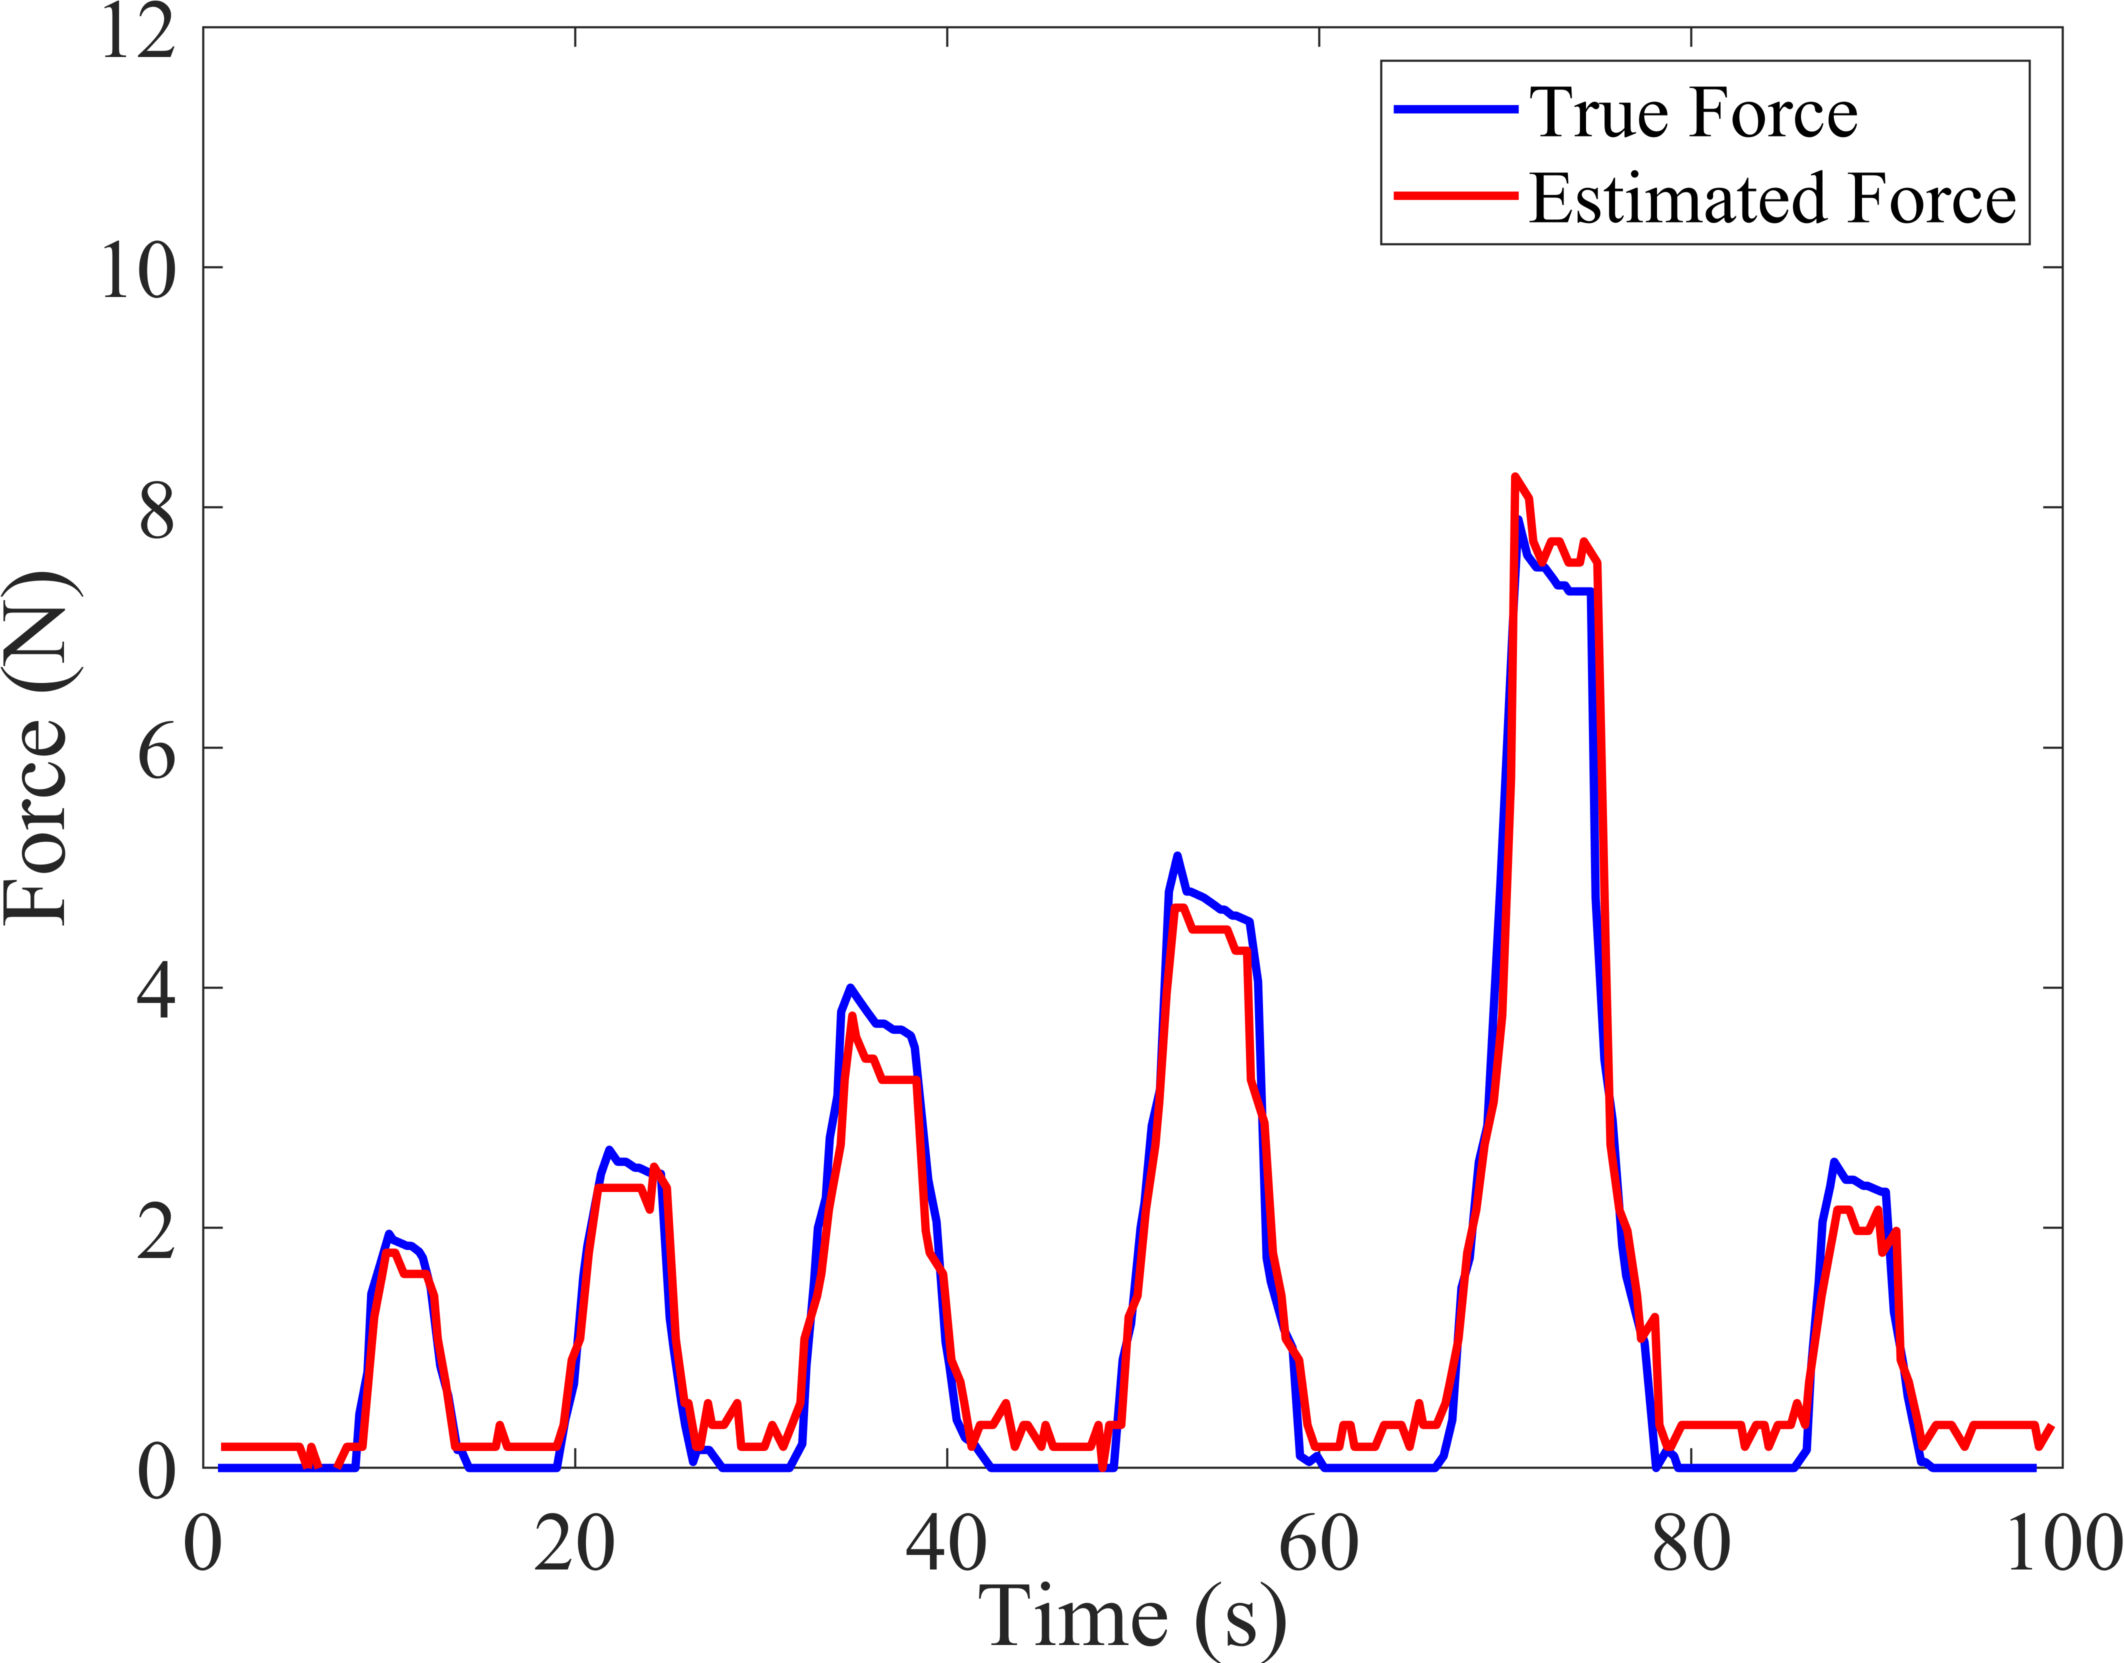
As a validation, external contact force was estimated from the air pressure sensor’s output value. Figure 3(b) shows external contact force estimation of single-point contacts. The estimation accuracy was 1.15 in RMSE, which is 12.7% regarding the applied contact force. Figure 3(c) shows external contact force estimation of double-point contacts. Two weights were randomly placed on the air pressure sensing layer and estimated the sum of double contact forces. The estimation accuracy was 1.32 (RMSE), which is slightly worse than the single-point case; however, it is still decent to estimate external contact forces. Figure 4 shows that the air pressure sensor can accurately estimate external contact forces regardless of the contact location, although it cannot localize the contact points. (see supplementary video).
III Reconstruction Framework
As aforementioned, EIT sensing layer can effectively localize the contact locations in spite of inferior contact force estimation. On the other hand, the air pressure sensing layer can accurately estimate external contact force, although contact location is unknown. The main purpose of the reconstruction framework is to leverage these two sensing channels’ complementary characteristics.
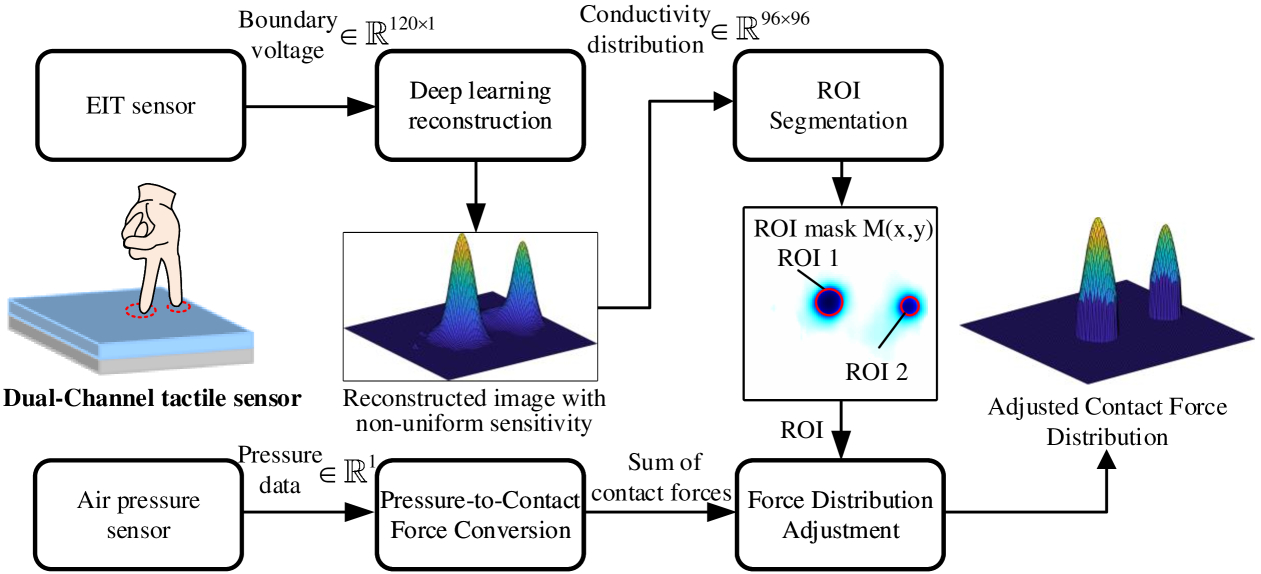
Figure 5 illustrates the overview of the contact force prediction framework that can accurately estimate multi-contact force distribution. The framework combines conventional EIT reconstruction with an air pressure sensor to adjust the sum of external contact forces.
First, the EIT sensor’s voltage data is converted into the conductivity distribution image using deep learning-based reconstruction. Although the reconstructed conductivity distribution image contains both spatial and intensity information of the external contacts, it is noisy and blurry due to EIT sensor’s inherent non-uniform sensitivity.
When a non-sharp object contacts an elastic and flat surface, such as the proposed tactile skin, the contact area can be approximated as an ellipse [20]. We thus apply the Otsu thresholding technique to automatically determine optimal threshold values by maximizing between-class variance. This method has been adopted in EIT applications, due to its effectiveness for handling varying intensity distributions of multiple contact cases [21, 22, 23]. As a result of the thresholding, regions of interest (ROIs) are segmented with distinct intensity levels, centered on the contact areas.
Finally, the conductivity distribution only on the ROI is counted to estimate the contact force distribution. In this conversion, the sum of estimated force, measured by the air pressure sensor, is used. These three components are explained in detail below.
III-A Deep learning reconstruction
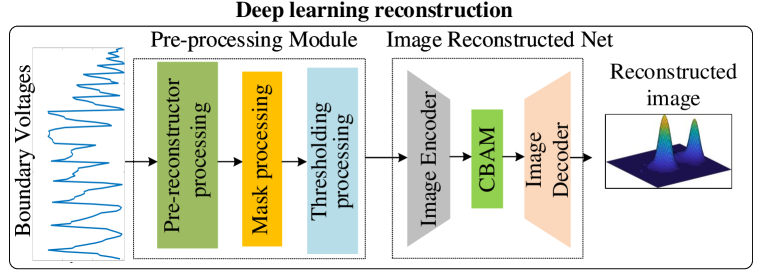
Recently, deep learning algorithms have been extensively used in EIT sensors due to their ability to handle the nonlinear and ill-posed nature of the inverse problem. The deep learning architecture for the EIT sensor is adopted from the author’s previous research [24]. As shown in Figure 6, the deep learning reconstruction network consists of two key stages: a pre-processing module and an image reconstruction network. The pre-processing module first converts raw voltage measurements into an initial image through a pre-reconstructor that utilizes Tikhonov regularization. It then applies a binary mask to filter out irrelevant data and retain meaningful conductivity changes. To further reduce artifacts, a thresholding module uses a modified ReLU function to suppress minor noise while preserving significant conductivity variations. After pre-processing, the image reconstruction network refines the image through an encoder-decoder architecture. The encoder extracts spatial features, while a convolutional block attention module (CBAM) enhances key information by selectively focusing on important regions. Finally, the decoder reconstructs the contact shape and force distribution, ensuring a more precise and detailed output.
The training dataset is generated from an open-source EIT software toolkit, EIDORS [25]. The complete dataset consisted of 12,500 samples, evenly distributed across five categories (2,500 samples each) representing one to five simultaneous contact points. Each contact point has a random radius (0.1–0.2 units) and varying conductivity levels (0.5–0.9 S/m) to simulate different contact intensities. The details about the dataset generation can be found in [24].
III-B ROI segmentation
The reconstructed conductivity image went through the following procedure for the ROI segmentation. The image is firstly normalized to a range from zero to one, ensuring consistency and robustness.
The Otsu’s thresholding method separates the conductivity distribution with anomalies, caused by the external contact, from the background area [26]. As a result from the Otsu’s thresholding method, we get the optimal threshold , which can be used to partition the normalized conductivity image , producing a binary partition :
| (2) |
To refine the masks and remove noise, morphological operations [27] are applied:
| (3) | |||
where means opening operation and means closing operation, and denote erosion and dilation, respectively, represents a disk-shaped structuring element.
The final ROI mask is defined as
| (4) |
The sum of intensities in each ROI measures the original image’s total conductivity intensity within that specific region. For each detected ROI , the sum of conductivity intensities is calculated as:
| (5) |
where if pixel belongs to ROI , and 0 otherwise.
III-C Contact force distribution conversion
At this stage, we have a conductivity distribution image with ROIs, containing the contact locations and corresponding contact areas. The conductivity information should be converted to contact force to be used in robotic applications. In the previous section, we showed that the air pressure sensor can accurately estimate the sum of external contact forces. Using this sum of external contact force information, we converted the conductivity distribution into contact force distribution based on the relative intensities.
| (6) |
where is the sum of intensities across all regions, is the Total applied force (known from a separate measurement, e.g., air pressure sensor), is the force allocated to the -th ROI. is intensity sum in ROI , and the sum of intensities across whole region.
IV Contact Force Estimation Experiments
We conducted both single- and multi-contact experiments to evaluate the proposed sensor’s contact localization and force estimation performance. The experiments were done by placing known weights on predefined locations of the sensor.
IV-A Single-contact experiments
We conducted eight distinct tests, combining four different weights on two locations. The weights were 100 g, 200 g, 300 g, and 500 g, with corresponding diameters of 22 mm, 28 mm, 30 mm, and 38 mm, respectively. The two locations were chosen as the center of the sensor, which is the least sensitive position at the coordinates (0, 0), and a corner, which is a high-sensitive position at the coordinates (-2.5, 2.5). Figure 7 showcases four results out of eight cases.
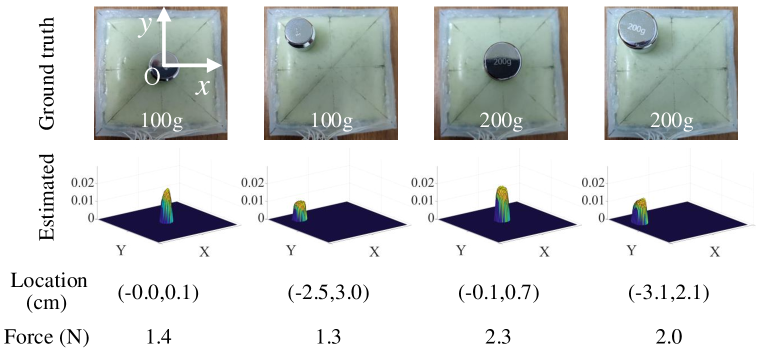
The result demonstrates that the sensor system can effectively detect both the contact position and the contact force in single-contact scenarios. The average contact force estimation error was 15.1%, and the average contact localization error was 0.5 cm, compared to the ground truth.
IV-B Multi-contact experiments
We conducted three multi-contact experiments. For two contacts with varying distance experiments, and three- and four-contact experiments, we used a flat plate to facilitate the test, as shown in Figure 8. The flat plate has indenters at the pre-defined locations and known weights are placed on top of the flat support.
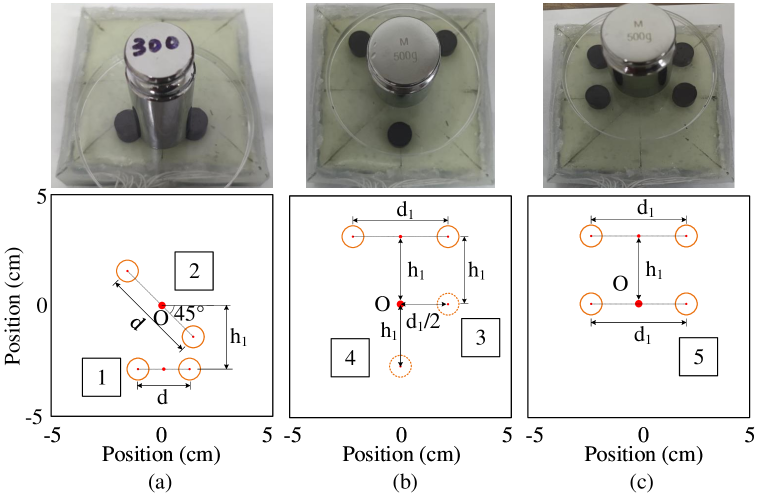
The case 1 examines the high-sensitive region near the electrodes, where two contact points are aligned parallel to the sensor boundary, while the case 2 focuses on the low sensitive central area. The cases 3, 4, and 5 intended to investigate the multi-contact detectability of the proposed sensor system.
Additionally, we also conducted two contacts with varying weight experiment to showcase the sensor system’s multi-point, multi-level force estimation capability. In this experiment, we placed two distinct weights on the sensor directly.
IV-B1 Two contacts with varying distance
In this experiment, we used two 15 mm diameter indenters, loaded with a 300 g weight to apply approximately 1.47 N of force for each indenter.
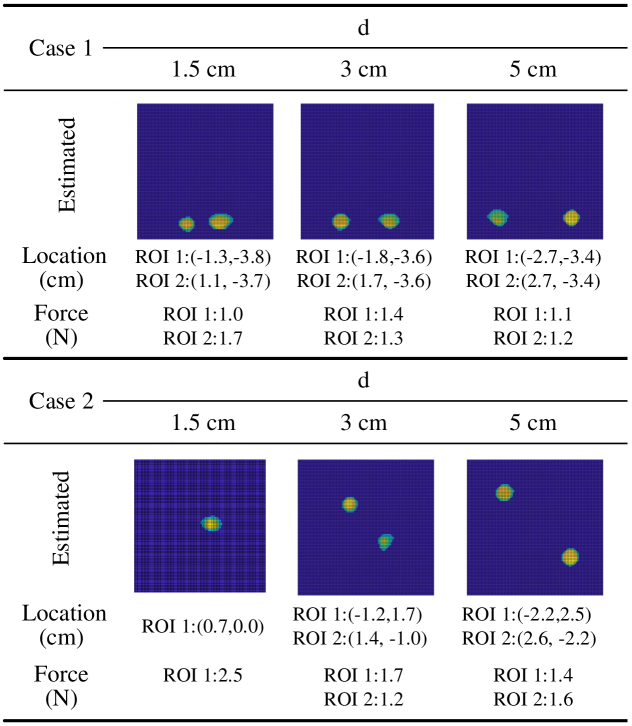
Figure 9 presents the reconstructed EIT image, and the estimated locations and forces of the contacts. In case 1, the sensor system successfully detected two contact points for the indenter distances of 1.5 cm, 3 cm, and 5 cm. The estimated contact forces were close to the applied 1.47 N and location errors under 1 cm. In case 2, the sensor detected two contact points except the indenter distance of 1.5 cm. Nonetheless, the force estimation error was still below 0.3 N, which is moderate. Table I summarizes the average localization and force estimation errors for all the distances of the case 1 and 2. This result indicates that the dual-channel sensor system can resolve two contacts when the contact distance exceeds approximately 1.5 cm, and decently estimate the contact forces.
| Case | d (cm) | |||||
| 1.5 | 3 | 5 | ||||
| case1 | case2 | case1 | case2 | case1 | case2 | |
| Location error (cm) | 0.9 | – | 0.7 | 0.5 | 0.4 | 0.9 |
| Force error (N) | 0.4 | – | 0.1 | 0.2 | 0.3 | 0.1 |
IV-B2 Three and four-contacts.
For three and four-contact tests, we applied a total force of 500g to the sensor system. The loading is distributed through the indenters across the contact points. The contact force at each point is expected to be 1.64N for three contacts, and 1.23N for four contacts. Figure 10 shows that the sensor successfully detected all three and four-contact points.
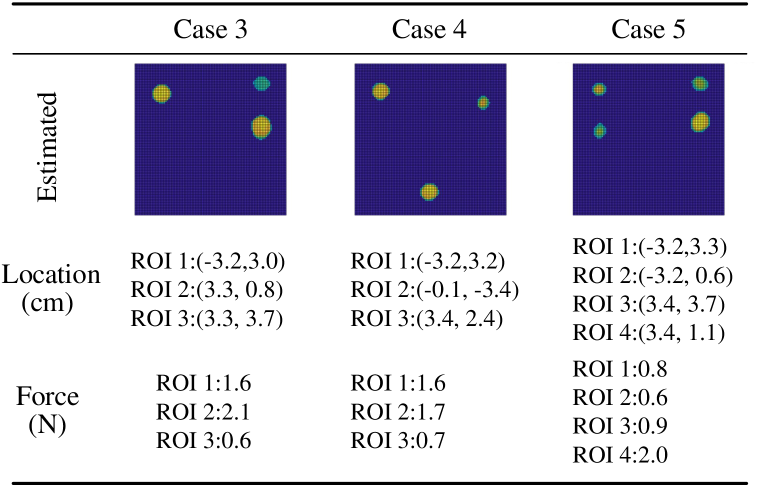
| Case | Contact points | ||
|---|---|---|---|
| 3 | 3 | 4 | |
| Location error (cm) | 0.6 | 0.4 | 1.5 |
| Force error (N) | 0.9 | 0.7 | 0.5 |
Table II presents the average errors of the contact locations and forces. For three contact cases, the average location errors are 0.6 cm and 0.4 cm, which are consistent with the single or two contacts experiments. On the other hand, the force estimation errors were 0.9N and 0.7N, which are worse. This increase of the force estimation error could be caused by the nonlinear behavior of the air pressure sensor, shown in Figure 3. Interestingly, the force estimation error was lower from the four contact cases, while the localization error was increased to 1.5 cm. This result may indicate that the sensor struggles to localize proximal multiple contacts, while the contact force estimation suffers more as the increasing the number of contacts.
IV-B3 Two contacts with varying weights
This experiment was additionally conducted to investigate the effect of the varying contact forces. In this experiment, two distinct weights were placed both at the sensitive locations, or one of them at the center.
Figure 11 shows three results of the estimated locations, forces from every detected ROIs. The dual-channel sensor system estimated two contacts with varying force, except when one of the weights is located at the center. Table III presents the average localization and force estimation errors. Compared to the Table I, the estimation performance appears to be similar. The real-time response of our system during multi-point force testing is demonstrated in the supplementary video.
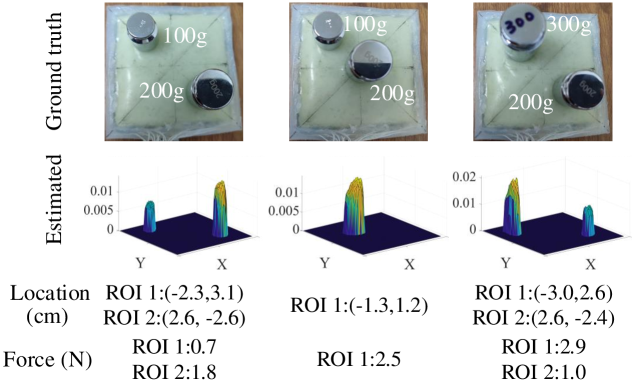
| Case | Weight | ||
|---|---|---|---|
| 100g 200g | 100g 200g | 200g 300g | |
| Location error (cm) | 0.4 | – | 0.3 |
| Force error (N) | 0.2 | – | 0.5 |
V CONCLUSION, DISCUSSION, FUTURE WORK
This study presents a dual-channel tactile sensor system that synergistically integrates an EIT-based sensing layer with an air pressure sensing layer to enhance multi-contact force estimation while keeping contact localization performance. The proposed system addresses the limitations of traditional EIT-based sensors by leveraging the complementary strengths of both modalities: the EIT layer provides precise contact localization, while the air pressure layer offers reliable force measurement across the entire sensing area.
The experimental results demonstrated the sensor system’s effectiveness. Single-contact force estimation achieves an average absolute percentage error of 15.1% with a mean position error of 0.5 cm (which is about 5% of the sensor width). In multi-contact scenarios, the sensor distinguishes between two, three, and four contact points, with force estimation errors of 20.1% by evaluating the measured contact force with the sum of all of the contact forces and location errors between 0.4 cm and 1.5 cm (which is about 15% of the sensor width). Unlike conventional methods of directly calibrating EIT tactile sensors, which require extensive datasets and complex calibration (e.g., Lee et al.’s 290,000 simulations and 90,000 real-world measurements, with a 17.2% force estimation error [12]), our system achieves competitive accuracy with only 245 experimental contact points to calibrate the air pressure sensor, significantly reducing calibration demands.
Despite its advantages, there are remaining issues. The air pressure layer exhibits slight non-uniform sensitivity across its surface, contributing to force estimation errors. Additionally, while it performs reliably, it requires at least one calibration based on experimental data. However, unlike EIT-based tactile sensors, the air pressure sensor does not require extensive real-world pressing data, as EIT-based tactile sensors are related to both electrical and mechanical interactions. The air pressure sensor operates purely through mechanical principles, which makes sensor simulation and system optimization significantly easier. In addition, the reconstruction algorithm of the current EIT layer is limited to the specific ROI format. When the contact area changes, this ROI shape can lose the estimated information.
To address these limitations, future efforts should focus on improving EIT accuracy through advanced reconstruction algorithms and expanded real-world datasets. Additionally, refining the mechanical design of the air pressure sensor could help mitigate force distribution inconsistencies.
References
- [1] M. Meribout, N. A. Takele, O. Derege, N. Rifiki, M. El Khalil, V. Tiwari, and J. Zhong, “Tactile sensors: A review,” Measurement, p. 115332, 2024.
- [2] G. Pang, G. Yang, and Z. Pang, “Review of robot skin: A potential enabler for safe collaboration, immersive teleoperation, and affective interaction of future collaborative robots,” IEEE Transactions on Medical Robotics and Bionics, vol. 3, no. 3, pp. 681–700, 2021.
- [3] S. Pyo, J. Lee, K. Bae, S. Sim, and J. Kim, “Recent progress in flexible tactile sensors for human‐interactive systems: from sensors to advanced applications,” Advanced Materials, vol. 33, no. 47, p. 2005902, 2021.
- [4] Z. Ye, G. Pang, K. Xu, Z. Hou, H. Lv, Y. Shen, and G. Yang, “Soft robot skin with conformal adaptability for on-body tactile perception of collaborative robots,” IEEE Robotics and Automation Letters, vol. 7, no. 2, pp. 5127–5134, 2022.
- [5] G. Cheng, E. Dean-Leon, F. Bergner, J. R. G. Olvera, Q. Leboutet, and P. Mittendorfer, “A comprehensive realization of robot skin: Sensors, sensing, control, and applications,” Proceedings of the IEEE, vol. 107, pp. 2034–2051, 10 2019.
- [6] G. Cannata, M. Maggiali, G. Metta, and G. Sandini, “An embedded artificial skin for humanoid robots,” in 2008 IEEE International conference on multisensor fusion and integration for intelligent systems. IEEE, 2008, pp. 434–438.
- [7] D. Silvera-Tawil, D. Rye, M. Soleimani, and M. Velonaki, “Electrical impedance tomography for artificial sensitive robotic skin:a review,” IEEE Sensors Journal, vol. 15, no. 4, pp. 2001–2016, 2015.
- [8] Z. Cui, Y. Yu, and H. Wang, “Recent developments in impedance-based tactile sensors: A review,” IEEE Sensors Journal, vol. 24, no. 3, pp. 2350 – 2366, 2024.
- [9] K. Liu, Y. Wu, S. Wang, H. Wang, H. Chen, B. Chen, and J. Yao, “Artificial sensitive skin for robotics based on electrical impedance tomography,” Advanced Intelligent Systems, vol. 2, no. 4, p. 1900161, 2020, 1900161.
- [10] Y. Chen and H. Liu, “Location-dependent performance of large-area piezoresistive tactile sensors based on electrical impedance tomography,” IEEE Sensors Journal, vol. 21, no. 19, pp. 21 622–21 630, 2021.
- [11] D. S. Holder, Electrical Impedance Tomography : Methods, History and Applications. Bristol, U.K.: IOP Publishing, 2005.
- [12] H. Lee, H. Sun, H. Park, G. Serhat, B. Javot, G. Martius, and K. J. Kuchenbecker, “Predicting the force map of an ert-based tactile sensor using simulation and deep networks,” IEEE Transactions on Automation Science and Engineering, vol. 20, no. 1, pp. 425–439, 2022.
- [13] H. Lee, K. Park, J. Kim, and K. J. Kuchenbecker, “Piezoresistive textile layer and distributed electrode structure for soft whole-body tactile skin,” Smart Materials and Structures, vol. 30, no. 8, p. 085036, 2021.
- [14] H. Chen, X. Yang, J. Geng, G. Ma, and X. Wang, “A skin-like hydrogel for distributed force sensing using an electrical impedance tomography-based pseudo-array method,” ACS Applied Electronic Materials, vol. 5, no. 3, pp. 1451–1460, 2023. [Online]. Available: https://doi.org/10.1021/acsaelm.2c01394
- [15] H. Chen, X. Yang, G. Ma, and X. Wang, “Correcting non-uniform sensitivity in eit tactile sensing via jacobian vector approximation,” IEEE Robotics and Automation Letters, vol. 9, no. 3, pp. 2335 – 2342, 2024.
- [16] H. Chen, Z. Wang, K. Langlois, T. Verstraten, and B. Vanderborght, “A structure modality enhanced multimodal imaging method for electrical impedance tomography pressure distribution measurement,” IEEE Transactions on Instrumentation and Measurement, vol. 73, no. 4507713, 2024.
- [17] K. Park, K. Shin, S. Yamsani, K. Gim, and J. Kim, “Low-cost and easy-to-build soft robotic skin for safe and contact-rich human-robot collaboration,” IEEE Transactions on Robotics, vol. 40, pp. 2327–2338, 2024.
- [18] P. Svarny, J. Rozlivek, L. Rustler, M. Sramek, Ö. Deli, M. Zillich, and M. Hoffmann, “Effect of active and passive protective soft skins on collision forces in human–robot collaboration,” Robotics and Computer-Integrated Manufacturing, vol. 78, p. 102363, 2022.
- [19] H. Chen, X. Yang, P. Wang, J. Geng, G. Ma, and X. Wang, “A large-area flexible tactile sensor for multi-touch and force detection using electrical impedance tomography,” IEEE Sensors Journal, vol. 22, no. 7, pp. 7119–7129, 2022.
- [20] K. L. Johnson, Contact mechanics. Cambridge university press, 1987.
- [21] A. Khambampati, D. Liu, S. Konki, and K. Kim, “An automatic detection of the roi using otsu thresholding in nonlinear difference eit imaging,” IEEE Sensors Journal, vol. 18, no. 12, pp. 5133–5142, 2018.
- [22] S. Liu, J. Jia, Y. D. Zhang, and Y. Yang, “Image reconstruction in electrical impedance tomography based on structure-aware sparse bayesian learning,” IEEE Transactions on Medical Imaging, vol. 37, no. 9, pp. 2090–2102, 2018.
- [23] A. K. Khambampati, S. A. Rahman, S. K. Sharma, W. Y. Kim, and K. Y. Kim, “Nonlinear difference imaging to image local conductivity of single-layer graphene using electrical impedance tomography,” IEEE Transactions on Instrumentation and Measurement, vol. 71, pp. 1–12, 2022.
- [24] H. Chen, X. Yang, G. Ma, Y. Wang, and X. Wang, “Enhancing tactile sensing in robotics: Dual-modal force and shape perception with eit-based sensors and mm-cnn,” pp. 3311–3317, May 2024.
- [25] A. Adler and W. R. Lionheart, “Uses and abuses of eidors: an extensible software base for eit,” Physiological measurement, vol. 27, no. 5, pp. S25–S42, 2006.
- [26] N. Otsu et al., “A threshold selection method from gray-level histograms,” Automatica, vol. 11, no. 285-296, pp. 23–27, 1975.
- [27] R. C. Gonzales and P. Wintz, Digital image processing. Addison-Wesley Longman Publishing Co., Inc., 1987.