Entropic bottlenecks to nematic ordering in an apolar spin model
Abstract
The Lebwohl-Lasher model of liquid crystals with (d = 2, n = 3) describes interacting apolar spins, with an order-parameter topology. Simulations with a modified Wang-Landau Monte Carlo protocol, that includes a density of states (DoS) factor, had previously found a zero latent-heat transition at to a novel nematic order, coexisting with unbound defects whose binding is completed only on cooling. We find through this entropically augmented MC protocol, that there is a deep dip in the DoS at an energy preceding global ordering, reflecting sparse intermediate configurations, or entropy barriers. The narrow entropic bottleneck induces a cusp in the initially rising nematic correlation length, at a micro-canonical precursor temperature . A finite-scale cooperativity of defects and nematic clusters penetrates the bottleneck at to enable a third-order phase transition at a lower : a rare pathway, overlooked by energy-only acceptance protocols.
pacs:
64.70.M-,64.70.mfThere has been continuing interest in lattice models with order parameter (OP) symmetries of -component continuous variables, supporting stable topological excitations [1, 2, 3, 4, 5, 6, 7, 8, 9, 10, 11, 12, 13, 14, 15, 16, 17, 18]. The model with n = 3 dimensional apolar spin manifolds at each of lattice sites, has a non-trivial first fundamental group [1]. For apolar spins (bulk nematics), there is a weak first-order transition with Long Range Order (LRO). Whereas an apolar model, with half-integer defect charges, formally equivalent to a 2DXY model, exhibits the conventional Berenzenskii - Kosterlitz - Thouless (BKT) transition [19, 20, 21]. The nature of the transition for the apolar-spin () model is not resolved. Early Boltzmann Monte Carlo (BMC) simulations [22] found a BKT-type binding of defect pairs [3, 5, 6, 7, 11]. Other results included a first-order transition; a crossover to a zero-temperature transition; a new universality class without a critical line; or a non-divergent screening length [4, 8, 9, 10, 13, 14, 15, 16, 17, 18].
The Wang-Landau protocol [23, 24, 25, 26, 27] determines the density of states of the system (), and the system’s bin-wise (configurational) entropy , is adopted as a measure of the micro-canonical entropy. Augmenting the BMC acceptance criterion with probabilities arising from entropy increments, the Entropically Augmented (Boltzmann) Monte Carlo sampling, say protocol, led to the prediction of a more complex ordering, with two transitions on cooling [12]. At the transition without latent heat, a novel phase appeared of nematic order, coexisting with unbound defects of density that vanished only at a lower . The Binder cumulant [28, 29] in the nematic order parameter was size-independent, at where LRO set in [12].
The inter-bin entropy-slope is identified with the thermodynamic inverse effective-temperature , where and are entropy and energy values per site. The and its derivatives can identify cooperative changes, at sharp energies in finite systems [30, 31, 32, 33, 34]. The also controls the Partial Equilibration Scenario () under MC dynamics for relaxation of the post-quench energy , since the evolving governs heat-releases to the bath [35, 36, 37, 38, 39, 40, 41].
The physical realizations of symmetries include the fully frustrated Heisenberg antiferromagnet [42], and uniaxial liquid crystals. The latter have long been satisfactorily described by the Lebwohl-Lasher (LL) Hamiltonian [43]:
Here is the second Legendre polynomial; is the n = 3 spin-space angle between nearest-neighbour ‘directors’ on sites; and absorbs the energy scale.
In this Letter, the EAMC protocol is applied to study the multi-step ordering of this model, focussing on the possible mechanism that yields qualitatively different results from the EAMC and BMC protocols. The computed observables with periodic boundary conditions are [12]: energy per site ; microcanonical entropy per site ; inverse microcanonical system-temperature ; specific heat per site ; nematic order parameter , and nematic susceptibility [44]; canonical free energy per site by a Legendre transformation on [45]; unbound defect-density , and the degree of topological order [3]. Unless otherwise stated, .
Entropy Barriers:
The micro-state observables are monitored during the system’s
long uniform-energy random walk encompassing the nematic transition
region with the EAMC protocol, effected by biasing it with the inverse
of the DoS. The resulting distribution of micro-states is projected as
contour maps of 3D mesh plots, onto planes of different observable pairs.
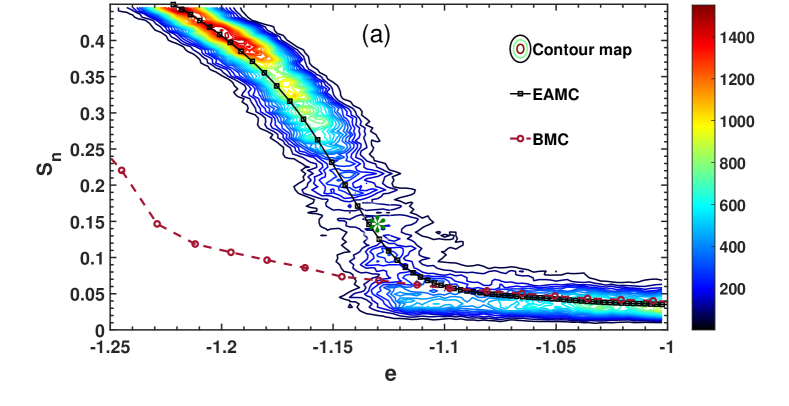
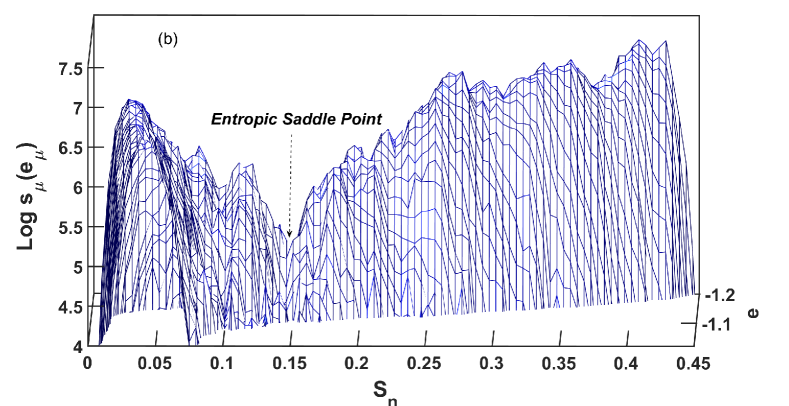
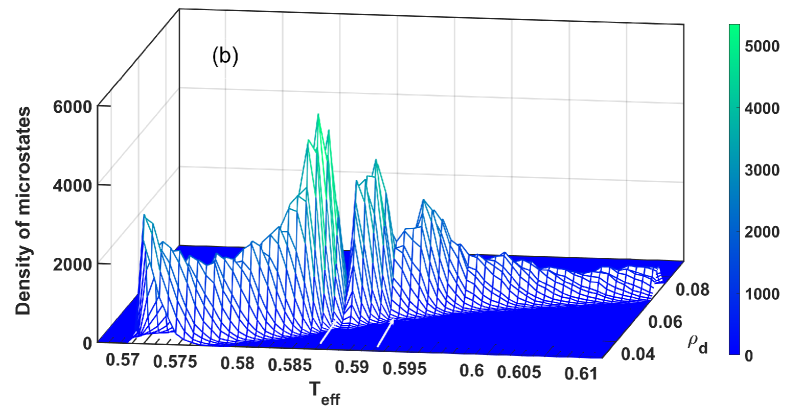
Fig. 1(a) shows a contour-map on the () plane. One observes a sparse region, bracketed by population-rich segments on either side. Superimposed on the contours are lines of quasi-statically guided canonical averages of () from BMC and EAMC protocols, that match till . For lower energies, the EAMC protocol locates and traverses the sparse-pathway regions, while this configuration space is overlooked by the BMC protocol. Fig. 1(b) shows a 3D mesh plot of the representative entropy . The minimum height of the entropic tunnel identifies the rarest configuration space, or highest entropy barrier, corresponding to a crossover between the two separated segments, near . Over the interval from to this saddle point, an entropy drop by an order of magnitude reflects the pathway scarcity.
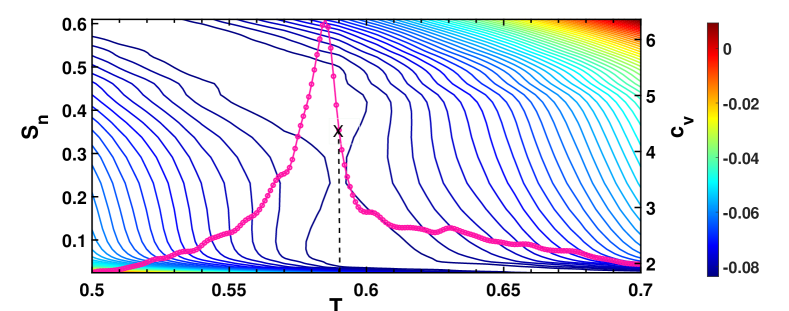
Fig. 2 is the contour plot of the EAMC - derived Landau free energy projected on the ( plane. There is a narrow pathway-constriction, or ‘bottleneck’, at . Fig. 2 also shows that a superimposed per site has a cusp at a lower . The bottleneck precedes the nematic phase, reminiscent of a finite critical droplet preceding (and inducing) symmetry-breaking.
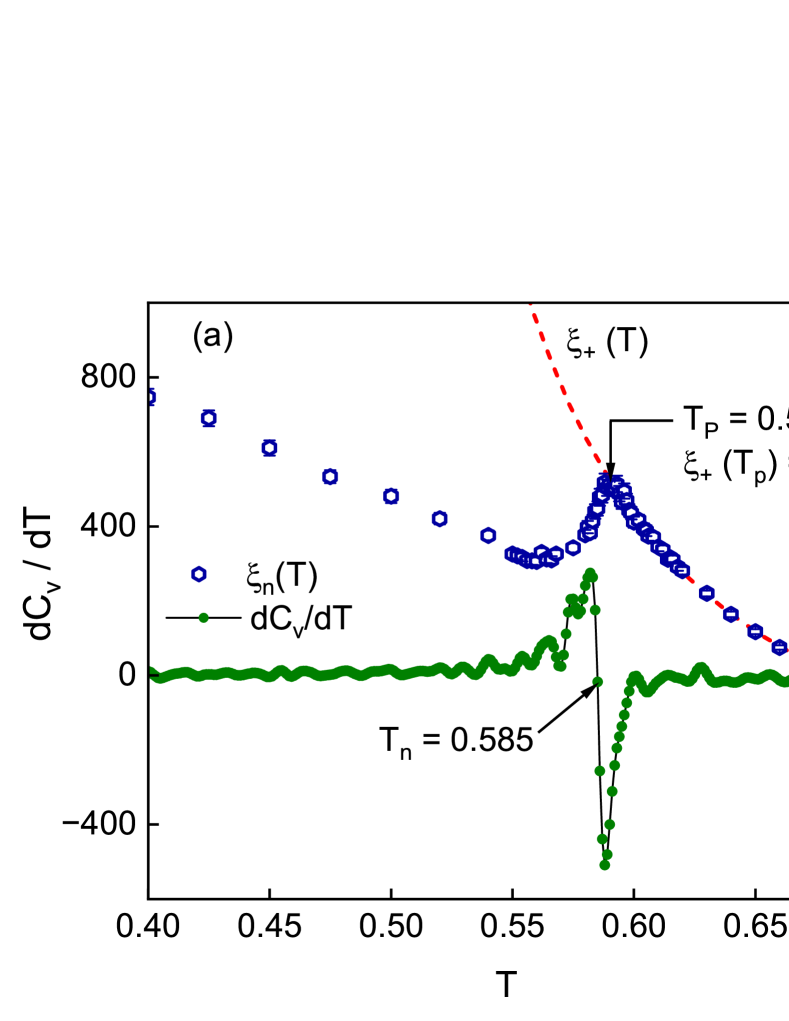
Signatures of for finite are also seen in both and . Fig. 3(a) shows that the specific heat slope has a discontinuity across , implying a third-order transition [46, 47]. Fig. 3(a) also shows that the nematic correlation length is locked to the BKT length for ; peels downwards forming a cusp at ; is continuous at the LRO onset ; and rises for lower . Here [21], with a fitted and constants . Fig. 3(b) shows the microstate distribution versus and , with non-zero dips at .
Precursor and transition temperatures:
Finite systems such as nuclei, atomic clusters, or biomolecules, can
nonetheless have cooperativity changes at sharp special energies
: from transitions over system scales , or from
transformations over finite microstructure scales (). In both
cases, the special system-temperatures are .
The location and Ehrenfest order of the cooperativity changes are
diagnosed by and its derivatives: ,
where are the entropy slope, entropy curvature, slope of
entropy-curvature, etc [30, 31]. The diagnostic signatures
were identified through the exactly soluble Baxter-Wu (first-order) and
Ising (second-order) models; and from EAMC simulations of polymer
adhesion and protein folding [31, 32, 33, 34]. Interestingly,
finite-size precursor transformations could precede and foreshadow, the
later system-size phase transitions [32].
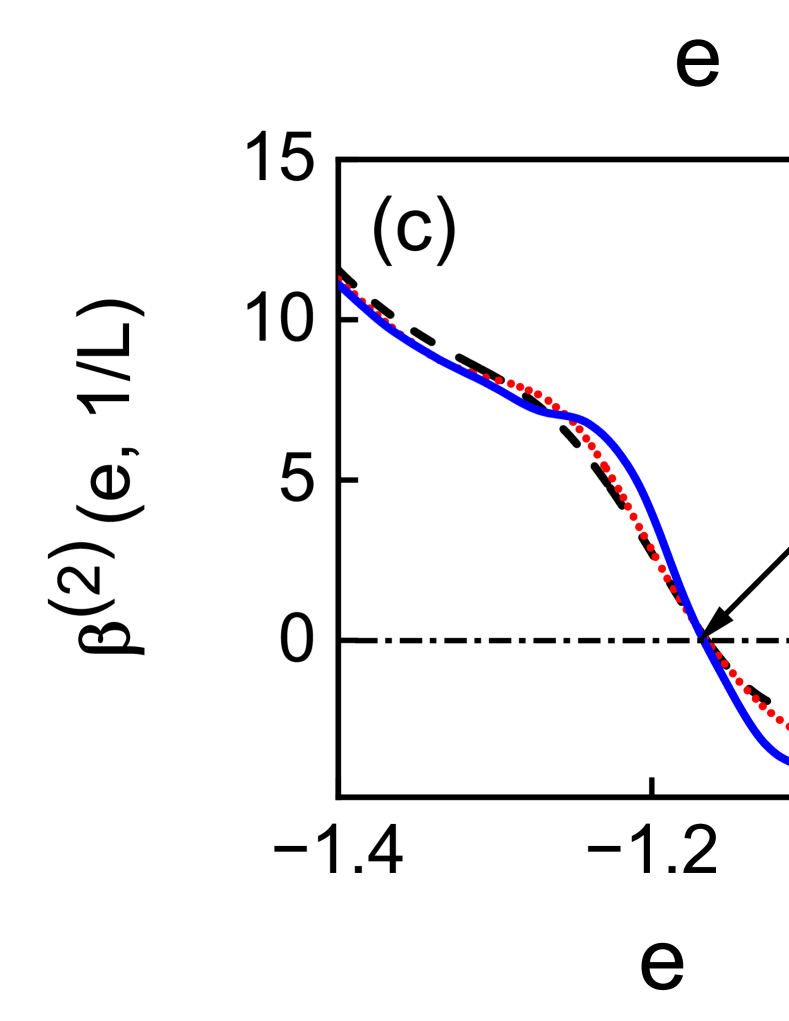
Fig. 4 shows and its derivatives versus energy . The decreasing curve flattens slightly, but has no positive slopes [31, 34]. Such behaviour rules out a first-order transition. For increasing , the slopes show peaks that move to the higher energy region, with flat, negative values. This differs from the second-order Ising signatures of slope-peaks moving to lower energies, while rising to value zero (so has stationary, symmetric maxima) [33]. Such behaviour rules out a second-order transition.
The curvatures are negative for , and vanish at points defined by , (where ). For the point corresponds to , the nematic transition temperature. Hence the third-order transition of this LL model is identified with a non-stationary point of inflexion of . Fig. 4(a) has a nonlinear term . A linear extrapolation as shows a nonzero separation of temperatures and . Curiously, the curvatures of all sizes cross at a common , when , analogous to the Binder cumulant [28, 29], as noticed in the Ising case [33]. The finite-scale transformation at unlocks access to the system-scale transition at . See End Matter.
Time evolution of coupled order parameter and defects:
The generic PES governs the sequential passage of a non-equilibrium
system between micro-canonical shells of decreasing energy, through
sparse, inter-connecting bottlenecks. The heat-release probability is
controlled by the at time , during
(quench-induced) large deviations [46, 47] from initial
to final equilibrium. The PES evolution ideas (under BMC protocols)
were applied to entropy-barrier passage of ageing harmonic oscillators,
and to re-equilibration of martensitic
steels [35, 36, 37, 38, 39, 40, 41].
We implement here a free-running PES-type dynamics [35, 36]
to explore a larger (and non-equilibrium) configurational range, during the
microstructural co-evolution of topological defects and nematic
clusters, under EAMC protocols. For BMC quench simulations the
acceptance of a randomly chosen micro-state is determined by energy
increments only, while EAMC quench acceptances involve both energy
and entropy changes. The sequences of the Markov Chains so
constructed, define the system pathways of the quench evolution runs.
The system is initially equilibrated at , and allowed to evolve for Monte Carlo lattice sweeps (MCS). This bath temperature is then suddenly quenched at to fixed temperatures ; and 500 such independent quench runs are made, to determine statistical averages. Averaged correlation functions are calculated at 75 chosen MCS time points during each evolution. Like the static case [12], the EAMC-derived is parametrized as , where the initial is taken as zero at . The run-averaged observables are computed.
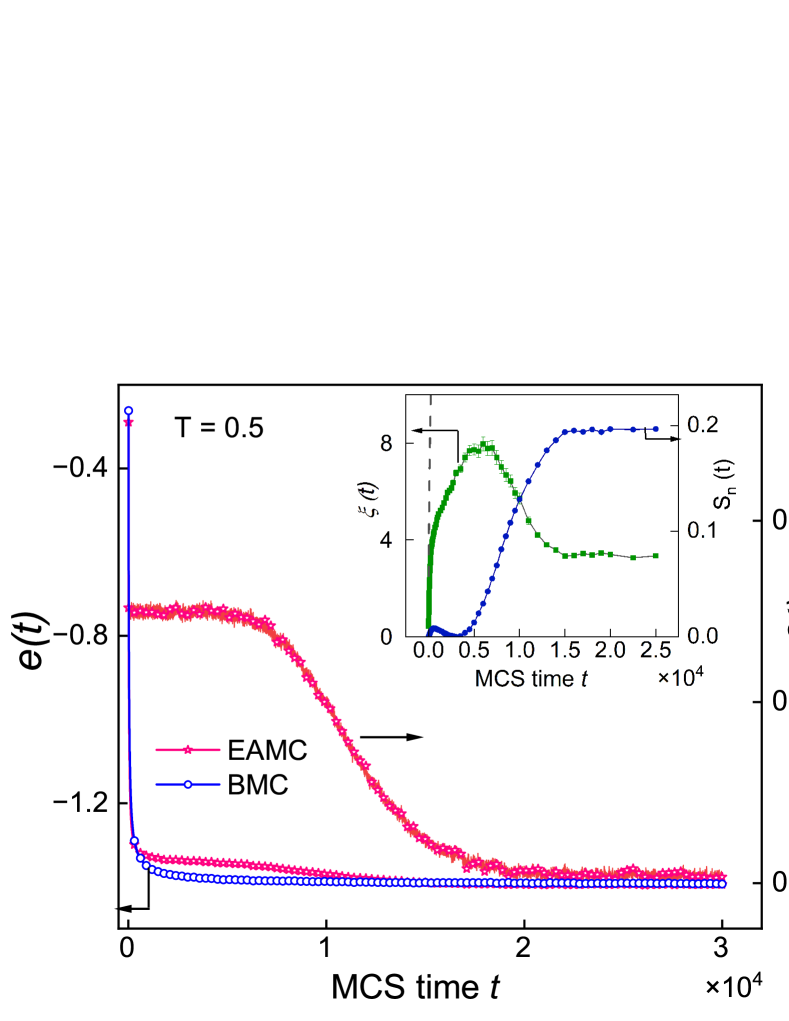
Fig. 5 shows how post-quench, interacting nematic clusters and unbound-defect cores, mutually modify their director textures, to squeeze through the entropic bottleneck. The main figure shows for a quench to , that the EAMC evolution of energy , detours (relative to the BMC generated data) through a flattening regime, before re-equilibrating beyond MCS. The post-quench topological order parameter remains flat over the same time scale, when and undergo complex, correlated evolutions.
The inset of Fig. 5 shows that rises slightly from its high temperature value of zero and falls back to nearly zero at MCS. The evolving correlation length is locked to the BKT coarsening length: describing self-similar defect-coarsening without symmetry breaking [48, 49, 50, 13], until . The correlation function in this regime shows data collapse in as in dynamical scaling (not shown). Subtle microscopic cooperativity changes enable passage through rare transition states of the bottleneck, at a constant effective search temperature. The resultant onset of symmetry-breaking enabled by EAMC dynamics, increases nematic cluster sizes to lattice units, before falling to a (lower) equilibrium value , after MCS. The finite-size director clusters at the transformation might support a relevant scaling field, driving a crossover away from a BKT phase of bound defects without LRO, and towards a nematic LRO phase with unbound defects [12].
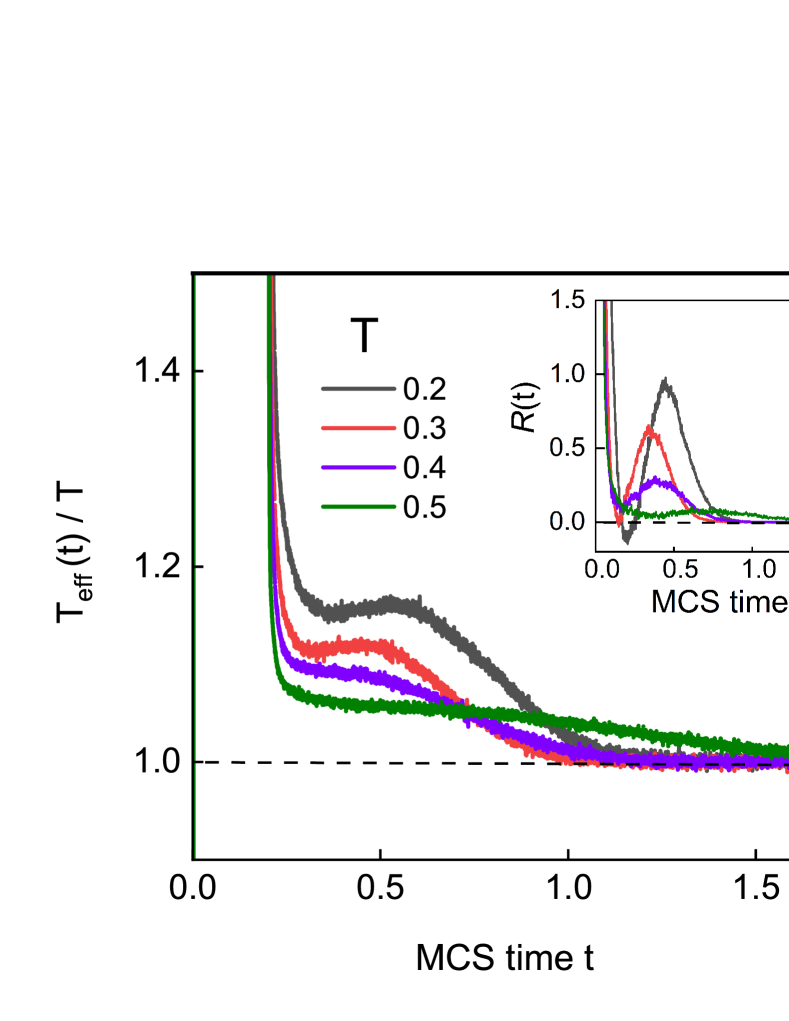
Fig. 6 shows that large deviations [46, 47], in this case for the post-quench PES effective temperature and entropy production rate , do correctly re-equilibrate to and zero, respectively. Here, the total entropy change of a system-plus-bath, at constant , yields the rate per system-site, . The BMC-protocol acceptance probability involves a weight factor . The EAMC acceptance also includes an entropic factor , suggesting is a search temperature for bottleneck pathways. Time-averaging a quantity for different , yields small values .
A novel understanding thus emerges for the long-standing puzzle of the nature and mechanism of apolar transitions. We find that nematic-film realizations have unusual transition regions dominated by sparse-state entropy barriers. The entropic bottlenecks are missed by energy-only MC protocols, but can be traversed by entropically-augmented MC protocols that locate rare crossover pathways. These involve finite-scale correlations of coexisting order and disorder variables, usually taken as mutually exclusive. The local transformations at a precursor temperature induce a global nematic third-order phase transition at a slightly lower . There is symmetry breaking without latent heat, and a non-divergent correlation length of a novel nematic order, containing a (nonzero wave-vector) liquid of random defects [51, 52, 53, 54, 55, 56, 12]. The non-Abelian rotation constraints [3] are plausibly responsible for the sparsity of pathways between the isotropic and nematic director clusters, bracketing the bottleneck.
Further work could involve duality transforms for the 2D model as for XY models [21, 57, 58, 59, 60, 61, 62, 63, 64]. The effective Hamiltonians for interacting topological charges, with familiar XY-like RG flows of defect coupling and fugacity within a zero-OP plane, might now include exit flows [4] of an extra scaling field for a nematic-cluster core, favouring and preserving nematic order [58, 59, 60].
Finally, the EAMC protocols [23, 26, 25, 27, 28, 29] and diagnostics [30, 31, 32, 33, 34] used here, could be diversely applied to biaxial liquid crystal phases [65, 66, 67, 68]; to interacting molecules [69] of a glassy melt; and to protein folding by entropic golf-hole passage [40, 41, 70, 71, 72].
Acknowledgements.
We acknowledge computational support from the Centre for Modelling Simulation and Design (CMSD) at the University of Hyderabad. B.K.L acknowledges financial support from the Department of Science and Technology, Government of India vide Grant No. DST/WOS-A/PM-4/2020 to carry out this work.References
- [1] N. D. Mermin, Rev. Mod. Phys. 51, 591 (1979).
- [2] S.Solomon, Y. Stavans and E. Domany, Phys. Lett. B 112B, 373 (1982).
- [3] H. Kunz and G. Zumbach, J. Phys. A: Math.Gen. 22, L1043 (1989); Phys. Rev. B 46, 662 (1992).
- [4] S. M. Catterall, M. Hasenbusch, R. R. Horgan and R. Renken, Phys. Rev. D 58, 074510 ( 1998).
- [5] C. Chiccoli, P. Pasini and C. Zannoni, Physica (Amesterdam) 148A, 298 (1998).
- [6] E. Mondal and S. K. Roy, Phys. Lett. A 312, 397 (2003).
- [7] S. Dutta and S. K. Roy, Phys. Rev. E 70, 066125 (2004).
- [8] R. Paredes V., A.I. Farinas-Sanchez and R. Botet, Phys. Rev. E 78, 051706 (2008).
- [9] A.I. Farinas-Sanchez, R. Botet, B. Berche, and R Paredes, Cond. Matt. Phys., 13, 13601 (2010).
- [10] Y. Tomita, Phys. Rev. E 90, 032109 (2014).
- [11] S. Shabnam, S. DasGupta and S. K. Roy, Physics Letters A 380, 667 (2016).
- [12] B. K. Latha and V. S. S. Sastry Phys. Rev. Lett. 121, 217801 (2018).
- [13] Y. Ozeki, A. Matsuda and Y. Echinaka, Phys. Rev. E 99, 012116 (2019).
- [14] G. Delfino, Y. Diouane and N. Lamsen, J. Phys. A : Math.Theor 54, 03LT01 (2021).
- [15] C. Bonati, A. Franchi, A. Pelissetto and E. Vicari, Phys. Rev. D 102, 034513 (2020).
- [16] Y. Diouane, N. Lamsen and G. Delfino, J. Stat. Mech., 2021, 033214 (2021).
- [17] A. Ueda and M. Oshikawa, Phys. Rev. E 106, 014104 (2022).
- [18] L. Burgelman, L. Devos, B. Vanhecke, F. Verstraete and L. Vanderstraeten, Phys. Rev. E 107, 014117(2023).
- [19] V. L. Berezenskii, Sov. Phys. JETP 32, 493 (1971); Sov. Phys. JETP 34, 610 (1972).
- [20] J. M. Kosterlitz and D. J. Thouless, J. Phys. C 6, 1181 (1973).
- [21] J.M. Kosterlitz, J. Phys. C : Solid State Physics, 7, 1046 (1974).
- [22] N. Metropolis, A. W. Rosenbluth, M. N. Rosenbluth, A. H. Teller, and E. Teller, J. Chem. Phys. 21, 1087 (1953).
- [23] F. Wang and D. P. Landau, Phys. Rev. Lett. 86, 2050 (2001); Phys. Rev. E 64, 056101 (2001).
- [24] D.P. Landau and F. Wang, Comp. Phys. Comm. 147, 674 (2002).
- [25] C. Zhou, T. C. Schulthess, S. Torbrugge, and D. P. Landau, Phys. Rev. Lett. 96, 120201 (2006).
- [26] D. Jayasri, V. S. S. Sastry, and K. P. N. Murthy, Phys. Rev. E 72, 036702 (2005).
- [27] B. Kamala Latha, R. Jose, K. P. N. Murthy and V. S. S. Sastry, Phys. Rev. E 92, 012505 (2015).
- [28] K. Binder, Z. Phys. B: Condens. Matter 43, 119 (1981).
- [29] D. P. Landau and K. Binder, A Guide to Monte Carlo Simulations in Statistical Physics, 2nd ed. (Cambridge University Press, New York, 2005).
- [30] D. H. E . Gross Microcanonical Thermodynamics (World Scientific, Singapore, 2001).
- [31] S. Schnabel, D.T. Seaton, D. P. Landau and M. Bachmann, Phys. Rev. E 84, 011127 (2011).
- [32] T. Koci and M. Bachmann, Phys. Rev. E 95, 032502 (2017).
- [33] K. Qi and M. Bachmann, Phys. Rev. Lett. 120, 180601(2018).
- [34] W. Liu, F. Wang, P.Sun and J. Wang, J. Stat. Mech. 9, 093206 (2022).
- [35] F. Ritort, J. Phys. Chem. B 108, 6893 (2004).
- [36] L.L. Bonilla, F.G. Padilla and F. Ritort, Physica A, 250, 315 (1998).
- [37] A. Garriga and F. Ritort, Phys. Rev. E 72, 031505 (2005).
- [38] A. Crisanti and F. Ritort, Europhys. Lett. 66 253 (2004).
- [39] A. Crisanti, M. Picco and F. Ritort, Phys. Rev. Lett. 110, 080601 (2013).
- [40] N. Shankaraiah, K.P.N .Murthy, and S.R. Shenoy, EPL 142, 36003 (2023).
- [41] N. Shankaraiah, K.P.N. Murthy, and S.R. Shenoy, arXiv : 2210.01997v1 [cond-mat .stat-mech].
- [42] H. Kawamura, A. Yamamoto and T. Okubo J. Phys. Soc. Japan, 79, 023701 (2010).
- [43] P. A. Lebwohl and G. Lasher, Phys. Rev. A 6, 426 (1973).
- [44] C. Zannoni Liquid Crystals and their Computer Simulations, ( Cambridge University Press, New York, 2022).
- [45] H. B. Callen, Thermodynamics and an Introduction to Thermostatics, 2nd ed. (Wiley Publishers, New York, 1991 ).
- [46] S. Majumdar and G. Schehr, arXiv: 1711.07571v1 [cond-mat .stat-mech].
- [47] H. Touchette, Phys. Rep. 478, 1 (2009).
- [48] F. Rojas and A. D. Rutenberg, Phys. Rev. E60, 212 (1999).
- [49] S. Dutta and S. K. Roy, Phys. Rev. E 71, 026119 (2005).
- [50] A. Singh and S. Singh, Eur. Phys. J. E 36, 122 (2013).
- [51] P.C. Hohenberg, Phys.Rev. 158, 383 (1967).
- [52] N.D. Mermin and H. Wagner, Phys. Rev. Lett. 17, 1133 (1966).
- [53] B. Halperin, J. Statist. Phys. 175, 521 (2019).
- [54] G. Palle and D.K. Sunko, J. Phys. A: Math. Theor. 54, 315001 (2021).
- [55] E.C. Marino, D. Niemeyer, V. S. Alves, T. H. Hansson, and S. Moroz, New J. Phys.20, 083049 (2018).
- [56] J. Pearl, Appl. Phys. Lett. 5, 65 (1964).
- [57] R. Savit, Rev Mod. Phys. 52, 453 (1980).
- [58] M.S. Lau and C. Dasgupta, Phys. Rev. B 39, 7212 (1989).
- [59] G. Kohring, R. E. Shrock and P. Wills, Phys. Rev, Lett. 57, 1358 (1986).
- [60] S. R. Shenoy, Phys. Rev. B 42, 8595 (1990).
- [61] S. R. Shenoy, Current Science 65, 392 (1993).
- [62] S. R. Shenoy Notes on Josephson Junction Arrays, Troisieme cycle de la physique en Suisse romande, CERN Library code 90-0798-0 ( EPFL. Lausanne , Lausanne, 1989).
- [63] J. F. Yu, Z. Y. Xie, Y. Meurice, Y. Liu, A. Denbleyker, H. Zou, M. P. Qin, J. Chen, and T. Xiang, Phys. Rev. E 89, 013308 (2014).
- [64] L. Vanderstraeten, B. Vanhecke, A. M. Lauchli and F. Verstraete, Phys. Rev. E 100, 062136 (2019).
- [65] B. Kamala Latha and V. S. S. Sastry, Liq. Cryst. 45, 2197 (2018).
- [66] B. Kamala Latha and V. S. S. Sastry, Phys. Rev. E 102, 040701 (2020).
- [67] B. Kamala Latha, S. Dhara and V. S. S. Sastry, Phys. Rev. E 104, 064701 (2021).
- [68] B. Kamala Latha, Ph. D thesis, University of Hyderabad, 2014. http://hdl.handle.net/10603/214857.
- [69] M.S. Shell, P.G. Debenedetti, and A. Z. Panagiotopaulis, Phys. Rev. E 66, 056703 (2002).
- [70] A. S’ali, E. Shakhnovich and M. Karplus, Nature 369, 248 (1994).
- [71] P.G. Wolynes, Proc. Am. Philos. Soc., 145, 555 (2001).
- [72] J. Udgaonkar, Physics 17, 11 (2024).
Appendix A End Matter
To present additional features of the complex transition, we compute for , the per-site free energy derived from the system energy and the corresponding entropy . A Legendre transformation of the entropy [45], yields ; numerically identical results are obtained by a thermal average of the energy with a DoS times a Boltzmann factor. We can in particular, evaluate the free energy with other variables specified: we choose the order parameter , and the disorder parameter (unbound defect-density).
For biaxial liquid crystals, the free energy per site as a function of the order parameter and temperature show competing Landau minima in the OP, that vary with , and yield a first order transition [65, 68].
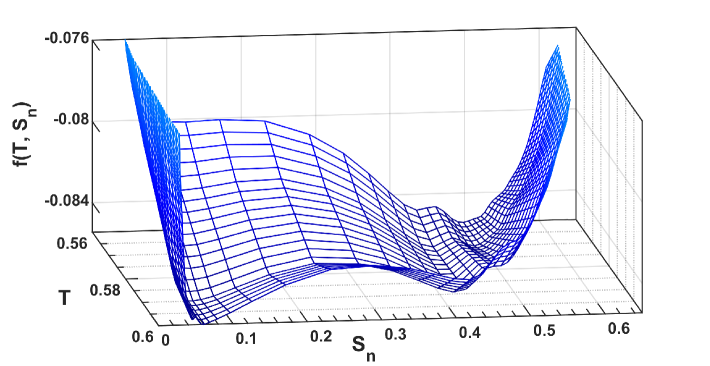
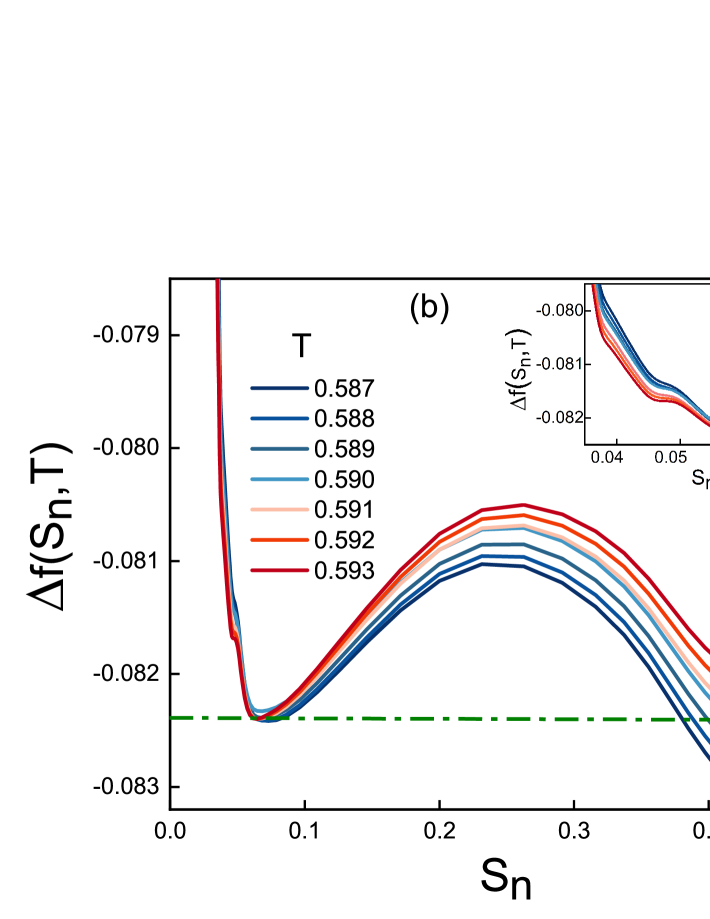
For uniaxial liquid crystals, Fig. 7(a) shows the Landau free energy per site as a 3D mesh covering the nematic transition region. The unusual shape is of a ‘tilted washboard’ potential. Fig. 7(b) shows that subtracts the background value at zero OP for each . The two main minima are degenerate at the vanishing of the temperature deviation where . Thus the finite-scale precursor transformation at controls access to the downhill run towards the system-scale phase transition at , where simultaneously, there are spikes in the specific heat and nematic susceptibility, and an onset of nematic LRO.
A toy model for a (tilted) third-order transition at , could be written as with a tilt field . (Here the order parameter could be a nematic OP plus a constant.) For the large-OP minimum is favoured.
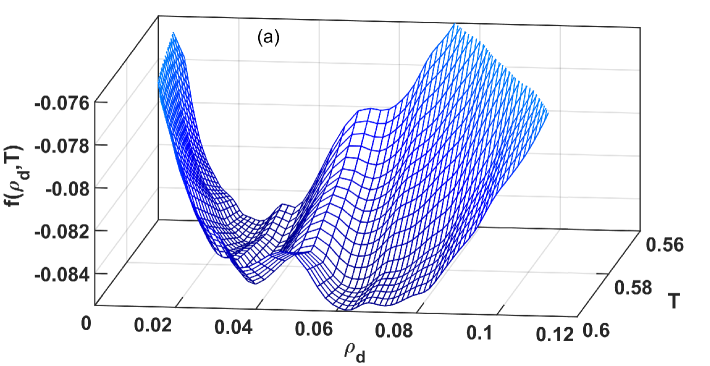
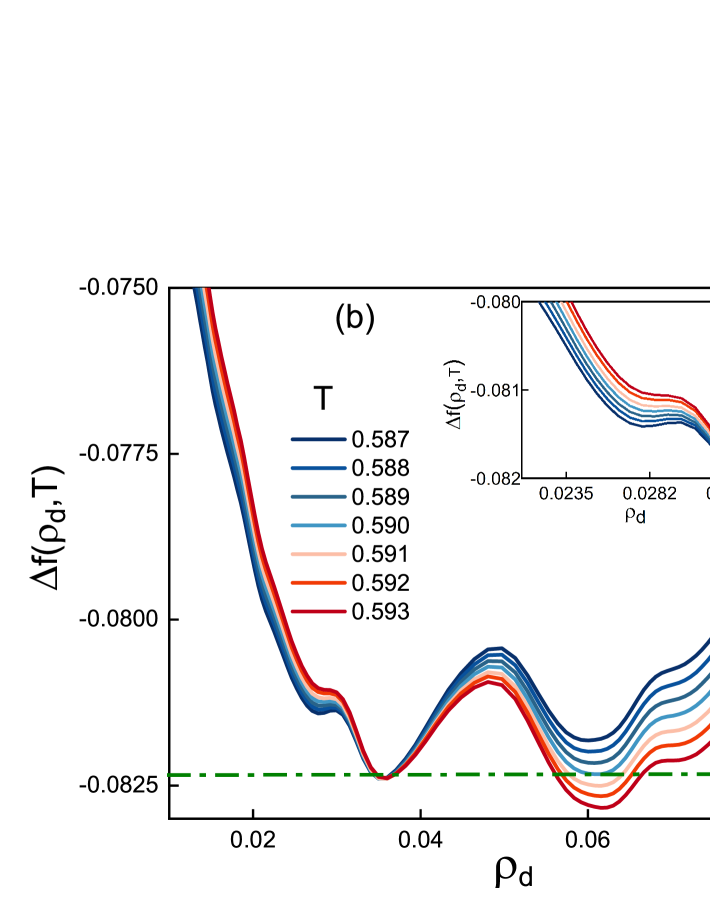
Fig. 8(a) shows the free energy as a 3D mesh: the disorder parameter mesh is complementary to the order parameter. On cooling, the disorder parameter decreases as the order parameter increases. Fig. 8(b) shows that subtracts for each T, the background value at zero defect density . The two main minima are degenerate at the same precursor as for the OP of Fig. 7(b).
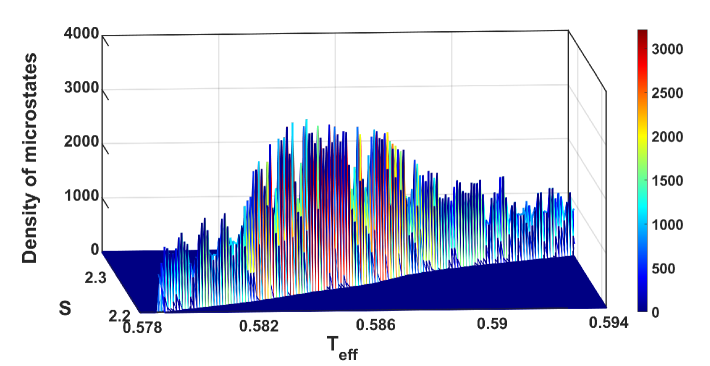
Fig. 9 depicts the distribution of states during the energy-uniform Random Walk across the entropy barrier region, shown as a mesh plot projected on the bin-level plane. There is a manifest accumulation of states in the entropy barrier region.
Computational details:
An efficient algorithm to estimate accurately the density of states (DoS)
of the system was proposed [23, 24], by effecting a suitably biased
Random Walk (RW) over the energy range of interest. Subsequently,
algorithmic performance was significantly enhanced by successively
guiding the walk preferentially to lower energy/entropy regions [25]
by an adaptive sampling method. This involves tracking periodically, the
range of the higher energy region over which the DoS has converged
satisfactorily, and identifying a lower energy bound or frontier.
A small positive constant value, or boost, was added to the DoS for
all energies above the frontier . This forced the system to perform
a RW mostly in the low energy/entropy region beyond the frontier, till its
DoS built up enough, to match the value of the boost.
Further frontiers were sequentially introduced, making the system progress systematically towards a specified lowest energy limit, thereby determining the system DoS over the range of energies, to a desired tolerance [23, 24, 25, 29]. The quality of convergence was tested by examining the uniformity of a RW, carried out with the inverse bias of the DoS so determined. The usually acceptable standard deviation of the distribution is . This modified Wang-Landau algorithm augmented with frontier-sampling was applied to liquid crystals with continuous-spin degrees of freedom [27], yielding EAMC protocols for uniaxial and biaxial liquid crystals. Such protocols were used in the earlier work [12].
Recently, better convergence of the DoS was attempted by making the boost value energy-dependent, gradually increasing it as lower energy regions are accessed. This indeed resulted in an improved convergence of the DoS, with a lower standard deviation . The algorithm of course, reproduced the previous physical results [12]. The characteristic temperatures obtained had only a uniform upward shift of , with differences unchanged. The version of EAMC used in this paper (finding , ), incorporated the improved convergence from the energy-dependent boost.