A Comprehensive Characterization of Galaxy-Cool CGM Connections at
with DESI Year 1 Data
Abstract
We investigate the relationships between the properties of the cool circumgalactic medium (CGM), traced by Ca II absorption lines, and those of galaxies at by utilizing a galaxy-quasar pair sample compiled from the Year 1 data of the Dark Energy Spectroscopic Instrument (DESI). This large dataset, containing galaxy-quasar pairs within , enables us to obtain composite spectra with sensitivity reaching to level and to explore the Ca II absorption as a function of stellar mass, SFR, redshift, and galaxy types, including AGNs. Our results show a positive correlation between the absorption strength and stellar mass of star-forming galaxies with over three orders of magnitude in stellar mass from to , while such a mass dependence is weaker for quiescent galaxies. For galaxies with similar mass, we find that Ca II absorption is stronger around star-forming galaxies than around quiescent galaxies especially within the inner regions () of the halos. Among star-forming galaxies, the Ca II absorption further correlates with SFR, following . However, in contrast to the results at higher redshifts, we find that stronger absorption around star-forming galaxies is not preferentially observed along the minor axis of galaxies, indicating a possible redshift evolution of CGM dynamics resulting from galactic feedback. Moreover, no significant difference between the properties of the cool gas around AGNs and galaxies is detected. Finally, we measure the absorption profiles with respect to the virial radius of dark matter halos and estimate the total Ca II mass in the CGM. The results show that the CGM contains a metal mass comparable to the metal mass in the ISM of galaxies.
1 Introduction
The circumgalactic medium (CGM) contains signatures of complex physical processes that regulate gas flowing in and out of galaxies and drive galaxy evolution (see Tumlinson et al., 2017; Péroux & Howk, 2020; Faucher-Giguère & Oh, 2023, for reviews on the topic of the CGM). Therefore, observed properties of the CGM and its connection to the properties of galaxies have been considered as crucial constraints on the models of galaxy evolution, especially the subgrid models implemented for the feedback processes driven by the explosions of massive stars and the activities of supermassive black holes (e.g., Liang et al., 2016; Ford et al., 2016; Anglés-Alcázar et al., 2017; Oppenheimer et al., 2018). To probe the properties of the CGM, absorption line spectroscopy has been widely used (e.g., Bahcall & Spitzer, 1969; Bergeron, 1986; Chen et al., 2010; Nielsen et al., 2013; Tumlinson et al., 2013; Zhu et al., 2014; Lan et al., 2014; Anand et al., 2021; Bouché et al., 2025). By observing the spectra of background sources intercepting the CGM of galaxies, one can detect absorption line features induced by various transitions of elements, and investigate the properties of the circumgalactic gas, such as the radial distribution, kinematics, abundance, metallicity, and gas density, and explore how they correlate with the properties of the galaxies (e.g., Zych et al., 2009; Zhu et al., 2014; Lan et al., 2014; Nielsen et al., 2017; Pointon et al., 2019; Lan, 2020; Anand et al., 2021; Nateghi et al., 2024; Lehner et al., 2024; Cherrey et al., 2025).
Multi-wavelength observations are required to investigate the galaxy-CGM connections at different redshifts owing to the accessibility of strong absorption-line transitions. At , UV spectrographs, COS and STIS (Green et al., 2012; Woodgate et al., 1998), on the Hubble Space Telescope have been used to detect absorption species, such as H I, O I, O VI, C II, C IV, Si II, and Si III, tracing gas in various physical conditions (e.g., Tumlinson et al., 2013; Werk et al., 2013, 2014; Bordoloi et al., 2014; Liang & Chen, 2014; Borthakur et al., 2015, 2016; Werk et al., 2016; Prochaska et al., 2017; Chen et al., 2020, 2020; Tchernyshyov et al., 2023; Zheng et al., 2024). These measurements have led to new explorations of the nature and origins of the multiphase CGM. However, given the sensitivity of the current instruments, only bright quasars can yield UV spectra with sufficient sensitivity for absorption line studies (e.g., Tumlinson et al., 2013). This in turn limits the number of galaxy-quasar pairs and the parameter space of galaxy properties available for galaxy-CGM correlation analysis. On the other hand, at , optical spectra can be used to investigate the connection between galaxies and the cool CGM traced by Mg II absorption lines, one of the key accessible absorption species at optical wavelengths (e.g., Nestor et al., 2005; Chen et al., 2010; Nielsen et al., 2013; Zhu & Ménard, 2013a; Anand et al., 2021; Huang et al., 2021; Chen et al., 2023; Guha et al., 2024; Zou et al., 2024; Bouché et al., 2025). With large optical spectroscopic datasets provided by sky surveys, such as the Sloan Digital Sky Surveys (SDSS; York et al. 2000) and the Dark Energy Spectroscopic Instrument (DESI; Levi et al. 2013), statistical samples, consisting of thousands of galaxy-quasar pairs, have been built and used to measure the properties of the cool CGM as a function of galaxy properties, including stellar mass, star-formation rate (SFR) and AGN activity, across redshifts (e.g., Zhu & Ménard, 2013a; Lan et al., 2014; Lan, 2020; Anand et al., 2021; Chang et al., 2024; Wu et al., 2024), revealing correlations between the cool CGM and galaxy properties. However, observational measurements of these correlations at low redshifts are still limited, and therefore whether the relationships between galaxies and the cool CGM detected at exist at lower redshifts remains to be addressed.
At , while the majority of absorption transitions are in the UV wavelength regions, the Ca II doublet H () and K () lines, which trace cool gas at – similar to Mg II and Lyman-alpha absorbers – are accessible in optical wavelengths. Despite the fact that Ca II lines are weak – which restricts individual detections to high column density systems (e.g., Wild et al., 2006; Hewett & Wild, 2007; Nestor et al., 2008; Zych et al., 2009; Richter et al., 2011; Sardane et al., 2014, 2015; Zou et al., 2018) – one can detect and measure their absorption strengths around galaxies via high S/N composite spectra obtained by statistically combining many individual spectra (e.g., Steidel et al., 2010; Bordoloi et al., 2011; Zhu et al., 2014; Pieri et al., 2014; Lan & Mo, 2018; Wu et al., 2024). With this approach, Zhu & Ménard (2013b) demonstrated that Ca II absorption features can be detected and used to explore the cool CGM properties around galaxies with at using galaxy and quasar spectroscopic datasets from the SDSS. Combining this method with spectroscopic datasets covering a wider range of galaxy properties, one can further obtain a more comprehensive characterization of the galaxy-cool CGM connections at low redshifts and compare with such connections observed at higher redshifts.
In this work, we utilize the large spectroscopic data provided by the DESI survey (DESI Collaboration et al., 2016a, b) to measure the properties of the cool CGM traced by Ca II as a function of galaxy properties, including SFR, stellar mass, redshift, and azimuthal angle, covering a parameter space that has rarely been probed previously. We describe our sample and the analysis procedure to obtain composite spectra in Section 2. In Section 3, we present our results. In Section 4, we compare our results with previous studies and discuss the implications of our findings. Finally, we conclude our results in Section 5. Throughout this paper, we adopt a flat CDM model with and .
2 Data analysis
2.1 DESI galaxy and quasar catalogs
The Dark Energy Spectroscopic Instrument (DESI) project is designed to measure the expansion rate of the Universe across cosmic time by using galaxies, quasars, and gas as tracers of large-scale structure at different redshifts (Levi et al., 2013; DESI Collaboration et al., 2022). To this end, a dedicated spectroscopic observational program has been developed utilizing an instrument consisting of 10 spectrographs and 5000 fibers (Silber et al., 2023; Miller et al., 2024). DESI primarily obtains spectra of four types of extragalactic sources at different redshift ranges, including galaxies that can be observed during the bright time targeted by Bright Galaxy Survey (; Hahn et al. 2023), luminous red galaxies (; Zhou et al. 2023), emission-line galaxies (; Raichoor et al. 2023) and quasars (; Chaussidon et al. 2023). These sources are selected based on the images of the DESI Legacy Imaging Surveys (Dey et al., 2019). The wavelength coverage of DESI spectra is from 3600 to 9800 Å with the spectral resolution varying from to 5000 for the blue camera to the NIR camera. The raw spectroscopic data are processed with a pipeline developed by Guy et al. (2023). In addition, an automatic pipeline, called redrock111https://github.com/desihub/redrock, is developed and used for determining the redshifts of the sources from the spectra (Bailey et al. 2024; see also Anand et al. 2024). In order to maximize the efficiency of the survey, dedicated algorithms and codes have also been developed for target selection (Myers et al., 2023), fiber assignments (Raichoor et al., 2024) and survey operations (Schlafly et al., 2023). Prior to the main spectroscopy survey, DESI has undergone the “Survey Validation (SV)” (DESI Collaboration et al., 2024a) to validate the performance of the target selections. The five-month spectroscopic data from Survey Validation was released in June 2023 as part of Early Data Release (DESI Collaboration et al., 2024b).
In this work, we use the Year 1 dataset of the DESI survey (DESI Collaboration et al., 2024), which has yielded new measurements for constraining the expansion history of the Universe from to 2 (DESI Collaboration et al., 2024c, d, e, f, g, h; DESI Collaboration et al., 2025). More specifically, we construct our foreground galaxy and background source samples with the following two components:
-
•
Bright Galaxy Survey (BGS): We use galaxies with observed in the bright galaxy survey as our foreground galaxies. The BGS sample consists of two selections, BGS bright and BGS faint samples. The BGS bright sample is selected with mag, and the BGS faint sample is selected with magnitude and color cuts (Hahn et al., 2023). Moreover, following the criteria from Hahn et al. (2023) and Lan et al. (2023), we select galaxies with (the difference of between the second and the first best-fit spectral models from redrock).
Besides the redshift information, we use the physical properties of the BGS galaxies, including the stellar mass () and star-formation rate (SFR), provided by Siudek et al. (2024). The authors use the CIGALE package (Boquien et al., 2019) for spectral energy distribution fits to observed magnitudes in the , , , WISE 1 and WISE 2 bands extracted by the Tractor algorithm (Lang et al., 2016). The final fitting results exclude sources with low signal-to-noise ratio in photometry and poor fitting quality. For details, we refer the readers to Siudek et al. (2024).
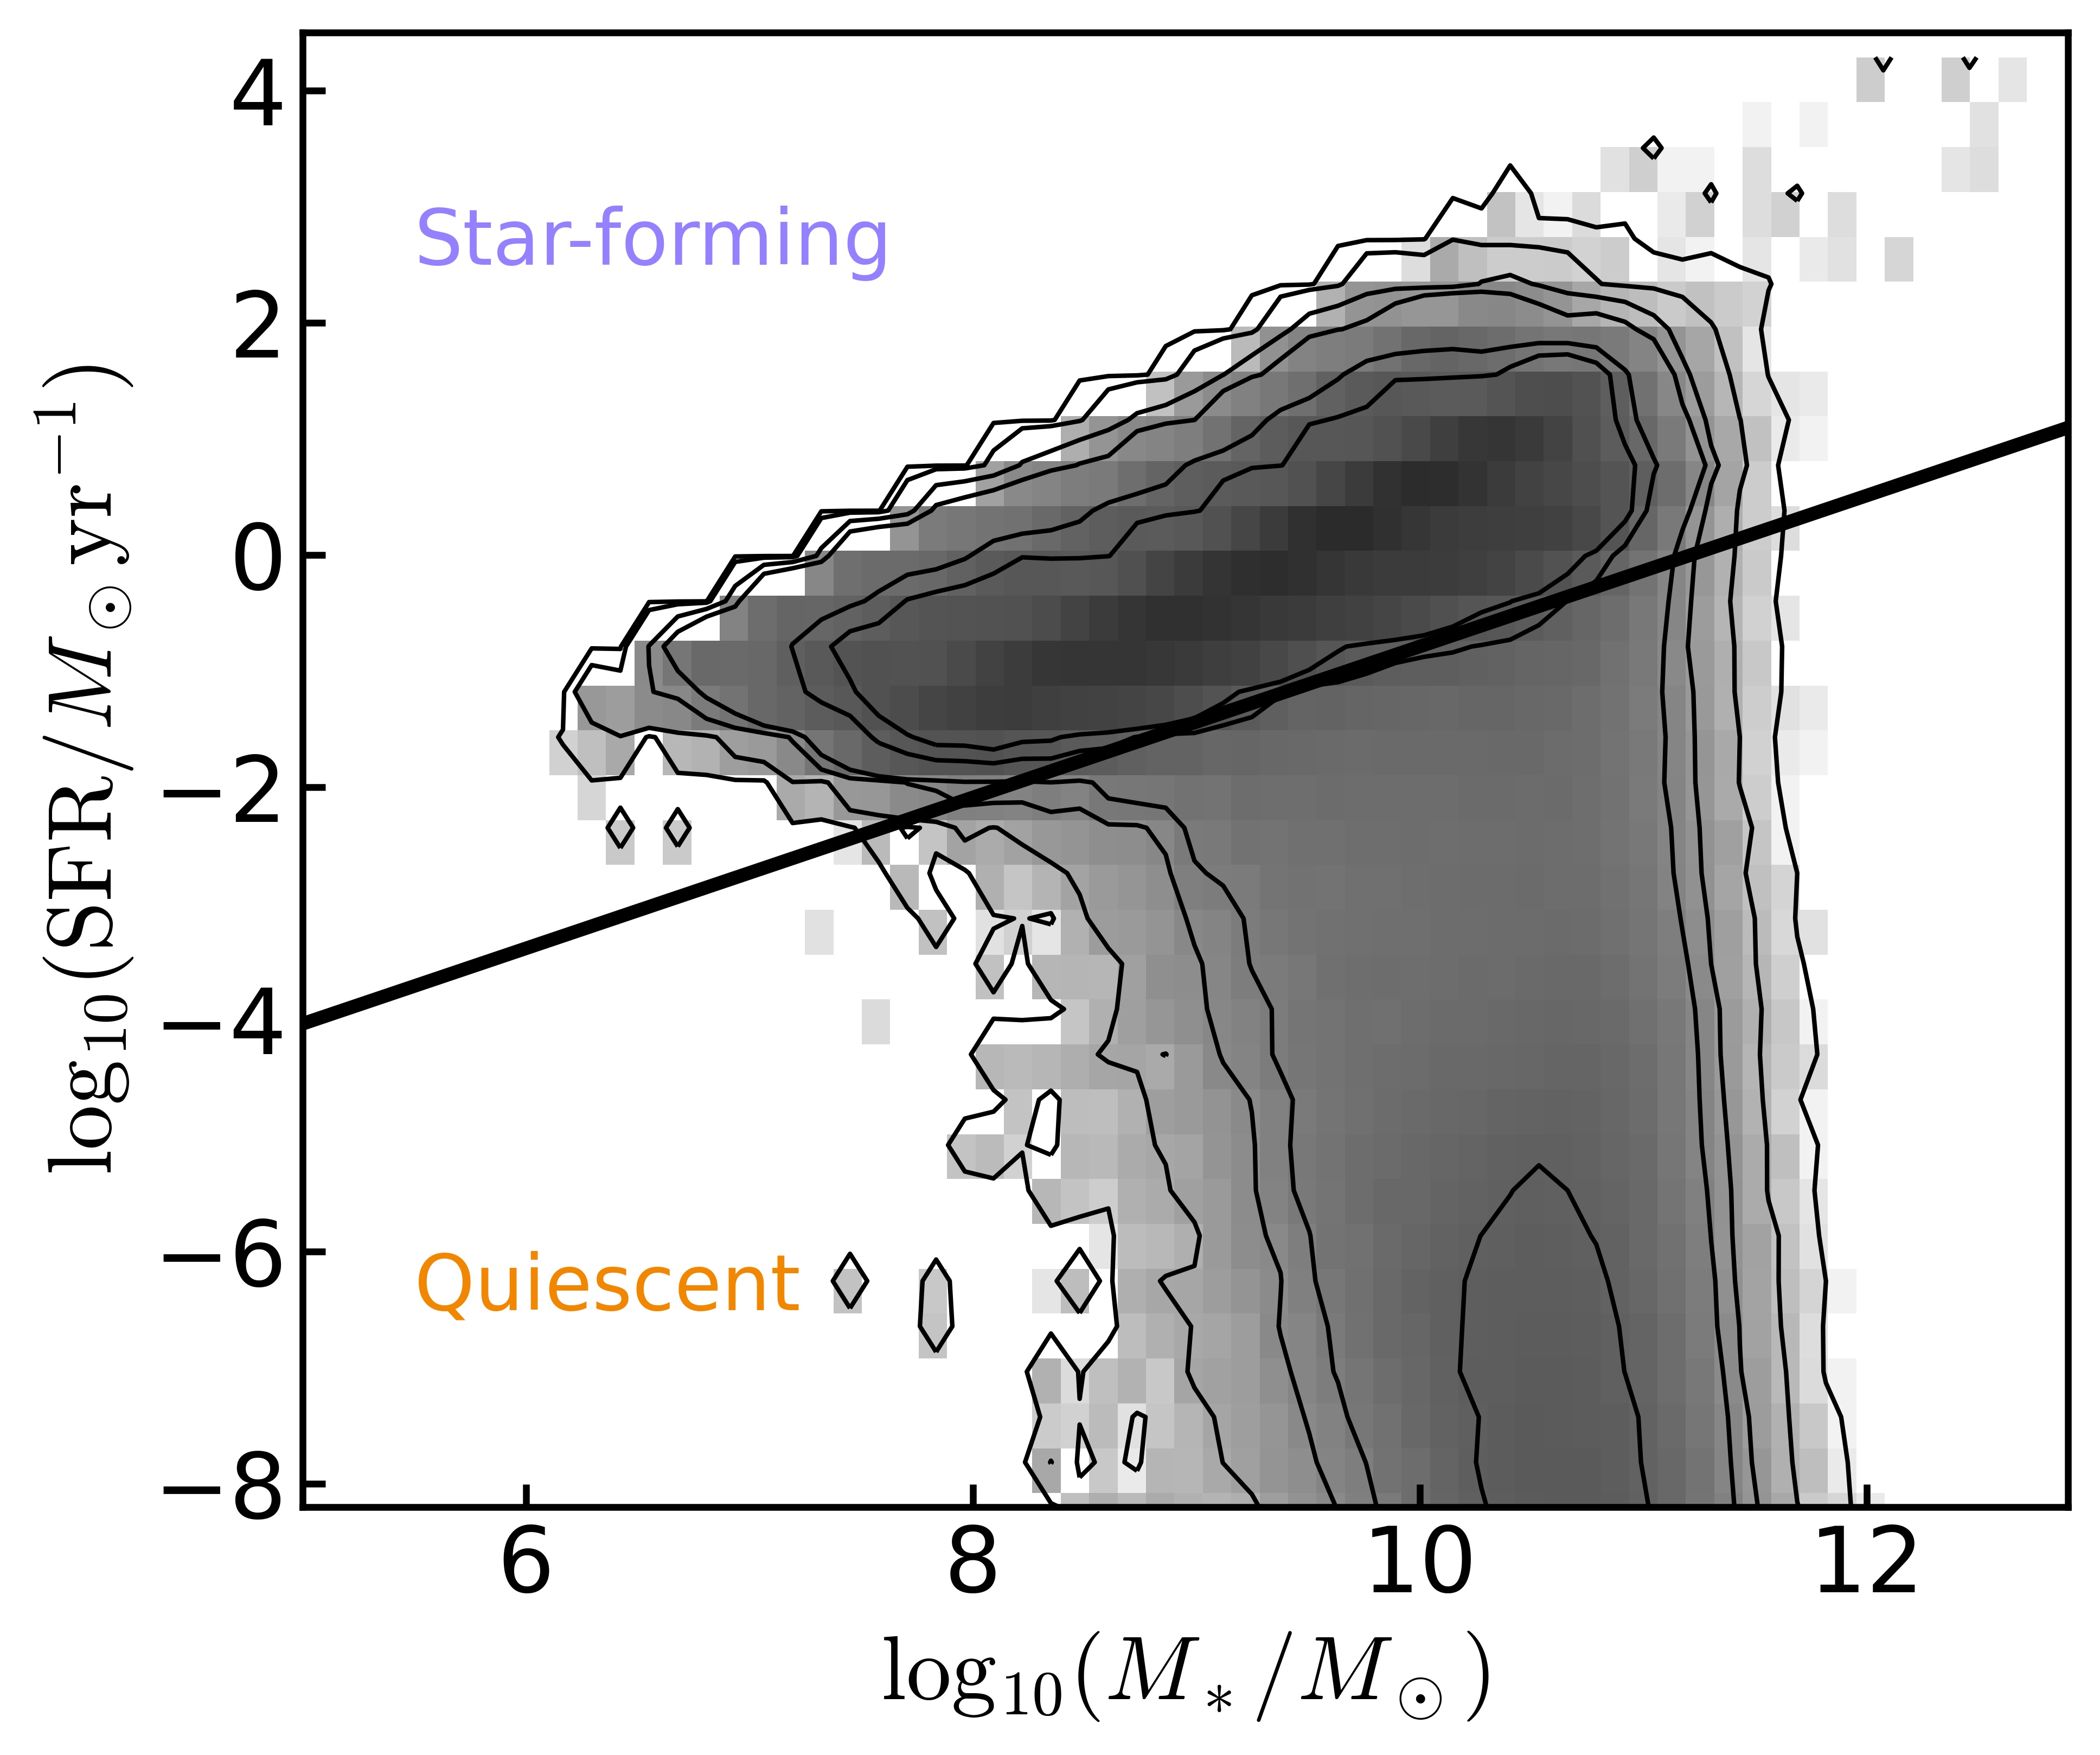
Figure 1 shows the stellar mass and SFR distribution of the BGS galaxy sample used in this analysis. To separate star-forming galaxies and quiescent galaxies, we adopt the following relation (black solid line) from Zhu & Ménard (2013b), which was derived from a sample of galaxies with a mean redshift ,
(1) As shown in the figure, the BGS sample includes star-forming galaxies with down to allowing us to probe the CGM of galaxies with mass across 3-4 orders of magnitude. The median mass uncertainty of the sample is 0.12 dex. For SFR, the typical uncertainties are 0.3 dex for star-forming galaxies and 8.1 dex for quiescent galaxies. We note that the reported uncertainty is in logarithmic scale. For quiescent galaxies with low estimated SFR (), the corresponding uncertainty in linear scale is . This precision is sufficient for classifying galaxies into star-forming and quiescent ones.
In addition, we construct an AGN sample by selecting sources located in the AGN and composite regions (Kewley et al., 2006) of the BPT diagram (Baldwin et al., 1981). For this selection, we require a signal-to-noise ratio greater than 2 for the , , [O III] 5007, and [N II] 6584 emission lines. The flux measurements for these lines are provided by the FastSpecFit222https://fastspecfit.readthedocs.io/en/latest/ Spectral Synthesis and Emission-Line Catalog (FastSpecFit 2.1) (Moustakas et al., 2023).
-
•
Quasars: For the background sources, we use the quasar sample which is selected with a random forest algorithm combining magnitude and color information (Chaussidon et al., 2023). Similar to the BGS sample selection, we apply to obtain sources with robust redrock redshift measurements (Alexander et al., 2023).
With the galaxy and quasar samples, we construct the galaxy-quasar pair sample by requiring (1) and (2) , ensuring that the Ca II lines fall outside the Lyman alpha forest of the background quasar to avoid contamination. This yields a sample with impact parameter having 855,703 galaxy-quasar pairs with 623,053 unique BGS galaxies and 496,756 unique QSOs. The median redshift of the unique BGS galaxies is .
2.2 Constructing composite spectra
To extract the absorption lines from the quasar spectra, we first employ a dimensional reduction technique, called nonnegative matrix factorization (NMF) (Lee & Seung, 1999), with code333https://github.com/guangtunbenzhu/NonnegMFPy developed by Zhu & Ménard (2013a) and Zhu (2016). With NMF, we normalize the observed quasar spectrum by the reconstructed continuum, derived from a basis set of NMF eigenspectra built from SDSS DR7 quasars (Schneider et al., 2010; Zhu & Ménard, 2013a), to remove the spectral features intrinsic to the quasar. To further remove fluctuations not captured by the NMF method, we obtain a smooth continuum by applying a median filter with a window size of 71 pixels () to the NMF normalized spectrum and divide the NMF normalized spectrum by the smooth continuum. The window size is empirically chosen to be large enough to ensure sensitivity to the continuum rather than the absorption itself, which spans about 5 pixels (a full width at half maximum of ). We then shift the normalized quasar spectra to the rest frame of the foreground galaxies, and resample them onto a common wavelength grid with a resolution matching that of the DESI spectra when the doublet line is redshifted to (). We obtain composite spectra with a median estimator to mitigate the contributions from spectral outliers that occasionally occur. Finally, to account for a sub-percent of zero-point offset, the final composite spectrum is obtained by normalizing the composite spectrum by the median value of the pixels within 3900 and 4100 with the pixels within 5 of Ca II K and H lines being masked. The uncertainties of the median composite spectra are estimated by bootstrapping the samples 500 times.
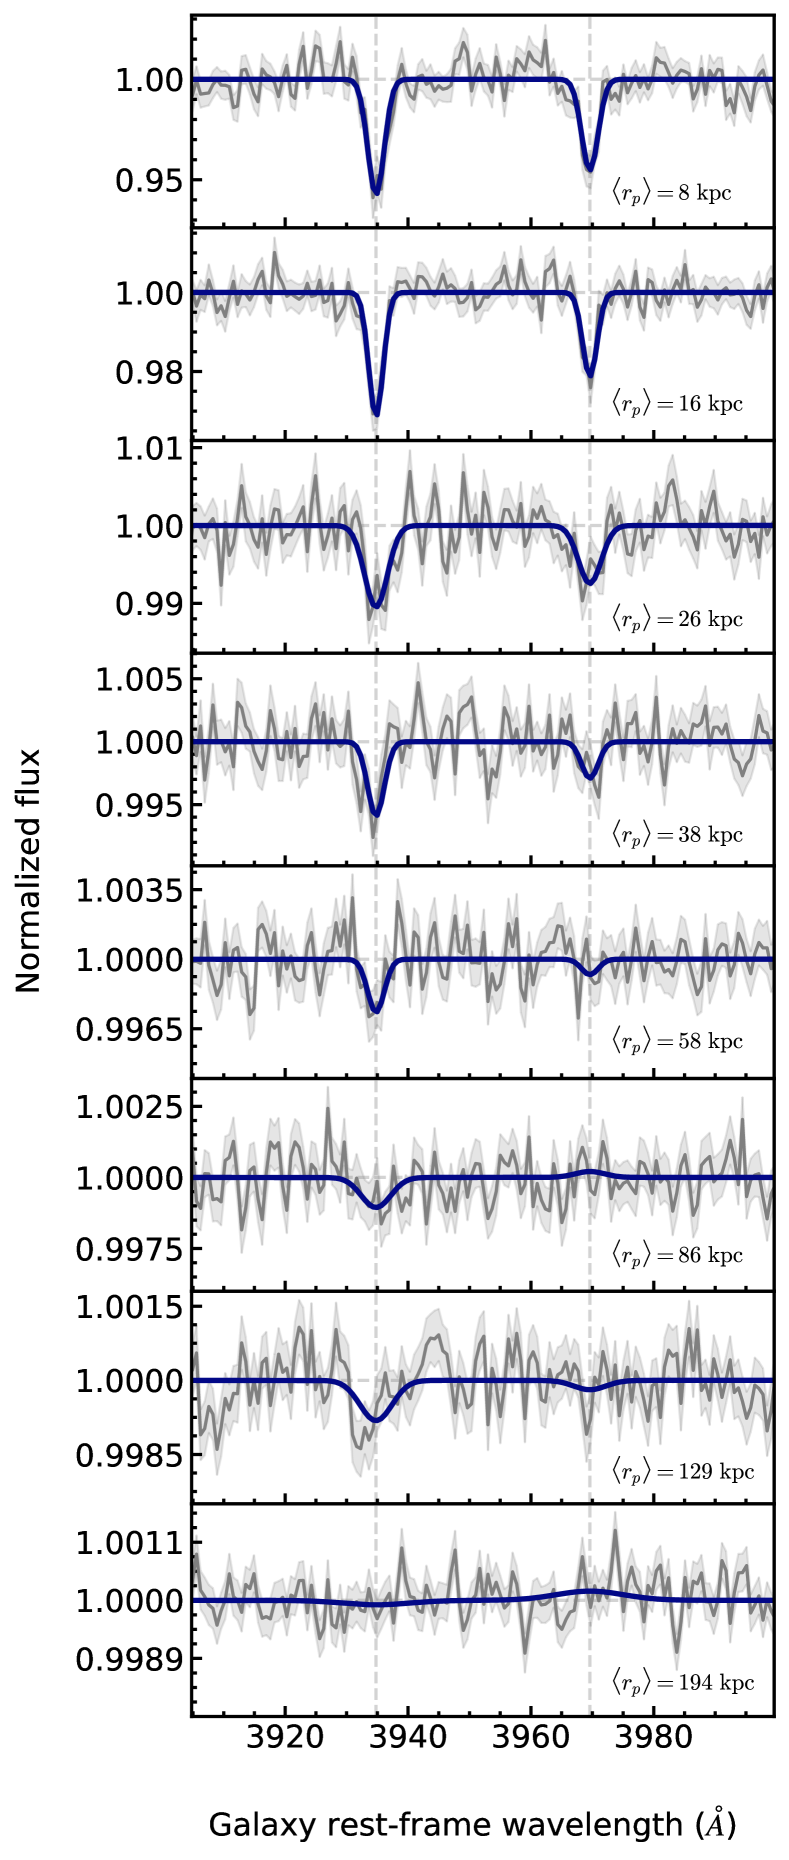
To measure the Ca II rest equivalent width, we fit the composite spectra with two Gaussian profiles, fixing the central wavelengths at 3934.78 Å (Ca II K) and 3969.59 Å (Ca II H). The amplitudes and line widths are free parameters, but the widths of both lines are enforced to be the same. Throughout this work, we report the sum of the rest equivalent widths of the Ca II K and H lines, denoted as . The uncertainties of the rest equivalent width are based on fitting the 500 bootstrapped samples and taking the standard deviation. Figure 2 shows examples of composite spectra as a function of impact parameter; the best-fit profiles are shown by the blue lines.
3 Results
3.1 Dependencies on galaxy properties
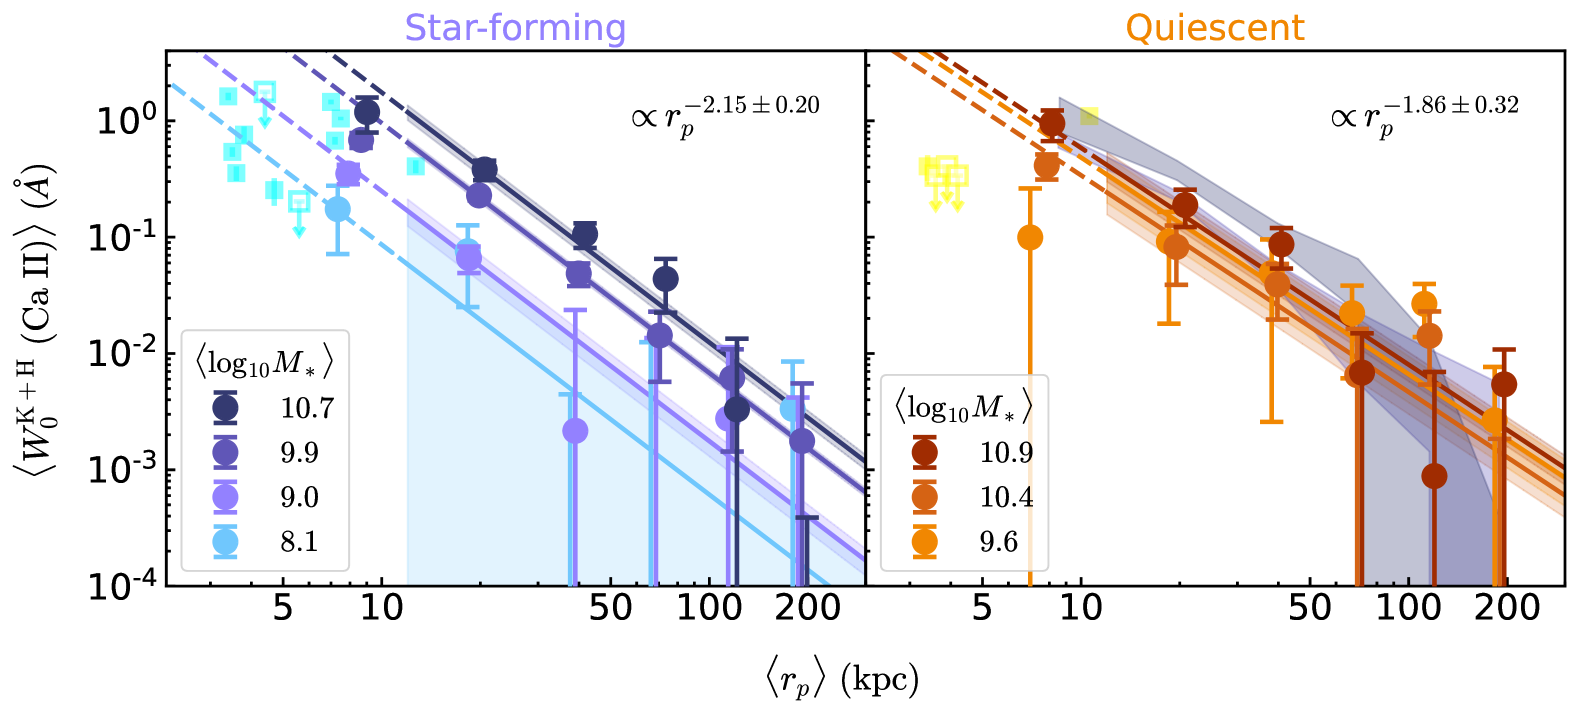
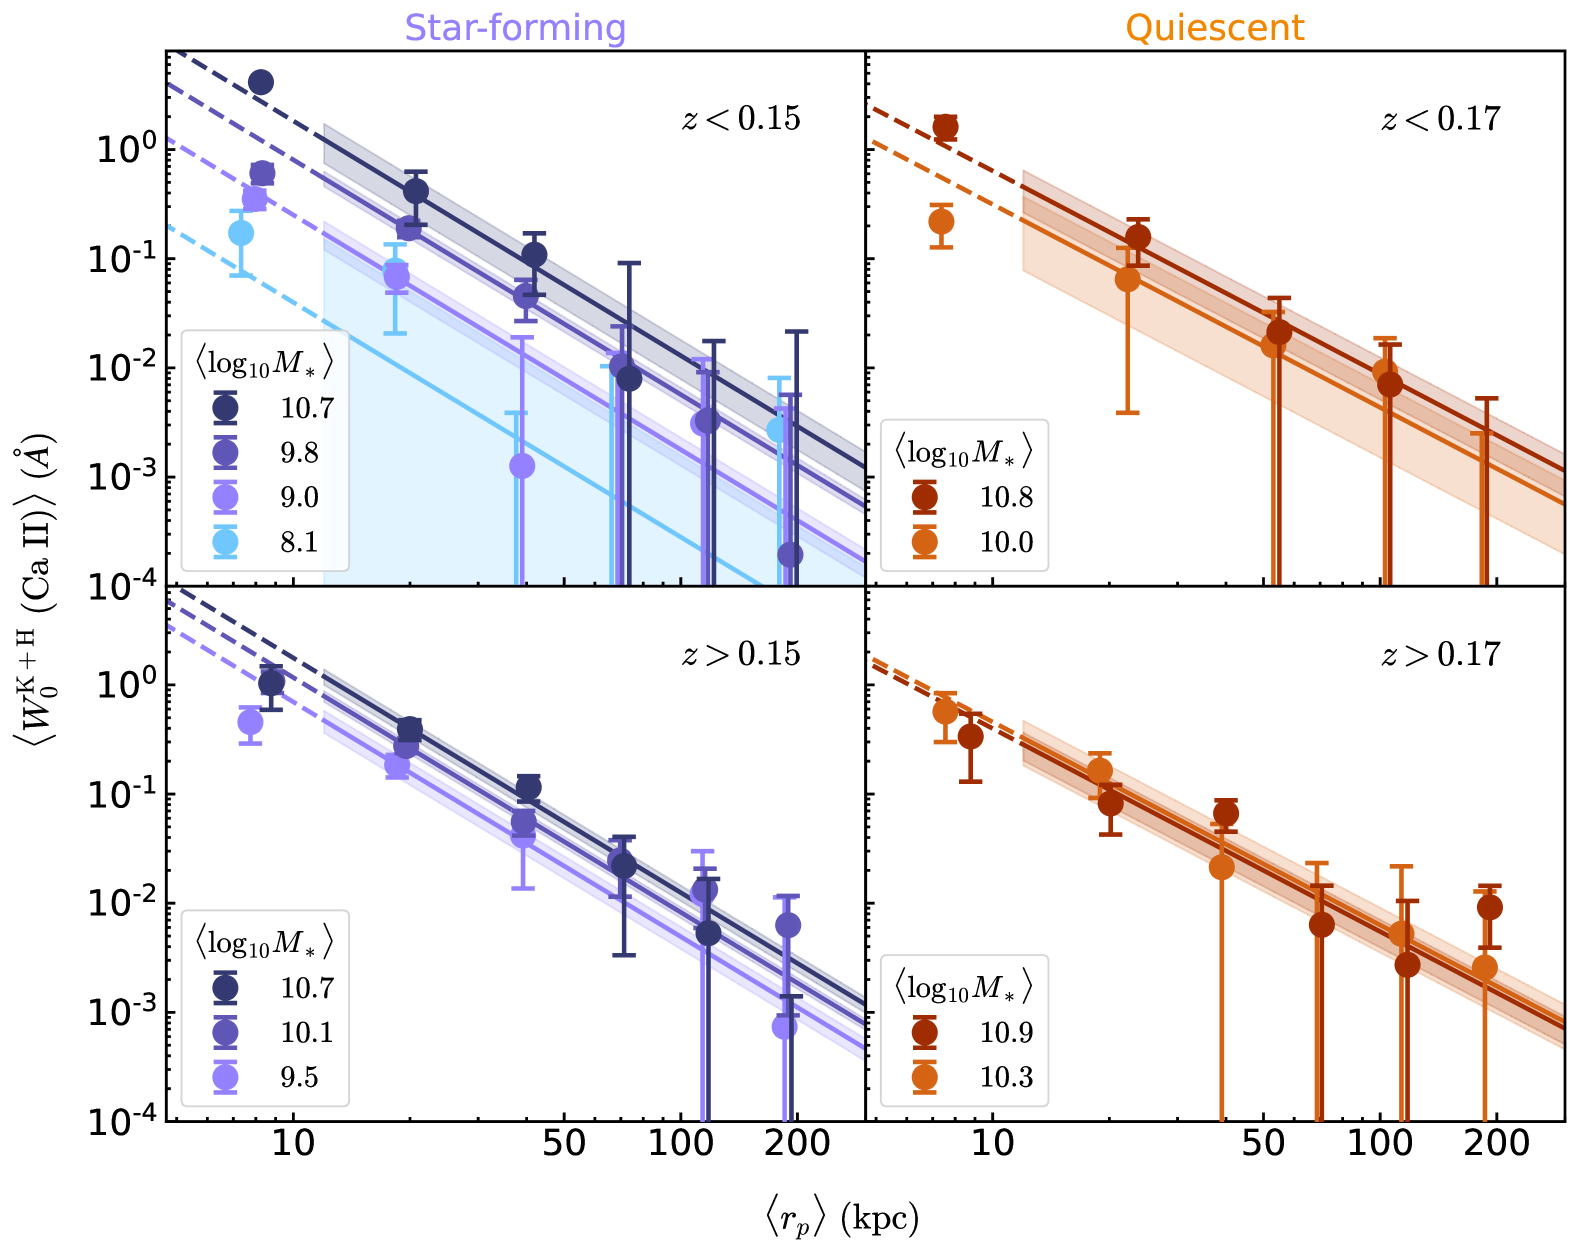
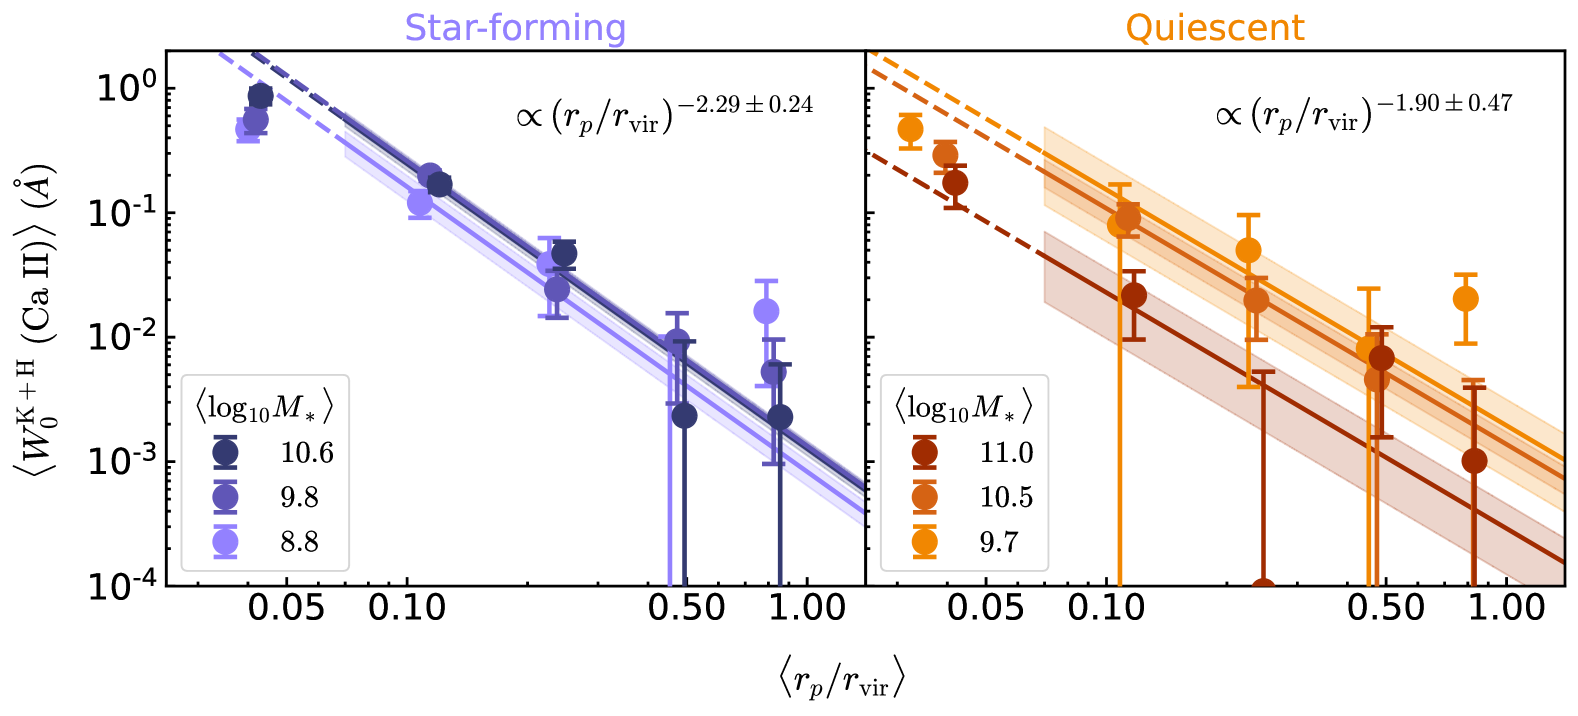
With the large number of galaxy-quasar pairs across a wide range of galaxy properties, we first investigate the Ca II rest equivalent width as a function of impact parameter and stellar mass, comparing star-forming and quiescent galaxies. The results are shown in Figure 3 with the left and right panels indicating the Ca II rest equivalent width as a function of impact parameter around star-forming and quiescent galaxies, respectively, with different stellar masses indicated by the colors. The number of pairs is summarized in Table 3.1. We find several trends which are described in the following:
| -variable | Galaxy type | aaMedian quantities of pairs with the ranges of lower and upper limits. | aaMedian quantities of pairs with the ranges of lower and upper limits. | Number of pairsbb for the measurements as a function of , and for the measurements as a function of | ||
|---|---|---|---|---|---|---|
| Star-forming | 139946 | |||||
| 263731 | ||||||
| 285305 | ||||||
| 47469 | ||||||
| 139874 | ||||||
| 249580 | ||||||
| 147123 | ||||||
| 12413 | ||||||
| 32145 | ||||||
| 120188 | ||||||
| 35056 | ||||||
| Quiescent | 61976 | |||||
| 134889 | ||||||
| 116110 | ||||||
| 117276 | ||||||
| 61702 | ||||||
| 31112 | ||||||
| 102885 | ||||||
| AGN | 39559 | |||||
| Star-forming | 69724 | |||||
| 154246 | ||||||
| 143798 | ||||||
| Quiescent | 28399 | |||||
| 143912 | ||||||
Mass dependence: The absorption strengths of Ca II correlate with the masses of star-forming galaxies and quiescent galaxies differently. The exhibits an increasing trend with the stellar mass of star-forming galaxies, whereas this trend is much weaker for quiescent galaxies, albeit with large uncertainties. To further quantify these correlations, we fit the with a simple power-law relation,
| (2) |
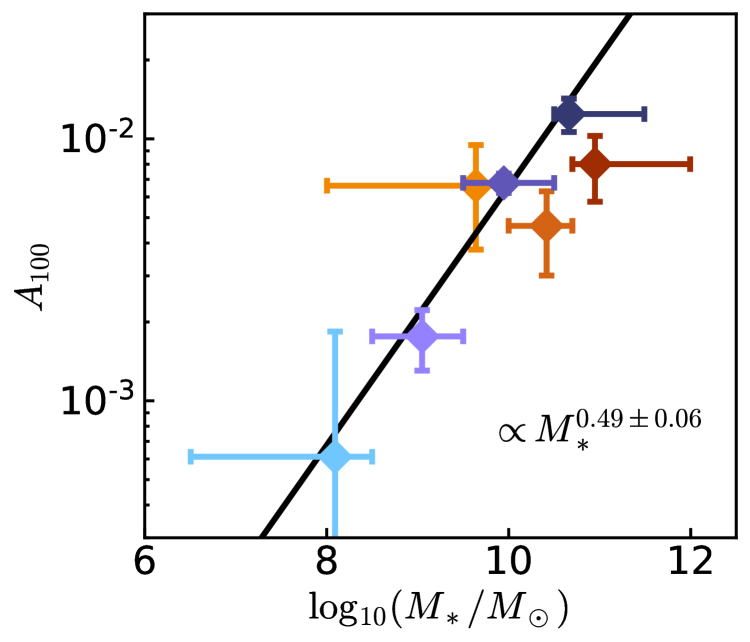
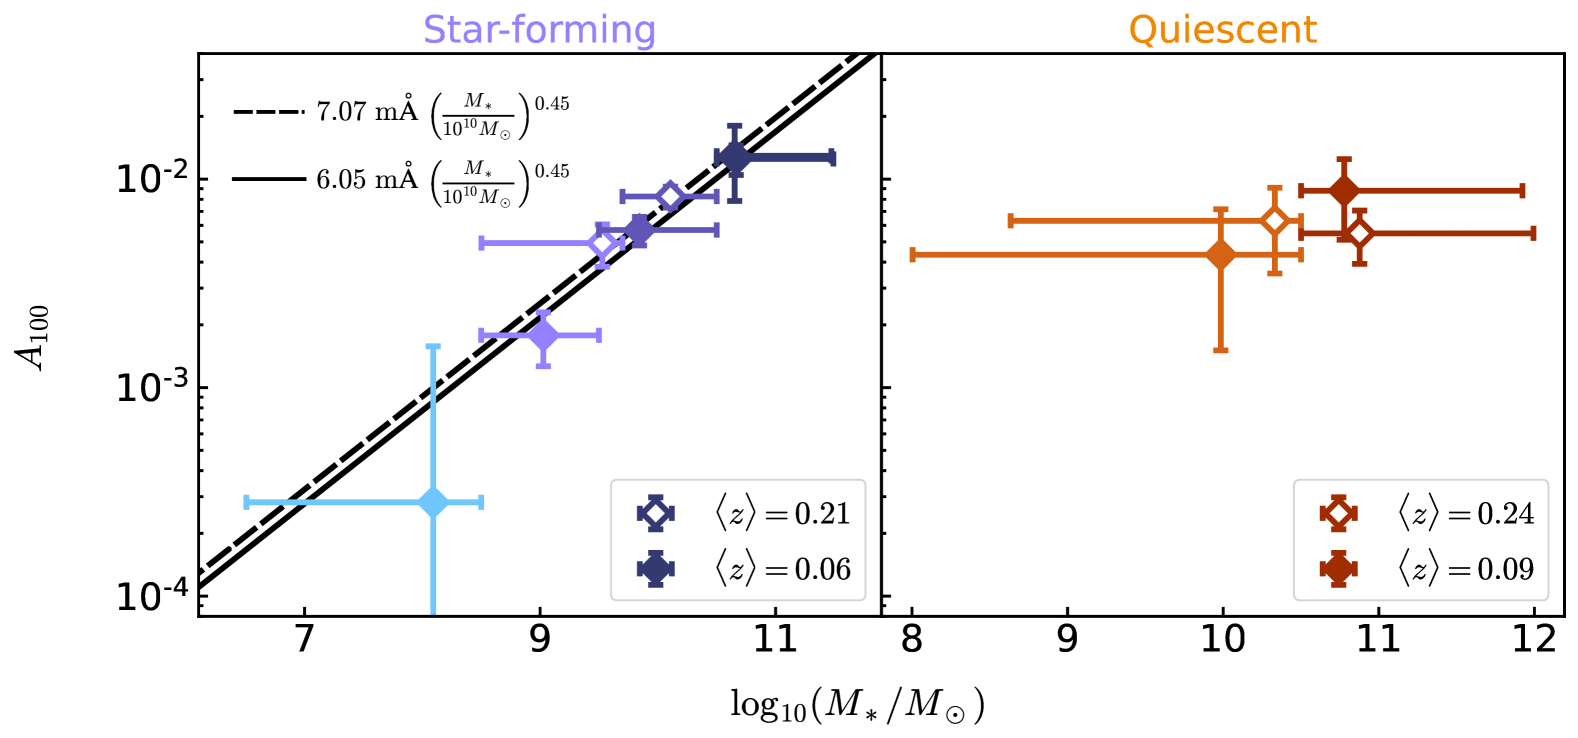
where is the equivalent width around galaxies at . We first perform a global fitting to obtain the best-fit parameter for each type of galaxies, assuming that the radial variations for the same type of galaxies are the same. We then fix the parameters and obtain the best-fit amplitude for each stellar mass bin. Note that we do not include measurements within 10 kpc as the sight-lines are expected to also intersect the ISM of foreground galaxies, affecting our interpretations for the CGM. The best-fit profiles are shown by the color solid lines in Figure 3 with the best-fit parameter values listed in Table 3.1. The best-fit amplitudes, , as a function of stellar mass are shown in Figure 4 with the colors representing the corresponding subsamples as in Figure 3. The results demonstrate that Ca II absorption strengths around star-forming galaxies at exhibit a mass dependence which can be described by
| (3) |
with best-fit parameter values being , and . On the other hand, the absorption strengths around quiescent galaxies do not depend significantly on stellar mass.
Galaxy type dependence: In addition to the difference of mass dependence, for massive galaxies () with similar mass, at , the absorption strengths around star-forming galaxies are higher than those around quiescent galaxies. By way of illustration, in the right panel of Figure 3, we show the Ca II measurements star-forming galaxies with and . Comparing with the two highest stellar-mass bins of quiescent galaxies, the Ca II absorption within 50 kpc around and star-forming galaxies is twice as strong as the absorption around and quiescent galaxies, despite the star-forming galaxies having lower masses. This indicates that the cool gas distributes around star-forming and quiescent galaxies differently when one controls for stellar mass.
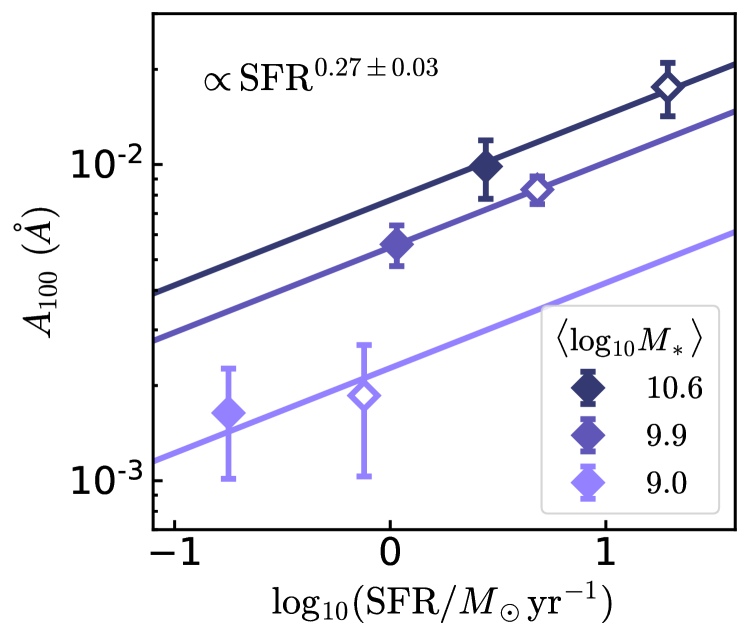
SFR dependence: We further examine the dependence of Ca II absorptions on star formation activity by dividing star-forming galaxies into low and high SFR groups using the equation: The samples for both SFR groups are then divided into three mass bins with matched median masses of , , and . We follow the previous steps to obtain the Ca II absorption strength as a function of impact parameter, fitting the trend globally with . The fitted values are shown in Figure 5. By simultaneously fitting and SFR across the three mass bins, we find a positive correlation between Ca II absorption strength and SFR, following
| (4) |
with , and . This result further supports the connection between the cool CGM and the star formation activity of host galaxies.
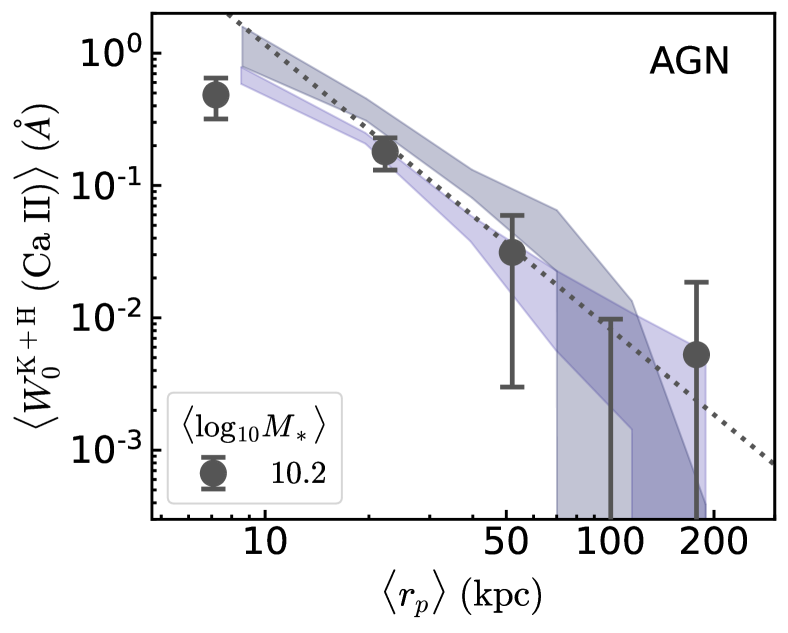
AGN dependence: The large DESI dataset enables us to compare the Ca II absorption signal around galaxies with and without an AGN, as identified with the BPT diagnosis (Kewley et al., 2006). The active galaxies sample includes sources in the composite and AGN regions of the BPT diagram, with a median stellar mass of and a range from to . The results are shown in Figure 6 with the black data points showing the measurements around AGNs and the blue bands showing the measurements around star-forming galaxies with median masses of and for comparison. In addition, the dotted line in Figure 6 shows the expected Ca II profile for star-forming galaxies based on the best-fit relation (Equation 3).
The results show that the Ca II rest equivalent width around AGNs is consistent with that around star-forming galaxies with similar masses, indicating that current AGN activity does not significantly affect the properties of the cool gas traced by Ca II around galaxies. This result is consistent with previous studies, which will be discussed in Section 4.
3.2 Redshift dependence
With the correlations between Ca II absorption and galaxy properties explored, we now investigate the correlation between Ca II absorption and redshift. We separate star-forming and quiescent galaxies at and , respectively, and measure Ca II absorption as a function of stellar mass. The left and right panels of Figure 7 show the results for star-forming and quiescent galaxies, while the upper and lower panels show the results for the low- and high-redshift bins respectively. We also obtain the best-fit amplitudes of power laws (Eq. 2) with fixed parameters obtained previously for star-forming and quiescent galaxies. The best-fit amplitudes are shown in Figure 8. The solid and open data points indicate the measurements at low and high redshifts respectively.
For star-forming galaxies, the best-fit amplitudes of the Ca II absorption strengths increase with stellar masses for both redshift bins. In addition, with a fixed stellar mass, there is a tentative trend showing that the best-fit amplitudes at are slightly higher than those at . We quantify this trend with
| (5) |
and find . The best-fit values of are () and (). This results in
| (6) |
We note that despite the uncertainty, the redshift trend is similar to the redshift evolution observed in the cool gas around galaxies traced by Mg II absorption lines (e.g., Lan, 2020; Schroetter et al., 2021). For example, Lan (2020) showed that the covering fraction of Mg II absorption lines with around star-forming galaxies evolve with redshift as . On the other hand, we do not observe any redshift dependence for Ca II around quiescent galaxies which is inconsistent with the results of Lan (2020) for quiescent galaxies. This might indicate that the cool gas around passive and star-forming galaxies evolve differently. However, further confirmation of such a scenario requires higher S/N measurements of Ca II absorption.
In Lan (2020), the author proposed that the redshift evolution of Mg II covering fraction is connected with the redshift evolution of star-formation rate of galaxies (e.g., Whitaker et al., 2012; Scoville et al., 2017; Koprowski et al., 2024) given that they have similar redshift evolution. For our Ca II measurements, we also estimate the SFR of star-forming galaxies at two redshift bins with stellar mass and find that the ratio between the median SFR, , is . Together with our results indicating a SFR and absorption strength correlation with (Fig. 5), the absorption strength difference ratio is expected to be , which is consistent with the redshift trend observed in Figure 8. This consistency suggests that the redshift evolution of Ca II absorption around star-forming galaxies might be closely related to the star-formation activities of galaxies.
3.3 Azimuthal angle dependence
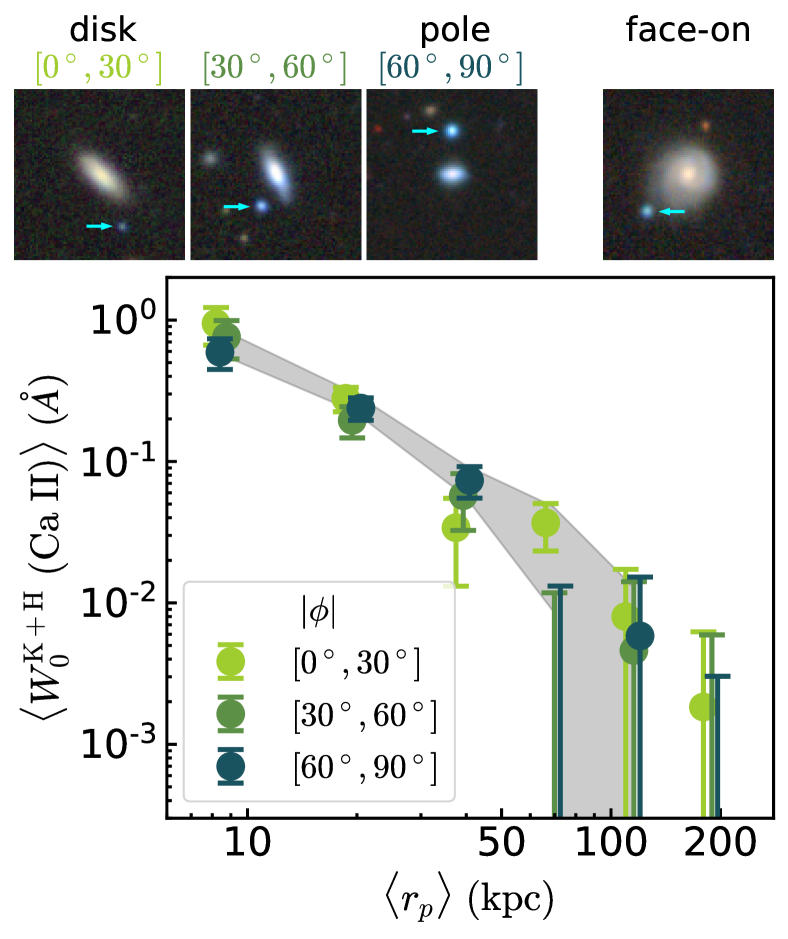
One can further investigate possible mechanisms contributing to gas observed in the CGM by measuring gas absorption around star-forming galaxies as a function of azimuthal angle. This is motivated by the fact that galaxy simulations predict that galactic outflows driven by supernova and black-hole feedback preferentially escape galaxies along the minor axis (e.g., Nelson et al., 2019). To do so, we examine the azimuthal dependence of our sample by choosing star-forming galaxies with and with inclination angle larger than . The inclination angles of galaxies and azimuthal angles between galaxy-quasar pairs are calculated based on the shape information measured via Tractor444https://www.legacysurvey.org/dr9/catalogs/ (Lang et al., 2016) applied to the DESI Legacy Imaging Surveys (Dey et al., 2019). In general, the Tractor performs model-based photometry by simultaneously fitting sources across multiple bands and classifies them as point or extended sources with the point spread function taken into account. Extended sources are further modeled using exponential, de Vaucouleurs, or composite profiles to best represent their light distribution. We then divide the selected sample into three azimuthal angle bins: , and , which correspond to the disk, between disk and pole, and the pole of the foreground galaxies. Galaxy image examples can be found in the upper panel of Figure 9, where the foreground galaxies are located at the centers, while the background quasars are pointed out by cyan arrows.
The results are shown in the lower panel of Figure 9 with colors indicating measurements for different azimuthal angles and the grey band for the measurements of the face-on galaxies. While there is a mild trend showing that the absorption along the major axis decreases faster than the absorption along the minor axis toward larger impact parameters, there is no significant correlation between Ca II absorption and the azimuthal angle. This result is inconsistent with previous results of the cool CGM obtained at higher redshifts, showing preferentially stronger Mg II absorption along the minor axis than along the major axis within 50 kpc (e.g., Bordoloi et al., 2011; Lan et al., 2014; Lan & Mo, 2018). In addition, our results are inconsistent with Ca II measurements from Zhu & Ménard (2013b). The authors reported that the absorption strength of Ca II is stronger along the minor axis than the major one. However, we note that the conclusion in Zhu & Ménard (2013b) is driven by a single measurement at , a trend that is not observed in our measurements with more pairs. We will further discuss the implications of our azimuthal angle measurements in Section 4.2.
3.4 Gas distribution with respect to the size of halos
Given that the same impact parameter in the physical space corresponds to different regions in the halos of galaxies with different masses, we measure the Ca II absorption as a function of impact parameter normalized by the virial radius, , of the dark matter halos of the central galaxies. To estimate the virial radius, we follow Chang et al. (2025) and derive halo masses using Bayesian inference. Briefly, the halo masses are estimated from stellar masses combining information of a prior and a likelihood function, which are constructed using the halo mass function from Tinker et al. (2010) and the stellar-to-halo mass relation from Moster et al. (2013), respectively. For further details, we refer the readers to Chang et al. (2025). Using the estimated halo masses, we determine the virial radius with the analytical formula from Bryan & Norman (1998).
The results are shown in Figure 10. The Ca II measurements around star-forming and quiescent galaxies are shown in the left and right panels respectively, fitted with
| (7) |
We find that after the normalization, Ca II absorption profiles around star-forming galaxies with different stellar masses become consistent with each other, indicating that the cool gas distributes similarly in the halos, and the behavior of the cool CGM is closely tied to the halo masses of the host galaxies. On the other hand, for quiescent galaxies, there is a different trend, showing that the absorption strengths decrease with stellar masses, especially in the inner regions of the halos . In addition, again, for galaxies with , the Ca II absorption around star-forming galaxies is approximately 1.5-2 times stronger than that around quiescent galaxies as observed in the physical space. These results demonstrate that while cool gas traced by Ca II exists in both types of galaxies, they behave differently around different types of galaxies.
Our Ca II results are consistent with results obtained from Mg II absorption lines, showing that the Mg II absorption profiles around star-forming galaxies with different masses are similar when normalized by the distance , while the absorption decreases with the mass of galaxies for quiescent ones (e.g., Churchill et al., 2013a, b; Lan, 2020; Anand et al., 2021).
3.5 Ca II mass in the halos
We now estimate the Ca II mass in the halos. To this end, we first calculate the Ca II column density based on the Ca II K line rest equivalent width as using the following equation adopted from (Draine, 2011)
| (8) |
where is the oscillator strength of Ca II K being 0.648, and and are in units of . This relation works for unsaturated, optically thin absorption lines and provides a lower limit of column density when the lines are saturated. Our measurements are in the unsaturated region with the strongest being at (e.g., Zhu & Ménard, 2013b). We then adopt the best-fit profiles as shown in Figure 10, and integrate the Ca II mass from to :
| (9) |
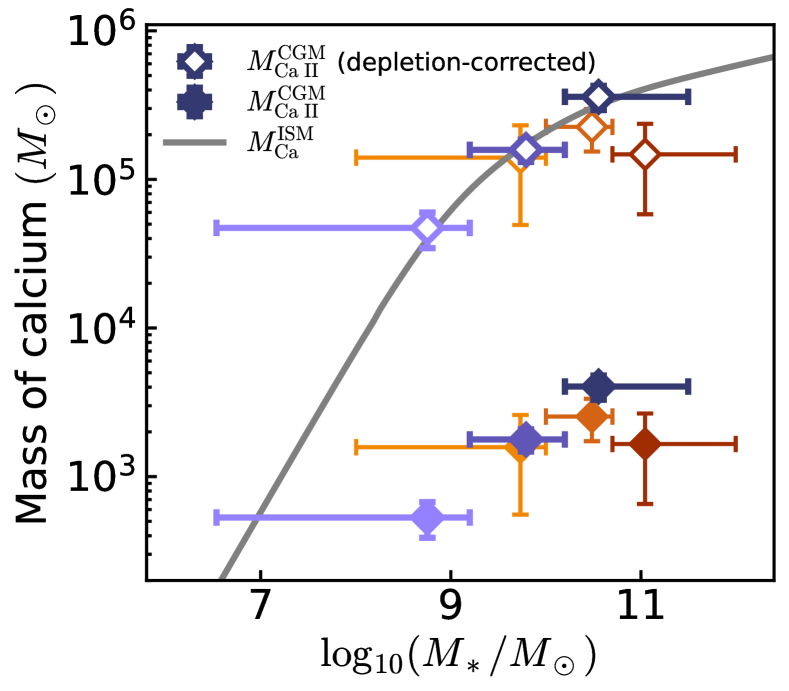
where is the atomic mass of Ca. The results are shown in Figure 11. We emphasize that given that Ca II only contains a fraction of Ca in the ionization state, the estimated Ca II mass represents the lower limit of the total Ca mass.
In addition, we estimate the total Ca mass in the ISM of star-forming galaxies by combining the stellar mass-metallicity relation and atomic gas sequence from Scholte et al. (2024) with the solar Ca-to-O abundance ratio of 0.004 (Lodders, 2019). We also apply a dust depletion correction to the metallicity using the relation from Peimbert & Peimbert (2010). The estimated total Ca mass in the ISM of star-forming galaxies is shown by the grey line. For the CGM, we also account for dust depletion in our Ca II measurements of the halos by applying a depletion factor. Using Cloudy simulations (Chatzikos et al., 2023), we determine a depletion factor of by comparing the intrinsic Ca II-to-Zn II ratio in the CGM with the observed ratio from Lan & Fukugita (2017). A detailed description of the simulations is provided in Appendix A. After the correction, the amount of the Ca II mass in the halos is comparable to the amount of Ca mass in the ISM. Moreover, the relationship between the Ca II mass and stellar mass of star-forming galaxies follows the relationship of the ISM metal mass and stellar mass of star-forming galaxies. This result demonstrates that the metal enrichment of the ISM and CGM is closely linked together, reflecting the cumulative effect of feedback mechanisms.
4 Discussion
4.1 Comparisons with previous results
By combining DESI spectra of background quasars, we have measured the Ca II absorption strengths around galaxies as a function of stellar mass, galaxy types and redshift, and revealed correlations between Ca II absorption strengths and galaxy properties. In the following, we compare our results with similar measurements from previous studies and discuss the implications.
Cool CGM traced by Ca II at : Our observed trends are consistent with the trends reported in the previous Ca II results at using the SDSS dataset by Zhu & Ménard (2013b). For example, Zhu & Ménard (2013b) separated galaxies into two mass bins and found that galaxies with and have best-fit parameter values of and at 100 kpc. This yields , which is consistent with our best-fit parameter value. We note that while in their analysis, only a mass cut is applied, we expect that the trend in their measurements is mostly driven by signals from star-forming population which has a larger pair number. In addition, they reported that Ca II around star-forming galaxies is approximately two times stronger than Ca II around quiescent galaxies, a trend that we have found in DESI data. We note that limited by the SDSS dataset, Zhu & Ménard (2013b) explored either the dependences between Ca II absorption and mass or SFR, while the DESI dataset enables us to perform the exploration as a function of mass and SFR independently across a wider parameter space than previously explored. We also note that the parameter of our best-fit profiles is for both types of galaxies while Zhu & Ménard (2013b) obtained . The difference is mostly due to the fact that we exclude the measurements during the fitting, while Zhu & Ménard (2013b) included the measurements in their fitting. In Appendix B, we directly compare DESI measurements with SDSS measurements from Zhu & Ménard (2013b), and show that the measurements from the two datasets are consistent.
The only inconsistency between our results and the results in Zhu & Ménard (2013b) is the azimuthal angle dependence. Given that the trend observed in Zhu & Ménard (2013b) is driven by a single measurement in the innermost bin, it is possible that such a trend is affected by small statistics limited by the SDSS data. The larger DESI sample is expected to be less sensitive to the effect. Our measurements are also consistent with the Ca II measurements within 10 kpc of galaxies obtained by Rubin et al. (2022)555We multiply the Ca II K measurements in Rubin et al. (2022) by by a factor of 1.69, which is the weighted mean of the ratio of H+K to K lines from the innermost bins of our measurements. as shown in Figure 3, as well as the Ca II measurements in our Milky Way ISM with typical from Murga et al. (2015)666Given that the Milky Way sightlines intercept approximately half of the ISM, we multiply the Ca II measurements by two..
Cool CGM traced by Mg II at : Explorations of the galaxy-cool CGM connections have been conducted with Mg II absorption lines as the tracers of the cool CGM (e.g., Bordoloi et al., 2011; Kacprzak et al., 2012; Rubin et al., 2014; Nielsen et al., 2016; Dutta et al., 2020; Huang et al., 2021), and have revealed similar correlations as found in this work:
-
•
Mass dependence: Studies have shown that the covering fraction and the absorption profiles of the cool CGM traced by Mg II absorbers increase with stellar mass (and halo mass) of systems. For example, using galaxy-quasar pairs, Chen et al. (2010) showed that the characteristic radius of gas traced by Mg II scales with galaxy B-band luminosities as . With galaxy-quasar pairs obtained with MUSE observations, Dutta et al. (2020) also concluded that the stellar mass is the primary factor affecting Mg II absorption around galaxies. Similarly, via a statistical cross-correlation analysis, Lan (2020) demonstrated that the covering fraction of Mg II absorbers measured in physical space correlates with the galaxy mass with for star-forming galaxies. Finally, based on cool gas measurements around galaxies and quasars living in halos with different masses, Prochaska et al. (2014) also argued that the halo mass is the primary factor affecting the cool gas distribution, a conclusion which is also reached by Churchill et al. (2013a).
Together with the Ca II measurements, this mass dependence of the cool CGM has been observed across a wide range of redshifts from up to , covering at least 10 Gyr cosmic time. This provides hints on the underlying mechanisms which are expected to operate from and persist through cosmic time.
-
•
Galaxy type dependence: In addition to the mass dependence, the correlation between galaxy types and the cool CGM, especially in the inner regions, has been reported. Several studies show that the average Mg II absorption strength in the inner CGM around star-forming galaxies is stronger than that around quiescent galaxies (e.g., Bordoloi et al., 2011; Lan et al., 2014; Lan, 2020; Rubin et al., 2018; Anand et al., 2021; Huang et al., 2021). A difference of a factor of is observed within 50 kpc, and the value is larger with smaller impact parameters. We note that such a trend is found in Ca II measurements as shown in Section 3. However, the differences in Ca II absorption between star-forming and quiescent galaxies are at most a factor of 2 at kpc, which is smaller than the results from MgII absorption at higher redshifts. This might suggest that the dependence of the cool CGM on galaxy types becomes weaker at lower redshifts, possibly associated with the declines of the SFR of galaxies and the contribution of galactic outflows. We discuss this implication in the following subsection.
4.2 Possible redshift evolution of the azimuthal angle dependence
Blue-shifted absorption lines, the observed signature of galactic outflows, have been detected ubiquitously in the spectra of star-forming galaxies, via the so-called down-the-barrel observations (e.g., Weiner et al., 2009; Rubin et al., 2014; Zhu et al., 2015). With the typical observed velocity ( km/s; e.g., Rubin et al. 2014), gas associated with outflows is expected to travel into the halos and possibly reaches to 50 kpc within a few hundred Myr (e.g., Lan & Mo, 2019). The azimuthal angle dependence of gas distribution has been considered as one of the possible imprints of galactic outflows in the CGM. Such a distribution has been observed in the cool gas traced by Mg II absorption lines. For instance, Bordoloi et al. (2011) measured the Mg II absorption along the minor and major axes of star-forming galaxies at with HST ACS images and found that within 50 kpc, the Mg II absorption is stronger along the minor axis than the major axis. The rest equivalent width of Mg II is times higher along the minor axis than the major axis at kpc. A similar trend and the ratio between Mg II rest equivalent width along the minor and major axes are also found in Lan & Mo (2018) at . With individual detections, the bimodal azimuthal dependence of Mg II absorption is reported at (e.g., Bouché et al., 2012; Kacprzak et al., 2012). However, the ratio of the Mg II rest equivalent width along the minor to major axes is not as large as the value observed at (e.g., Martin et al., 2019; Huang et al., 2021). The azimuthal dependence of Ca II measurements reported in Section 3.3 is more consistent with the Mg II results.
Here we propose that the different degree of the azimuthal angle dependence is possibly due to the redshift evolution of galactic outflows driven by star-formation activities. As discussed above, the azimuthal angle dependence is observed mostly at (Bordoloi et al., 2011; Lan & Mo, 2018), while the low-redshift CGM has weak or no detectable azimuthal angle dependence as shown in this work and previous studies (e.g., Huang et al., 2021; Borthakur et al., 2015; Pointon et al., 2019). This can be due to the fact that for star-forming galaxies with similar mass, the average SFR at is times higher than that at (e.g., Moustakas et al., 2013). Therefore, three times more gas mass associated with outflows is expected to contribute to the CGM preferentially allocated along the minor axis. Moreover, the velocities of galactic outflows evolve with redshifts. With a fixed SFR, the maximum outflow velocity at is approximately 1.5-2 times faster than the outflow velocity at (e.g., Sugahara et al., 2019). Taking these two factors together, at higher redshifts, galactic outflows are expected to distribute more gas mass into the CGM at larger distances. In other words, the absence of azimuthal angle dependence observed in Ca II at low redshifts indicates that gas associated with galactic outflows does not contribute significantly in the inner CGM. This lack of galactic outflow contribution can also explain why Ca II absorption in the inner CGM around star-forming and quiescent galaxies at does not have such a large difference observed at with Mg II absorption.
This suppression of galactic outflows towards low redshifts is aligned with the results from the FIRE (Feedback In Realistic Environments) simulations (Hopkins et al., 2014). Muratov et al. (2015) and Anglés-Alcázar et al. (2017) found that high-redshift galaxies drive strong galactic outflows produced by bursty star formation, while at low redshifts, massive galaxies shift into steady star-formation that does not drive strong outflows. Stern et al. (2021) proposed that this transition of the star-formation mode is linked to the virialization of the inner CGM, which occurs at lower redshifts, and after the virialization of the outer CGM. Before the virialization of the inner CGM, the inner CGM is dominated by clumpy cool gas, making galactic outflows relatively easy to travel through. After the virialization of the inner CGM, the hot gas around galaxies confines the galactic outflows. This transition of the inner CGM virialization for galaxies occurs at in the FIRE simulations which coincides with the epoch separating the behaviors of cool gas around star-forming galaxies. While further testing and validation of this outside-in CGM virialization scenario requires direct comparisons between the predicted and observed properties of cool gas tracers, such as Mg II and Ca II, around galaxies across time and mass, the current observed properties of the cool CGM are consistent with the results of the FIRE simulations qualitatively.
4.3 Impact of AGNs on the properties of the CGM
Our results show that there is no significant difference in the Ca II absorption between AGNs and star-forming galaxies. This indicates that current AGN activities do not have strong impact on the properties of the cool CGM. This result is consistent with previous measurements of gas around galaxies with AGN activities. For example, Berg et al. (2018) selected 19 AGNs via BPT diagnosis and measured the CGM properties with COS UV spectroscopy, finding that the absorption line properties of AGNs are consistent with those of the control sample within 160 kpc. Similarly, Kacprzak et al. (2015) estimated the covering fraction of Mg II absorption around 14 AGNs, and obtained a value slightly lower than that of field galaxies, though within the uncertainties. For luminous AGNs, i.e. quasars, the cool gas distribution has also been measured via quasar-quasar pairs. Previous results show that the properties of cool gas around quasars are similar to those around galaxies with similar stellar mass, suggesting that the halo mass is the primary factor driving the properties of the cool gas (e.g., Farina et al., 2014; Prochaska et al., 2014). On the other hand, Johnson et al. (2015) reported a correlation between the covering fraction of Mg II absorption and quasar luminosity, and argued that quasar feedback can be one of the mechanisms driving the correlation. While validating such a physical connection requires further investigations, it suggests that energy from powerful / luminous quasars may be needed to sufficiently leave imprints on the properties of the cool CGM. Finally, considering radio-mode feedback, Chang et al. (2024) measured the properties of the cool gas traced by Mg II around radio galaxies and the control sample, and found no detectable difference between the properties of the gas around the two populations, illustrating that recent radio AGN activities do not impact the properties of the cool gas strongly. These measurements again support the picture that the properties of galaxies, especially the stellar mass / halo mass and SFR, are the dominant factors correlating with the properties of the cool gas.
5 Conclusions
Utilizing the DESI Y1 galaxy and quasar spectroscopic datasets, we constructed high S/N composite spectra of quasars in the background of galaxies from which we detected and measured the absorption strengths of Ca II, tracers of cool gas, around galaxies. We explored the relationships between the properties of the cool CGM and the properties of galaxies, including stellar mass, SFR, redshift, and AGN activities, and compared our measurements at with similar measurements obtained at higher redshifts. Our results are summarized in the following:
-
1.
We find that the Ca II rest equivalent widths decrease with impact parameters, consistent with the cool CGM measurements from previous studies.
-
2.
For star-forming galaxies, the absorption strengths correlate with the stellar mass of galaxies from to with , while such a trend is weaker for quiescent galaxies. With a fixed stellar mass, we also find a positive correlation between absorption strengths and SFR for star-forming galaxies, following . In addition, for galaxies, the absorption strengths are stronger around star-forming galaxies than those around quiescent galaxies within . The correlations between Ca II and galaxy properties are detected at and .
-
3.
We find that there is no azimuthal angle dependence of absorption strength around star-forming galaxies, which is inconsistent with previous measurements at higher redshifts. We argue that this might be due to the redshift evolution of galactic outflows which is expected to carry less mass with slower velocity at lower redshifts.
-
4.
We measure Ca II absorption around AGNs, selected with the BPT diagnosis, and find that with similar galaxy masses, Ca II absorption strengths around AGNs and star-forming galaxies are consistent. This result suggests that current AGN activities do not have strong impacts on the properties of the cool CGM.
-
5.
After normalizing the impact parameter by the virial radius, the absorption profiles around galaxies with different stellar masses from to become consistent with each other, indicating that the cool CGM distributes similarly in the halos and is closely linked to halo masses. For quiescent galaxies with masses , the Ca II absorption in the inner CGM appears to be weaker. This halo mass trend is also observed at higher redshifts, suggesting that the underlying mechanism(s) regulating such a property persists across cosmic time.
-
6.
We estimate the mass of Ca II as a function of stellar mass, and find that after the dust depletion correction, the amount of Ca II in the CGM is comparable with the Ca mass in the ISM of galaxies. Moreover, the cool CGM metal mass and stellar mass relation of star-forming galaxies follows the ISM metal mass and stellar mass relation.
Our results provide a comprehensive characterization of galaxy-cool CGM connections below down to galaxies, offering novel constraints on the models of galaxy evolution. Together with similar measurements at higher redshifts, the relationships between the properties of galaxies and the cool CGM have been mapped across Gyr from redshift 0 to redshift . Understanding the physical mechanisms behind these relationships over cosmic time will be essential for advancing the knowledge of galaxy formation and evolution.
The analysis adopted in this work can be directly applied to upcoming datasets. For example, at the local Universe, the complete 5-year DESI dataset is expected to further enhance the S/N of the similar measurements by at least a factor of two. In addition, one can combine the images provided by Euclid (Euclid Collaboration et al., 2024) to obtain more precise measurements of gas distribution as a function of azimuthal angle, a key constraint on how gas flows around galaxies. Similar measurements will also be obtained at even higher redshifts. The Prime Focus Spectrograph (PFS) survey (Takada et al., 2014) and the DESI-II (Schlegel et al., 2022), for example, will observe millions of galaxies at , enabling explorations of galaxy-CGM connections with large datasets at the peak of the star-formation density of the Universe (e.g., Madau & Dickinson, 2014). Similar to the properties of galaxies, such as stellar mass functions and luminosity functions at different redshifts (e.g., Kelvin et al., 2014; Driver et al., 2022; Weaver et al., 2023), precise measurements of gas around galaxies at different redshifts will serve as fundamental constraints, leading to a more comprehensive understanding of the cosmic baryon cycle.
Data Availability
All data points shown in the figures are available at Zenodo doi: 10.5281/zenodo.14970325.
Appendix A Cloudy simulation
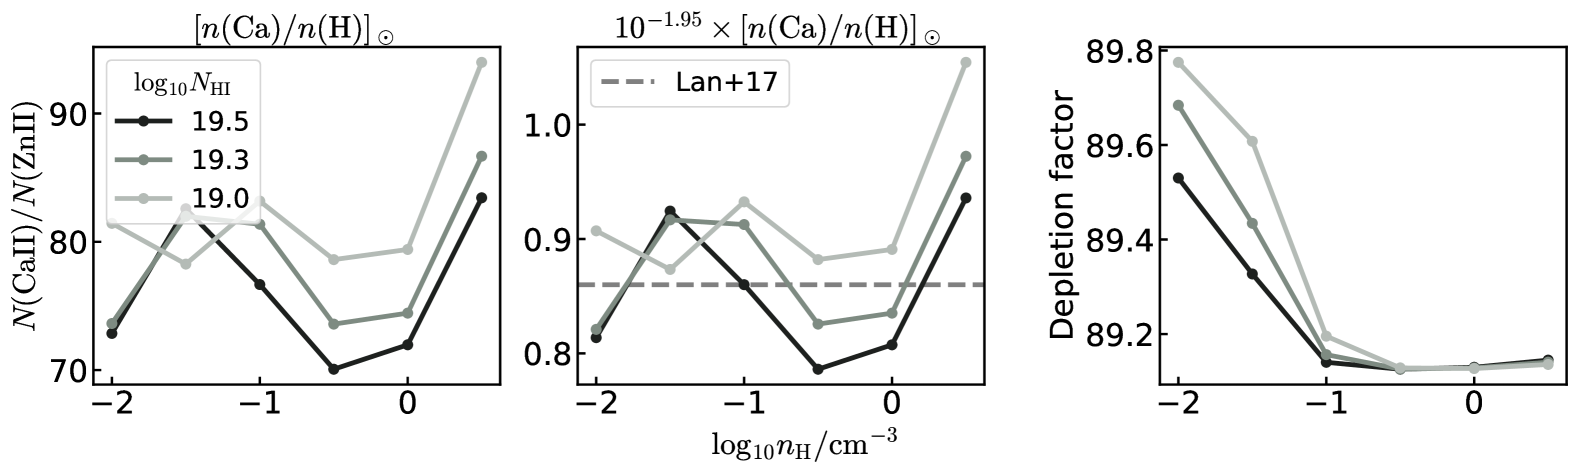
We perform Cloudy simulations (Chatzikos et al., 2023) to evaluate the dust depletion factor in the CGM. The simulations are initialized with the Haardt & Madau (2012) extragalactic radiation background at , and run over a hydrogen volume density range of to until the neutral hydrogen column density reaches , and . In order to determine the depletion factor, we run two sets of simulations. First, we run a simulation by adopting the default solar composition in Cloudy (Grevesse & Sauval, 1998; Allende Prieto et al., 2001; Holweger, 2001; Allende Prieto et al., 2002) to obtain the intrinsic column density ratio of Ca II and Zn II (the left panel of Figure 12). Next, we reduce the calcium abundance to simulate dust depletion, adjusting it to match the observed average Ca II-to-Zn II column density ratio of from Lan & Fukugita (2017) (the middle panel of Figure 12). By comparing the intrinsic ratio with the depleted simulations, we derive an average Ca depletion factor of and adopt this value to correct the depletion effect.
Appendix B Comparison with SDSS
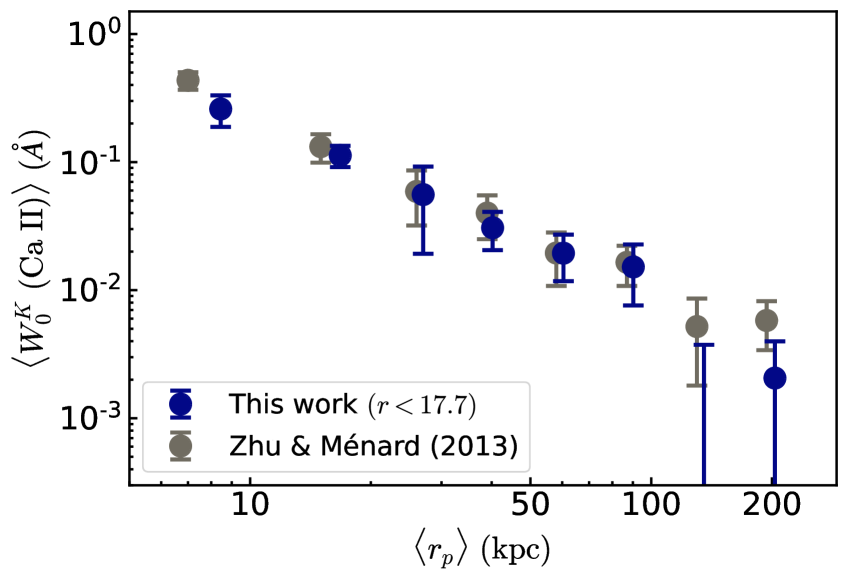
Here we compare our DESI measurements with the SDSS measurements from Zhu & Ménard (2013b). To match the SDSS galaxy population, we select DESI galaxies with (Strauss et al., 2002). As shown in Figure 13, the DESI measurements are consistent with the SDSS measurements. We note that while DESI provides more galaxy-quasar pairs, the typical S/N of individual DESI quasar spectra is lower than the S/N of SDSS quasar spectra. Together, these two factors yield similar S/N values of the SDSS and DESI composite spectra. Nevertheless, the DESI dataset enables us to probe the Ca II absorption around galaxies with lower mass and higher redshifts.
References
- Alexander et al. (2023) Alexander, D. M., Davis, T. M., Chaussidon, E., et al. 2023, AJ, 165, 124, doi: 10.3847/1538-3881/acacfc
- Allende Prieto et al. (2001) Allende Prieto, C., Lambert, D. L., & Asplund, M. 2001, ApJ, 556, L63, doi: 10.1086/322874
- Allende Prieto et al. (2002) —. 2002, ApJ, 573, L137, doi: 10.1086/342095
- Anand et al. (2021) Anand, A., Nelson, D., & Kauffmann, G. 2021, MNRAS, 504, 65, doi: 10.1093/mnras/stab871
- Anand et al. (2024) Anand, A., Guy, J., Bailey, S., et al. 2024, AJ, 168, 124, doi: 10.3847/1538-3881/ad60c2
- Anglés-Alcázar et al. (2017) Anglés-Alcázar, D., Faucher-Giguère, C.-A., Kereš, D., et al. 2017, MNRAS, 470, 4698, doi: 10.1093/mnras/stx1517
- Bahcall & Spitzer (1969) Bahcall, J. N., & Spitzer, Lyman, J. 1969, ApJ, 156, L63, doi: 10.1086/180350
- Bailey et al. (2024) Bailey et al. 2024
- Baldwin et al. (1981) Baldwin, J. A., Phillips, M. M., & Terlevich, R. 1981, PASP, 93, 5, doi: 10.1086/130766
- Berg et al. (2018) Berg, T. A. M., Ellison, S. L., Tumlinson, J., et al. 2018, MNRAS, 478, 3890, doi: 10.1093/mnras/sty962
- Bergeron (1986) Bergeron, J. 1986, A&A, 155, L8
- Boquien et al. (2019) Boquien, M., Burgarella, D., Roehlly, Y., et al. 2019, A&A, 622, A103, doi: 10.1051/0004-6361/201834156
- Bordoloi et al. (2011) Bordoloi, R., Lilly, S. J., Knobel, C., et al. 2011, ApJ, 743, 10, doi: 10.1088/0004-637X/743/1/10
- Bordoloi et al. (2014) Bordoloi, R., Tumlinson, J., Werk, J. K., et al. 2014, ApJ, 796, 136, doi: 10.1088/0004-637X/796/2/136
- Borthakur et al. (2015) Borthakur, S., Heckman, T., Tumlinson, J., et al. 2015, ApJ, 813, 46, doi: 10.1088/0004-637X/813/1/46
- Borthakur et al. (2016) —. 2016, ApJ, 833, 259, doi: 10.3847/1538-4357/833/2/259
- Bouché et al. (2012) Bouché, N., Hohensee, W., Vargas, R., et al. 2012, MNRAS, 426, 801, doi: 10.1111/j.1365-2966.2012.21114.x
- Bouché et al. (2025) Bouché, N. F., Wendt, M., Zabl, J., et al. 2025, A&A, 694, A67, doi: 10.1051/0004-6361/202451093
- Bryan & Norman (1998) Bryan, G. L., & Norman, M. L. 1998, ApJ, 495, 80, doi: 10.1086/305262
- Chang et al. (2025) Chang, Y.-L., Lan, T.-W., Prochaska, J. X., & DESI members. 2025, in prep.
- Chang et al. (2024) Chang, Y.-L., Lan, T.-W., Prochaska, J. X., et al. 2024, ApJ, 974, 191, doi: 10.3847/1538-4357/ad6c44
- Chatzikos et al. (2023) Chatzikos, M., Bianchi, S., Camilloni, F., et al. 2023, Rev. Mexicana Astron. Astrofis., 59, 327, doi: 10.22201/ia.01851101p.2023.59.02.12
- Chaussidon et al. (2023) Chaussidon, E., Yèche, C., Palanque-Delabrouille, N., et al. 2023, ApJ, 944, 107, doi: 10.3847/1538-4357/acb3c2
- Chen et al. (2010) Chen, H.-W., Helsby, J. E., Gauthier, J.-R., et al. 2010, ApJ, 714, 1521, doi: 10.1088/0004-637X/714/2/1521
- Chen et al. (2020) Chen, H.-W., Zahedy, F. S., Boettcher, E., et al. 2020, MNRAS, 497, 498, doi: 10.1093/mnras/staa1773
- Chen et al. (2020) Chen, H.-W., Zahedy, F. S., Boettcher, E., et al. 2020, Monthly Notices of the Royal Astronomical Society, 497, 498
- Chen et al. (2023) Chen, Z.-F., Qin, H.-C., Cai, J.-T., et al. 2023, The Astrophysical Journal Supplement Series, 265, 46
- Cherrey et al. (2025) Cherrey, M., Bouché, N. F., Zabl, J., et al. 2025, Astronomy & Astrophysics, 694, A117
- Churchill et al. (2013a) Churchill, C. W., Nielsen, N. M., Kacprzak, G. G., & Trujillo-Gomez, S. 2013a, ApJ, 763, L42, doi: 10.1088/2041-8205/763/2/L42
- Churchill et al. (2013b) Churchill, C. W., Trujillo-Gomez, S., Nielsen, N. M., & Kacprzak, G. G. 2013b, ApJ, 779, 87, doi: 10.1088/0004-637X/779/1/87
- DESI Collaboration et al. (2016a) DESI Collaboration, Aghamousa, A., Aguilar, J., et al. 2016a, arXiv e-prints, arXiv:1611.00036, doi: 10.48550/arXiv.1611.00036
- DESI Collaboration et al. (2016b) —. 2016b, arXiv e-prints, arXiv:1611.00037, doi: 10.48550/arXiv.1611.00037
- DESI Collaboration et al. (2022) DESI Collaboration, Abareshi, B., Aguilar, J., et al. 2022, AJ, 164, 207, doi: 10.3847/1538-3881/ac882b
- DESI Collaboration et al. (2024a) DESI Collaboration, Adame, A. G., Aguilar, J., et al. 2024a, AJ, 167, 62, doi: 10.3847/1538-3881/ad0b08
- DESI Collaboration et al. (2024b) —. 2024b, AJ, 168, 58, doi: 10.3847/1538-3881/ad3217
- DESI Collaboration et al. (2024c) —. 2024c, arXiv e-prints, arXiv:2411.12020, doi: 10.48550/arXiv.2411.12020
- DESI Collaboration et al. (2024d) —. 2024d, arXiv e-prints, arXiv:2404.03000, doi: 10.48550/arXiv.2404.03000
- DESI Collaboration et al. (2024e) DESI Collaboration, Adame, A. G., Aguilar, J., et al. 2024e, arXiv e-prints, arXiv:2404.03001, doi: 10.48550/arXiv.2404.03001
- DESI Collaboration et al. (2024f) DESI Collaboration, Adame, A. G., Aguilar, J., et al. 2024f, arXiv e-prints, arXiv:2411.12021, doi: 10.48550/arXiv.2411.12021
- DESI Collaboration et al. (2024g) —. 2024g, arXiv e-prints, arXiv:2404.03002, doi: 10.48550/arXiv.2404.03002
- DESI Collaboration et al. (2024h) —. 2024h, arXiv e-prints, arXiv:2411.12022, doi: 10.48550/arXiv.2411.12022
- DESI Collaboration et al. (2024) DESI Collaboration et al. 2024
- DESI Collaboration et al. (2025) —. 2025, in prep.
- Dey et al. (2019) Dey, A., Schlegel, D. J., Lang, D., et al. 2019, AJ, 157, 168, doi: 10.3847/1538-3881/ab089d
- Draine (2011) Draine, B. T. 2011, Physics of the Interstellar and Intergalactic Medium
- Driver et al. (2022) Driver, S. P., Bellstedt, S., Robotham, A. S. G., et al. 2022, MNRAS, 513, 439, doi: 10.1093/mnras/stac472
- Dutta et al. (2020) Dutta, R., Fumagalli, M., Fossati, M., et al. 2020, MNRAS, 499, 5022, doi: 10.1093/mnras/staa3147
- Euclid Collaboration et al. (2024) Euclid Collaboration, Mellier, Y., Abdurro’uf, et al. 2024, arXiv e-prints, arXiv:2405.13491, doi: 10.48550/arXiv.2405.13491
- Farina et al. (2014) Farina, E. P., Falomo, R., Scarpa, R., et al. 2014, MNRAS, 441, 886, doi: 10.1093/mnras/stu585
- Faucher-Giguère & Oh (2023) Faucher-Giguère, C.-A., & Oh, S. P. 2023, ARA&A, 61, 131, doi: 10.1146/annurev-astro-052920-125203
- Ford et al. (2016) Ford, A. B., Werk, J. K., Davé, R., et al. 2016, MNRAS, 459, 1745, doi: 10.1093/mnras/stw595
- Green et al. (2012) Green, J. C., Froning, C. S., Osterman, S., et al. 2012, ApJ, 744, 60, doi: 10.1088/0004-637X/744/1/6010.1086/141956
- Grevesse & Sauval (1998) Grevesse, N., & Sauval, A. J. 1998, Space Sci. Rev., 85, 161, doi: 10.1023/A:1005161325181
- Guha et al. (2024) Guha, L. K., Srianand, R., & Petitjean, P. 2024, MNRAS, 527, 5075, doi: 10.1093/mnras/stad3489
- Guy et al. (2023) Guy, J., Bailey, S., Kremin, A., et al. 2023, AJ, 165, 144, doi: 10.3847/1538-3881/acb212
- Haardt & Madau (2012) Haardt, F., & Madau, P. 2012, ApJ, 746, 125, doi: 10.1088/0004-637X/746/2/125
- Hahn et al. (2023) Hahn, C., Wilson, M. J., Ruiz-Macias, O., et al. 2023, AJ, 165, 253, doi: 10.3847/1538-3881/accff8
- Hewett & Wild (2007) Hewett, P. C., & Wild, V. 2007, MNRAS, 379, 738, doi: 10.1111/j.1365-2966.2007.11959.x
- Holweger (2001) Holweger, H. 2001, in American Institute of Physics Conference Series, Vol. 598, Joint SOHO/ACE workshop “Solar and Galactic Composition”, ed. R. F. Wimmer-Schweingruber (AIP), 23–30, doi: 10.1063/1.1433974
- Hopkins et al. (2014) Hopkins, P. F., Kereš, D., Oñorbe, J., et al. 2014, MNRAS, 445, 581, doi: 10.1093/mnras/stu1738
- Huang et al. (2021) Huang, Y.-H., Chen, H.-W., Shectman, S. A., et al. 2021, MNRAS, 502, 4743, doi: 10.1093/mnras/stab360
- Johnson et al. (2015) Johnson, S. D., Chen, H.-W., & Mulchaey, J. S. 2015, MNRAS, 452, 2553, doi: 10.1093/mnras/stv1481
- Kacprzak et al. (2012) Kacprzak, G. G., Churchill, C. W., & Nielsen, N. M. 2012, ApJ, 760, L7, doi: 10.1088/2041-8205/760/1/L7
- Kacprzak et al. (2015) Kacprzak, G. G., Muzahid, S., Churchill, C. W., Nielsen, N. M., & Charlton, J. C. 2015, ApJ, 815, 22, doi: 10.1088/0004-637X/815/1/22
- Kelvin et al. (2014) Kelvin, L. S., Driver, S. P., Robotham, A. S. G., et al. 2014, MNRAS, 439, 1245, doi: 10.1093/mnras/stt2391
- Kewley et al. (2006) Kewley, L. J., Groves, B., Kauffmann, G., & Heckman, T. 2006, MNRAS, 372, 961, doi: 10.1111/j.1365-2966.2006.10859.x
- Koprowski et al. (2024) Koprowski, M. P., Wijesekera, J. V., Dunlop, J. S., et al. 2024, arXiv e-prints, arXiv:2403.06575, doi: 10.48550/arXiv.2403.06575
- Lan (2020) Lan, T.-W. 2020, ApJ, 897, 97, doi: 10.3847/1538-4357/ab989a
- Lan & Fukugita (2017) Lan, T.-W., & Fukugita, M. 2017, ApJ, 850, 156, doi: 10.3847/1538-4357/aa93eb
- Lan et al. (2014) Lan, T.-W., Ménard, B., & Zhu, G. 2014, ApJ, 795, 31, doi: 10.1088/0004-637X/795/1/31
- Lan & Mo (2018) Lan, T.-W., & Mo, H. 2018, ApJ, 866, 36, doi: 10.3847/1538-4357/aadc08
- Lan & Mo (2019) —. 2019, MNRAS, 486, 608, doi: 10.1093/mnras/stz839
- Lan et al. (2023) Lan, T.-W., Tojeiro, R., Armengaud, E., et al. 2023, ApJ, 943, 68, doi: 10.3847/1538-4357/aca5fa
- Lang et al. (2016) Lang, D., Hogg, D. W., & Mykytyn, D. 2016, The Tractor: Probabilistic astronomical source detection and measurement, Astrophysics Source Code Library, record ascl:1604.008
- Lee & Seung (1999) Lee, D. D., & Seung, H. S. 1999, nature, 401, 788
- Lehner et al. (2024) Lehner, N., Howk, J. C., Fox, A. J., et al. 2024, The Astrophysical Journal, 975, 264
- Levi et al. (2013) Levi, M., Bebek, C., Beers, T., et al. 2013, arXiv e-prints, arXiv:1308.0847, doi: 10.48550/arXiv.1308.0847
- Liang & Chen (2014) Liang, C. J., & Chen, H.-W. 2014, MNRAS, 445, 2061, doi: 10.1093/mnras/stu1901
- Liang et al. (2016) Liang, C. J., Kravtsov, A. V., & Agertz, O. 2016, MNRAS, 458, 1164, doi: 10.1093/mnras/stw375
- Lodders (2019) Lodders, K. 2019, arXiv e-prints, arXiv:1912.00844, doi: 10.48550/arXiv.1912.00844
- Madau & Dickinson (2014) Madau, P., & Dickinson, M. 2014, ARA&A, 52, 415, doi: 10.1146/annurev-astro-081811-125615
- Martin et al. (2019) Martin, C. L., Ho, S. H., Kacprzak, G. G., & Churchill, C. W. 2019, ApJ, 878, 84, doi: 10.3847/1538-4357/ab18ac
- Miller et al. (2024) Miller, T. N., Doel, P., Gutierrez, G., et al. 2024, AJ, 168, 95, doi: 10.3847/1538-3881/ad45fe
- Moster et al. (2013) Moster, B. P., Naab, T., & White, S. D. M. 2013, MNRAS, 428, 3121, doi: 10.1093/mnras/sts261
- Moustakas et al. (2023) Moustakas, J., Buhler, J., Scholte, D., Dey, B., & Khederlarian, A. 2023, FastSpecFit: Fast spectral synthesis and emission-line fitting of DESI spectra, Astrophysics Source Code Library, record ascl:2308.005
- Moustakas et al. (2013) Moustakas, J., Coil, A. L., Aird, J., et al. 2013, ApJ, 767, 50, doi: 10.1088/0004-637X/767/1/50
- Muratov et al. (2015) Muratov, A. L., Kereš, D., Faucher-Giguère, C.-A., et al. 2015, MNRAS, 454, 2691, doi: 10.1093/mnras/stv2126
- Murga et al. (2015) Murga, M., Zhu, G., Ménard, B., & Lan, T.-W. 2015, MNRAS, 452, 511, doi: 10.1093/mnras/stv1277
- Myers et al. (2023) Myers, A. D., Moustakas, J., Bailey, S., et al. 2023, AJ, 165, 50, doi: 10.3847/1538-3881/aca5f9
- Nateghi et al. (2024) Nateghi, H., Kacprzak, G. G., Nielsen, N. M., et al. 2024, MNRAS, 534, 930, doi: 10.1093/mnras/stae2129
- Nelson et al. (2019) Nelson, D., Pillepich, A., Springel, V., et al. 2019, MNRAS, 490, 3234, doi: 10.1093/mnras/stz2306
- Nestor et al. (2008) Nestor, D. B., Pettini, M., Hewett, P. C., Rao, S., & Wild, V. 2008, MNRAS, 390, 1670, doi: 10.1111/j.1365-2966.2008.13857.x
- Nestor et al. (2005) Nestor, D. B., Turnshek, D. A., & Rao, S. M. 2005, ApJ, 628, 637, doi: 10.1086/427547
- Nielsen et al. (2013) Nielsen, N. M., Churchill, C. W., & Kacprzak, G. G. 2013, ApJ, 776, 115, doi: 10.1088/0004-637X/776/2/115
- Nielsen et al. (2016) Nielsen, N. M., Churchill, C. W., Kacprzak, G. G., Murphy, M. T., & Evans, J. L. 2016, ApJ, 818, 171, doi: 10.3847/0004-637X/818/2/171
- Nielsen et al. (2017) Nielsen, N. M., Kacprzak, G. G., Muzahid, S., et al. 2017, ApJ, 834, 148, doi: 10.3847/1538-4357/834/2/148
- Oppenheimer et al. (2018) Oppenheimer, B. D., Schaye, J., Crain, R. A., Werk, J. K., & Richings, A. J. 2018, MNRAS, 481, 835, doi: 10.1093/mnras/sty2281
- Peimbert & Peimbert (2010) Peimbert, A., & Peimbert, M. 2010, ApJ, 724, 791, doi: 10.1088/0004-637X/724/1/791
- Péroux & Howk (2020) Péroux, C., & Howk, J. C. 2020, ARA&A, 58, 363, doi: 10.1146/annurev-astro-021820-120014
- Pieri et al. (2014) Pieri, M. M., Mortonson, M. J., Frank, S., et al. 2014, MNRAS, 441, 1718, doi: 10.1093/mnras/stu577
- Pointon et al. (2019) Pointon, S. K., Kacprzak, G. G., Nielsen, N. M., et al. 2019, ApJ, 883, 78, doi: 10.3847/1538-4357/ab3b0e
- Prochaska et al. (2014) Prochaska, J. X., Lau, M. W., & Hennawi, J. F. 2014, ApJ, 796, 140, doi: 10.1088/0004-637X/796/2/140
- Prochaska et al. (2017) Prochaska, J. X., Werk, J. K., Worseck, G., et al. 2017, ApJ, 837, 169, doi: 10.3847/1538-4357/aa6007
- Raichoor et al. (2023) Raichoor, A., Moustakas, J., Newman, J. A., et al. 2023, AJ, 165, 126, doi: 10.3847/1538-3881/acb213
- Raichoor et al. (2024) Raichoor et al. 2024
- Richter et al. (2011) Richter, P., Krause, F., Fechner, C., Charlton, J. C., & Murphy, M. T. 2011, A&A, 528, A12, doi: 10.1051/0004-6361/201015566
- Rubin et al. (2018) Rubin, K. H. R., Diamond-Stanic, A. M., Coil, A. L., Crighton, N. H. M., & Moustakas, J. 2018, ApJ, 853, 95, doi: 10.3847/1538-4357/aa9792
- Rubin et al. (2014) Rubin, K. H. R., Prochaska, J. X., Koo, D. C., et al. 2014, ApJ, 794, 156, doi: 10.1088/0004-637X/794/2/156
- Rubin et al. (2022) Rubin, K. H. R., Juarez, C., Cooksey, K. L., et al. 2022, ApJ, 936, 171, doi: 10.3847/1538-4357/ac7b88
- Sardane et al. (2014) Sardane, G. M., Turnshek, D. A., & Rao, S. M. 2014, MNRAS, 444, 1747, doi: 10.1093/mnras/stu1554
- Sardane et al. (2015) —. 2015, MNRAS, 452, 3192, doi: 10.1093/mnras/stv1506
- Schlafly et al. (2023) Schlafly, E. F., Kirkby, D., Schlegel, D. J., et al. 2023, AJ, 166, 259, doi: 10.3847/1538-3881/ad0832
- Schlegel et al. (2022) Schlegel, D. J., Ferraro, S., Aldering, G., et al. 2022, arXiv e-prints, arXiv:2209.03585, doi: 10.48550/arXiv.2209.03585
- Schneider et al. (2010) Schneider, D. P., Richards, G. T., Hall, P. B., et al. 2010, AJ, 139, 2360, doi: 10.1088/0004-6256/139/6/2360
- Scholte et al. (2024) Scholte, D., Saintonge, A., Moustakas, J., et al. 2024, arXiv e-prints, arXiv:2408.03996, doi: 10.48550/arXiv.2408.03996
- Schroetter et al. (2021) Schroetter, I., Bouché, N. F., Zabl, J., et al. 2021, MNRAS, 506, 1355, doi: 10.1093/mnras/stab1447
- Scoville et al. (2017) Scoville, N., Lee, N., Vanden Bout, P., et al. 2017, ApJ, 837, 150, doi: 10.3847/1538-4357/aa61a0
- Silber et al. (2023) Silber, J. H., Fagrelius, P., Fanning, K., et al. 2023, AJ, 165, 9, doi: 10.3847/1538-3881/ac9ab1
- Siudek et al. (2024) Siudek, M., Pucha, R., Mezcua, M., et al. 2024, arXiv e-prints, arXiv:2409.19066, doi: 10.48550/arXiv.2409.19066
- Steidel et al. (2010) Steidel, C. C., Erb, D. K., Shapley, A. E., et al. 2010, ApJ, 717, 289, doi: 10.1088/0004-637X/717/1/289
- Stern et al. (2021) Stern, J., Faucher-Giguère, C.-A., Fielding, D., et al. 2021, ApJ, 911, 88, doi: 10.3847/1538-4357/abd776
- Strauss et al. (2002) Strauss, M. A., Weinberg, D. H., Lupton, R. H., et al. 2002, AJ, 124, 1810, doi: 10.1086/342343
- Sugahara et al. (2019) Sugahara, Y., Ouchi, M., Harikane, Y., et al. 2019, ApJ, 886, 29, doi: 10.3847/1538-4357/ab49fe
- Takada et al. (2014) Takada, M., Ellis, R. S., Chiba, M., et al. 2014, PASJ, 66, R1, doi: 10.1093/pasj/pst019
- Tchernyshyov et al. (2023) Tchernyshyov, K., Werk, J. K., Wilde, M. C., et al. 2023, ApJ, 949, 41, doi: 10.3847/1538-4357/acc86a
- Tinker et al. (2010) Tinker, J. L., Robertson, B. E., Kravtsov, A. V., et al. 2010, ApJ, 724, 878, doi: 10.1088/0004-637X/724/2/878
- Tumlinson et al. (2017) Tumlinson, J., Peeples, M. S., & Werk, J. K. 2017, ARA&A, 55, 389, doi: 10.1146/annurev-astro-091916-055240
- Tumlinson et al. (2013) Tumlinson, J., Thom, C., Werk, J. K., et al. 2013, ApJ, 777, 59, doi: 10.1088/0004-637X/777/1/59
- Weaver et al. (2023) Weaver, J. R., Davidzon, I., Toft, S., et al. 2023, A&A, 677, A184, doi: 10.1051/0004-6361/202245581
- Weiner et al. (2009) Weiner, B. J., Coil, A. L., Prochaska, J. X., et al. 2009, ApJ, 692, 187, doi: 10.1088/0004-637X/692/1/187
- Werk et al. (2013) Werk, J. K., Prochaska, J. X., Thom, C., et al. 2013, ApJS, 204, 17, doi: 10.1088/0067-0049/204/2/17
- Werk et al. (2014) Werk, J. K., Prochaska, J. X., Tumlinson, J., et al. 2014, ApJ, 792, 8, doi: 10.1088/0004-637X/792/1/8
- Werk et al. (2016) Werk, J. K., Prochaska, J. X., Cantalupo, S., et al. 2016, ApJ, 833, 54, doi: 10.3847/1538-4357/833/1/54
- Whitaker et al. (2012) Whitaker, K. E., van Dokkum, P. G., Brammer, G., & Franx, M. 2012, ApJ, 754, L29, doi: 10.1088/2041-8205/754/2/L29
- Wild et al. (2006) Wild, V., Hewett, P. C., & Pettini, M. 2006, MNRAS, 367, 211, doi: 10.1111/j.1365-2966.2005.09935.x
- Woodgate et al. (1998) Woodgate, B. E., Kimble, R. A., Bowers, C. W., et al. 1998, PASP, 110, 1183, doi: 10.1086/316243
- Wu et al. (2024) Wu, X., Cai, Z., Lan, T. W., et al. 2024, arXiv e-prints, arXiv:2407.17809, doi: 10.48550/arXiv.2407.17809
- York et al. (2000) York, D. G., Adelman, J., Anderson, John E., J., et al. 2000, AJ, 120, 1579, doi: 10.1086/301513
- Zheng et al. (2024) Zheng, Y., Faerman, Y., Oppenheimer, B. D., et al. 2024, ApJ, 960, 55, doi: 10.3847/1538-4357/acfe6b
- Zhou et al. (2023) Zhou, R., Dey, B., Newman, J. A., et al. 2023, AJ, 165, 58, doi: 10.3847/1538-3881/aca5fb
- Zhu (2016) Zhu, G. 2016, arXiv e-prints, arXiv:1612.06037, doi: 10.48550/arXiv.1612.06037
- Zhu & Ménard (2013a) Zhu, G., & Ménard, B. 2013a, ApJ, 770, 130, doi: 10.1088/0004-637X/770/2/130
- Zhu & Ménard (2013b) —. 2013b, ApJ, 773, 16, doi: 10.1088/0004-637X/773/1/16
- Zhu et al. (2014) Zhu, G., Ménard, B., Bizyaev, D., et al. 2014, MNRAS, 439, 3139, doi: 10.1093/mnras/stu186
- Zhu et al. (2015) Zhu, G. B., Comparat, J., Kneib, J.-P., et al. 2015, ApJ, 815, 48, doi: 10.1088/0004-637X/815/1/48
- Zou et al. (2018) Zou, S., Petitjean, P., Noterdaeme, P., et al. 2018, A&A, 616, A158, doi: 10.1051/0004-6361/201732033
- Zou et al. (2024) Zou, S., Jiang, L., Cai, Z., et al. 2024, ApJ, 960, 34, doi: 10.3847/1538-4357/ad09b2
- Zych et al. (2009) Zych, B. J., Murphy, M. T., Hewett, P. C., & Prochaska, J. X. 2009, MNRAS, 392, 1429, doi: 10.1111/j.1365-2966.2008.14157.x