Anisotropic temperature-dependent lattice parameters and elastic constants from first principles
Abstract
The Quasi-harmonic Approximation (QHA) is a widely used method for calculating the temperature dependence of lattice parameters and the thermal expansion coefficients from first principles. However, applying QHA to anisotropic systems typically requires several dozens or even hundreds of phonon band structure calculations, leading to high computational costs. The Zero Static Internal Stress Approximation (ZSISA) QHA method partly addresses such caveat, but the computational load of its implementation remains high, so that its volumetric-only counterpart v-ZSISA-QHA is preferred. In this work, we present an efficient implementation of the ZSISA-QHA, enabling its application across a wide range of crystal structures under varying temperature (T) and pressure (P) conditions. By incorporating second-order derivatives of the vibrational free energy with respect to lattice degrees of freedom, we significantly reduce the number of required phonon band structure calculations for the determination of all lattice parameters and angles. For hexagonal, trigonal, and tetragonal systems, only six phonon band structure calculations are needed, while 10, 15, and 28 calculations suffice for orthorhombic, monoclinic, and triclinic systems, respectively. This method is tested for a variety of non-cubic materials, from uniaxial ones like ZnO and CaCO3 to monoclinic or triclinic materials such as ZrO2, HfO2, and Al2SiO5, demonstrating a significant reduction in computational effort while maintaining accuracy in modeling anisotropic thermal expansion, unlike the v-ZSISA-QHA. The method is also applied to the first-principles calculation of temperature-dependent elastic constants, with only up to six more phonon band structure calculations, depending on the crystallographic system.
I Introduction
Understanding thermal expansion and elastic properties at varying temperatures and pressures is essential for predicting the thermomechanical behavior of crystalline materials in diverse applications. Except for the cubic crystallographic system, thermal expansion is inherently anisotropic, meaning it differs along various lattice directions. For the monoclinic and triclinic systems, the angle(s) will also change with temperature. This directional dependence plays a crucial role in material performance and the design of advanced devices. In certain cases, expansion may be negative or nearly zero along one direction while remaining positive along others, a key factor in controlling thermal stability and phase transitions Barrera et al. (2005); Karunarathne et al. (2021); Lee et al. (2025). First-principles methods, particularly those based on density functional theory (DFT) Hohenberg and Kohn (1964); Kohn and Sham (1965), have been extensively used to compute volumetric thermal expansion. However, accurately capturing anisotropic thermal expansion remains computationally demanding, as it requires evaluating free energy derivatives along multiple independent lattice directions.
The quasiharmonic approximation (QHA) Dove (1993); Lazzeri and de Gironcoli (1998); Carrier et al. (2007a); Allen (2020) is a well-established approach for modeling temperature-dependent material properties in solids with weak anharmonicity. This method accounts for changes in phonon frequencies due to lattice expansion while neglecting direct phonon-phonon interactions. QHA assumes that phonons remain harmonic, non-interacting, and primarily governed by lattice parameters and equilibrium atomic positions. Within this framework, the total free energy, including harmonic phonon contributions, is expressed as a function of both lattice parameters and internal atomic positions at a given temperature. Minimizing this free energy for different temperatures provides insights into how these structural degrees of freedom evolve with temperature and pressure.
QHA has been widely used to predict thermal expansion by tracking the temperature-dependent evolution of lattice parameters and to compute elastic constants Mathis et al. (2022); Mathis and Marianetti (2024); Gong and Dal Corso (2024) through the evaluation of free energy under applied strains. The approach enables the study of temperature-dependent mechanical properties and anisotropic lattice responses, making it a powerful tool for exploring thermoelastic behavior in a wide range of materials. The QHA Gibbs free energy consists of the phonon contribution, the Born-Oppenheimer (BO) energy at zero temperature, and the enthalpic term associated with external pressure. For metals, an additional correction accounts for the electronic free energy. Notably, even at absolute zero, the phonon free energy remains nonzero due to quantum zero-point motion.
Recent advances in first-principles techniques have enabled highly accurate phonon spectrum calculations, facilitated by methods such as density functional perturbation theory (DFPT) Baroni et al. (1987); Gonze (1997); Baroni et al. (2001); Gonze et al. (2005) and the finite displacement method Togo and Tanaka (2015). The reliability of these techniques has made high-throughput phonon calculations feasible, establishing QHA as a robust tool for predicting temperature-dependent thermodynamic and mechanical properties, provided that higher-order anharmonic effects remain minimal Masuki et al. (2022a); Allen (2015); Masuki et al. (2022b).
The computational cost of phonon spectra calculations remains a key limitation of QHA, making it significantly more demanding than the direct minimization of the BO energy to determine equilibrium lattice parameters and atomic positions. This challenge is particularly relevant for materials with low symmetry, where thermal expansion depends on multiple independent structural degrees of freedom. In contrast, for cubic systems, where volume is the only free parameter and all internal atomic positions are fixed by symmetry, QHA simplifies to a one-dimensional optimization problem requiring relatively few phonon calculations. For lower-symmetry structures, including tetragonal, rhombohedral, hexagonal, orthorhombic, monoclinic, and triclinic crystals, thermal expansion becomes more complex as multiple lattice parameters evolve independently with temperature. Additionally, internal atomic positions, which are not fully constrained by symmetry, must be determined. Precisely accounting for these effects within QHA poses significant computational challenges and frequently requires further approximations.
One widely adopted approach is the zero static internal stress approximation (ZSISA), introduced by Allan and colleagues in 1996 Allan et al. (1996); Taylor et al. (1997, 1999); Allen (2020). ZSISA reduces computational complexity by assuming that internal atomic positions can be determined solely by minimizing the BO energy at each fixed lattice configuration, rather than performing a full free energy minimization. By enforcing the condition that atomic forces vanish in the BO energy landscape, ZSISA introduces only second-order errors in neglected thermal internal stresses. While this approximation is effective for predicting macroscopic thermal expansion, its accuracy in describing temperature-dependent internal atomic displacements is more limited, particularly at high temperatures or in systems where zero-point energy effects are significant Liu and Allen (2018); Masuki et al. (2023). Despite these limitations, ZSISA remains a widely used approach for modeling anisotropic thermal expansion in QHA studies, particularly in uniaxial systems such as rhombohedral and wurtzite structures, where only two lattice degrees of freedom need to be considered Lichtenstein et al. (2000); Mounet and Marzari (2005); Carrier et al. (2007b); Palumbo and Corso (2017); Liu and Pantelides (2018); Ritz and Benedek (2018); Ritz et al. (2019); Li et al. (2021); Brousseau-Couture et al. (2022); Gong and Dal Corso (2024).
For low-symmetry crystals such as orthorhombic, monoclinic, and triclinic structures, the application of the ZSISA model becomes impractical due to the exponentially increasing computational cost of phonon spectrum calculations. Even in uniaxial systems, determining the temperature and pressure dependence of elastic constants and thermal expansion at high temperatures and pressures using ZSISA remains computationally very expensive Gong and Dal Corso (2024). This is because, to accurately capture high-pressure effects, the lattice undergoes significant changes, requiring multiple QHA calculations for different volumes. Consequently, researchers often resort to the volume-constrained zero strain internal structure approximation (v-ZSISA) Skelton et al. (2015) to manage these computational challenges. In this approach, the volume is treated as the primary degree of freedom, while all other structural parameters are optimized at a fixed volume.
Within the v-ZSISA-QHA framework, phonon spectra are typically computed for only seven to twelve different volumes Nath et al. (2016), significantly fewer than in a standard ZSISA approach, where free energy sampling across all degrees of freedom leads to an exponential increase in computational effort. Due to its reduced computational cost, most QHA studies in the literature rely on this approximation Togo et al. (2010); de-la Roza and Luana (2011a, b); Li et al. (2011); Gupta et al. (2013); Togo and Tanaka (2015); Skelton et al. (2015); Nath et al. (2016); Abraham and Shirts (2018). However, while v-ZSISA-QHA provides reasonable predictions for the temperature and pressure dependence of volumetric expansion, its accuracy in capturing anisotropic thermal expansion is considerably limited, often failing to align with experimental results Masuki et al. (2023).
Various approximations have been introduced to reduce the computational cost associated with QHA. One such approach is the linear Grüneisen method Allen (2020), which simplifies the problem by expanding the Born-Oppenheimer energy to second order and the phonon free energy to first order in the parameters being optimized. Unlike ZSISA and v-ZSISA, which reduce the effective dimensionality of the problem, the linear Grüneisen method maintains the full parameter space but achieves a more manageable scaling. This method estimates the derivative of the phonon free energy with respect to geometric parameters, such as volume, using Grüneisen parameters Grüneisen (1912), requiring only a limited number of phonon calculations, typically twice the number of parameters considered. While effective for predicting zero-point lattice expansion and its contribution to zero-point renormalization of the band gap energy in cubic and hexagonal materials Brousseau-Couture et al. (2022), the approach is inherently limited to the low-temperature regime (below the Debye temperature). At higher temperatures, its thermal expansion predictions become inaccurate, asymptotically saturating rather than continuing to increase as in QHA.
In our previous work Rostami and Gonze (2024), we introduced new intermediate methods bridging v-ZSISA and the linear Grüneisen approach by applying a Taylor expansion to the vibrational free energy while keeping the BO energy calculations exact. Since BO energy computations are significantly cheaper than phonon calculations, this strategy reduces computational cost without introducing unnecessary approximations. The most straightforward improvement over the linear Grüneisen method is to retain the full BO energy while using a minimal-order Taylor expansion for the phonon free energy.
We proposed three variants: v-ZSISA-, v-ZSISA-, and v-ZSISA-, which employ first-, second-, and fourth-order Taylor expansions of the phonon free energy, requiring only two, three, and five phonon calculations at different volumes, respectively.
To evaluate their accuracy, we applied these methods to 12 materials spanning diverse space groups, from cubic to monoclinic structures. Using v-ZSISA-QHA as the reference, we found that a quadratic expansion (using three phonon calculations) yields highly accurate results with an error below 1%, for our tested materials below 800 K, while a fourth-order expansion (five phonon calculations) closely matches the v-ZSISA-QHA reference. This highlights the effectiveness of our approach in significantly reducing computational costs while preserving high precision in volumetric thermal expansion predictions.
Accordingly, in the present work, we adopt a second-order Taylor expansion as a reliable approximation for the vibrational free energy. We extend the method to anisotropic systems and introduce the ZSISA- approach. This method applies a multidimensional Taylor expansion to the vibrational free energy, incorporating the system lattice degrees of freedom. By reducing the number of required phonon calculations compared to a full multi-dimensional mesh, it maintains accuracy while significantly lowering computational costs. The approach determines thermal stress using finite differences and optimizes the Born-Oppenheimer energy self-consistently to eliminate thermal stress at a given pressure. Once the equilibrium structure is identified at each temperature and pressure, second derivatives of the BO energy, obtained through DFPT, and the vibrational free energy, computed using finite differences, allow for the calculation of thermal expansion coefficients and elastic constants.
The validity of the proposed method is assessed by applying it to determine the anisotropic thermal expansion and elastic constants of materials with different crystallographic symmetries. The study includes cubic MgO, hexagonal ZnO, AlN, and GaN, trigonal \ceCaCO3 and \ceAl2O3, tetragonal \ceSnO2, orthorhombic \ceYAlO3, monoclinic \ceZrO2, \ceHfO2, and \ceMgP4, and triclinic \ceAl2SiO5. For the uniaxial cases, our method exhibits excellent agreement with ZSISA-QHA. For crystals with even lower symmetries, a direct comparison is not performed with ZSISA-QHA, as it is too expensive. However, our predicted anisotropic thermal expansion aligns well with experimental data for such cases, whereas v-ZSISA fails to capture these trends. In some instances, v-ZSISA even predicts an opposite trend, further emphasizing the advantage of our method in describing anisotropic effects.
The structure of this paper is as follows, Sec. II details the methodology, covering the definition of free energy, the quasiharmonic approximation (QHA), ZSISA and v-ZSISA, approximations for the vibrational free energy, thermal stress, determination of lattice parameters at finite temperature and external pressure, thermal expansion, and elastic constants. It also presents the equations for specific crystallographic cases, including orthorhombic and monoclinic structures. Sec. III describes the computational details and the materials studied. Sec. IV presents our results, followed by the conclusions in Sec. V Sec. VI provides an appendix with equations for the different crystal systems.
II method
II.1 The free energy
Consider the crystallographic parameters, including lattice constants, cell angles, and internal atomic positions, represented by , with ranging from to . In a scenario where symmetries are ignored, is given by . Here, 6 represents the macroscopic crystallographic parameters, and stands for the number of atoms within the primitive cell. The remaining parameters arise from the internal degrees of freedom, excluding the overall translational motion of the crystal. However, symmetry considerations reduce the number of truly independent crystallographic parameters significantly. Additionally, this framework can be expanded to include magnetic variables as part of the crystallographic parameters, utilizing techniques such as constrained-DFT Dederichs et al. (1984); Gonze et al. (2022). The entire set of parameters can be summarized as a vector , and the temperature-dependent behavior of these parameters, or , is the focus of this study.
Although lattice constants and angles are well-defined macroscopic quantities, internal atomic positions represent average values over a large ensemble of cells that make up the solid. In this context, it is assumed that atomic position fluctuations within each cell occur around a single average value, excluding cases where multiple local configurations with similar (or nearly similar) energies are present, causing the system to transition between these configurations over time. Additionally, it is assumed that these crystallographic parameters can be continuously altered through the application of external stresses and internal forces within a computational framework, where the latter are applied uniformly across a sublattice associated with a specific average atomic position.
To determine the temperature-dependent crystallographic parameters at zero pressure, the Helmholtz free energy must be minimized according to the following:
| (1) | ||||
| (2) |
The temperature dependence of the parameters is therefore determined implicitly through the minimization condition given in Eq. (1), which leads to:
| (3) |
The free energy, , is composed of several components: the Born-Oppenheimer internal energy at absolute zero (0 K), which is independent of temperature; the vibrational (phonon) contribution to the free energy; and additional corrections such as electronic entropy and interactions between electrons and phonons. These corrections might be relevant for metals at very low temperatures but are generally negligible for insulators. Therefore, the Helmholtz free energy can be approximated as:
| (4) |
In this study, we assume that the BO energy, , can be computed quickly from first principles, especially compared to the time required to calculate the vibrational free energy, , which is also derived from first principles. However, it is important to note that the gradients of with respect to the parameters are not directly available. They can, however, be estimated using finite difference methods. Each calculation of for a different set of needs to be meticulously planned.
By substituting Eq. (4) into Eq. (3), we obtain a more explicit condition for determining :
| (5) |
The right side of Eq. (5) is referred to as the thermal gradient at the point . If corresponds to a cell parameter, then represents a stress. If corresponds to an atomic position, it represents a generalized or collective force.
Since reaches a minimum at , it follows from Eq.(3) that, for any and ,
| (6) |
Applying the chain rule to obtain the total derivative of this expression gives
| (7) |
Consequently, can be obtained using the inverse of the second derivative matrix of the free energy, expressed as follows
| (8) |
where represents the entropy.
II.2 The Quasi-Harmonic Approximation (QHA)
In the Quasi-Harmonic Approximation, we treat atomic vibrations as harmonic, but we allow the vibrational frequencies to change depending on the crystallographic parameters and the positions of atoms within the structure. To make this dependency clear, we express the frequencies as , where q represents the phonon wavevector with the phonon branch index. Such calculations are well-defined within a first-principles approach: the interatomic force constants are derived from the second-order derivatives of the BO energy, supposing that the parameters are those for which Eq.(5) is fulfilled at that temperature, namely, supposing that the BO gradient is cancelled by the thermal gradient.
The vibrational free energy is then calculated using Bose-Einstein statistics, , which gives the occupation number for each phonon mode. This also includes the contribution from zero-point motion. Specifically, the vibrational free energy per unit cell is
| (9) |
and the entropy per unit cell is given by
| (10) |
where, represents the Brillouin zone volume, related to the primitive cell volume by . It is important to note that the phonon frequencies do not depend directly on temperature, in contrast to the phonon occupation numbers that are given by Bose-Einstein statistics
| (11) |
II.3 ZSISA and v-ZSISA
In the ZSISA method, crystallographic parameters can be divided into external and internal strains. The internal strains are those associated with the internal degrees of freedom, such as atomic positions within the unit cell, while the external strains refer to parameters like lattice constants, angles, or volume. The approximation involves optimizing the internal strains by adjusting atomic positions, while the external strains, such as lattice constants, are held constant. This approach simplifies the problem by considering internal strains as a function of external strains.
If the external strain is limited to changes in volume only, this approach is known as the v-ZSISA approximation. In this approach, the free energy defined in Eq.4 is minimized at a fixed volume to determine the values of the remaining degrees of freedom, such as lattice parameters, angles, and internal atomic positions.
At a given temperature and equilibrium volume , the derivative of the free energy with respect to volume, which corresponds to the pressure, is zero. This condition can be expressed as
| (12) | ||||
| (13) |
where the and denote Born-Oppenheimer pressure and the vibrational (thermal) pressure, respectively. At equilibrium volume for a specific temperature, these two pressures must cancel each other out:
| (14) |
In more general scenarios, where ZSISA is applied to external strains affecting lattice constants or angles, all components of the stress tensor must vanish. This condition is expressed as
| (15) | ||||
| (16) |
where and are the -th components of the stress and strain tensors, respectively. and represent BO and vibrational (thermal) stresses. The set of lattice vectors is defined as
| (21) |
The temperature dependence of the vectors and their components have been omitted for the sake of compactness. Thus, the volume is simply obtained as
| (22) | ||||
Subsequently, at equilibrium, the BO and vibrational stresses must cancel each other out:
| (23) |
When considering a constant external pressure , the Gibbs free energy is given by
| (24) | |||
Thus, the derivative of the Gibbs free energy with respect to volume in v-ZSISA becomes
| (25) | ||||
which simplifies to:
| (26) |
Similarly, for ZSISA, if a uniform external pressure is applied, it will affect the diagonal components of the stress tensor. Specifically, the total stress tensor under a uniform external pressure is modified by this external pressure and is such that:
| (27) |
In this context, the external pressure effectively adds a term to the diagonal components of the stress tensor. Such modification results in a shift in the equilibrium conditions and can influence the response of the material to external stresses. All this might be trivially generalized to the case of anisotropic external stress (not developed in this work, though).
In both v-ZSISA-QHA and ZSISA-QHA methods, the interpolation of free energies necessitates phonon spectra calculations at multiple volumes, with the number of calculations determined by the degrees of freedom (DOF) of the lattice. This process can be computationally demanding. For the case where only the volume is considered, or in the case of a cubic system with a single DOF for the lattice constant, at least five phonon spectra calculations are required to adequately fit an equation of state (EOS).
In systems with two DOFs, such as hexagonal, trigonal, or tetragonal lattices, a grid of 5 5 points (five for each DOF) is needed to interpolate a parabola to determine the free energy. As the number of DOFs increases, as in orthorhombic (3 DOFs), monoclinic (4 DOFs), and triclinic (6 DOFs) lattices, the number of necessary phonon calculations grows exponentially, scaling as , , and , respectively. Although these calculations are significantly fewer compared to the full QHA, they still pose substantial computational challenges for many systems.
To address this issue, various approximations can be employed to achieve comparable accuracy while reducing the computational cost of these calculations. In our previous work, we proposed approximations for v-ZSISA-QHA that utilize a Taylor expansion of to reduce the number of required phonon band structure calculations, while preserving the BO energies at multiple volumes. In that study, we examined the accuracy of the Taylor expansion approximation for the vibrational free energy and determined the necessary expansion order. Results indicated that, for most materials, including terms up to the second derivative, with three phonon band structure calculations, is sufficient to reproduce the results of the QHA. We referred to this approach as approximation. This finding provides a foundation for extending the advantages of to complex crystallographic systems with higher lattice degrees of freedom. In this work, we propose a new approximation method designed to accommodate systems with any number of degrees of freedom, from uniaxial to triclinic crystals.
II.4 Approximation of the vibrational free energy
In ZSISA, the lattice vectors correspond to the external strains, and the internal atomic coordinates, which minimize the atomic forces, are functions of these strains. To account for the vibrational contributions, the phonon free energy is expanded around a reference crystallographic lattice configuration ] using a Taylor series in terms of the strain deviation, stopping at second order.
According to the approximation, to derive the free energy from Eq. II.3, the expression for is preserved without any approximations. To incorporate vibrational contributions, the phonon free energy is expanded around a reference crystallographic lattice configuration using a Taylor series in terms of strain deviation, stopped at the second order.
To facilitate the analysis, we define the strain matrix as follows:
| (31) |
Here, , , are the normal strains along the , , and directions, respectively, while the off-diagonal terms , , represent shear strains.
Consider , the lattice vectors of the structure at the minimized BO energy. The deformed lattice vectors under applied strains can be defined as:
| (32) | ||||
| (39) |
This matrix transformation captures how the lattice vectors deform under the influence of strain. This deformation results in:
| (43) |
In this formulation, the independent parameters are the strain components, allowing the equation to be expressed in terms of these strains.
The phonon free energy is then expressed as a Taylor series expansion around a reference lattice configuration , that might be equal to the BO configuration or not, which is defined by the strain . The expansion is written in terms of the strain deviation, , and is truncated at the second order:
| (44) |
where represents the indices {}, corresponding to the non-zero components of .
With representing the number of lattice degrees of freedom, the minimum number of configurations required to compute the Taylor expansion is .
To compute the diagonal second derivatives at the reference configuration , three points are required for each value of : one at the central configuration , and two additional configurations corresponding to deformations . This results in a total of configurations.
For the mixed second derivative , four points are typically needed in a simple approach corresponding to , which are symmetrically distributed around . Instead, to minimize the number of required calculations, we arrange the points as follows: , , , and . Three of these points overlap with those used to compute and , so only one additional configuration is required for each unique pair of and . This results in a total of extra points.
The choice of the reference lattice configuration plays an important role in ensuring accurate results. If falls within the expected range of lattice parameters across different temperatures and pressures, the calculations yield more reliable predictions. In our previous work on the v-ZSISA approach, we demonstrated that for materials with positive thermal expansion, shifting the reference structure away from the BO lattice in the direction of expansion improves accuracy. A similar strategy is applied here, where is adjusted based on the anticipated thermal expansion and pressure effects. When external pressure is applied, materials typically exhibit positive thermal expansion, yet their lattice parameters at zero temperature become smaller than the BO configuration at zero pressure. Therefore, selecting an appropriate that accounts for both thermal and pressure-induced effects is crucial for achieving precise results. In the present work, since we are considering low-pressure conditions, we focus primarily on the thermal expansion behavior. Accordingly, we introduce a positive shift in to ensure that our calculations yield the expected positive thermal expansion of the studied materials. However, at high pressures, an alternative approach is to define the BO structure as the lattice relaxed at that pressure, rather than at zero pressure. In this case, applying a positive shift in the direction of thermal expansion remains an effective strategy for accurately capturing the material’s behavior.
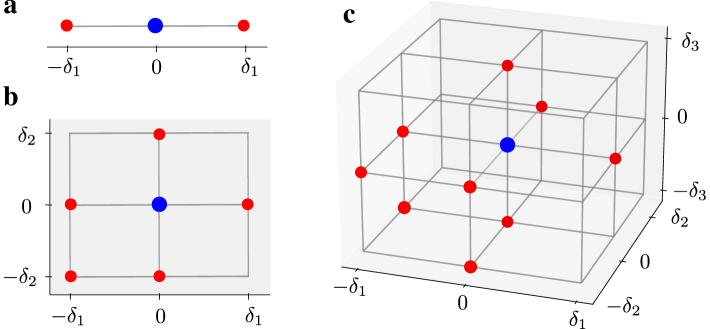
Figure 1 presents the points where phonon spectra calculations are performed for systems with 1, 2, and 3 degrees of freedom. The central blue point is the reference calculation , while red points indicate the additional calculation needed to obtain finite difference data up to second degree for each degree of freedom , including cross derivatives. For 1, 2, and 3 DOF, the total number of calculations are 3, 6, and 10, respectively. Additionally, for systems with 4 and 6 DOF, 15 and 28 calculations are required. In Table 1, the number of degrees of freedom and the corresponding required number of phonon spectra calculations for various crystal structures are listed.
At this stage, the vibrational contribution to from Eq.(II.3), is obtained by quadratic extrapolation over the -dimensional surface. We are left with the BO contribution evaluation. If we perform a fit of the -dimensional BO energy and determine the lattice parameters by minimizing the free energy, as expressed in Eq.(2), we face still a problem with the explosion of the number of such BO calculations. For example, using five interpolation points along each DOF to obtain a multidimensional BO grid, leads to a total number of configurations scaling as , which grows exponentially with the number of DOF. For each of these configurations, the BO energy must also satisfy the ZSISA condition, requiring full atomic position relaxation which is a computationally intensive process. In such an approach, one does not take benefit from the well-known easy computation of forces and stresses for the DFT BO calculation. To overcome this challenge, we propose an alternative approach based on thermal stress, which bypasses the need to fit an -dimensional surface.
II.5 Thermal stress
Once is determined, Eq.(44), its derivatives can be evaluated directly as:
| (45) |
The thermal stress is then obtained by:
| (46) |
where is the strain referenced specifically to the structure at which the derivative is performed, here, , rather than the reference structure used for . The scaling factor is necessary to ensure that strain is always derived from the specific structure under consideration. In Eq. (32), is defined as a strain applied to . However, this definition is not unique and the strain can be defined with respect to other configurations as well. In particular, the stress definition is the derivative evaluated at a state where the strain is zero. Therefore, this scaling is essential to maintain consistency.
To obtain the conversion factor, we define the applied strain , by expressing with respect to :
| (47) |
By substituting this relation into Eq. (32), we arrive at the following expression:
| (48) |
Differentiating with respect to , we obtain for all values of :
| (49) |
In the special case where , the strain becomes zero. Let denote the strain corresponding to . Substituting this into the equation, the strain derivative simplifies to:
| (50) |
Using these thermal stresses, the BO stress can be evaluated via Eq. (27). Knowing the BO stress, the optimized BO configuration can be found by enforcing a constraint to maintain the correct stress.
The optimization of a geometric structure in order to have zero net atomic force and zero stress is common in all electronic structure packages. It is usually also possible to optimize a geometric structure under a given external pressure. The relaxation under an arbitrary external anisotropic stress might not be so common. This is an advanced feature implemented in ABINIT for a long time. One can relax both the lattice and atomic positions with a specified external stress tensor and specified atomic forces, using the usual algorithms for geometric relaxation. This is quite efficient and well-tested, and the computational effort is much lower than the computation of a full phonon band structure.
| Crystal | Strain | DOF | #deform | |||
|---|---|---|---|---|---|---|
| Bulk | ||||||
| Cubic | 1 | 3 | ||||
|
2 | 6 | ||||
| Orthorhombic | 3 | 10 | ||||
| Monoclinic | 4 | 15 | ||||
| Triclinic |
|
6 | 28 | |||
| Slab | ||||||
| Isotropic | 1 | 3 | ||||
| Anisotropic (2DOF) | 2 | 6 | ||||
| Anisotropic (3DOF) | 3 | 10 |
Due to symmetry constraints in various crystallographic structures, certain components of the strain matrix are inherently zero, meaning that not all stresses need to be computed. Table 1 lists the non-zero components of the strain matrix for different primitive cell structures, showing how these symmetry restrictions reduce the number of independent degrees of freedom in each configuration. In all crystals except monoclinic, triclinic, and anisotropic slab with 3 DOFs only normal (diagonal) strains are non-zero, with shear strains absent. For cubic crystals, all diagonal strains are equal, while in hexagonal, trigonal, and tetragonal crystals, two diagonal strains ( and ) are equal, allowing to vary independently. The number of deformations required to determine the stress components follows the same approach discussed in the previous section.
After determining the thermal stress at a given temperature, the next step is to solve Eq. (27) self-consistently to obtain the final lattice configuration and corresponding properties.
II.6 Finding lattice parameters at and
The process of finding the optimal lattice parameters at a specified temperature and external pressure involves several iterative steps. We begin by generating deformations from an initial configuration , applying strains consistent with the system symmetries. From these, we determine the vibrational free energy and thermal stress, which provide the basis for identifying the optimal volume and lattice parameters.
The first step in this process is to obtain an initial guess for the lattice configuration . Using this guess, we compute the thermal stress. Since this does not necessarily correspond to the minimum free energy at temperature , the condition in Eq. (27) is not satisfied initially.
To address this, we define a target stress as follows:
| (51) |
The value of is determined from the quadratic approximation, so without doing any recomputation of the phonon band structure. The goal is to find a lattice configuration such that the target stress matches the BO stress . While the BO stress may differ for the initial guess, we can solve this self-consistently.
Using our initial guess, we compute the target stress. With this target stress, we relax the lattice and atomic positions by minimizing forces while imposing the constraint that the target stress is achieved, following the ZSISA approach. This relaxation step alters the lattice until the stress target is met.
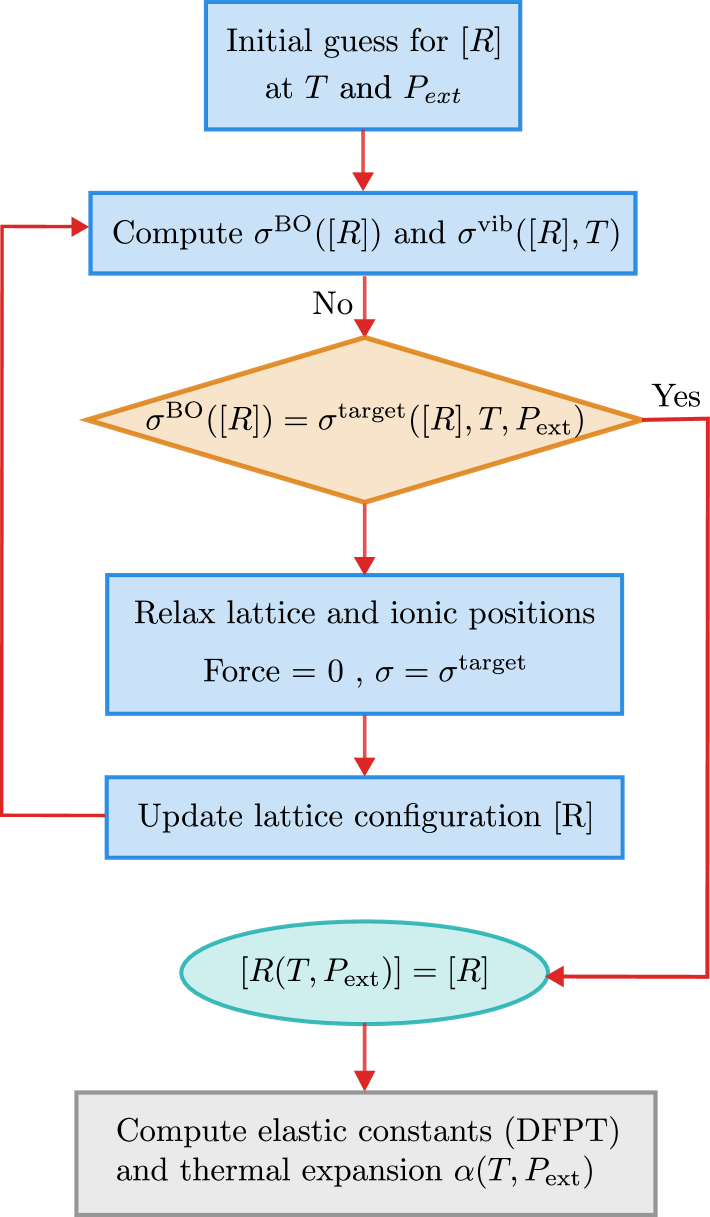
After each relaxation, we recompute the thermal stress for the updated lattice and adjust the target stress accordingly. For each temperature, and (possibly) each external applied pressure, the process is repeated iteratively until the system converges, ensuring that the thermal stress and the BO stress match. The calculation flow for finding the lattice parameters is depicted in Fig. 2.
II.7 Thermal expansion
Once the lattice parameters are obtained at each temperature and pressure, the thermal expansion of different lattice dimensions and angles can be computed using a finite-difference method. However, due to minor computational errors introduced by DFT or DFPT calculations, using a standard finite difference method or polynomial interpolation may result in noise in the computed thermal expansion.
To address this, an alternative approach based on Eq. (8) and (10) can be employed to obtain thermal expansion with improved accuracy. By substituting Eq. (4) and Eq. (44) into Eq. (8) with Eq.(10), we can express:
| (52) | ||||
| (53) | ||||
| (54) | ||||
The first term, which represents the second derivative of the BO energy, can be computed using DFPT calculations of the elasticity tensor Hamann et al. (2005). The elasticity tensor has 6 by 6 elements defined as:
| (55) | ||||
Consequently, we can express:
| (56) |
where and denote the strain components under consideration, specifically .
The second term, representing the second derivative of at the reference configuration , is computed using finite difference methods applied to non-zero strain components. The third term corresponds to the second derivative of the volume with respect to strain components at . For off-diagonal components (, where and are in ), this term equals , while all other terms are zero. is determined from Eq.(10) on the same set of points as for the vibrational free energy. This allows its quadratic interpolation as a function of the strain tensor, and hence the computation of its derivative with respect to the strain tensor.
Thus, after determining , a single DFPT calculation at the point is sufficient to obtain the thermal expansion at each and .
II.8 Elastic constants
In addition to thermal expansion, the elastic constants at different temperatures and pressures can also be derived. The elastic constants are defined as:
| (57) |
We can express the free energy as a sum of the vibrational and BO energies:
| (58) | ||||
Considering the symmetry constraints discussed in earlier sections, second derivatives of the vibrational free energy are omitted in cases where the first derivatives vanish. However, to determine the complete set of thermal elastic constants, additional calculations are necessary to account for all non-zero elements of the elastic tensor. To achieve this, additional deformations and phonon spectra calculations must be performed. Moreover, the deformations required for thermal expansion may differ from those needed to determine elastic constants. The distinction lies in the fact that, for thermal expansion, the use of crystal symmetries allows for a significant reduction in the number of required phonon spectra calculations.
For cubic and uniaxial structures, thermal expansion can be treated as a one- or two-dimensional problem, requiring only 3 and 6 deformations, respectively. In contrast, determining elastic constants necessitates treating 3 DOFs, similar to orthorhombic crystals, to fully evaluate the elastic tensor for , , components. Despite this, the number of calculations remains lower than that for orthorhombic structures due to symmetry considerations. Specifically, the 10 deformations needed for orthorhombic systems reduce to 4 and 7 for cubic and uniaxial crystals, respectively.
If the objective is to determine thermal expansion alongside elastic constants, the deformations required for elastic constants should be employed from the beginning. Table 2 summarizes the non-zero elastic constants for various crystal systems and the number of deformations required to compute them.
| Crystal | Elastic constant | #deform | ||
|---|---|---|---|---|
| Cubic | 6 | |||
| Hexagonal | 9 | |||
|
10 | |||
| Tetragonal | 11 | |||
| Orthorhombic |
|
16 | ||
| Monoclinic |
|
18 | ||
| Triclinic |
|
28 |
Here, we present the equations for two cases, orthorhombic and monoclinic. The equations for the remaining crystal and slab structures, as listed in Table 1, are provided in the Appendix.
II.9 Orthorhombic case
For sake of compactness, in this subsection and the following one, the dependence of the components of the lattice vectors is not explicitly indicated, unlike their temperature dependence. For the orthorhombic case, given the strain matrix , with only diagonal elements, the lattice vectors can be determined as follows:
| (62) |
Note that this accounts for different orthorhombic Bravais lattices (also centered/face centered ones), for which the primitive vectors might not be aligned with the , or directions. The use of the primitive cell is the most economical for DFT and DFPT calculations, but it is easier to focus on conventional directions , or to characterize the temperature dependence of the geometry of the crystal. For this purpose, we define new parameters , , and that represent the lengths of the components of the lattice vectors in the , , and directions. These are calculated as:
| (63) | |||
The strain components relative to the unstrained (Born-Oppenheimer) configuration can subsequently be determined using the following expressions:
| (64) | |||
Employing Eq. (II.5) the thermal stress can be computed as:
| (65) | ||||
In these equations, scaling factors (, , and ) are applied because the strains are calculated relative to the equilibrium lattice , while the thermal stresses require derivatives with respect to the lattice at , as described previously. For orthorhombic structures, the equations provided are general and applicable to any choice of primitive cell.
II.10 Monoclinic case
For the monoclinic case, to simplify the calculations and corresponding implementation, we use a standardized definition of the primitive cell. In this standardized definition, the lattice has four degrees of freedom: , , , and . Correspondingly, the lattice vectors for a simple monoclinic primitive cell can be defined as follows:
| (69) | ||||
| (73) | ||||
| (77) |
Therefore, the strain components for a monoclinic structure can be defined as:
| (78) | ||||
and we can obtain the thermal stress as follow:
| (79) |
III Computational details
The calculations for ground-state energies were performed using Density Functional
Theory (DFT), while phonon frequencies were determined via Density-Functional
Perturbation Theory (DFPT). Spin-orbit interactions were not included in these
simulations. Optimized norm-conserving Vanderbilt pseudopotentials Hamann (2013)
carefully validated against all-electron full-potential methods Lejaeghere et al. (2016); Bosoni et al. (2023)
were sourced from the
Pseudo-Dojo project van Setten et al. (2018), and the exchange-correlation
effects were described using the GGA-PBEsol functional Perdew et al. (2008).
Lattice parameters and atomic positions were optimized iteratively until forces on
atoms were less than Hartree/Bohr3 and stress components were
below Hartree/Bohr3.
To produce smooth energy-volume curves, an energy cutoff smearing parameter of 1.0
Ha was applied Laflamme Janssen et al. (2016).
Brillouin zone integrations were carried out with carefully chosen wavevector
grids
ensuring that errors in total energy remained under 1
meV per atom. The specific parameters used for each material are listed in
Table 3.
All computations were executed using the ABINIT software suite (version
9.10.3) Gonze et al. (2002, 2020); Romero et al. (2020). The phonon density of states
(PHDOS) was calculated through a Gaussian broadening approach
with a smearing value of 1 cm-1 (approximately
Hartree),
which is the default value for ABINIT versions above v9.10.
The reference structure, where a uniform strain shift is applied to the diagonal components. Specifically, the strain components are set as . However, no shift is applied to the off-diagonal strain components () since their thermal variation is not well understood. These components are related to changes in lattice angles rather than direct expansion or contraction, making it uncertain how they should be adjusted for thermal expansion.
III.1 Materials
We analyze the thermal properties of 12 materials using a combination of the ZSISA method and the approximation approach to account for anisotropic behavior. These materials encompass a wide range of crystallographic symmetries, providing a robust framework for investigating anisotropic thermal properties. Among the cubic systems, MgO was studied, while ZnO, GaN, and AlN represented the hexagonal group. Trigonal materials included \ceCaCO3 and \ceAl2O3, and tetragonal systems were exemplified by PbO and \ceSnO2. In the orthorhombic group, \ceYAlO3 was analyzed, whereas \ceZrO2, \ceHfO2, and \ceMgP4 belong to the monoclinic category. Finally, the triclinic group was represented by \ceAl2SiO5. This diverse selection spans the principal crystallographic space groups, enabling a comprehensive study of the anisotropic thermal properties across various regions. material classes.
For cubic systems, simpler approaches such as the v-ZSISA-QHA method or similar approximations Rostami and Gonze (2024) may be preferred to calculate the thermal expansion, as the new method does not offer significant advantages in this regard. However, when it comes to computing elastic constants, the utility of this new method becomes apparent. Therefore, for MgO, we focused on calculating the elastic constants to demonstrate its applicability and effectiveness.
We did not generate QHA results for all materials due to their significant computational expense and resource demands. As an initial test of the proposed approximations, we applied the full ZSISA-QHA method to a few uniaxial systems, with ZnO presented here as a representative case.
For materials with more than two lattice degrees of freedom, the computational cost of phonon spectra calculations increases considerably, even taking into account (reduced) symmetries. Consequently, testing the ZSISA-QHA method for those systems with lower symmetries was not undertaken. For these cases, we nevertheless performed an internal check inside the method, comparing the thermal stress approach with the results obtained from fitting the high-dimensional free energy. For monoclinic \ceZrO2, which has four degrees of freedom, we constructed a 4D surface of free energies. This required 625 BO energy evaluations for while the second degree Taylor expansion for the phonon free energy relied on 15 phonon spectra calculations for . The results were consistent between both approach, with a demonstrated high accuracy. These results emphasize the practicality and reliability of the approach for systems with complex anisotropic properties.
| Material | Group | Lattice (Å) | (∘) | lDOF | #atoms | iDOF | (Ha) | k-grid/ | ||||||||||||||
|---|---|---|---|---|---|---|---|---|---|---|---|---|---|---|---|---|---|---|---|---|---|---|
| DFT | Exp. | DFT | Exp. | q-grid | ||||||||||||||||||
| Cubic: | ||||||||||||||||||||||
| \ceMgO | a= 4.214 | a=4.212 Li et al. (2006) | = 90 | = 90 | 1 | 2 | 0 | 60 | 8 8 8 | |||||||||||||
| Hexagonal : | ||||||||||||||||||||||
| \ceZnO |
|
|
|
|
2 | 4 | 1 | 42 | 6 6 4 | |||||||||||||
| \ceAlN |
|
|
|
|
2 | 4 | 1 | 40 | 6 6 4 | |||||||||||||
| \ceGaN |
|
|
|
|
2 | 4 | 1 | 40 | 6 6 4 | |||||||||||||
| Trigonal: | ||||||||||||||||||||||
| \ceCaCO3 | a= 6.313 | a=6.344 Wang et al. (2018) | = 46.58 | Wang et al. (2018)= 46.31 | 2 | 10 | 1 | 42 | 5 5 5 | |||||||||||||
| \ceAl2O3 | a= 5.133 | a=5.129 Grabowski et al. (2018) | = 55.35 | Grabowski et al. (2018)=55.28 | 2 | 10 | 2 | 42 | 4 4 4 | |||||||||||||
| Tetragonal: | ||||||||||||||||||||||
| \ceSnO2 |
|
|
= 90 | = 90 | 2 | 6 | 1 | 45 | 5 5 7 | |||||||||||||
| Orthorhombic: | ||||||||||||||||||||||
| \ceYAlO3 |
|
|
= 90 | = 90 | 3 | 20 | 7 | 45 | 3 2 3 | |||||||||||||
| Monoclinic: | ||||||||||||||||||||||
| \ceZrO2 |
|
|
|
|
4 | 12 | 9 | 42 | 4 4 4 | |||||||||||||
| \ceHfO2 |
|
|
|
|
4 | 12 | 9 | 42 | 4 4 4 | |||||||||||||
| \ceMgP4 |
|
|
|
|
4 | 10 | 6 | 42 | 4 4 3 | |||||||||||||
| Triclinic: | ||||||||||||||||||||||
| \ceAl2SiO5 |
|
|
|
|
6 | 32 | 48 | 42 | 3 2 2 | |||||||||||||
IV Results and Discussions
The proposed method was tested on various materials representing a wide range of crystallographic structures, from cubic to triclinic. For cubic structures, applying this thermal expansion method using thermal stress does not offer significant advantages over the v-ZSISA- approach introduced in our previous work Rostami and Gonze (2024). In fact, the computational effort may exceed that of the previous method. However, the current approach proves beneficial for computing elastic constants at finite temperatures and pressures, requiring only five phonon spectra calculations to determine the three independent elastic constants (two more than for the volume only). To illustrate this, we used \ceMgO as a representative cubic material for elastic constant calculations.
For uniaxial systems, including hexagonal, trigonal, and tetragonal structures, we computed thermal expansion for several compounds. These include ZnO, GaN, and AlN in the wurtzite structure (space group ), \ceCaCO3 and \ceAl2O3 in the rhombohedral structure (space group ), and \ceSnO2 in the tetragonal structure (space group ), as summarized in Table 3.
Orthorhombic \ceYAlO3 was selected as a representative material for orthorhombic structures. In the monoclinic category, we examined \ceZrO2, \ceHfO2, and \ceMgP4, all with space group . Finally, \ceAl2SiO5 (space group ) was chosen as a representative of triclinic symmetry. The number of atoms in the primitive unit cell for each structure is also provided in Table 3. The reference structure includes base strains of and , consistent with the positive thermal expansion behavior of our materials. In our calculations, is chosen as the relaxed BO configuration at zero strain and zero pressure, serving as the reference point for all deformation calculations. We used a total of 20 temperature points to obtain our results, employing an adaptive step size strategy to balance precision and efficiency. From 0 K to 200 K, where thermal behavior changes more rapidly, a finer step size of 25 K was chosen. Between 200 K and 500 K, a step size of 50 K was used, while for temperatures above 500 K up to 1000 K, a larger step size of 100 K was sufficient due to the smoother thermal response at higher temperatures.
In this work, we present detailed results for MgO, ZnO, and \ceZrO2. The results for the remaining materials are included in the Supplemental Material (SM) SM .
IV.1 MgO
MgO, with its cubic structure, has a lattice constant of a=4.214 Å in our computational setup. For thermal expansion calculations, only one degree of freedom governs the lattice, making the process equivalent to the method from our previous work. This approach simplifies the procedure by interpolating the total energy at different volumes with selected values to fit an equation of state (EOS), eliminating the need for a complete workflow to determine . In contrast, computing elastic constants requires treating the cubic primitive cell as monoclinic to capture all necessary distortions and determine each non-zero element of the elastic constants tensor. There are important differences when applying monoclinic deformations to cubic systems. Due to symmetry, the deformations along the , , and directions are equivalent, as are the shear strains , , and . This symmetry reduces the number of required deformations. Furthermore, since the first derivative of the free energy, and consequently the stress, is zero for non-orthogonal directions (, , ), it is possible to use orthorhombic equations for computing , simplifying the overall process.
However, to compute , one additional equation is necessary to find the second derivative . Unlike the monoclinic case, where symmetric deformations are used, cubic symmetry necessitates applying both and . This distinction arises from the equivalence of symmetric strain variations due to the zero derivative of in the direction and is further explained in the appendix, where the unique deformation requirements for cubic and uniaxial systems are discussed. The applied strains for elastic constant calculations were , , , , and with .
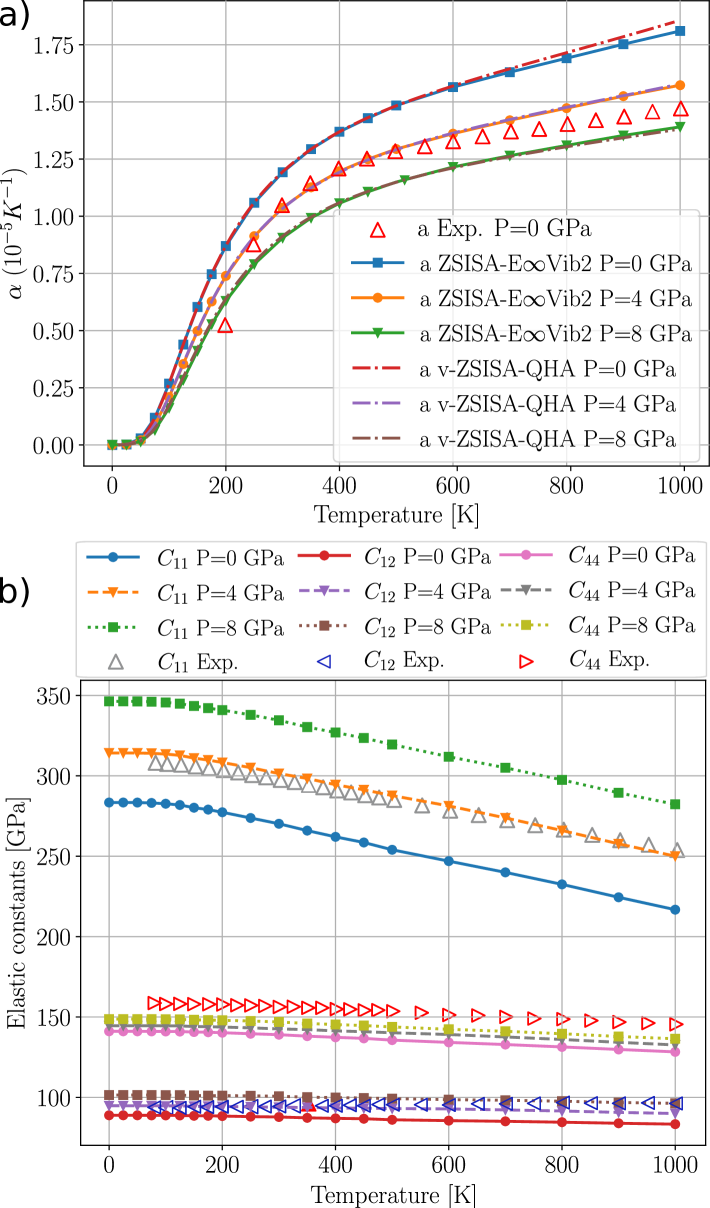
Figure 3 presents the thermal expansion and elastic constants of MgO as a function of temperature at different external pressures. The top panel compares the thermal expansion obtained using the v-ZSISA-QHA method (dashed lines) with the proposed orthorhombic approach (solid lines with markers) for three external pressures: 0, 4, and 8 GPa. Experimental data at zero pressure are shown as discrete points for validation. In the v-ZSISA-QHA method, thermal expansion is derived from calculations at eight different volumes, ranging from 0.94 to 1.08 times the equilibrium BO volume, with increments of 0.02. The data are fitted using the Vinet equation of state Vinet et al. (1987).
The results indicate that the temperature dependence of thermal expansion predicted by v-ZSISA-QHA and the orthorhombic method are in good agreement, with minor discrepancies attributed to numerical errors. However, neither theoretical approach fully matches experimental values due to anharmonic effects in MgO, which are not captured within QHA. Nonetheless, since the objective of this study is to evaluate QHA-based methods, the results remain valid in temperature ranges where QHA is applicable.
The bottom panel illustrates the temperature dependence of the elastic constants , , and for =0 GPa (solid lines with markers), 4 GPa (dashed lines with markers), and 8 GPa (dotted lines with markers). Experimental values at =0 GPa are included for comparison. The computed elastic constants exhibit a decreasing trend with temperature and an increasing trend with pressure, consistent with experimental data. However, even at 0 K, the discrepancy between theoretical elastic constants and experimental ones (at 0 GPa) is on the order of a few percent, due to the exchange-correlation functional inaccuracy.
IV.2 ZnO
For ZnO in the wurtzite structure, the optimized lattice parameters are a=3.227 Å, and c=5.206 Å. The planewave kinetic energy cutoff (ecut) is set to 42 Ha, and a k-grid and q-grid of is used for Brillouin zone sampling. For all calculations, the internal degrees of freedom of the atomic positions are fully optimized to minimize forces on the atoms. ZnO in the wurtzite structure can be analyzed using either hexagonal symmetry or lower-symmetry configurations involving three or more degrees of freedom. For hexagonal symmetry with three DOF, the relevant strain components are , , and , analogous to the orthorhombic case. However, in the hexagonal system, symmetry constraints reduce the independent strain components, with simplifying the equations to a 2DOF model.
The 2DOF approach offers substantial computational advantages for two main reasons. First, it reduces the number of required deformations from 7 to 6, streamlining the overall calculation process. More importantly, it preserves hexagonal symmetry in all deformations, whereas the 3DOF approach breaks this symmetry, resulting in lower-symmetry configurations that demand more computational resources. Since phonon spectra calculations are significantly faster for higher-symmetry structures, adopting the 2DOF treatment not only reduces the number of deformations, but also lowers the computational cost for each deformation.
Different strain configurations are required for thermal expansion and elastic constant calculations to account for the symmetry constraints involved in each process. The strain patterns used for thermal expansion are , , , , .
For combined elastic constant and thermal expansion calculations, the following strain patterns are applied , , , , , , and where the magnitude of strain increment is set to .
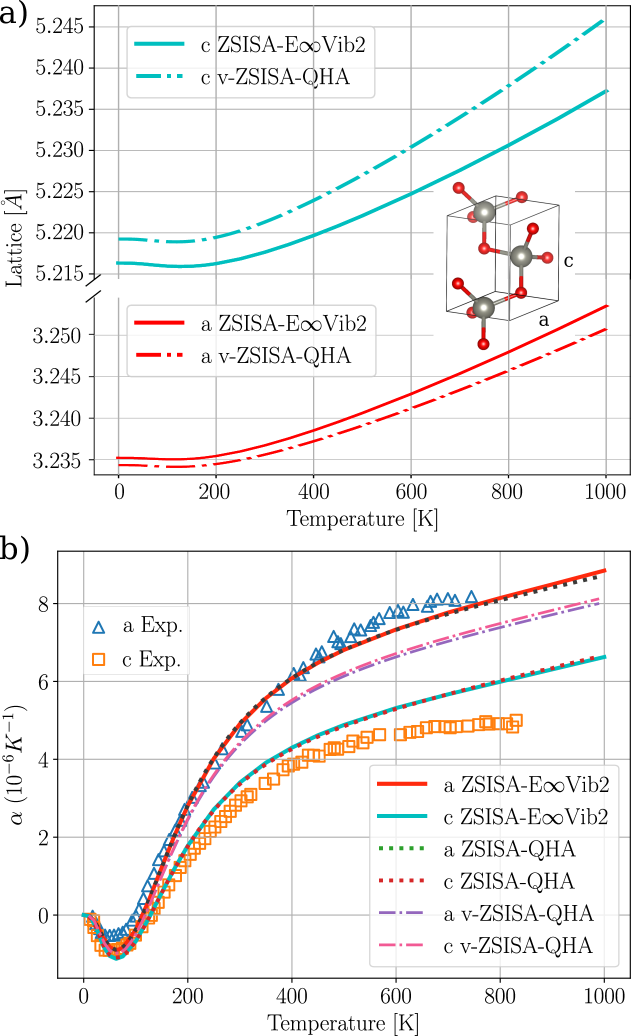
To systematically validate the new method, we compare its results with those of ZSISA-QHA and v-ZSISA-QHA. In the v-ZSISA-QHA approach, thermal expansion is determined from calculations at seven distinct volumes, ranging from 0.96 to 1.08 times the equilibrium BO volume, in increments of 0.02. For ZSISA-QHA, the lattice parameters a and c are systematically varied over a 25-point strain mesh (five points in each direction) spanning [-0.005,0.015] relative to the BO lattice. A third-order (cubic) two-dimensional surface is then fitted to the computed free energy values, and the equilibrium lattice parameters at each temperature are obtained by minimizing this surface.
Figure 4 illustrates the temperature dependence of the lattice parameters and thermal expansion. The results show strong agreement between ZSISA-QHA and , confirming the consistency of the methodology. However, ZSISA-QHA and v-ZSISA-QHA yield different final results of anisotropic thermal expansion and lattice parameters, while their volumetric thermal expansion predictions remain consistent. Experimental data indicate distinct thermal expansion coefficients for a and c, whereas v-ZSISA-QHA predicts nearly identical values, failing to capture the experimental anisotropy. In contrast, matches experimental observations, effectively reproducing the anisotropic thermal expansion of ZnO. Nevertheless, the accuracy of the results remains sensitive to the choice of the exchange-correlation functional. Volumetric thermal expansion results are in agreement in v-ZSISA-QHA and ZSISA-QHA methods.
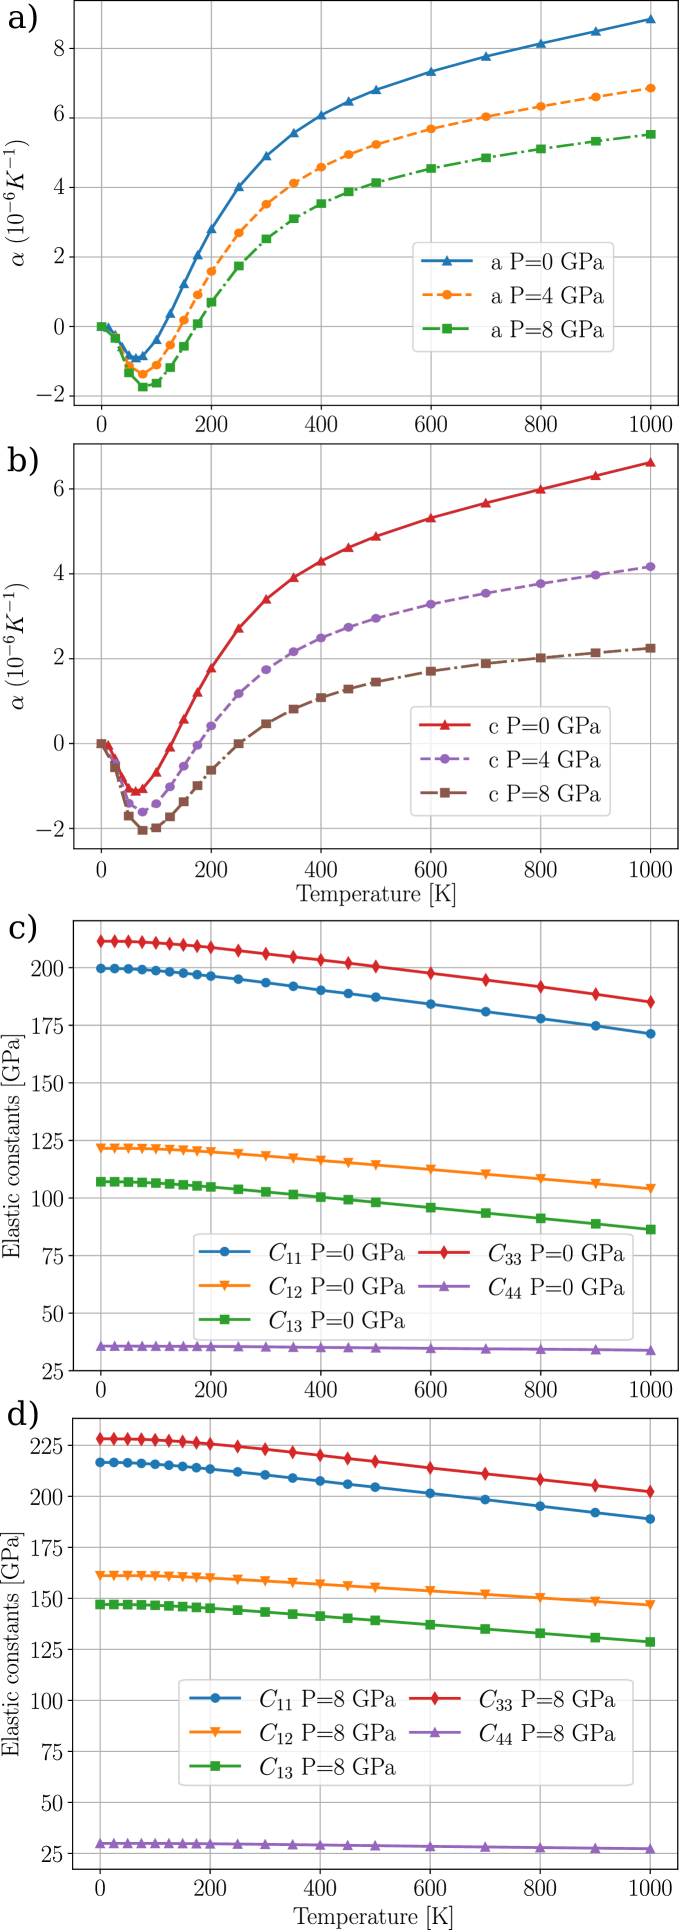
Figure 5 presents the temperature dependence of the anisotropic thermal expansion and elastic constants of ZnO under varying pressure conditions, as obtained from the method. Panels (a) and (b) show the thermal expansion of the lattice parameters a and c at pressures of 0, 4, and 8 GPa, respectively. Panels (c) and (d) display the corresponding elastic constants at 0 GPa and 8 GPa, highlighting the effect of pressure on the mechanical properties of ZnO.
IV.3 \ceZrO2
ZrO2 adopts a monoclinic structure at temperatures below approximately 1443 K. In our calculations, the optimized lattice parameters are a=5.126 Å, b=5.209 Å, c=5.295 Å, with a monoclinic angle . The strain configurations applied for the monoclinic case in determining both thermal expansion and elastic constants differ by only three additional strains required for elastic constants. Specifically, 15 strain patterns are sufficient for thermal expansion calculations, while 18 strains are needed when computing elastic constants. The complete set of these strain configurations is provided in Table 4 in the appendix.
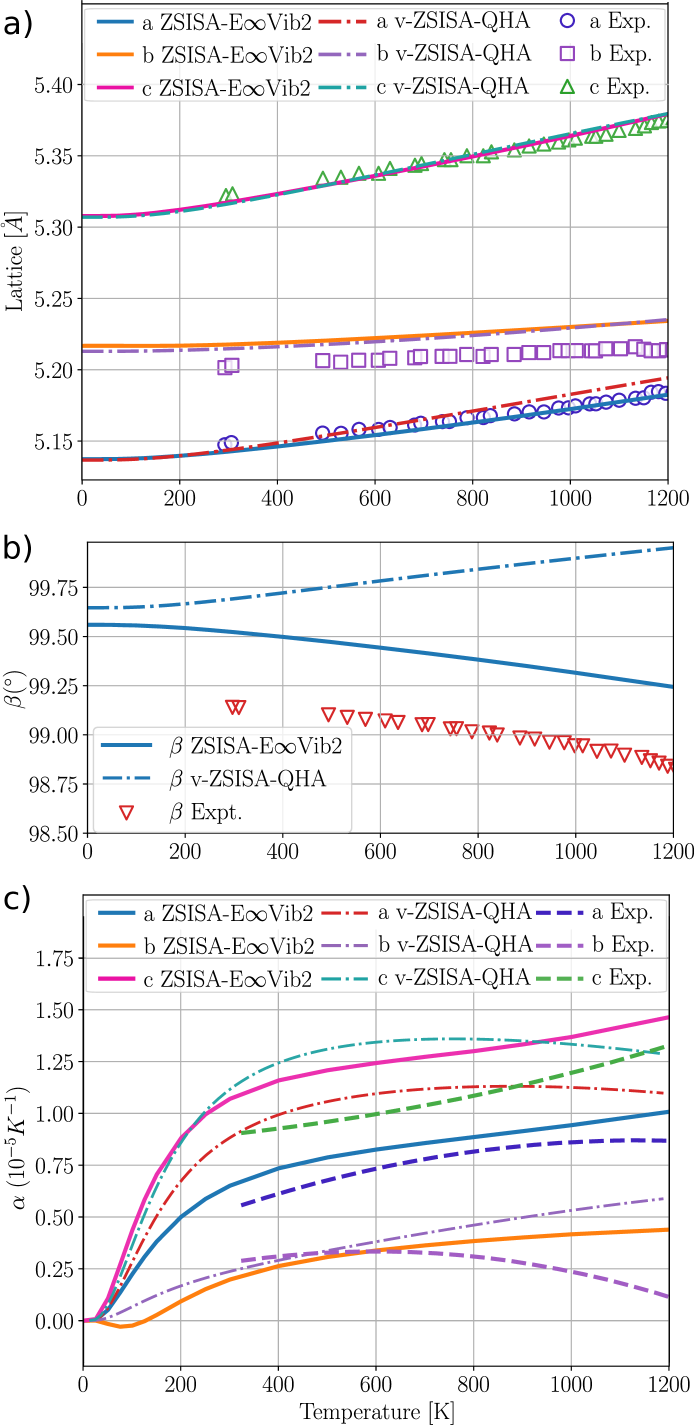
Figure 6 illustrates the temperature dependence of the lattice parameters and angle of monoclinic \ceZrO2 at zero pressure. Panels (a) and (b) show the lattice parameters and the angle , respectively, calculated using the approach (solid lines) and the v-ZSISA-QHA method (dashed-dotted lines). Experimental data points are included for direct comparison. Panel (c) presents the thermal expansion coefficient as a function of temperature, with results from the method (solid line) and the v-ZSISA-QHA approach (dashed-dotted line), with the experimental thermal expansion data shown by the dashed lines for reference.
The v-ZSISA-QHA method is based on calculations at seven volumes, ranging from 0.96% to 1.08% of the BO volume, with a step size of 0.02%. The experimental thermal expansion is computed by fitting a line to the lattice data points at different temperatures and differentiating the fitted curve.
A noteworthy difference between the v-ZSISA-QHA and methods is the temperature dependence of the angle. Experimental results Haggerty et al. (2014) show a decrease in the angle with increasing temperature. The v-ZSISA-QHA method predicts an opposite trend, where the angle increases with temperature. In contrast, the method correctly captures the direction of the angle decrease, although the predicted values are slightly different. This discrepancy is due to the exchange-correlation functional. Modifying the functional could potentially lead to a better agreement with experimental results. The thermal expansion predictions from the show a better agreement with the experimental data compared to the v-ZSISA-QHA approach.
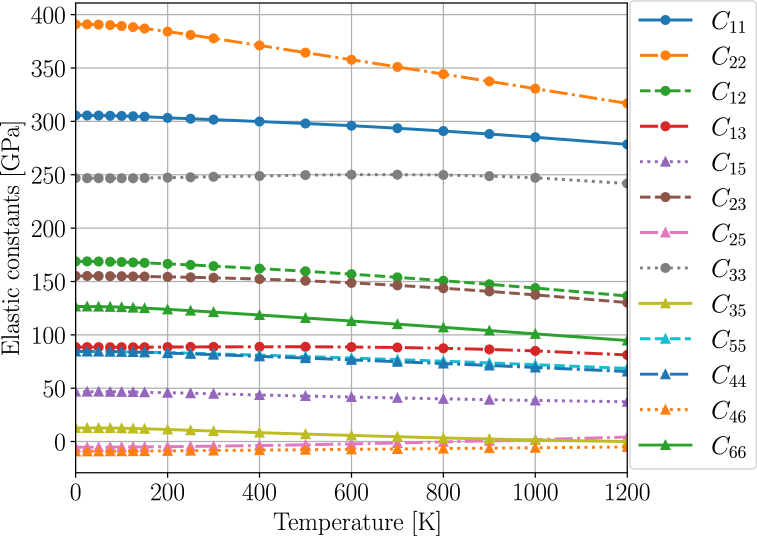
Figure 7 illustrates the temperature dependence of the 13 elastic constants of monoclinic structure, emphasizing their temperature-induced variations.
V CONCLUSION
In this work, we introduce a novel method for determining the anisotropic thermal expansion and elastic constants of materials with arbitrary crystal structures, achieving accuracy comparable to the quasiharmonic approximation with zero static internal stress (ZSISA-QHA). While ZSISA-QHA is highly accurate for weakly anharmonic crystals, it is computationally expensive due to the need for numerous phonon spectrum calculations. Specifically, for systems with lattice degrees of freedom, traditional methods require an impractically large number of lattice mesh points, often exceeding for high-accuracy thermal expansion predictions. This makes the direct application of ZSISA-QHA computationally intensive for systems with more than three lattice degrees of freedom. Our method addresses this limitation by reducing the number of required calculations, making it applicable to a wider range of systems while preserving a sufficient precision up to about 800 K.
Building on prior work Rostami and Gonze (2024), where we demonstrated that truncating the vibrational free energy expansion to second order provides results comparable to the full quasiharmonic treatment, we extend this approach by employing a Taylor series expansion of the vibrational free energy up to the second derivative to calculate the Gibbs free energy in the multidimensional space of degrees of freedom. This method incorporates self-consistent optimization of lattice parameters and atomic positions, taking into account thermal stresses and using the accurate Born-Oppenheimer energy to ensure precise thermal properties.
By significantly reducing the computational demands, our approach provides a practical and efficient alternative to ZSISA-QHA, especially for materials with complex crystal symmetries, such as monoclinic and triclinic structures. For instance, in the case of a triclinic system, we achieve accurate predictions of both thermal expansion and elastic constants with only 28 phonon spectrum calculations—three order of magnitude reduction compared to more than 15625 calculations required by ZSISA-QHA.
Our results demonstrate that the new method can replicate ZSISA-QHA with high accuracy, making it a viable alternative whenever ZSISA-QHA is not applicable. We successfully apply this method to 10 materials with a variety of crystal structures, from cubic to monoclinic and triclinic forms, further validating its utility and versatility.
Acknowledgements.
This work has been supported by the Fonds de la Recherche Scientifique (FRS-FNRS Belgium) through the PdR Grant No. T.0103.19 – ALPS. It is an outcome of the Shapeable 2D magnetoelectronics by design project (SHAPEme, EOS Project No. 560400077525) that has received funding from the FWO and FRS-FNRS under the Belgian Excellence of Science (EOS) program. Computational resources have been provided by the supercomputing facilities of the Université catholique de Louvain (CISM/UCL) and the Consortium des Equipements de Calcul Intensif en Fédération Wallonie Bruxelles (CECI) funded by the FRS-FNRS under Grant No. 2.5020.11.VI Appendix
In this appendix, we present the equations relevant for different crystallographic systems, namely the cubic system, uniaxial system, triclinic system, isotropic slab, anisotropic slab (two degrees of freedom), and anisotropic slab. They correspond to the equations presented for the orthorhombic and monoclinic systems in the body of the paper, namely Eqs.(62) to (II.9) for the orthorhombic system, and Eqs.(69) to (79) for the monoclinic system.
For the sake of compactness, in this appendix, the dependence of the components of the lattice vectors is not explicitly indicated, unlike their temperature dependence.
VI.1 Cubic
| (83) |
| (84) |
| (85) |
VI.2 Hexagonal, Trigonal, Tetragonal
| (89) |
| (90) |
| (91) | ||||
VI.3 Triclinic
| (95) | |||
| (99) |
| (103) |
| (104) | ||||
| (105) | ||||
VI.4 Isotropic slab
| (109) |
| (110) |
| (111) |
VI.5 Anisotropic slab (2DOF)
| (115) |
| (116) |
| (117) |
VI.6 Anisotropic slab
| (121) | |||
| (125) | |||
| (129) |
| (130) | ||||
| (131) | |||
VI.7 Accurate second derivative calculation
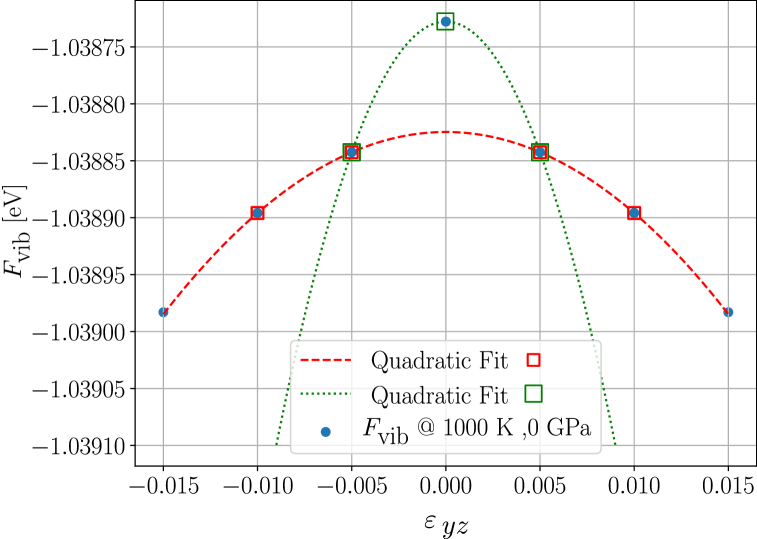
When selecting strain points for determining the second derivative of the vibrational free energy, special care must be taken to ensure accuracy, particularly at points where the first derivative is zero. The vibrational free energy is expected to be symmetric around zero strain. However, applying strain to high-symmetry crystal structures often reduces their space group symmetry. This effect is particularly pronounced in systems with orthogonal angles, where numerical artifacts in the code implementation can introduce small energy shifts, potentially affecting the accuracy of second derivative calculations.
As illustrated in Fig. 8 for the vibrational free energy of ZnO at 1000 K and 0 GPa, the energy follows a smooth curve, but a slight shift at zero strain is observed. This shift is unexplained at the time of writing. If only two symmetrically placed points around zero strain () were used for fitting, the resulting quadratic curve might not fully capture the trend of the data. To correct this behavior, a quadratic curve fitting on four points () and ( ) can be employed, ensuring a more representative fit that accounts for such numerical fluctuation. Due to symmetry considerations, () and () contribute equivalently, meaning that in practice, only three independent points are required for an accurate fitting procedure.
| Strain | Triclinic | Monoclinic | Orthorhombic | Hexagonal | Trigonal | Tetragonal | Cubic | |
| (0 ,0 ,0 ,0 ,0 ,0) | All | T E | T E | T E | T E | T E | T E | T E |
| ( ,0 ,0 ,0 ,0 ,0) | T E | T E | T E | - E | - E | - E | - E | |
| (,0 ,0 ,0 ,0 ,0) | T E | T E | T E | - E | - E | - E | - E | |
| (,,0 ,0 ,0 ,0) | T E | T E | T E | T E | T E | T E | - E | |
| (,0 ,,0 ,0 ,0) | T E | T E | T E | - E | - E | - E | - - | |
| (,0 ,0 ,,0 ,0) | T E | - - | - - | - - | - - | - - | - - | |
| (,0 ,0 ,0 ,,0) | T E | T E | - - | - - | - - | - - | - - | |
| (,0 ,0 ,0 ,0 ,) | T E | - - | - - | - - | - - | - - | - - | |
| (0 ,,0 ,0 ,0 ,0) | T E | T E | T E | - - | - - | - - | - - | |
| (0 ,,0 ,0 ,0 ,0) | T E | T E | T E | - - | - - | - - | - - | |
| (0 ,,,0 ,0 ,0) | T E | T E | T E | - - | - - | - - | - - | |
| (0 ,,0 ,,0 ,0) | T E | - - | - - | - - | - - | - - | - - | |
| (0 ,,0 ,0 ,,0) | T E | T E | - - | - - | - - | - - | - - | |
| (0 ,,0 ,0 ,0 ,) | T E | - - | - - | - - | - - | - - | - - | |
| (0 ,0 ,,0 ,0 ,0) | T E | T E | T E | T E | T E | T E | - - | |
| (0 ,0 ,,0 ,0 ,0) | T E | T E | T E | T E | T E | T E | - - | |
| (0 ,0 ,,,0 ,0) | T E | - - | - - | - - | - - | - - | - - | |
| (0 ,0 ,,0 ,,0) | T E | T E | - - | - - | - - | - - | - - | |
| (0 ,0 ,,0 ,0 ,) | T E | - - | - - | - - | - - | - - | - - | |
| (0 ,0 ,0 , ,0 ,0) | T E | - - | - E | - E | - E | - E | - E | |
| (0 ,0 ,0 ,,0 ,0) | * | T E | - E | - - | - - | - - | - - | - - |
| (0 ,0 ,0 ,,,0) | T E | - - | - - | - - | - - | - - | - - | |
| (0 ,0 ,0 ,,0 ,) | T E | - E | - - | - - | - - | - - | - - | |
| (0 ,0 ,0 ,0 , ,0) | T E | T E | - E | - - | - - | - - | - - | |
| (0 ,0 ,0 ,0 ,,0) | * | T E | T E | - - | - - | - - | - - | - - |
| (0 ,0 ,0 ,0 ,,) | T E | - - | - - | - - | - - | - - | - - | |
| (0 ,0 ,0 ,0 ,0 ,) | T E | - - | - E | - - | - - | - E | - - | |
| (0 ,0 ,0 ,0 ,0 ,) | * | T E | - E | - - | - - | - - | - - | - - |
| ( ,,0 ,0 ,0 ,0) | - - | - - | - - | - - | T - | T - | T - | - - |
| ( ,,,0 ,0 ,0) | - - | - - | - - | - - | - - | - - | - - | T - |
| (,,,0 ,0 ,0) | - - | - - | - - | - - | T - | T - | T - | T - |
| (0 ,0 ,0 , ,0 ,0) | ⋄ | - - | - - | - E | - E | - E | - E | - E |
| (0 ,0 ,0 ,0 , ,0) | ⋄ | - - | - - | - E | - - | - - | - - | - - |
| (0 ,0 ,0 ,0 ,0 ,) | ⋄ | - - | - - | - E | - - | - - | - E | - - |
| (,0 ,0 ,,0 ,0) | ⋄ | - - | - - | - - | - - | - E | - - | - - |
References
- Barrera et al. (2005) G. Barrera, J. Bruno, T. Barron, and N. Allan, J. Phys.: Condens. Matter 17, R217 (2005).
- Karunarathne et al. (2021) A. Karunarathne, P. Parajuli, G. Priyadarshan, S. Bhattacharya, R. Rao, P.-C. Wei, Y.-Y. Chen, J. R. Gladden, and A. M. Rao, Phys. Rev. B 103, 054108 (2021).
- Lee et al. (2025) C.-H. Lee, C.-Y. Lin, and G.-Y. Chen, Materials Today Physics 51, 101650 (2025).
- Hohenberg and Kohn (1964) P. Hohenberg and W. Kohn, Phys. Rev. 136, B864 (1964).
- Kohn and Sham (1965) W. Kohn and L. J. Sham, Phys. Rev. 140, A1133 (1965).
- Dove (1993) M. T. Dove, Introduction to Lattice Dynamics (Cambridge University Press, 1993).
- Lazzeri and de Gironcoli (1998) M. Lazzeri and S. de Gironcoli, Phys. Rev. Lett. 81, 2096 (1998).
- Carrier et al. (2007a) P. Carrier, R. Wentzcovitch, and J. Tsuchiya, Phys. Rev. B 76, 064116 (2007a).
- Allen (2020) P. B. Allen, Modern Physics Letters B 34, 2050025 (2020).
- Mathis et al. (2022) M. A. Mathis, A. Khanolkar, L. Fu, M. S. Bryan, C. A. Dennett, K. Rickert, J. M. Mann, B. Winn, D. L. Abernathy, M. E. Manley, D. H. Hurley, and C. A. Marianetti, Phys. Rev. B 106, 014314 (2022).
- Mathis and Marianetti (2024) M. A. Mathis and C. A. Marianetti, Phys. Rev. B 110, L140101 (2024).
- Gong and Dal Corso (2024) X. Gong and A. Dal Corso, Phys. Rev. B 110, 094109 (2024).
- Baroni et al. (1987) S. Baroni, P. Giannozzi, and A. Testa, Phys. Rev. Lett. 58, 1861 (1987).
- Gonze (1997) X. Gonze, Phys. Rev. B 55, 10337 (1997).
- Baroni et al. (2001) S. Baroni, S. de Gironcoli, A. D. Corso, and P. Giannozzi, Rev. Mod. Phys. 73, 515 (2001).
- Gonze et al. (2005) X. Gonze, G. M. Rignanese, and R. Caracas, Zeitschrift fur Kristallographie 220, 458 (2005).
- Togo and Tanaka (2015) A. Togo and I. Tanaka, Scripta Materialia 108, 1 (2015).
- Masuki et al. (2022a) R. Masuki, T. Nomoto, R. Arita, and T. Tadano, Phys. Rev. B 106, 224104 (2022a).
- Allen (2015) P. B. Allen, Phys. Rev. B 92, 064106 (2015).
- Masuki et al. (2022b) R. Masuki, T. Nomoto, R. Arita, and T. Tadano, Phys. Rev. B 105, 064112 (2022b).
- Allan et al. (1996) N. L. Allan, T. H. K. Barron, and J. A. O. Bruno, J. Chem. Phys. 105, 8300 (1996).
- Taylor et al. (1997) M. B. Taylor, G. D. Barrera, N. L. Allan, and T. H. K. Barron, Phys. Rev. B 56, 14380 (1997).
- Taylor et al. (1999) M. B. Taylor, C. E. Sims, G. D. Barrera, N. L. Allan, and W. C. Mackrodt, Phys. Rev. B 59, 6742 (1999).
- Liu and Allen (2018) J. Liu and P. Allen, Computational Materials Science 154, 251 (2018).
- Masuki et al. (2023) R. Masuki, T. Nomoto, R. Arita, and T. Tadano, Phys. Rev. B 107, 134119 (2023).
- Lichtenstein et al. (2000) A. I. Lichtenstein, R. O. Jones, S. de Gironcoli, and S. Baroni, Phys. Rev. B 62, 11487 (2000).
- Mounet and Marzari (2005) N. Mounet and N. Marzari, Phys. Rev. B 71, 205214 (2005).
- Carrier et al. (2007b) P. Carrier, R. Wentzcovitch, and J. Tsuchiya, Phys. Rev. B 76, 064116 (2007b).
- Palumbo and Corso (2017) M. Palumbo and A. D. Corso, Phys. Status Solidi B 254, 1700101 (2017).
- Liu and Pantelides (2018) J. Liu and S. T. Pantelides, Phys. Rev. Lett. 120, 207602 (2018).
- Ritz and Benedek (2018) E. T. Ritz and N. A. Benedek, Phys. Rev. Lett. 121, 255901 (2018).
- Ritz et al. (2019) E. T. Ritz, S. J. Li, and N. A. Benedek, J. App. Phys. 126, 171102 (2019).
- Li et al. (2021) Y. Li, Z. D. Hood, and N. A. W. Holzwarth, Phys. Rev. Mat. 5, 085403 (2021).
- Brousseau-Couture et al. (2022) V. Brousseau-Couture, E. Godbout, M. Côté, and X. Gonze, Phys. Rev. B 106, 085137 (2022).
- Skelton et al. (2015) J. M. Skelton, D. Tiana, S. C. Parker, A. Togo, I. Tanaka, and A. Walsh, J. Chem. Phys. 143, 064710 (2015).
- Nath et al. (2016) P. Nath, J. J. Plata, D. Usanmaz, R. A. R. A. Orabi, M. Fornari, M. B. Nardelli, C. Toher, and S. Curtarolo, Comput. Mat. Sci. 125, 82 (2016).
- Togo et al. (2010) A. Togo, L. Chaput, I. Tanaka, and G. Hug, Phys. Rev. B 81 (2010).
- de-la Roza and Luana (2011a) A. O. de-la Roza and V. Luana, Phys. Rev. B 84, 024109 (2011a).
- de-la Roza and Luana (2011b) A. O. de-la Roza and V. Luana, Phys. Rev. B 84, 184103 (2011b).
- Li et al. (2011) C. W. Li, X. Tang, J. A. Munoz, J. B. Keith, S. J. Tracy, D. L. Abernathy, and B. Fultz, Phys. Rev. Lett. 107, 195504 (2011).
- Gupta et al. (2013) M. K. Gupta, R. Mittal, and S. L. Chaplot, Phys. Rev. B 88, 014303 (2013).
- Abraham and Shirts (2018) N. S. Abraham and M. R. Shirts, J. Chem. Theory Comput. 14, 5904 (2018).
- Grüneisen (1912) E. Grüneisen, Annalen der Physik 344, 257 (1912).
- Rostami and Gonze (2024) S. Rostami and X. Gonze, Phys. Rev. B 110, 014103 (2024).
- Dederichs et al. (1984) P. H. Dederichs, S. Blugel, R. Zeller, and H. Akai, Phys. Rev. Lett. 53, 2512 (1984).
- Gonze et al. (2022) X. Gonze, B. Seddon, J. Elliott, C. Tantardini, and A. Shapeev, J. Chem. Theory Comput. 18, 6099 (2022).
- Hamann et al. (2005) D. R. Hamann, X. Wu, K. M. Rabe, and D. Vanderbilt, Phys. Rev. B 71, 035117 (2005).
- Hamann (2013) D. R. Hamann, Phys. Rev. B 88, 085117 (2013).
- Lejaeghere et al. (2016) K. Lejaeghere, G. Bihlmayer, T. Björkman, P. Blaha, S. Blügel, V. Blum, D. Caliste, I. E. Castelli, S. J. Clark, A. Dal Corso, S. de Gironcoli, T. Deutsch, J. K. Dewhurst, I. Di Marco, C. Draxl, M. Dułak, O. Eriksson, J. A. Flores-Livas, K. F. Garrity, L. Genovese, P. Giannozzi, M. Giantomassi, S. Goedecker, X. Gonze, O. Grånäs, E. K. U. Gross, A. Gulans, F. Gygi, D. R. Hamann, P. J. Hasnip, N. A. W. Holzwarth, D. Iuşan, D. B. Jochym, F. Jollet, D. Jones, G. Kresse, K. Koepernik, E. Küçükbenli, Y. O. Kvashnin, I. L. M. Locht, S. Lubeck, M. Marsman, N. Marzari, U. Nitzsche, L. Nordström, T. Ozaki, L. Paulatto, C. J. Pickard, W. Poelmans, M. I. J. Probert, K. Refson, M. Richter, G.-M. Rignanese, S. Saha, M. Scheffler, M. Schlipf, K. Schwarz, S. Sharma, F. Tavazza, P. Thunström, A. Tkatchenko, M. Torrent, D. Vanderbilt, M. J. van Setten, V. Van Speybroeck, J. M. Wills, J. R. Yates, G.-X. Zhang, and S. Cottenier, Science 351 (2016), 10.1126/science.aad3000.
- Bosoni et al. (2023) E. Bosoni, L. Beal, M. Bercx, P. Blaha, S. Blügel, J. Bröder, M. Callsen, S. Cottenier, A. Degomme, V. Dikan, K. Eimre, E. Flage-Larsen, M. Fornari, A. Garcia, L. Genovese, M. Giantomassi, S. P. Huber, H. Janssen, G. Kastlunger, M. Krack, G. Kresse, T. D. Kühne, K. Lejaeghere, G. K. H. Madsen, M. Marsman, N. Marzari, G. Michalicek, H. Mirhosseini, T. M. A. Müller, G. Petretto, C. J. Pickard, S. Poncé, G.-M. Rignanese, O. Rubel, T. Ruh, M. Sluydts, D. E. P. Vanpoucke, S. Vijay, M. Wolloch, D. Wortmann, A. V. Yakutovich, J. Yu, A. Zadoks, B. Zhu, and G. Pizzi, Nature Reviews Physics 6, 45–58 (2023).
- van Setten et al. (2018) M. van Setten, M. Giantomassi, E. Bousquet, M. Verstraete, D. Hamann, X. Gonze, and G.-M. Rignanese, Computer Phys. Comm. 226, 39 (2018).
- Perdew et al. (2008) J. P. Perdew, A. Ruzsinszky, G. I. Csonka, O. A. Vydrov, G. E. Scuseria, L. A. Constantin, X. Zhou, and K. Burke, Phys. Rev. Lett. 100, 136406 (2008).
- Laflamme Janssen et al. (2016) J. Laflamme Janssen, Y. Gillet, S. Poncé, A. Martin, M. Torrent, and X. Gonze, Phys. Rev. B 93, 205147 (2016).
- Gonze et al. (2002) X. Gonze, J. M. Beuken, R. Caracas, F. Detraux, M. Fuchs, G. M. Rignanese, L. Sindic, M. Verstraete, G. Zerah, F. Jollet, M. Torrent, A. Roy, M. Mikami, P. Ghosez, J. Y. Raty, and D. C. Allan, Comput. Mat. Science 25, 478 (2002).
- Gonze et al. (2020) X. Gonze, B. Amadon, G. Antonius, F. Arnardi, L. Baguet, J.-M. Beuken, J. Bieder, F. Bottin, J. Bouchet, E. Bousquet, N. Brouwer, F. Bruneval, G. Brunin, T. Cavignac, J.-B. Charraud, W. Chen, M. Côté, S. Cottenier, J. Denier, G. Geneste, P. Ghosez, M. Giantomassi, Y. Gillet, O. Gingras, D. R. Hamann, G. Hautier, X. He, N. Helbig, N. Holzwarth, Y. Jia, F. Jollet, W. Lafargue-Dit-Hauret, K. Lejaeghere, M. A. L. Marques, A. Martin, C. Martins, H. P. C. Miranda, F. Naccarato, K. Persson, G. Petretto, V. Planes, Y. Pouillon, S. Prokhorenko, F. Ricci, G.-M. Rignanese, A. H. Romero, M. M. Schmitt, M. Torrent, M. J. van Setten, B. Van Troeye, M. J. Verstraete, G. Zérah, and J. W. Zwanziger, Computer Phys. Comm. 248, 107042 (2020).
- Romero et al. (2020) A. H. Romero, D. C. Allan, B. Amadon, G. Antonius, T. Applencourt, L. Baguet, J. Bieder, F. Bottin, J. Bouchet, E. Bousquet, F. Bruneval, G. Brunin, D. Caliste, M. Côté, J. Denier, C. Dreyer, P. Ghosez, M. Giantomassi, Y. Gillet, O. Gingras, D. R. Hamann, G. Hautier, F. Jollet, G. Jomard, A. Martin, H. P. C. Miranda, F. Naccarato, G. Petretto, N. A. Pike, V. Planes, S. Prokhorenko, T. Rangel, F. Ricci, G.-M. Rignanese, M. Royo, M. Stengel, M. Torrent, M. J. van Setten, B. V. Troeye, M. J. Verstraete, J. Wiktor, J. W. Zwanziger, and X. Gonze, J. Chem. Phys. 152, 124102 (2020).
- Li et al. (2006) B. Li, K. Woody, and J. Kung, Journal of Geophysical Research: Solid Earth 111 (2006), https://doi.org/10.1029/2005JB004251.
- Karzel et al. (1996) H. Karzel, W. Potzel, M. Köfferlein, W. Schiessl, M. Steiner, U. Hiller, G. M. Kalvius, D. W. Mitchell, T. P. Das, P. Blaha, K. Schwarz, and M. P. Pasternak, Phys. Rev. B 53, 11425 (1996).
- Schulz and Thiemann (1977) H. Schulz and K. Thiemann, Solid State Communications 23, 815 (1977).
- Wang et al. (2018) M. Wang, G. Shi, J. Qin, and Q. Bai, European Journal of Mineralogy 30, 939 (2018).
- Grabowski et al. (2018) G. Grabowski, R. Lach, Z. Pedzich, K. Swierczek, and A. Wojteczko, Archives of Civil and Mechanical Engineering 18, 188 (2018).
- Haines and Léger (1997) J. Haines and J. M. Léger, Phys. Rev. B 55, 11144 (1997).
- Aggarwal et al. (2005) R. L. Aggarwal, D. J. Ripin, J. R. Ochoa, and T. Y. Fan, Journal of Applied Physics 98, 103514 (2005), https://pubs.aip.org/aip/jap/article-pdf/doi/10.1063/1.2128696/13112977/103514_1_online.pdf .
- McCullough and Trueblood (1959) J. D. McCullough and K. N. Trueblood, Acta Crystallographica 12, 507 (1959).
- Haggerty et al. (2014) R. P. Haggerty, P. Sarin, Z. D. Apostolov, P. E. Driemeyer, and W. M. Kriven, Journal of the American Ceramic Society 97, 2213 (2014), https://ceramics.onlinelibrary.wiley.com/doi/pdf/10.1111/jace.12975 .
- El Maslout et al. (1975) A. El Maslout, M. Zanne, F. Jeannot, and C. Gleitzer, Journal of Solid State Chemistry 14, 85 (1975).
- Fortes (2019) A. D. Fortes, Physics and Chemistry of Minerals 46, 687–704 (2019).
- (68) See the Supplemental Material for additional information. .
- Dubrovinsky and Saxena (1997) L. S. Dubrovinsky and S. K. Saxena, Physics and Chemistry of Minerals 24, 547–550 (1997).
- Sumino et al. (1983) Y. Sumino, O. L. Anderson, and I. Suzuki, Physics and Chemistry of Minerals 9, 38–47 (1983).
- Vinet et al. (1987) P. Vinet, J. Ferrante, J. H. Rose, and J. R. Smith, Journal of Geophysical Research: Solid Earth 92, 9319 (1987), https://agupubs.onlinelibrary.wiley.com/doi/pdf/10.1029/JB092iB09p09319 .
- Ibach (1969) H. Ibach, physica status solidi (b) 33, 257 (1969), https://onlinelibrary.wiley.com/doi/pdf/10.1002/pssb.19690330124 .