Rotational PenetrationY. Tang, Y. Zhong and J. Tao
Experimental Study on the Rotation-induced Reduction of Penetration Resistance in Sand
Abstract
Soil-dwelling organisms have evolved diverse strategies for efficient subterranean movement. For example, the seeds of Erodium cicutarium and Pelargonium species employ continuous rotational motion for self-burial, while the angled worm lizard (Agamodon angeliceps) tunnels by oscillating its head around its trunk’s axis. These rotational movements significantly reduce penetration resistance. This study presents comprehensive experiments investigating the effects of various factors on rotational penetration forces and energy consumption. Results reveal that force reduction follow an approximately hyperbolic decay with the tangential-to-axial velocity ratio (). Penetrator geometry, particularly roundness and conical tip shape, is found to significantly influence reduction at low velocity ratios, whereas relative density and material type exhibit moderate impact. Reduction is also observed to increase with interfacial friction angle but decreases with confining pressure and depth. Energy consumption analysis shows that while penetration force-related energy decreases with , total energy consumption increases due to rotational torque. For self-burrowing robot designs, lower velocity ratios are recommended to balance penetration force reduction and energy efficiency effectively.
keywords:
rotation; penetration resistance; reduction; energy consumption; self-burrowing robots1 Introduction
As one of the particular topics of bio-inspired geotechnics, bio-inspired self-burrowing mechanisms and robots have attracted significant attention in recent research (Tao et al., 2020; Chen et al., 2021; Tang & Tao, 2022; Martinez et al., 2022; Bagheri et al., 2023). These self-burrowing robots hold potential for applications in subsurface exploration, monitoring, surveillance (Tao, 2021), extraterrestrial sampling (Wei et al., 2021), and precision agriculture (Luo et al., 2023). However, designing such robots poses considerable challenges due to the complexity of their operating environments (Dorgan & Daltorio, 2023). Navigating through soil is particularly difficult due to anisotropic stress states, inhomogeneity, and multiphasic properties (Tao, 2021). Additionally, soil imposes significantly higher resistance than those encountered in air or water (Tao, 2021; Naclerio et al., 2021).
Despite this high resistance encountered in soil, various organisms have evolved to burrow effectively and efficiently using diverse locomotion strategies. These strategies include body undulation, as observed in sandfish lizards (Scincus scincus), worms (Armandia brevis), and the burrowing eel (Pisodonophis boro) (Maladen et al., 2009, 2011; Herrel et al., 2011; Dorgan et al., 2013); dual-anchor and fluidization techniques utilized by razor clams (Trueman et al., 1966; Trueman, 1967, 1966; Huang & Tao, 2020); peristaltic crawling typical of earthworms (Quillin, 2000; Calder\a’on et al., 2016); and circumnutation movements seen in plant roots (Migliaccio et al., 2013; Taylor et al., 2021). The overarching principle behind these strategies is to either minimize penetration resistance or to enhance anchorage or propulsion force during the burrowing process, showcasing nature’s varied approaches to overcoming the challenges of soil navigation.
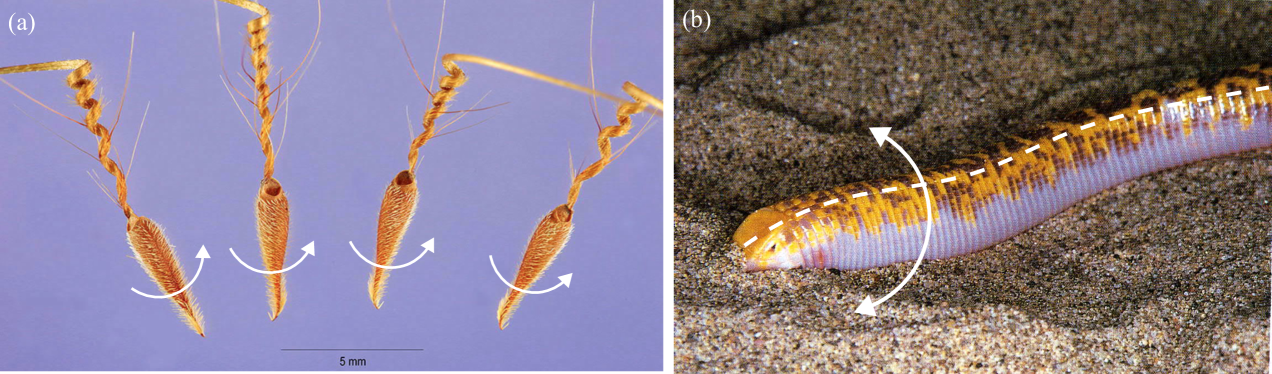
Seeds of Erodium and Pelargonium, Figure 1 (a), can bury themselves into the ground for future germination through rotation induced by hygroscopic coiling and uncoiling of their awns (Elbaum et al., 2008; Abraham et al., 2012; Abraham & Elbaum, 2013). Similarly, angle worm lizards, Agamodon anguliceps, Figure 1 (b), create tunnels by oscillating their heads around the long axis of their trunks (Gans, 1968, 1974). Both organisms use rotational motions (continuous rotation, oscillation) to reduce penetration resistance during their penetration and burrowing process.
Recent studies have confirmed that rotational motion can reduce penetration resistance through various approaches, including numerical simulations, physical experiments, and theoretical formulations. For instance, Deeks (2008) and co-authors (2008) experimentally demonstrated that the base resistance of a rotary-jacked pile decreases under centrifuge conditions. In addition to these centrifuge-based studies, rotational penetration experiments have been conducted under 1g conditions (Jung et al., 2014, 2017; Galindo et al., 2018; Hassan & Ibrahim, 2021; Saleem et al., 2020; Saathoff et al., 2021). Furthermore, rotational penetration tests have been both simulated numerically under elevated gravitational conditions (Sharif et al., 2021) and 1g conditions (Pucker & Grabe, 2012; Tang & Tao, 2022; Yang et al., 2024), examining different tangential-to-axial velocity ratios. Specifically, with Discrete Element Method, Tang and Tao (2022) demonstrated that rotation-induced reduction of penetration resistance are caused by reduced number of particles in contact with the penetrator, lower magnitude of contact forces, and reorientation of the contact forces away from vertical directions. Additionally, the numerical results challenged conventional assumptions from two theoretical models, indicating that normal stress on the tip decreases with rotational velocity (Bengough et al., 1997; Sharif et al., 2021).
Despite the many studies on rotation-induced reduction of penetration resistance, the reported reduction percentages vary significantly across investigations. This study aims to clarify and address these variations through holistic experiments under various conditions. The experimental methods are outlined, including material properties, penetrator setups, procedures, and data analysis techniques. Results are presented for penetration force, torque, force reduction, and energy consumption under different conditions. The discussion explores the reasons behind the varying reduction percentages, implications for energy consumption, and study limitations. Finally, key findings and insights are highlighted.
2 Methodology
2.1 Materials
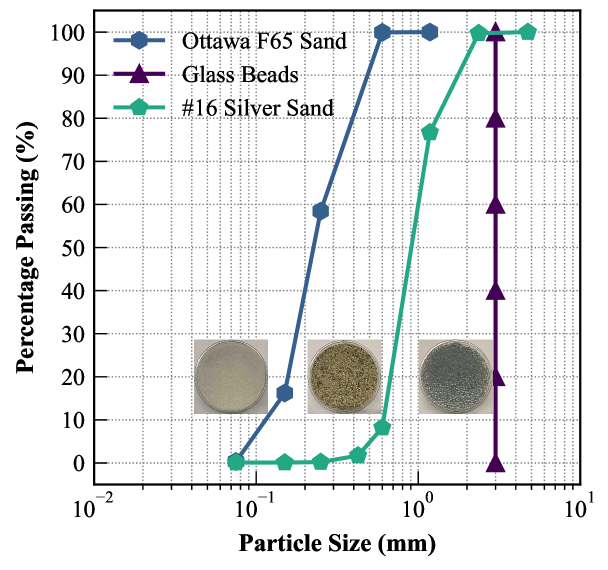
This study used three types of granular media: Ottawa F65 sand, #16 silver sand (a local sand), and glass beads. The particle size distributions for these media are illustrated in Figure 2, with inset figures highlighting the differences among them. Table 1 summarizes the key physical parameters of these materials, including the mean particle size , the coefficients of curvature () and uniformity (), and the maximum () and minimum () void ratios. All media were used in shallow rotational penetration tests, while only Ottawa F65 sand was used for tests involving deeper penetration depths and confining pressures.
| Materials | (mm) | Shape | Classification | ||||
| Ottawa F65 sand | 0.23 | 1.06 | 2.26 | 0.79 | 0.56 | sub-rounded | SP |
| #16 silver sand | 0.91 | 0.91 | 1.64 | 0.85 | 0.57 | sub-angular | SP |
| glass beads | 3 | 1 | 1 | 0.64 | 0.55 | spherical | - |
2.2 Penetrators and Experimental Setups
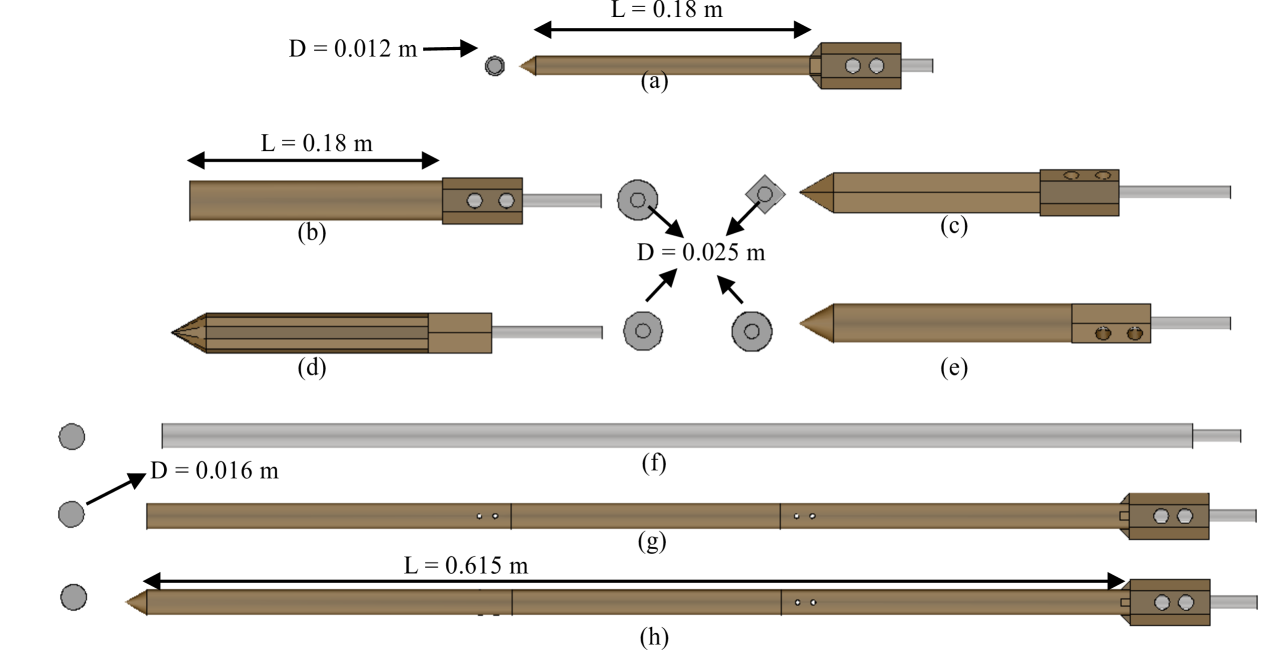
Penetrators in this study were categorized into three groups based on their diameters, as shown in Figure 3. The diameters are 25 mm, 16 mm, and 12 mm for penetration tests under shallow, deep, and confining pressures conditions, respectively. The choice of penetrator diameters was influenced by the load capacity of the robotic arm (Universal Robotics UR16e with a payload of 16 kg) and the use of a standard 16 mm stainless steel rod, Figure 3 (f). Except for the steel rod penetrator, all other penetrators were 3D printed using Polylactic Acid (PLA) material. The penetrators typically have circular cross-sections, with the exceptions of Figure 3 (c) and (d), which feature square and decagon shapes, respectively. However, the cross-sectional areas of Figure 3 (b) to Figure 3 (e) have the same circumscribed circle with a diameter of 25 mm. Additionally, the apex angle for all penetrators is 60°. Each 3D printed penetrator was attached to a rotary motor (Pololu 4847) through customized couplers.
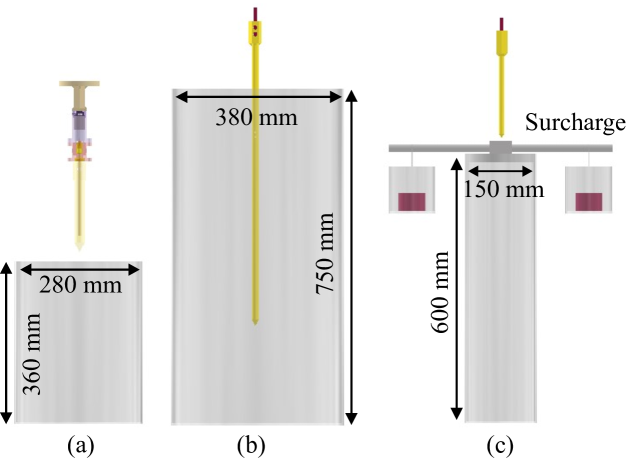
The schematic diagrams in Figure 4 illustrate the experimental setups and dimensions for rotational penetration tests under various conditions. Notably, the setup for tests with confining pressures, Figure 4 (c), features a rigid plate on top of the soil chamber, distinguishing it from the shallow and deep test setups. Specifically, two steel rods are integrated into the rigid plate, allowing for the addition of surcharges via small containers on either side.
2.3 Experimental Procedures and Plans
All granular samples were prepared using the dry air pluviation method. For dense samples under shallow conditions, vibration with a shaker table was applied after pluviation. Free dry air pluviation consistently achieved a relative density of around 35%, while for dense samples, the relative density was controlled to be 85%. For samples under confining pressure, in addition to the air pluviation and densification processes, surcharges were placed on both sides of the container and maintained for thirty minutes to ensure complete load transfer to the bottom, as illustrated in Figure 4 (c). A hole slightly larger than the penetrator was made in the 3D-printed plate to accommodate the penetration process. The confining pressure tests were conducted with the surcharges in place throughout.
Several steps were undertaken to control the robotic arm and rotary motor during each rotational penetration test. Initially, both the robotic arm and rotary motor were activated to facilitate the vertical and rotational movements separately. Next, the force/torque sensors of the robotic arm were zeroed before the penetrator approached the sample surface. The robotic arm was then paused for 3 seconds to start the data acquisition system. The penetrator proceeded to penetrate the sample at preset constant rotational and vertical velocities, stopping either at a predefined penetration depth or upon reaching the maximum force threshold. Lastly, the penetrator was retracted to its original position through reverse motion. Further details on the experimental procedures are available in (Tang et al., 2024).
Table 2, Figure 5 (a) and Figure 5 (b) summarize the experimental plans for rotational penetration tests under shallow, deep, and confining pressure conditions, respectively. For the shallow condition, twenty-nine groups of experiments were conducted, varying granular media, relative densities, and penetrator geometries. Each group consisted of tests with different combinations of vertical and rotational velocities, maintaining the same resultant velocity, following the methodology outlined in (Tang et al., 2024). For the deep condition, twenty-five groups of tests were conducted using various penetrators, each differing in geometry and interface features. For the confining pressure condition, twenty groups were tested with the same penetrator. Both the deep and confining pressure tests were conducted in a loose state. For all conditions, each test was conducted three times to ensure repeatability. In total, 585 tests were conducted in this study.
| Materials | Densities | Penetrators | (m/s) |
|---|---|---|---|
| Ottawa F65 | Loose | Decagon |
0.01, 0.02, 0.04,
0.08, 0.10 |
| Glass beads | Loose | Decagon | 0.04, 0.08, 0.10 |
| #16 silver | Loose | Decagon | 0.04, 0.08, 0.10 |
| Glass beads | Loose | Flat-end | 0.04, 0.08, 0.10 |
| Glass beads | Loose | Square | 0.04, 0.08, 0.10 |
| Glass beads | Loose | Circular | 0.04, 0.08, 0.10 |
| Ottawa F65 | Loose | Flat-end | 0.04, 0.08, 0.10 |
| Glass beads | Dense | Circular | 0.04, 0.08, 0.10 |
| Ottawa F65 | Dense | Decagon | 0.01, 0.02, 0.04 |
2.4 Data Analysis
2.4.1 Penetration force ratio
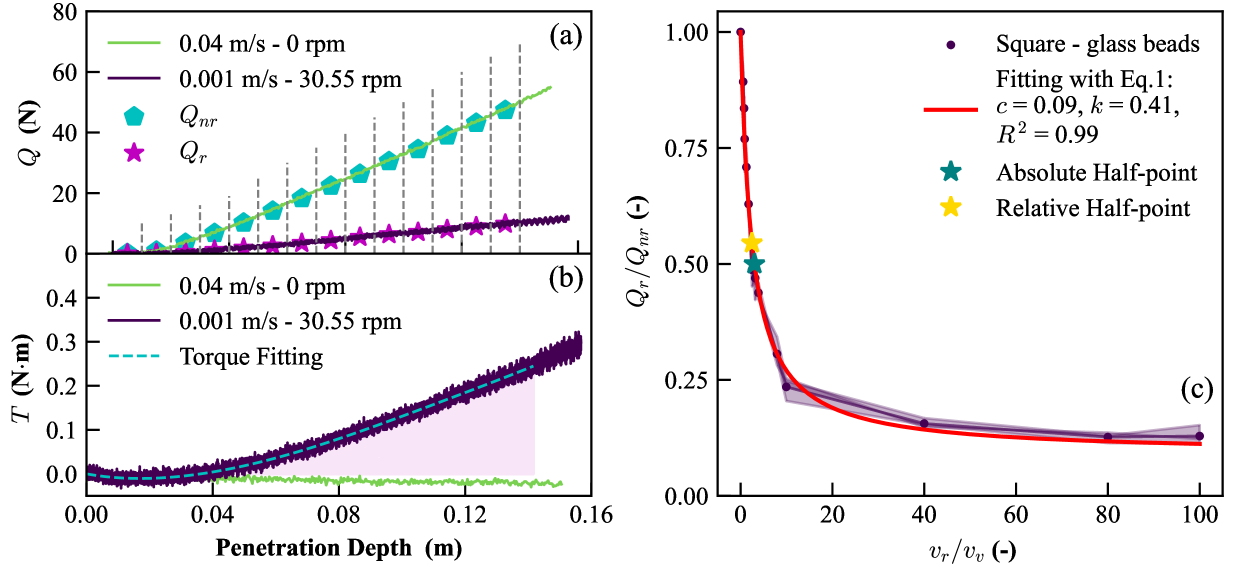
Figure 6 (a) illustrates the method used to calculate the penetration force ratio , or relative penetration force, through a three-step process:
-
•
For each 1 cm interval in penetration depth, the mean force was calculated for all trials in a rotational penetration case () and the control direct penetration case ().
-
•
The was then normalized by the corresponding to determine the relative penetration force at each depth interval.
-
•
Finally, the overall penetration force ratio was calculated by averaging the ratios across all depth intervals.
Theoretically, using force ratios between rotational and direct penetration cases to represent penetration force reduction is imprecise due to differing vertical velocities for the rotational and control cases in the experiments. However, experimental findings by Kang et al. (2018) demonstrated that the axial drag force remains nearly constant in a quasi-static soil state. Similarly, Roth (2021) and Roth et al. (2021) observed that the velocity dependence of drag force occurs only immediately after impact, with drag forces stabilizing across all intrusion speeds, from the quasi-static to the dense flow regime, beyond a crossover point. Thus, reductions were directly calculated by comparing the ratios between the rotational cases and their corresponding control cases, based on these assumptions.
2.4.2 Reduction curve
The tangential-to-axial velocity ratio, or velocity ratio for simplicity, is defined as the ratio between the tangential (rotational) velocity and the axial (vertical) velocity , or , where are the angular velocity and is the diameter of the penetrator.
The force ratio can be plotted against the velocity ratio to reveal the trends in the reduction of penetration force (Figure 6 (c)). This reduction curve can be fitted using a hyperbolic decay equation, as shown in Equation 1, and represented by the red line in Figure 6 (c).
| (1) |
where and are the fitting parameters, with indicating how quickly ratio decays with velocity ratio and representing the ultimate reduction achievable at infinite . Also note that the initial ratio of is always unity when , or without rotation.
From the fitted curve, the absolute half-point and relative half-point occur when the force ratio reaches 1/2 and , respectively. The corresponding velocity ratios and serve as useful reference points for analysis and design.
2.4.3 Energy consumption
The total energy consumption, , consists of the energy expended by both the penetration force and the applied torque , as detailed in Equation 2.
| (2) |
and denote the total penetration force and torque at depth , while and refer to their corresponding total penetration depth and rotational angle, respectively. represents the incremental rotational angle at depth .
For a constant velocity ratio , the incremental rotational angle can be related to the incremental depth, . Using this relationship, the energy consumed by the torque can be calculated using Equation 3.
| (3) |
Figure 6 (b) demonstrates the process for calculating the energy consumed by torque. First, the torque curve is approximated using a sextic polynomial, shown as the dotted blue curve. The energy is then estimated by integrating this polynomial function using the Simpson’s rule as implemented in the SciPy Python library (Virtanen et al., 2020). This integration corresponds to the shaded area, which is subsequently scaled by the relevant values (Equation 3) for different rotational cases. The energy consumed by the penetration force is calculated in a similar manner, except that the energy is the shaded area under the force curve itself (Equation 2).
3 Results
The following section presents the outcomes of rotational penetration experiments conducted under various conditions, including shallow, deep, and confining pressure conditions. Detailed analyses of penetration force, torque, force reduction, and energy consumption are provided.
3.1 Shallow Rotational Penetration Tests
3.1.1 Penetration Force and Torque under Shallow Conditions
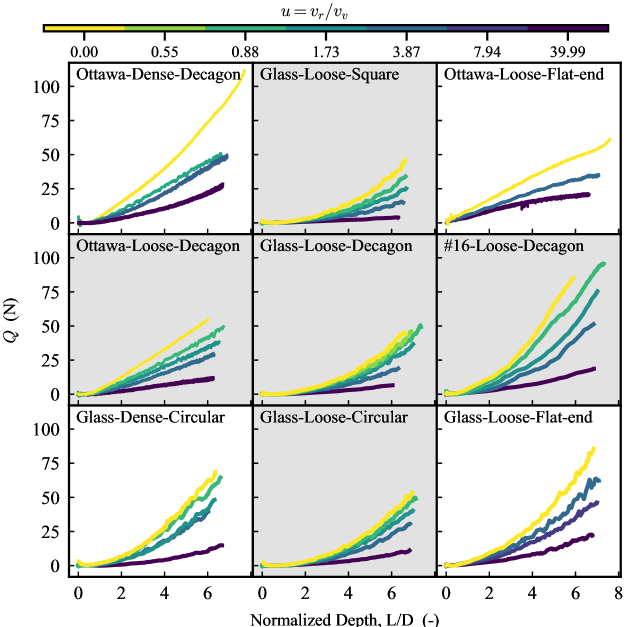
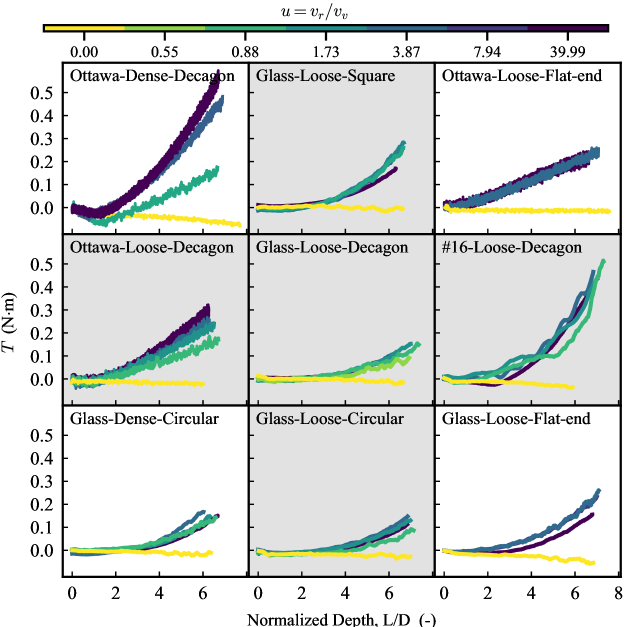
Figure 7 and Figure 8 illustrate examples of the penetration force () and torque () under shallow conditions. Generally, increases with penetration depth but decreases with . In contrast, increases with both variables. After the full immersion of the cone (), where increases slightly, a more rapid increase of occurs during the shallow penetration stage (). The penetration force curves exhibit upward concavity at deeper depths of the shallow penetration stage, aligning with the “initial penetration phase” proposed by (Puech & Foray, 2002). Both the decrease in and the increase in are not proportional to the increase in rotational speed nor velocity ratio. Specifically, decreases slightly at lower velocity ratios but rapidly at higher velocities. In contrast, increases significantly at lower velocity ratios but gently at higher velocities. Theoretically, in control cases () should always be zero since there is no rotation. However, slightly increases of with penetration depth were observed in these cases, likely due to multiple connections between the rotary motor and penetrator causing imperfect alignment of the penetration system.
3.1.2 Penetration Force Reduction under Shallow Conditions
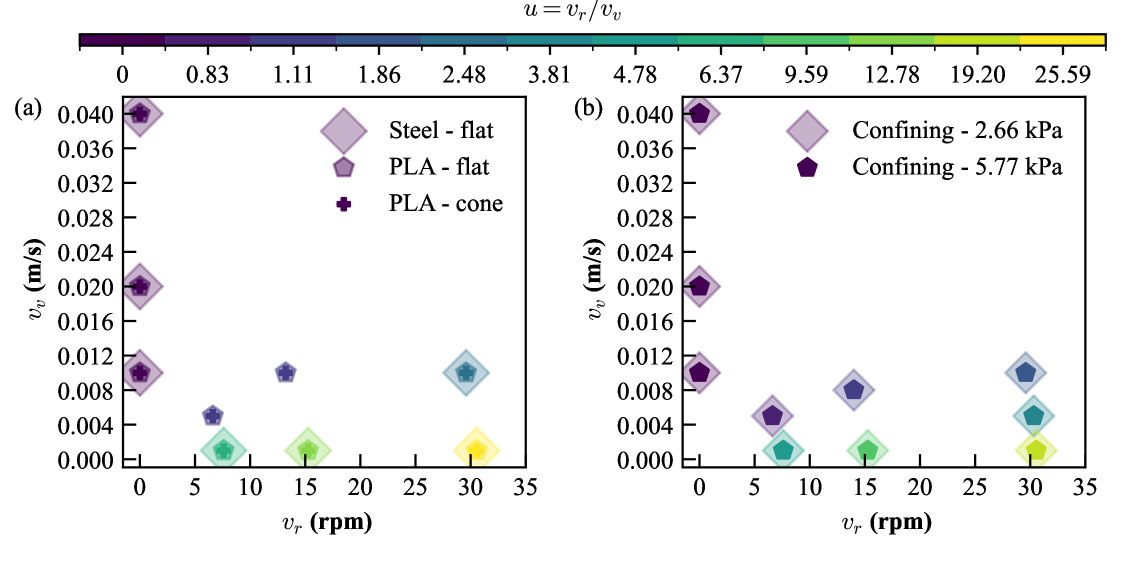
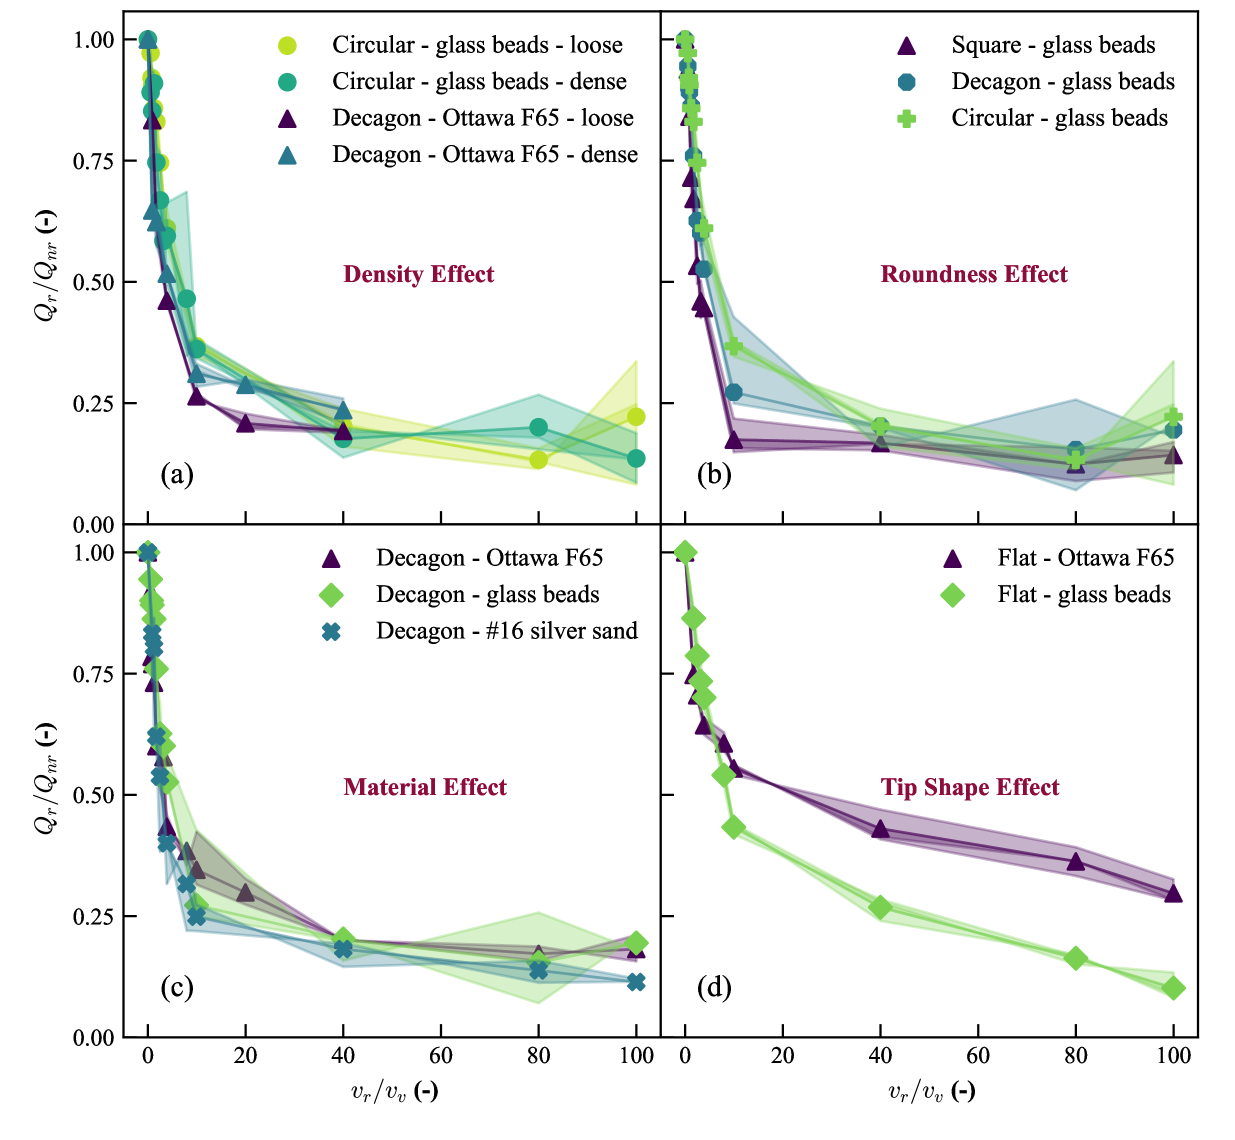
The reductions in penetration force for shallow rotational penetration tests, shown in Figure 9, are analyzed based on various factors, including relative density, penetrator roundness, material types and tip shape. In all but the flat-end cases, decreases sharply then levels off to about 0.2 as increases. The fitting parameters and absolute and relative half-point velocity ratios for all testing cases, according to Equation 1 and Figure 6 (c) are summarized in Table 3. For clarity, the range to is termed “low velocity ratios,” and values beyond as “high velocity ratios.” The parameters and indicate the reduction rate and the ultimate force ratio, respectively. Higher values imply faster reduction and thus lower half-point velocity ratios, while lower values indicate a smaller ultimate force ratio.
Figure 9 (a-c) show that the relative density and type of the granular media, as well as penetrator roundness all have limited effects on penetration force reduction, especially at high velocity ratios (similar values in Table 3). Relative density has more impact on Ottawa F65 sand (higher and ) than glass beads; for both materials, reduction is faster in denser materials (higher ); the ultimate force ratio increase with density for both materials, which is more obvious in Ottawa F65 sand. Lower penetrator roundness leads to faster and greater reduction (higher and lower ). The penetration force ratio reduces more slowly with in glass beads compared to Ottawa F65 sand and #16 silver sand, but reaches similar ultimate force ratio for in all materials (Figure 9 (c-d), Table 3). The differences between the glass beads and sands is more significant when the penetrator has a flat end instead of a cone tip (Figure 9 (d)). Among all the factors investigated, the tip shape has the most significant effect on the reduction of penetration force (comparing Figure 9 (c) with (d)). Flat-ended penetrators exhibit much less force reductions compared to coned penetrators, and the reductions do not stabilize even at the highest velocity ratio studied in this study ().
| Groups | |||||
|---|---|---|---|---|---|
| Circular-loose-glass beads | 0.10 | 0.17 | 0.99 | 7.25 | 5.76 |
| Decagon-loose-Ottawa F65 | 0.11 | 0.38 | 0.99 | 3.35 | 2.61 |
| Circular-dense-glass beads | 0.11 | 0.22 | 0.98 | 5.82 | 4.53 |
| Decagon-dense-Ottawa F65 | 0.23 | 0.63 | 0.97 | 2.89 | 1.58 |
| Decagon-glass beads | 0.11 | 0.25 | 0.98 | 5.19 | 4.04 |
| Decagon-#16 silver sand | 0.09 | 0.38 | 0.98 | 3.21 | 2.69 |
| Square-glass beads | 0.08 | 0.37 | 0.97 | 3.26 | 2.66 |
| Flat-glass beads | 0.07 | 0.12 | 0.99 | 9.26 | 8.04 |
| Flat-Ottawa F65 | 0.34 | 0.27 | 0.96 | 11.39 | 3.69 |
| Deep-PLA-Cone | 0.12 | 0.31 | 0.99 | 4.2 | 3.20 |
| Deep-PLA-Flat | 0.34 | 0.29 | 0.99 | 11.0 | 3.50 |
| Deep-Steel-Flat | 0.48 | 0.28 | 0.98 | 90.96 | 3.53 |
| Confining-2.66 kPa | 0.16 | 0.42 | 0.99 | 4.83 | 2.41 |
| Confining-5.77 kPa | 0.19 | 0.34 | 0.99 | 4.20 | 2.96 |
3.1.3 Energy Consumptions under Shallow Conditions
The force-based energy ratio, defined as the ratio of energies consumed by force in rotational and non-rotational penetrations, , and the total energy ratio, , under shallow conditions are illustrated in Figure 10. The energy plots are limited to to highlight the reduction before the half-points. Generally, force-based energy ratios decreases with , while total energy ratios increases across all cases due to rotation. The reduction of the force-based energy ratio is greater for decagon-Ottawa cases compared to circular-glass cases across various relative densities, whereas the total energy ratio is greater for circular-glass cases, as shown in Figure 10 (a) and (b). Decreasing the roundness of the penetrator slightly decreases force-based energy ratio at the same velocity ratio (Figure 10 (c)), but increases the total energy ratio (Figure 10 (d)). As shown in Figure 10 (e) and (f), with the same decagon penetrator, the force energy ratio is comparable between glass beads and Ottawa F65 materials but is slightly lower for #16 silver sand cases; in contrast, the total energy ratio for the Ottawa F65 sand case is higher than for glass beads and #16 silver sand cases. Similar trends were observed with flat-end penetrator (Figure 10 (g) and (h)).
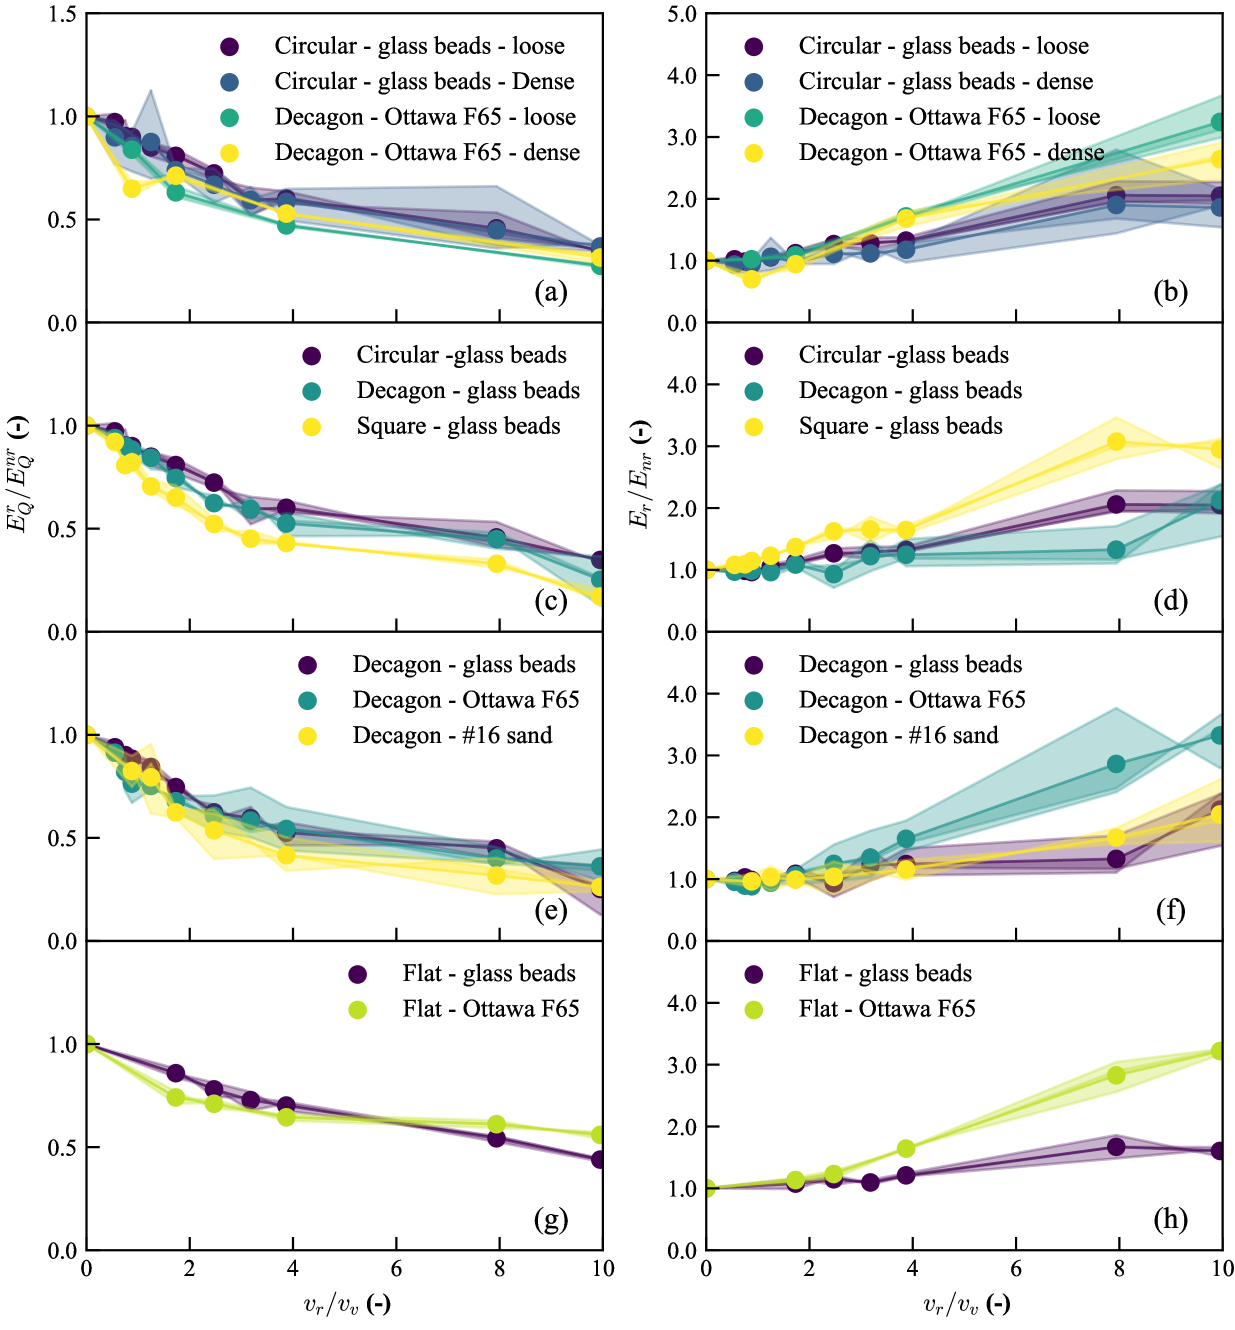
A consistent finding across all cases is that at relatively low velocity ratios (lower than 3), the force-induced energy reduces rapidly while the total energy remains relatively unchanged. This indicates that a slight rotation can cause considerable reduction in penetration force without additional cost.
3.2 Deep Rotational Penetration Tests
Deep rotational penetration tests were conducted in loose Ottawa F65 sand using three types of penetrators, as shown in Figure 3 (f), (g), and (h). These tests also aimed to further investigate the effects of penetrator-material interface friction and tip shape on penetration force reduction.
3.2.1 Penetration Force and Torque under Deep Conditions
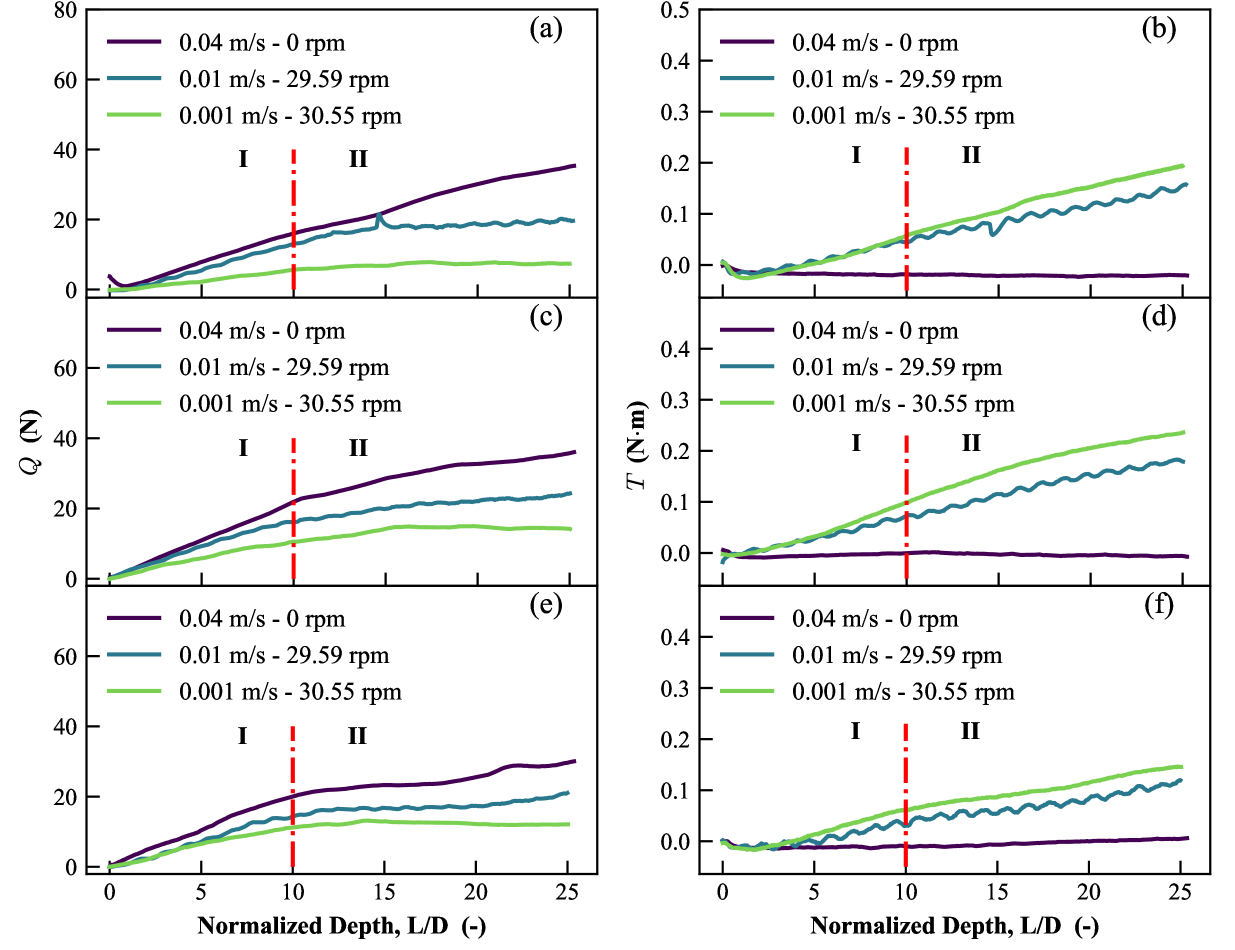
The penetration force and torque data from nine deep rotational penetration cases are presented in Figure 11. Consistent with the results from shallow tests, the penetration force, , decreases, while the torque, , increases with . However, for , two distinct stages are evident: Stage I (shallow penetration) with a penetration depth of less than a critical depth, , increases relatively quickly, followed by Stage II (deep penetration) with more gradual increase, as shown in Figure 11 (a), (c), and (e). The critical depth differs among cases, but is usually around 10 . The difference in the rate of increase between the two stages is more pronounced in the flat-end penetrator cases. Similarly, followed a comparable two-stage trend, although the distinction between the two stages is less pronounced compared to .
3.2.2 Penetration Force Reduction and Energy Consumption under Deep Conditions
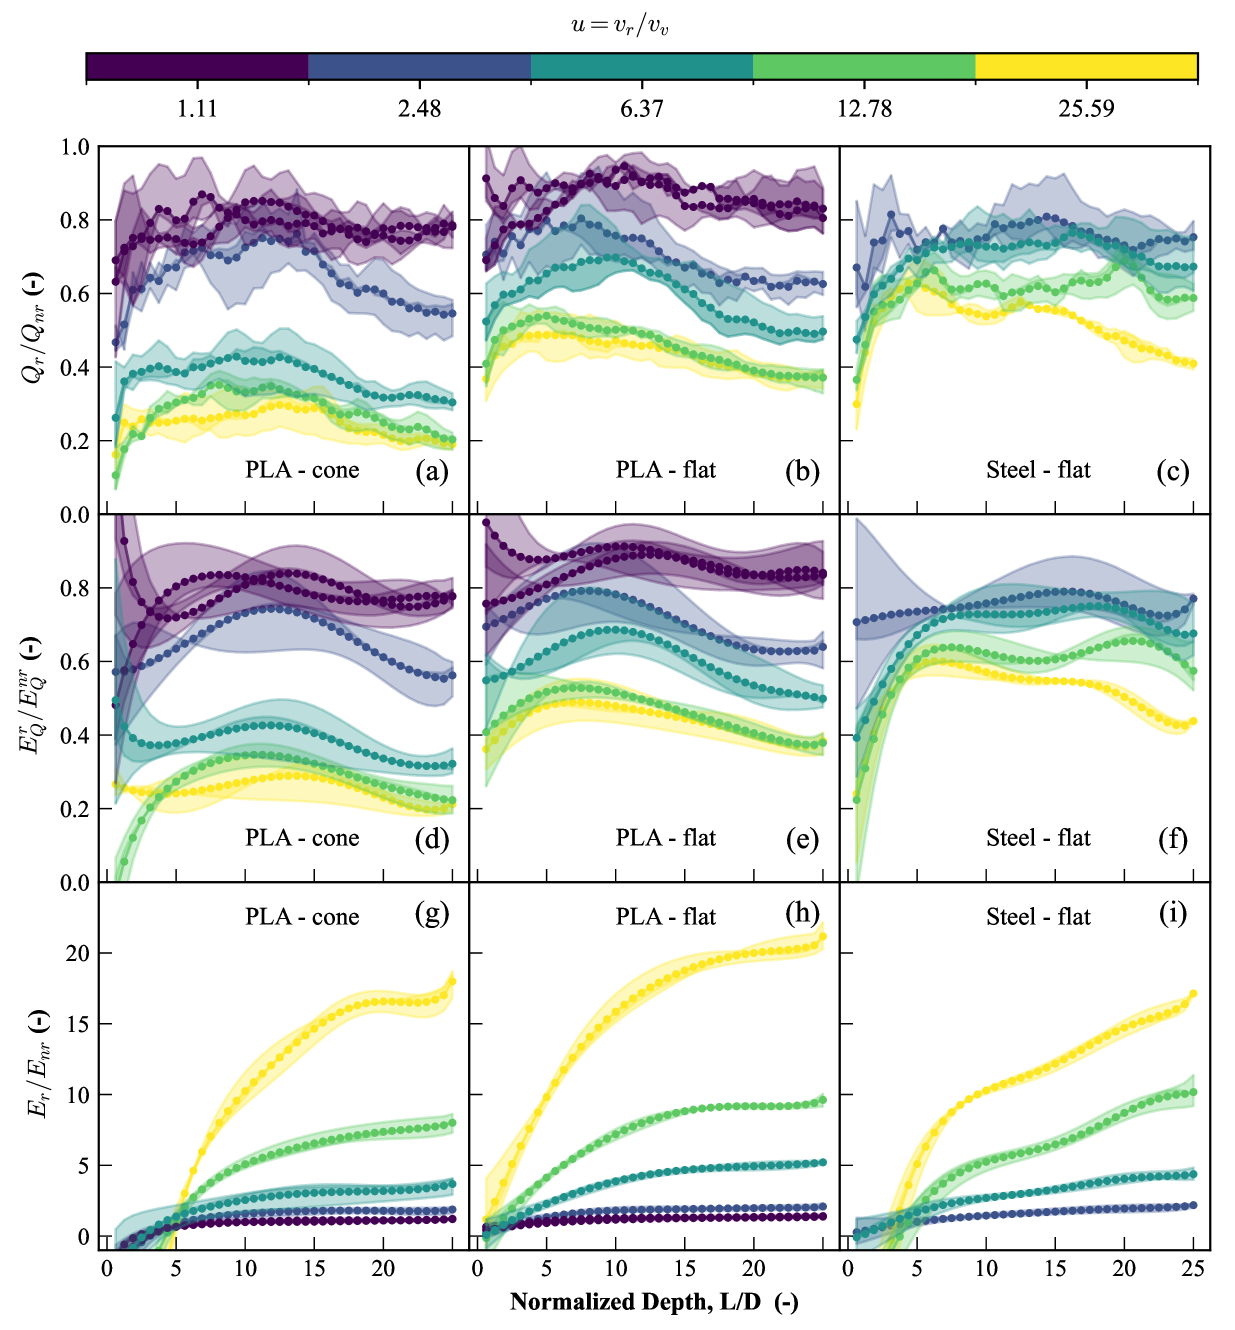
Figure 12 presents the force ratios, force-based energy ratios and total energy ratios along the penetration depth at different velocity ratios. As the penetration depth increase, the force ratio initially increases and then decreases for all velocity ratios. is comparable at shallower depths across all cases with . However, at deeper depths, sharply decreases for PLA-cone and PLA-flat cases, whereas the decrease is more gradual for Steel-flat case. Additionally, the inflection point, which marks the transition from increasing to decreasing trend, tends to shift to a shallower depth as increases. Such inflections in along depth is hypothesized to be associated with the critical depth and the different failure modes of shallow versus deep penetrations.
The fitting parameters of the force reduction curves ( vs ) for the deep test groups are shown in Table 3. Comparing PLA and steel penetrators, increased interface roughness slightly increases the reduction rate (: 0.28 vs 0.29) and considerably lowers the ultimate force ratio (: 0.48 vs 0.34). For PLA penetrators with different tip shapes, a coned tip results in a minor increase in the reduction rate (: 0.29 vs 0.31) and a substantial decrease in the ultimate force ratio (: 0.34 vs 0.12). In the comparison between the Deep-Steel-Flat case with the Flat-Ottawa F65 case, which differ only in penetration depth, deeper penetration leads to slight increase in the reduction rate (: 0.27 to 0.28) but causes a considerable increase in the ultimate force ratio (: 0.34 to 0.48). These results confirm the effect of the cone tip on force reduction observed in the shallow cases and further demonstrate that a rougher interface enhances force reduction, while deeper penetration inhibits it.
In terms of energy, while the trends of force-based energy ratios generally mirror those of force ratios, the total energy ratios show a more straightforward pattern. The total energy ratio increases with all the factors, including interface roughness, penetration depth, tip bluntness and velocity ratio.
3.3 Rotational Penetration Tests under Confining Pressures
Due to the load capacity limitations of the robotic arm, the confining pressures applied in the final test groups were relatively low, at 2.66 kPa and 5.77 kPa. Nonetheless, the results still demonstrated clear and consistent trends.
3.3.1 Penetration Force and Torque under Confining Pressure Conditions
The force and torque data for six representative tests with confining pressures are presented in Figure 13. As observed under deep conditions, both and displays two distinct stages. Note that the initial penetration depth of , indicated by the blue dashed line in Figure 13, corresponds to the thickness of the 3D-printed plate used to apply the pressure (Figure 4).
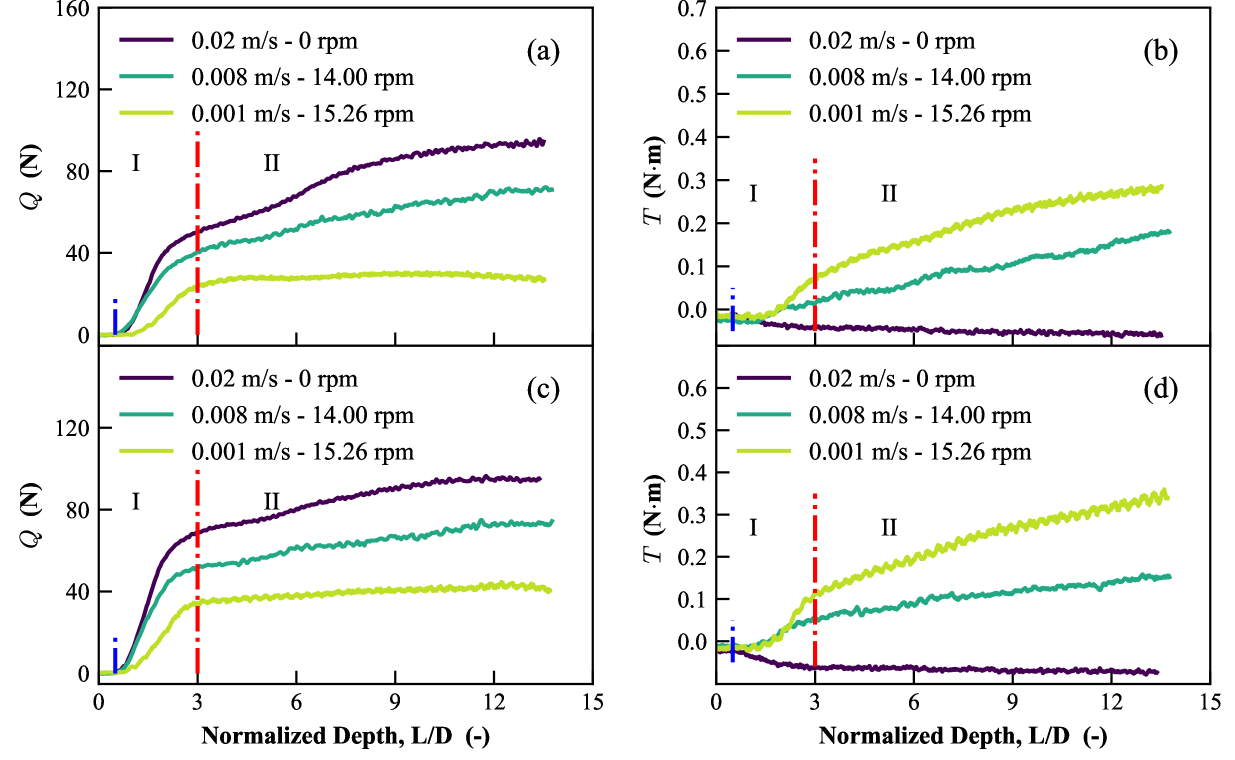
Compared to the deep condition, Stage I exhibits a more rapid increase in and the critical depth, , shifts to a shallower depth. Under the same velocity ratio , the increasing rate of in Stage I is higher under higher confining pressure. Additionally, at the final depth, the force for the non-rotational cases remain similar under different confining pressures. For both pressure conditions, the torque in the non-rotational case exhibits a negative value during penetration. However, this torque is negligible in magnitude compared to the rotational cases, and is likely a result of slight vertical misalignment in the setup.
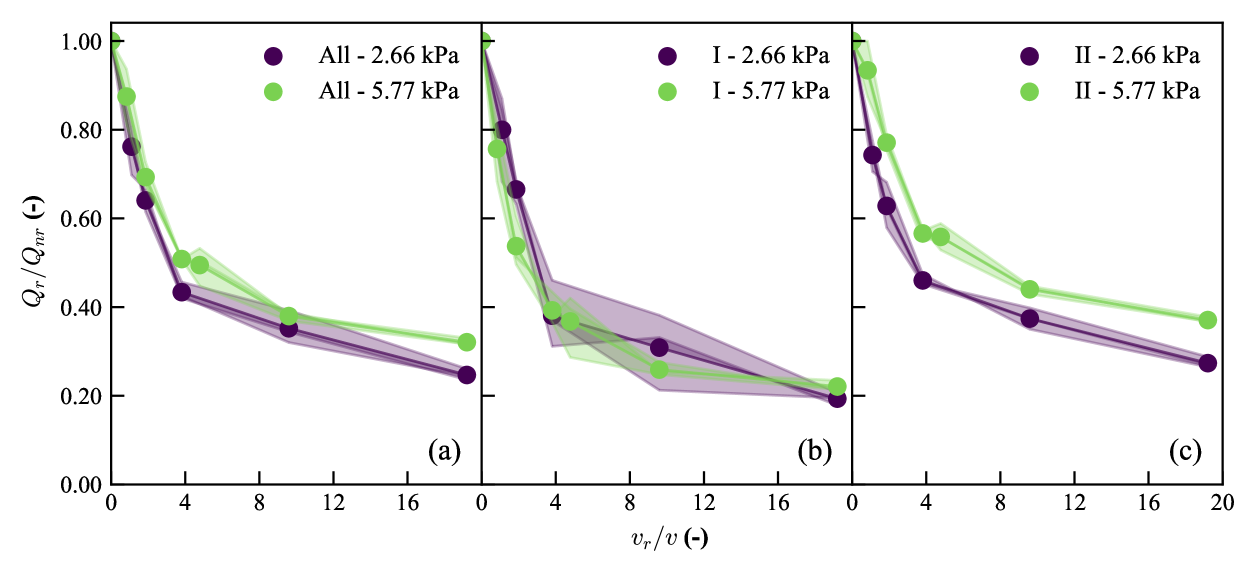
3.3.2 Penetration Force Reduction and Energy Consumption under Confining Pressure Conditions
Figure 14 demonstrates the penetration force reduction under confining pressure conditions. Two stages were considered separately to calculate , corresponding to the two distinct phases of the penetration force in Figure 13. For each confining pressure, the force ratio in Stage I decreases more rapidly than in Stage II at the same . In Stage I, is similar across all velocity ratios for both confining pressures. In contrast, it increases with confining pressure in Stage II. For example, at , ratios are 0.19 and 0.22 for Stage I, but 0.27 and 0.37 for Stage II, leading to overall values of 0.25 and 0.32, respectively. Overall, increasing confining pressure decreases reduction rate (: 0.42 to 0.34) and increases the ultimate force ratio (: 0.16 to 0.19), as shown in Table 3.
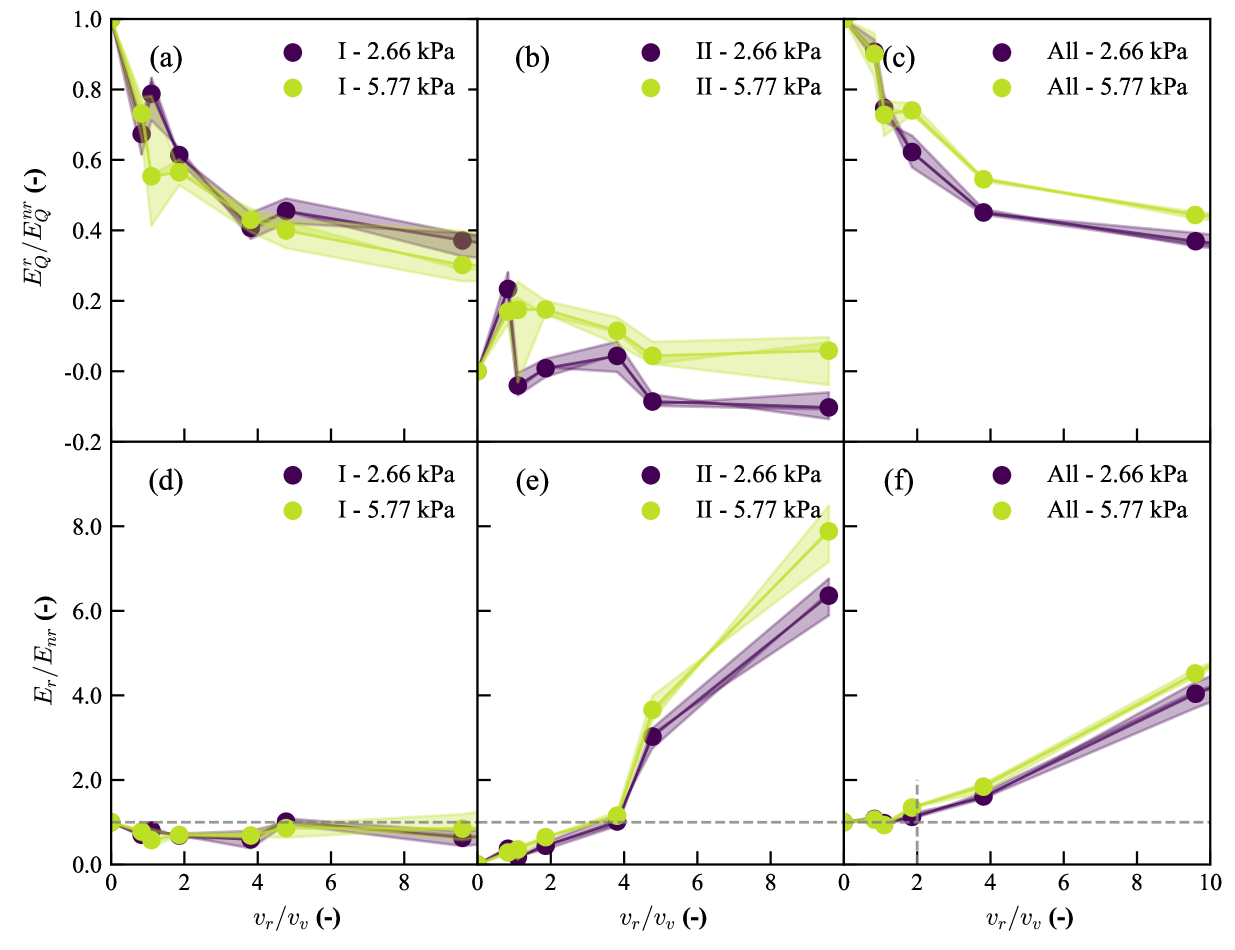
The force-based and total energy ratios under confining pressure conditions are presented in Figure 15, also with two stages. In Stage I, the force-based energy ratio, , are nearly identical for both pressure conditions, decreasing to 0.3 at . Similarly, the total energy ratio, , are comparable between the two pressure conditions, but consistently remaining around 1 as increases from 0 to 10. In Stage II, the trends are different: for the higher confining pressure case are slightly higher than those for lower pressure case, but remain below 0.2 throughout the process. In contrast, increases with velocity ratio, and it is higher for the higher pressure case when . Overall, Figure 15 (c) and (f) indicate that both and increase marginally with confining pressure under same velocity ratio.
4 Discussions
4.1 Synthesis of Trends on Rotation-induced Reduction of Penetration Force
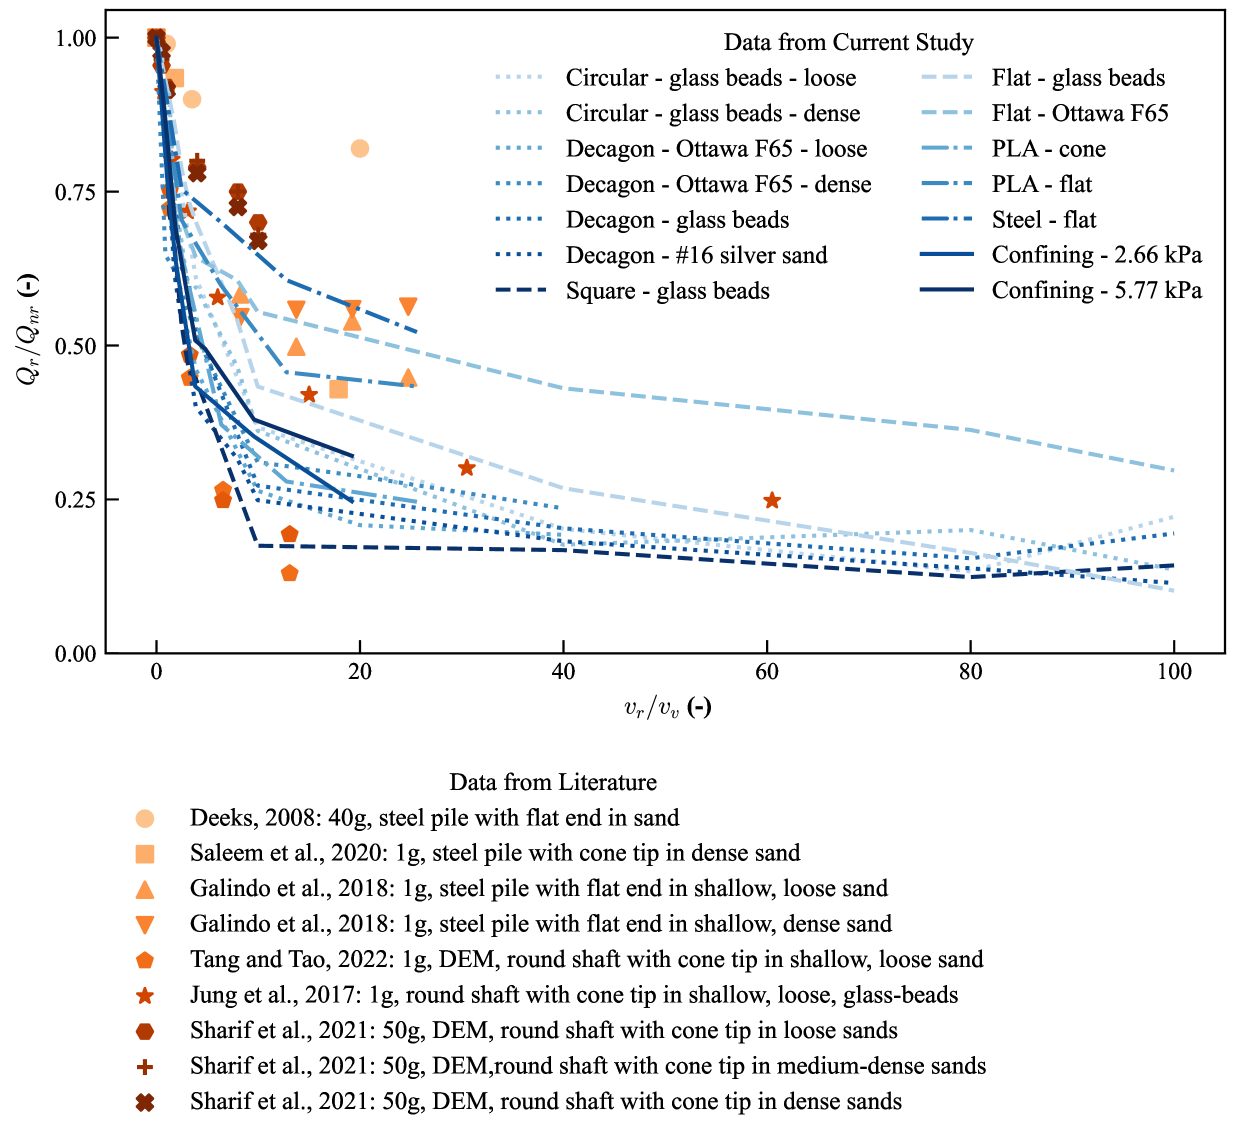
Data from current and previous studies on rotational penetration force reduction are summarized in Figure 16. The data consistently support an decrease in force ratio as increases. However, the force reduction rates and ultimate force ratios vary significantly across the datasets. With the broader ranges of considered in this study, the decline of force ratio is further confirmed to follow an approximately hyperbolic trend.
Theoretical expressions for the rotational penetration force have been proposed in several studies (Bengough et al., 1997; Sharif et al., 2021; Yang et al., 2024). These derivations typically rely on a common set of assumptions, such as uniform soil properties at the cone scale and the invariance of normal stress on the cone surface under rotation. However, our previous numerical simulations demonstrated a significant reduction in normal stress due to rotation (Tang & Tao, 2022). By relaxing this assumption and employing a vector-based derivation, we derived expressions for the total penetration resistance of a rotating cone (Equation 10) and a non-rotating cone (Equation 12), as well as for the penetration resistance on rotating and non-rotating shafts (Equation 13). We then obtained expressions for the total penetration forces for rotating and non-rotating configurations (Equation 16, Equation 15) and their ratio (Equation 17). The results are consistent with those in Yang et al. (2024).
Equation 17 shows that the penetration resistance on both the rotating cone and shaft follows hyperbolic functions of the relative velocity ratio (Equation 11, Equation 14). Although the sum of two hyperbolic functions does not inherently result in another hyperbolic function, the total penetration force can be reasonably approximated as one. This approximation is valid because, in sand, the shaft penetration force is typically much smaller compared to the cone penetration force, especially at shallow penetration depths. This theoretical analysis clarifies that a hyperbolic decay is more appropriate and justified than an exponential decay (Jung et al., 2017), which aligns with the nearly hyperbolic trend observed in the force ratio data from this study. When approaches infinity, the contributions of friction on the total rotational penetration force, both on the cone and shaft, approach zero, leading to the ultimate force ratio as shown in Equation 18.
Flat-ended penetrators can be conceptualized as cones with a half-angle, , of 90 degrees. As demonstrated by Equation 18, the relative force ratio increases with increasing . This observation is consistent with result in shallow penetration tests (comparing Figure 9 (c) with (d)) and provides a partial explanation for the differences observed between the deep penetration behaviors of the PLA-cone and PLA-flat cases, as illustrated in Figure 11 (a) and (b), respectively. Furthermore, Equation 18 indicates that the relative force ratio decreases as the interface friction coefficient, , increases. This trend aligns with the experimental results comparing the Steel-flat and PLA-flat cases, as shown in Figure 11 (b) and (c). The influence of tip shape and interface friction coefficient also explains the relatively high ultimate force ratio reported in Galindo et al. (2018), which involved shallow penetration of a steel flat-ended pile in sands (Figure 16).
As depth and confining pressure the total non-rotational penetration force () is expected to increase. For the ultimate force ratio () to remain unchanged under these conditions, the rotational cone normal force () must change proportionally with (Equation 18). However, the available data suggests disproportional changes (Figure 16). For instance, increases in depth (Figure 11 (a)-(c)) and confining pressure (Figure 14) have been shown to lead to higher ultimate values of .
Although the direct effect of gravity is not examined in this study, an elevated gravitational field is expected to increase the stress level in sand, resembling deep penetration under higher confining pressures. Consequently, higher -levels are anticipated to reduce the effectiveness of rotation-induced penetration resistance reduction. Overall, all the inhibiting factors, including higher level, lower interface friction and a flat-tip design, explains the observed low reduction rate and high ultimate force ratio reported in Deeks (2008) (Figure 16), where penetration was conducted using a flat-ended steel penetrator in sand under 40 .
The effect of relative density on remains inconclusive (Figure 16). Data from this study and Galindo et al. (2018) indicate that rotational penetration of a closed-ended penetrator in denser sands under 1 conditions slightly increases . In contrast, numerical simulations by Sharif et al. (2021) under 50 conditions show the opposite trend, though the differences across cases are small. In the latter case, it is plausible that the elevated gravitational field significantly increased the confining pressure, overshadowing the influence relative density.
One of the more consistent trend observed in this study is the effect of penetrator cross-section shape. Figure 9 (b) demonstrates that as penetrator roundness decreases, decreases, especially when . On the other hand, influences of granular material characteristics (e.g., particle shape and size distribution) on are less clear. While these influences are limited for conical penetrators (Figure 9 (c)), these factors become significantly more pronounced for flat-ended penetrators.
In summary, rotation induces reductions in both contributions from friction-based shear stress ans well as contact-based cone normal stress , but rotation’s relative effect depends on intrinsic properties of the granular material and the penetrator, as well as external factors such as gravitational field and confining pressure. It is observed that these critical factors overlap strongly with those governing interface dilatancy. This parallelism suggests that micromechanical theories of dilatancy (e.g., particle rearrangement, shear-induced volume changes) may provide a unified pathway to model rotational effects.
4.2 Energy Implications
The energy consumption during rotational penetration tests under shallow, deep, and confining pressure conditions is illustrated in Figure 10, Figure 12, and Figure 15. In general, the relative energy associated with force () decreases sharply at first and then stabilizes as increases. Conversely, the total relative energy () increases with , starting gradually but accelerating at higher values, primarily due to the growing energy consumption from torque.
The benefit-cost ratio (BCR) is defined as the ratio of the benefit—reduction in energy associated with force—to the cost, represented by the energy consumed by torque (Equation 4). The BCR for all cases is summarized in Figure 17.
| (4) |
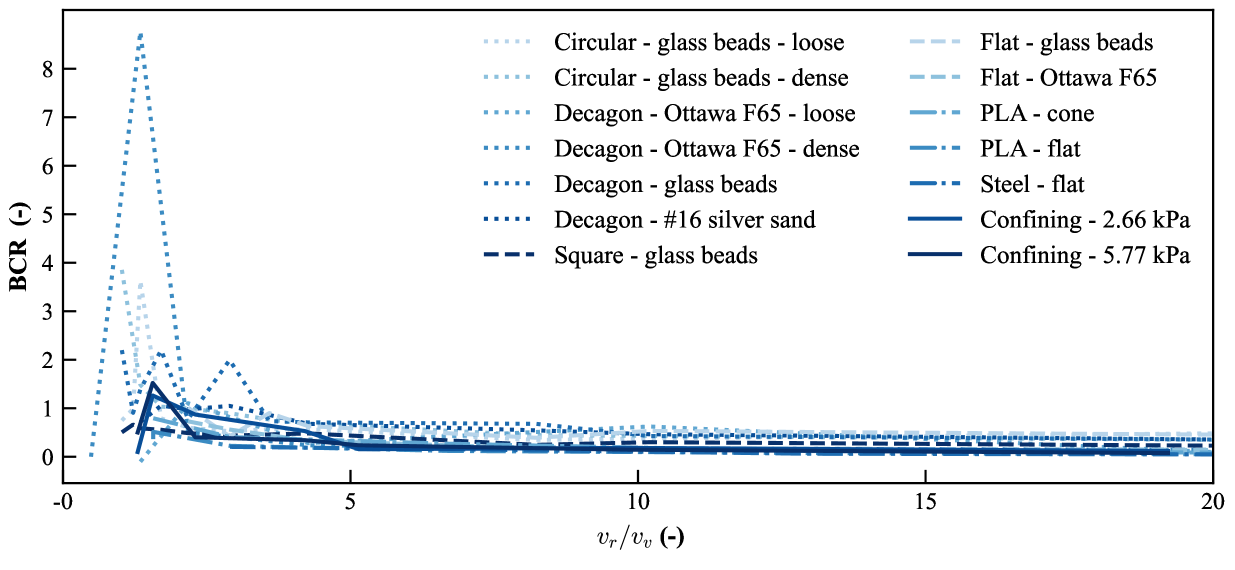
Results show that BCR falls below 1 at high values, indicating energy inefficiency at greater rotational speeds. The maximum BCR is typically observed at relatively low values (approximately 0–3), depending on the test conditions. These findings align with simulation results from (2023), which identified an optimal rotational velocity () that minimizes both penetration force and total energy. However, it should be noted that the penetrator in the referenced study features a conical tip bent from the vertical to an inclined orientation, which differs from the configurations analyzed here.
Our prior work demonstrated that dual-anchor burrowing can be achieved in a minimalistic robot through coordinated rotation and extension/contraction (Tang & Tao, 2022; Tang et al., 2024; Zhong et al., 2023; Zhong & Tao, 2023). For such self-burrowing robots, two critical design challenges emerge: reducing penetration resistance and minimizing energy consumption. This study reveals a key trade-off: higher velocity ratios lower penetration forces but demand greater energy input, whereas lower ratios conserve energy at the expense of increased burrowing force. To optimize performance, future designs should integrate dynamic locomotion strategies, including controlled rotation, to balance these competing priorities.
4.3 Limitations and Future Work
The holistic rotational penetration tests in this study, while illuminating key relationships between force reduction and its influencing factors, are subject to several constraints. First, the robotic arm’s force capacity (limited to 150 N) restricted achievable penetration depths, particularly under higher confining pressure, and precluded systematic testing of penetrators with larger diameters. Second, the applied confining pressure levels were orders of magnitude lower than centrifuge-simulated conditions (Sharif et al., 2021), potentially underestimating scaling effects on force reduction. Third, while grain shape is known to influence tip resistance (Liu & Lehane, 2012), the study did not isolate the effects of grain size and shape across materials, limiting mechanistic insights into their individual contributions. Third, critical factors such as particle breakage (relevant in high-stress environments) and saturation (critical for submarine or geotechnical applications) were not modeled. Finally, the exclusive measurement of total penetration forces and torques in this study precludes isolation of rotational effects on tip resistance () versus shaft resistance (), limiting further mechanistic analysis of their individual contributions.
Future work should prioritize two interconnected objectives: (1) addressing the methodological limitations identified in this study, and (2) establishing a unified mechanistic framework (e.g., interface dilatancy) to explain how intrinsic and external factors govern rotation-induced reductions in cone normal resistance.
5 Conclusions
This study has systematically investigated the effects of rotational motion on penetration resistance and energy consumption in granular media under shallow, deep, and low confining-pressure conditions. A broad range of tangential-to-axial velocity ratios (up to ) was considered using multiple penetrator geometries, interface friction levels, penetration depths, and particle types. Based on the results, several key conclusions can be drawn:
-
•
Hyperbolic decay of penetration force. Across all conditions, the rotational penetration force decreases approximately in a hyperbolic manner with increasing velocity ratio . At low velocity ratios (e.g., ), even modest rotation achieves meaningful reductions in penetration force. Beyond a certain threshold (the “half-point” velocity ratio), further increases in offer diminishing returns, with force ratios approaching an ultimate limit.
-
•
Effects of penetrator geometry and interface friction. Penetrators with conical tips achieve greater force reductions than flat-ended designs, underscoring the importance of apex angle. Cross-sectional roundness also plays a significant role, particularly at lower velocity ratios: less rounded geometries lead to faster and more force reductions. In addition, rougher interfaces also facilitates rotation-induced reductions of penetration resistance.
-
•
Effects of confining pressure and penetration depth. Higher confining pressure and deeper penetration generally increase the overall resistance and raise the ultimate force ratio, leading to reduced effectiveness of rotational penetration. These increases are mainly attributed to the deep penetration stage, which exhibits a different failure mode compared to shallow penetration. Nevertheless, the core hyperbolic trend remains consistent.
-
•
Limited impact of material type and relative density. Within the ranges tested, the granular material (sands and glass beads) and its relative density exert only moderate influences on force reduction, especially at higher .
-
•
Energy trade-offs and design implications. While rotation consistently lowers force-based energy consumption, it substantially raises torque-related energy demands at higher . Consequently, total energy consumption increases at large velocity ratios, even though the net penetration force decreases. This trade-off suggests that incorporating rotation at moderate (< 3) may optimize the balance between penetration force reduction and overall energy cost, particularly relevant for self-burrowing robots that must manage limited power and payload capacities.
In sum, this study provides a rich dataset and comprehensive analysis demonstrating that rotation is a promising strategy for reducing penetration resistance in granular media, while also highlighting a key trade-off between force reduction and energy consumption. By examining both intrinsic (e.g., grain and penetrator properties) and external factors (e.g., confining pressure, depth), the findings offer meaningful insights for designing bio-inspired self-burrowing robots and effective penetration technologies, particularly by selecting moderate velocity ratios, carefully tailored tip geometries, and suitable interface friction. Future work should further clarify scaling effects, distinguish tip- versus shaft-related resistance components, and develop more in-depth mechanistic frameworks to explain rotation-induced reductions of penetration resistance.
Acknowledgement
This material is based upon work supported by the National Science Foundation (NSF) under NSF CMMI 1849674, CMMI 1841574 and EEC 1449501. Any opinions, findings, and conclusions or recommendations expressed in this material are those of the authors and do not necessarily reflect those of the NSF.
List of Notations
| Constant for hyperbolic fitting, representing the ultimate reduction (-) | |
| , | Maximum, minimum void ratios (-) |
| Shaft friction (non-rotating and rotating) per unit area at depth | |
| Constant for hyperbolic fitting, representing the reduction rate (-) | |
| Penetration resistance (stress) on a non-rotating and rotating cone | |
| Tangential-to-axial velocity ratio (-) | |
| , , | Rotational, vertical, and resultant velocities of the penetrator (m/s) |
| Infinitesimal area element on the cone surface (m2) | |
| Infinitesimal friction force on (N) | |
| Cross-sectional area at the cone base | |
| , | Coefficients of curvature and uniformity (-) |
| Diameter of the penetrator (m) | |
| Median particle size (mm) | |
| Total energy for penetration (J) | |
| , | Total energy for non-rotational and rotational penetration (J) |
| Energy consumed by penetration force (J) | |
| , | Energy consumed by penetration force for non-rotational and rotational penetration (J) |
| Energy consumed by penetration torque (J) | |
| , | z-direction component of the friction force and normal force on the cone (N) |
| Penetration depth (m) | |
| Critical depth marking the transition from shallow penetration to deep penetration | |
| Total penetration force on the penetrator (N) | |
| , | Penetration force on the penetrator for non-rotaitonal and rotational penetration(N) |
| Total penetration force at depth (N) | |
| Cone base radius (m) | |
| Total resistive torque on the penetrator (N·m) | |
| , | Total resistive torque on the penetrator for non-rotational and rotational penetration (N·m) |
| Total resistive torque at depth (N·m) | |
| Half-cone angle (rad, deg) | |
| Friction coefficient (-) | |
| Angular velocity (rad/s) | |
| , | Rotational influence factor for the cone tip and shaft (-) |
| Normal stress on the rotating cone (kPa) | |
| Normal stresses on the shaft surface (non-rotating and rotating) at depth | |
| Shear (frictional) stress on the cone (kPa) | |
| Total rotational angle (rad) | |
| Radial, circumferential, and vertical coordinates in cylindrical system | |
| Corresponding unit vectors in the , , and directions | |
| Unit vector along and outward orthogonal to the cone’s slanted generatrix | |
| , | Velocity of a point on the cone at radius and its projection on the tangent plane |
References
References
- Abraham & Elbaum (2013) Abraham, Y. & Elbaum, R. (2013). Hygroscopic movements in Geraniaceae: The structural variations that are responsible for coiling or bending. New Phytologist 199, No. 2, 584–594, 10.1111/nph.12254.
- Abraham et al. (2012) Abraham, Y., Tamburu, C., Klein, E., Dunlop, J. W. C., Fratzl, P., Raviv, U. & Elbaum, R. (2012). Tilted cellulose arrangement as a novel mechanism for hygroscopic coiling in the stork’s bill awn. Journal of The Royal Society Interface 10.1098/rsif.2011.0395.
- Bagheri et al. (2023) Bagheri, H., Stockwell, D., Bethke, B., Okwae , N. K., Aukes, D., Tao, J. & Marvi, H. (2023). A bio-inspired helically driven self-burrowing robot. Acta Geotechnica , 1–14.
- Bengough et al. (1997) Bengough, A. G., Mullins, C. E. & Wilson, G. (1997). Estimating soil frictional resistance to metal probes and its relevance to the penetration of soil by roots. European journal of soil science 48, No. 4, 603–612.
- Calder\a’on et al. (2016) Calder\a’on, A. A., Ugalde, J. C., \a’obal Zagal, J. C. & P\a’erez-Arancibia, N. O. (2016). Design, fabrication and control of a multi-material-multi-actuator soft robot inspired by burrowing worms. In 2016 IEEE International Conference on Robotics and Biomimetics (ROBIO), IEEE, pp. 31–38.
- Chen et al. (2021) Chen, Y., Khosravi, A., Martinez, A. & DeJong, J. (2021). Modeling the self-penetration process of a bio-inspired probe in granular soils. Bioinspiration & Biomimetics 16, No. 4, 046012, 10.1088/1748-3190/abf46e.
- Chen & Martinez (2023) Chen, Y. & Martinez, A. (2023). DEM modelling of root circumnutation-inspired penetration in shallow granular materials. Géotechnique , 1–1810.1680/jgeot.22.00258.
- Cogger et al. (1998) Cogger, H. G., Zweifel, R. G. & Kirshner, D. (1998). Encyclopedia of reptiles & amphibians. Weldon Owen.
- Deeks & White (2008) Deeks, A. & White, D. (2008). Centrifuge modelling of rotary-jacked tubular piles: gyropiling. In Foundations - Proceedings of the 2nd BGA International Conference on Foundations (ICOF), vol. CD (Brown, M., Bransby, M., Brennan, A. & Knappett, J., eds.), IHS BRE Press, pp. 532–544, centrifuge modelling of rotary-jacked tubular piles: gyropiling ; Conference date: 01-01-2008.
- Deeks (2008) Deeks, A. D. (2008). An investigation into the strength and stiffness of jacked piles in sand. Ph.D. thesis, University of Cambridge.
- Dorgan & Daltorio (2023) Dorgan, K. M. & Daltorio, K. A. (2023). Fundamentals of burrowing in soft animals and robots. Frontiers in Robotics and AI 10, 1057876, 10.3389/frobt.2023.1057876.
- Dorgan et al. (2013) Dorgan, K. M., Law, C. J. & Rouse, G. W. (2013). Meandering worms: Mechanics of undulatory burrowing in muds. Proceedings of the Royal Society B: Biological Sciences 280, No. 1757, 20122948, 10.1098/rspb.2012.2948.
- Elbaum et al. (2008) Elbaum, R., Gorb, S. & Fratzl, P. (2008). Structures in the cell wall that enable hygroscopic movement of wheat awns. Journal of Structural Biology 164, No. 1, 101–107, 10.1016/j.jsb.2008.06.008.
- Galindo et al. (2018) Galindo, P. G., Davidson, C. & Brown, M. (2018). Installation behavior of open ended and closed ended piles with torque application: 1st international conference on press-in engineering (ipce 2018). Proceedings of the 1st International Conference on Press-in Engineering 2018, Kochi (IPCE 21018) , 379–386.
- Gans (1968) Gans, C. (1968). Relative Success of Divergent Pathways in Amphisbaenian Specialization. The American Naturalist 102, No. 926, 345–362, 2459436.
- Gans (1974) Gans, C. (1974). Analysis by comparison: Burrowing in amphisbaenians. Biomechanics: An Approach to Vertebrate Biology , 117–191.
- Hassan & Ibrahim (2021) Hassan, N. S. & Ibrahim, A. (2021). Investigation of Pile Behaviour using Rotary-Jacking Method. IOP Conference Series: Materials Science and Engineering 1153, No. 1, 012017, 10.1088/1757-899X/1153/1/012017.
- Herrel et al. (2011) Herrel, A., Choi, H. F., Dumont, E., De Schepper, N., Vanhooydonck, B., Aerts, P. & Adriaens, D. (2011). Burrowing and subsurface locomotion in anguilliform fish: Behavioral specializations and mechanical constraints. Journal of Experimental Biology 214, No. 8, 1379–1385, 10.1242/jeb.051185.
- Huang & Tao (2020) Huang, S. & Tao, J. (2020). Modeling Clam-inspired Burrowing in Dry Sand using Cavity Expansion Theory and DEM. Acta Geotechnica 15, No. 8, 2305–2326, 10.1007/s11440-020-00918-8.
- Jung et al. (2017) Jung, W., Choi, S. M., Kim, W. & Kim, H.-Y. (2017). Reduction of granular drag inspired by self-burrowing rotary seeds. Physics of Fluids 29, No. 4, 041702, 10.1063/1.4979998.
- Jung et al. (2014) Jung, W., Kim, W. & Kim, H.-Y. (2014). Self-burial Mechanics of Hygroscopically Responsive Awns. Integrative and Comparative Biology 54, No. 6, 1034–1042, 10.1093/icb/icu026.
- Kang et al. (2018) Kang, W., Feng, Y., Liu, C. & Blumenfeld, R. (2018). Archimedes’ law explains penetration of solids into granular media. Nature Communications 9, No. 1, 1101, 10.1038/s41467-018-03344-3.
- Liu & Lehane (2012) Liu, Q. & Lehane, B. (2012). The influence of particle shape on the (centrifuge) cone penetration test (CPT) end resistance in uniformly graded granular soils. Géotechnique 62, No. 11, 973–984, 10.1680/geot.10.P.077.
- Luo et al. (2023) Luo, D., Maheshwari, A., Danielescu, A., Li, J., Yang, Y., Tao, Y., Sun, L., Patel, D. K., Wang, G., Yang, S., Zhang, T. & Yao, L. (2023). Autonomous self-burying seed carriers for aerial seeding. Nature 614, No. 7948, 463–470, 10.1038/s41586-022-05656-3.
- Maladen et al. (2009) Maladen, R. D., Ding, Y., Li, C. & Goldman, D. I. (2009). Undulatory Swimming in Sand: Subsurface Locomotion of the Sandfish Lizard. Science 10.1126/science.1172490.
- Maladen et al. (2011) Maladen, R. D., Ding, Y., Umbanhowar, P. B., Kamor, A. & Goldman, D. I. (2011). Mechanical models of sandfish locomotion reveal principles of high performance subsurface sand-swimming. Journal of The Royal Society Interface 10.1098/rsif.2010.0678.
- Martinez et al. (2022) Martinez, A., Dejong, J., Akin, I., Aleali, A., Arson, C., Atkinson, J., Bandini, P., Baser, T., Borela, R., Boulanger, R., Burrall, M., Chen, Y., Collins, C., Cortes, D., Dai, S., DeJong, T., Del Dottore, E., Dorgan, K., Fragaszy, R., Frost, J. D., Full, R., Ghayoomi, M., Goldman, D. I., Gravish, N., Guzman, I. L., Hambleton, J., Hawkes, E., Helms, M., Hu, D., Huang, L., Huang, S., Hunt, C., Irschick, D., Lin, H. T., Lingwall, B., Marr, A., Mazzolai, B., McInroe, B., Murthy, T., O’Hara, K., Porter, M., Sadek, S., Sanchez, M., Santamarina, C., Shao, L., Sharp, J., Stuart, H., Stutz, H. H., Summers, A., Tao, J., Tolley, M., Treers, L., Turnbull, K., Valdes, R., van Paassen, L., Viggiani, G., Wilson, D., Wu, W., Yu, X. & Zheng, J. (2022). Bio-inspired geotechnical engineering: Principles, current work, opportunities and challenges. Géotechnique 72, No. 8, 687–705, 10.1680/jgeot.20.P.170.
- Migliaccio et al. (2013) Migliaccio, F., Tassone, P. & Fortunati, A. (2013). Circumnutation as an autonomous root movement in plants. American Journal of Botany 100, No. 1, 4–13, 10.3732/ajb.1200314.
- Naclerio et al. (2021) Naclerio, N. D., Karsai, A., Murray-Cooper, M., Ozkan-Aydin, Y., Aydin, E., Goldman, D. I. & Hawkes, E. W. (2021). Controlling subterranean forces enables a fast, steerable, burrowing soft robot. Science Robotics 6, No. 55, eabe2922, 10.1126/scirobotics.abe2922.
- Pandolfi et al. (2012) Pandolfi, C., Comparini, D. & Mancuso, S. (2012). Self-burial Mechanism of Erodium cicutarium and Its Potential Application for Subsurface Exploration. In Biomimetic and Biohybrid Systems, vol. 7375 (Hutchison, D., Kanade, T., Kittler, J., Kleinberg, J. M., Mattern, F., Mitchell, J. C., Naor, M., Nierstrasz, O., Pandu Rangan, C., Steffen, B., Sudan, M., Terzopoulos, D., Tygar, D., Vardi, M. Y., Weikum, G., Prescott, T. J., Lepora, N. F., Mura, A. & Verschure, P. F. M. J., eds.), Berlin, Heidelberg: Springer Berlin Heidelberg, pp. 384–385, 10.1007/978-3-642-31525-1_53.
- Pucker & Grabe (2012) Pucker, T. & Grabe, J. (2012). Numerical simulation of the installation process of full displacement piles. Computers and Geotechnics 45, 93–106, 10.1016/j.compgeo.2012.05.006.
- Puech & Foray (2002) Puech, A. & Foray, P. (2002). Refined Model for Interpreting Shallow Penetration CPTs in Sands. In Offshore Technology Conference, OnePetro, 10.4043/14275-MS.
- Quillin (2000) Quillin, K. J. (2000). Ontogenetic Scaling of Burrowing Forces in the Earthworm Lumbricus Terrestris. Journal of Experimental Biology 203, No. 18, 2757–2770, 10.1242/jeb.203.18.2757.
- Roth (2021) Roth, L. K. (2021). Constant speed penetration into granular materials: Drag forces from the quasistatic to inertial regime. Granular Matter 23, No. 3, 54, 10.1007/s10035-021-01106-5.
- Roth et al. (2021) Roth, L. K., Han, E. & Jaeger, H. M. (2021). Intrusion into Granular Media Beyond the Quasistatic Regime. Physical Review Letters 126, No. 21, 218001, 10.1103/PhysRevLett.126.218001.
- Saathoff et al. (2021) Saathoff, J., Frick, D. & Achmus, M. (2021). Investigation of the behaviour of jacked and rotary-jacked piles in sandy soils. In Piling 2020, ICE Publishing, pp. 241–246, 10.1680/pttc.65048.241, URL https://www.icevirtuallibrary.com/doi/abs/10.1680/pttc.65048.241.
- Saleem et al. (2020) Saleem, M. A., Malik, A. A. & Kuwano, J. (2020). End shape and rotation effect on steel pipe pile installation effort and bearing resistance. Geomechanics and Engineering 23, No. 6, 523–533, 10.12989/gae.2020.23.6.523.
- Sharif et al. (2021) Sharif, Y. U., Brown, M. J., Ciantia, M. O., Cerfontaine, B., Davidson, C., Knappett, J., Meijer, G. J. & Ball, J. (2021). Using discrete element method (DEM) to create a cone penetration test (CPT)-based method to estimate the installation requirements of rotary-installed piles in sand. Canadian Geotechnical Journal 58, No. 7, 919–935, 10.1139/cgj-2020-0017.
- Tang & Tao (2022) Tang, Y. & Tao, J. (2022). Multiscale analysis of rotational penetration in shallow dry sand and implications for self-burrowing robot design. Acta Geotechnica 10.1007/s11440-022-01492-x.
- Tang et al. (2024) Tang, Y., Zhong, Y. & Tao, J. (2024). Bio-inspired rotational penetration and horizontal self-burrowing soft robot. Acta Geotechnica 19, No. 3, 1345–1363, 10.1007/s11440-023-02173-z.
- Tao (2021) Tao, J. J. (2021). Burrowing soft robots break new ground. Science Robotics 6, No. 55, eabj3615, 10.1126/scirobotics.abj3615.
- Tao et al. (2020) Tao, J. J., Huang, S. & Tang, Y. (2020). SBOR: A minimalistic soft self-burrowing-out robot inspired by razor clams. Bioinspiration & Biomimetics 15, No. 5, 055003, 10.1088/1748-3190/ab8754.
- Taylor et al. (2021) Taylor, I., Lehner, K., McCaskey, E., Nirmal, N., Ozkan-Aydin, Y., Murray-Cooper, M., Jain, R., Hawkes, E. W., Ronald, P. C., Goldman, D. I. & Benfey, P. N. (2021). Mechanism and function of root circumnutation. Proceedings of the National Academy of Sciences 118, No. 8, e2018940118, 10.1073/pnas.2018940118.
- Trueman (1966) Trueman, E. R. (1966). Bivalve Mollusks: Fluid Dynamics of Burrowing. Science 10.1126/science.152.3721.523.
- Trueman (1967) Trueman, E. R. (1967). The dynamics of burrowing in ensis (bivalvia). Proceedings of the Royal Society of London. Series B, Biological Sciences 166, No. 1005, 459–476, URL http://www.jstor.org/stable/75643, 75643.
- Trueman et al. (1966) Trueman, E. R., Brand, A. R. & Davis, P. (1966). The dynamics of burrowing of some common littoral bivalves. Journal of Experimental Biology 44, No. 3, 469–492.
- Virtanen et al. (2020) Virtanen, P., Gommers, R., Oliphant, T. E., Haberland, M., Reddy, T., Cournapeau, D., Burovski, E., Peterson, P., Weckesser, W., Bright, J., van der Walt, S. J., Brett, M., Wilson, J., Millman, K. J., Mayorov, N., Nelson, A. R. J., Jones, E., Kern, R., Larson, E., Carey, C., İvgin, İ. P., Virtanen, P. & Contributors, S. . (2020). SciPy 1.0: Fundamental Algorithms for Scientific Computing in Python . Nature Methods 17, 261–272, 10.1038/s41592-019-0686-2, URL https://doi.org/10.1038/s41592-019-0686-2.
- Wei et al. (2021) Wei, H., Zhang, Y., Zhang, T., Guan, Y., Xu, K., Ding, X. & Pang, Y. (2021). Review on Bioinspired Planetary Regolith-Burrowing Robots. Space Science Reviews 217, No. 8, 87, 10.1007/s11214-021-00863-2.
- Yang et al. (2024) Yang, X., Zhang, N., Wang, R., Martinez, A., Chen, Y., Fuentes, R. & Zhang, J.-M. (2024). A numerical investigation on the effect of rotation on the cone penetration test. Canadian Geotechnical Journal 10.1139/cgj-2023-0413.
- Zhong et al. (2023) Zhong, Y., Huang, S. & Tao, J. (2023). Minimalistic Horizontal Burrowing Robots. Journal of Geotechnical and Geoenvironmental Engineering 149, No. 4, 02823001, 10.1061/JGGEFK.GTENG-11468.
- Zhong & Tao (2023) Zhong, Y. & Tao, J. (2023). Comparative Analysis of Horizontal Self-Burrowing Strategies Using Full-Scale DEM-MBD Co-Simulations. In Geo-Congress 2023, Los Angeles, California: ASCE, pp. 106–114, 10.1061/9780784484692.011.
Appendix

Assuming the soil properties are homogeneous at the scale of the cone, closed-form expressions for the penetration forces on the cone and shaft, both with and without rotation, can be derived.
Rotary Cone Penetration Resistance
As illustrated in Figure 18, we consider a cone penetrator in a cylindrical coordinate system , where is the radial coordinate, is the circumferential coordinate, and is the vertical coordinate. The corresponding unit vectors at any point on the cone surface are , , and .
We define the unit vector along the slanted generatrix of the cone and its outward orthogonal unit vector as:
where is the half-cone angle.
At a radius , the cone’s velocity is given by
where is the vertical penetration speed and is the angular velocity of rotation.
Because friction acts along the tangent plane, we project onto that plane:
Assume that the normal stress on the rotating cone is uniform, and let be the shear (frictional) stress, where is the friction coefficient. Over an infinitesimal ring area on the cone surface, the frictional force is
The corresponding differential friction force in the -direction is obtained by taking the component of in the direction of based on the velocity vector on the tangent plane:
Putting this together leads to:
By integrating from to , the total friction force in the -direction is
| (5) | ||||
| (6) |
where is a dimensionless velocity ratio.
Similarly, the normal force in the -direction can be derived to be
| (7) | ||||
| (8) | ||||
| (9) |
Hence, the total penetration resistance on the rotating cone is
| (10) | ||||
where
| (11) |
is a rotational influence factor for the cone varying from (when ) to (when ).
When (i.e., ), there is no rotation, and the cone’s penetration resistance is
| (12) |
Total Penetration Force Ratio,
For the shaft portion of the penetrator at a depth , the non-rotating () and rotating () resistances per unit area are, respectively,
| (13) |
Here, and are the normal stresses on the shaft surface at depth for non-rotating and rotating cases, respectively, and
| (14) | ||||
is a rotational influence factor for the shaft.
The total non-rotating and rotating penetration forces are:
| (15) | ||||
| (16) | ||||
where is the cross-sectional area at the cone base. Consequently, the ratio of these forces is
| (17) |
In the limit as , the ratio becomes
| (18) |