Prepared for submission to Journals of the Royal Statistical Society Series A \DOIDOI HERE \accessAdvance Access Publication Date: Day Month Year \appnotesOriginal article
Sutton et al.
[]Address for correspondence. Aja Sutton, Population Research Center, Portland State University, 506 SW Mill St., Suite 780, Portland, OR, 97201, USA. ajas@pdx.edu
0Year 0Year 0Year
Evaluating Multilevel Regression and Poststratification with Spatial Priors with a Big Data Behavioural Survey
Abstract
Multilevel regression and poststratification (MRP) is a computationally efficient indirect estimation method that can quickly produce improved population-adjusted estimates with limited data. Recent computational advancements allow efficient, relatively simple, and quick approximate Bayesian estimation for MRP. As population health outcomes of interest including vaccination uptake are known to have spatial structure, precision may be gained by including space in the model. We test a spatial MRP model that includes term that smooth across demographics and geographic areas using a large, unrepresentative survey. We produce California county-level estimates of first-dose COVID-19 vaccination up to June 2021 using classic and spatial MRP models, and poststratify using data from the US Census Bureau’s American Community Survey. We assess validity using reported first-dose vaccination counts from the Centers for Disease Control (CDC). Neither classic nor spatial MRP models performed well, highlighting: spatial MRP may be most appropriate for richer data contexts, some demographics in the survey data are over-sampled and -aggregated, producing model over-smoothing, and a need for survey producers to share user-representative metrics that allow better benchmarking of estimates.
-
•
Bayesian spatial statistics
-
•
indirect estimation
-
•
multilevel regression and poststratification
-
•
survey methods
1 Introduction
Multi-level regression and poststratification (Gelman and Little, 1997; Little, 1993; Park et al., 2004; Wang et al., 2015; Valliant, 2020) (“classic MRP”) is a computationally efficient indirect estimation method. It is used to smooth and adjust for non-representativeness in survey samples, and can also be used as a small area estimation (SAE) method to produce subnational areal estimates where there are limited or no specific survey data available (Lopez-Martin et al., 2022). It uses partial pooling to make predictions of unknown area-level estimates using total subpopulation trends (Bafumi and Gelman, 2006), irrespective of the spatial relationships of subnational areal units. This may be concerning because many population health outcomes of interest, including disease spread or vaccination uptake, are known to have spatial structure (clear relationships across geographic space) (Waller and Carlin, 2010). Including spatial structure in the model can improve precision, though excluding space does not necessarily lead to bias. Yet, it also is well-known that health outcomes often have demographic structure and subpopulations from neighbouring places may share similarities in health and health behaviour (for example, see: Diez Roux, 2001; Diez Roux et al., 2001).
Recently, Gao et al. (2021) proposed a “spatial MRP” in which they include in the classic MRP model a spatial random effect on area-level administrative units that defines its structural relationship through a first-order spatial contiguity (neighbourhood) matrix and employs a modified Besag-York-Mollié (BYM2) model (Riebler et al., 2016; Morris et al., 2019). In silico, this was found to reduce absolute bias among most area-level population count estimates in a model including demographics (i.e., education and race/ethnicity) by approximately ten percent in comparison to classic MRP. While simulation experiments have demonstrated the efficacy of spatial MRP, it has not been established in the demography, survey, and social science literature as to when it can be reliably employed for improved SAE and when other methods should be considered.
Typically, spatial Bayesian methods have required computationally demanding Markov Chain Monte Carlo (MCMC) approaches that are slow to implement, especially for spatial models which are by their nature extremely complex. Now, advancements in computation using integrated nested Laplace approximations (INLA) implemented through the r-INLA package (see: www.r-inla.org, Simpson et al., 2017) allow us to approximate Bayesian inference for complex hierarchical models with and without spatial smoothing, produce estimates, and report uncertainty extremely quickly and conveniently without MCMC. In this article, we compare classic MRP and spatial MRP – in which we include a BYM2 spatial term that smooths along or within demographic categories and between areas – using INLA, and a large, unrepresentative survey: the Delphi Group at Carnegie Mellon University’s United States-specific COVID-19 Trends and Impact Survey (CTIS), administered in partnership with Facebook (Salomon et al., 2021). The CTIS provides an exciting opportunity to test spatial MRP with real-world data: Bradley et al. (2021) have shown that the CTIS overestimates state-level direct vaccination estimates by a substantial margin compared to baseline counts reported by the Centers for Disease Control and Prevention (CDC). We compare county- and aggregated state-level estimates with CDC baseline estimates, and discuss benefits and drawbacks of classic and spatial MRP, broadly.
This paper is laid out as follows: First, we discuss the specifics of the datasets used to model and validate the results (the CTIS and CDC estimates), including descriptive statistics contained in the CTIS sample. We also describe the poststratification data used (taken from US Census Bureau’s American Community survey), including the manner in which we harmonized these with the CTIS to allow for pooling. Second, we describe four Bayesian hierarchical models (two that do not account for spatial dependence, and two with spatial smoothing). We delineate the poststratification process, including the calculations used to arrive at an aggregate estimate of first-dose vaccination, and also briefly describe the spatial and non-spatial models we build and compare in our analysis. Third, we report the results of the comparison of the modelled estimates with CTIS direct survey estimates and the CDC baseline estimates at the county level, as well as county-level estimates aggregated to the state level. Finally, we discuss the implications of these results and summarize these in the conclusion.
2 Methods
This paper compares classic and spatial MRP methods by building several Bayesian hierarchical models using the United States’ specific version of the CTIS. The outcome of interest is the number of first-dose COVID-19 vaccinations as of June 30, 2021 in California counties. Demographic strata were harmonized between this survey and the poststratification data prior to modelling. To produce estimates, we modelled the probability of first-dose vaccination against COVID-19 as of June 30, 2021 at the county level by demographic strata (age and educational attainment) using the US-specific version of the CTIS. Male and female models were built separately. To produce population estimates from these, we poststratified using 2017-2021 5-year American Community Survey population estimates with the harmonized demographic strata. To assess performance, we compared model estimates, CDC reported counts, and CTIS direct survey estimates of first-dose vaccination as of June 30, 2021. Previous research suggests COVID-19 vaccine hesitancy in the US has been driven by differences in experiences of race/ethnicity, where members of historically marginalized groups were less likely to receive vaccines (e.g., Nguyen et al., 2022; Khubchandani and Macias, 2021; Willis et al., 2021). Though this trend initially held during the COVID-19 pandemic in California, there is evidence that by early 2021 COVID-19 vaccine trends were primarily driven by educational attainment: higher education was associated with greater likelihood of vaccination (Thomas et al., 2021). Trends in the CDC California first-dose vaccination estimates also suggest vaccination decisions varied by age, educational attainment, and county (race/ethnicity data were not provided) (Centers for Disease Control and Prevention, 2023a). In the absence of race/ethnicity baseline data, we focus on variables available in both the CTIS and CDC: sex, age, and educational attainment. Detailed descriptions of these data and methods, including the generalized modelling approach, are laid out below.
2.1 Data
2.1.1 US-specific CTIS
This paper employs a novel dataset collected by the Delphi Group at Carnegie Mellon University in partnership with Facebook to establish a large US COVID-19 Trends and Impact Survey (CTIS) (Salomon et al., 2021). The United States’ specific portion of the CTIS is an individual-level survey conducted from April 2020 to June 2022, and administered daily to approximately 40,000 residents of the United States (1-2% response rate; 10-20% completion rate). It includes respondents’ demographic and relative geographic information (e.g., ZIP codes and county FIPS codes). It focuses on respondents’ experiences and effects of the pandemic, including COVID-19-like symptoms, respondents’ behaviours (including mask-wearing and social distancing), and impacts on their mental health, economic situation, and overall health. Bradley et al. (2021) identified issues with the CTIS’ survey weights: for vaccination counts in California, they are non-representative at geographies smaller than state-level, providing an opportunity to test spatial MRP for county-level estimates using these data.
2.1.2 First-dose COVID-19 vaccination counts
First-dose vaccination counts recorded by the Centers for Disease Control (CDC) were taken as the baseline for comparison by age and sex for model validation at the state level (Centers for Disease Control and Prevention, 2023b). The CDC total first-dose vaccination counts were used for validation at the county-level (i.e., data at the county level were not available by sex and age and represent total population counts) (Centers for Disease Control and Prevention, 2023a). For this analysis, CTIS data were limited to California residents who began the survey in June 2021. This was done to obtain the same probability of receiving a first dose of COVID-19 vaccination as the CDC-reported first-dose vaccination counts in the state of California as of June 30, 2021; and also the same probability of said outcome within county-level total first-dose vaccination count data from the CDC on the same date. There were 49,700 individual CTIS respondents over the age of 18 years for whom information regarding receipt of first COVID-19 vaccination dose, sex, age, educational attainment, and county FIPS code were available; 57 of a total 58 counties were represented in these data.
2.1.3 Descriptive statistics of CTIS and poststratification weights
Descriptive statistics for the CTIS data are reported in Table 1 (by age and sex; see below) and Table LABEL:tab:ctis_direct_agesexedu (by age, sex, and educational attainment; see: Appendix). CDC-reported first-dose vaccination counts for the state of California as of June 30, 2021 by sex and age are reported in Table 5 (for this and the total first-dose vaccination counts at the county level, Table LABEL:tab:cdc_counts_bysexage_county, see the Appendix).
| Sex | Age | Mean | 95% Confidence Interval |
| Female | 18-24 years | 0.540 | (0.509, 0.570) |
| 25-64 years | 0.526 | (0.521, 0.532) | |
| 65 years and over | 0.550 | (0.533, 0.566) | |
| Male | 18-24 years | 0.460 | (0.430, 0.491) |
| 25-64 years | 0.474 | (0.468, 0.470) | |
| 65 years and over | 0.450 | (0.434, 0.467) |
Poststratification data were produced using the U.S. Census Bureau’s 2017-2021 5-year American Community Survey (ACS) estimates (U.S. Census Bureau, 2022) (Table B15001), representing estimated population counts by age, sex, and education at the county level. The demographic strata described in Tables 1 and LABEL:tab:ctis_direct_agesexedu were harmonized to match those in the poststratification data. As such, possible poststratification variables for California counties included sex (male, female), age (18-24 years, 25-64 years, 65 years and over), and educational attainment (less than high school, high school or equivalent, some college, associate’s degree, bachelor’s degree, professional or graduate degree). For simplicity, in this analysis zeroes in the ACS data were treated as “true” zeroes.
2.2 Modelling Approach: Spatial MRP
With adequate data, it would be possible to take the empirical proportion of the cross-classification of age and education by sex and first-dose vaccination status. In the absence of these ideal circumstances, we instead aim to model the number of people aged 18 years and older who had received their first COVID-19 vaccination (hereafter, “first-dose vaccination”) in each county in the state of California as of June 30, 2021. We can consider the outcome of interest in this context as a binary variable (having received first-dose vaccination, or not), where we are primarily interested in the proportion of a county’s total number of vaccinated individuals (these can later be aggregated to the state level for further comparison). Under these assumptions, it is natural to specify a binomial model (Park et al., 2004). In our models, we assign a Beta-binomial distribution to the outcome to handle within-strata variability between counties and attributed to the unrepresentative nature of the survey sample (see e.g., Dong and Wakefield, 2021). We describe several spatial and non-spatial Bayesian hierarchical models to estimate the posterior marginal probability of first-dose vaccination across several demographic groups by age, education, and sex (both sexes are modelled separately). An overview of all models produced in this analysis is provided in Table 2. Once the models are fit via r-INLA (Rue et al., 2009; Martins et al., 2013), we poststratify using the process also described in Section 2.2.4.
2.2.1 Model notation
Define as the population in age stratum (1 = 18-24 years, 2 = 25-64 years, and 3 = 65 years and over; the reason for the limited number of strata is described below in Data), and educational attainment stratum (henceforth, “education stratum”) (where 1 = less than high school, 2 = high school or equivalent, 3 = some college, 4 = associate’s degree, 5 = bachelor’s degree, and 6 = professional or graduate degree) within county . For both sexes, the total population in each county is , and the total population of California is . Let be the number of people who received a first-dose vaccination out of the total people in county , age stratum , and education stratum .
2.2.2 Hierarchical models without spatial dependence
In classic MRP, geographic variation is accounted for by modelling the outcome within each independent geographic area – e.g., by assuming counties are independent and identically distributed (IID). To reflect this, we specify a non-spatial hierarchical model with the intercept, fixed effects by age, , education, , and an IID random effect by county, ,
| (1) |
with the overdispersion parameter.
It is also possible to include smoothing across demographic strata. We can specify as a first-order random effect (RW1) by education, with a random walk model – a form of computationally convenient Gaussian Markov Random Field (GMRF) model (Rue and Held, 2005). In this case, a RW1 random effect smooths across the adjacent neighbors. We specify a hierarchical model,
| (2) |
with a fixed effect on age, and IID by county random effects . To include the intercept, , we include a sum-to-zero constraint for identifiability required by random walk models. We also use penalized complexity (PC) prior specifications for the hyperpriors (Simpson et al., 2017).
2.2.3 Spatial models
As vaccination trends are known to have varied across Californian counties according to CDC estimates, the outcome may have spatial dependence, and some level of measurable spatial autocorrelation (Banerjee, 2016). We describe two spatial models: one that smooths across counties with based solely on an adjacency matrix of first-order (immediately geographically proximate) neighbouring counties, and one that smooths across counties’ age groups within education strata.
It may be reasonable to expect subpopulations in neighbouring counties share some commonality with respect to vaccination uptake that has not been observed in the data (i.e., a BYM2 spatial random effect that smooths unobserved variance across neighbouring counties, , without it also explicitly smoothing across demographics). We may thus specify a spatial hierarchical model that includes a fixed effect for age (there are too few strata for a random effect), , RW1 by education, , and also shares variance between each neighbouring county using a BYM2 spatial random effect, :
| (3) |
with the intercept, and PC priors. As with random walk models, BYM models including BYM2 require a sum-to-zero constraint for identifiability to include the intercept, (Besag et al., 1991). This represents a classic spatial Bayesian hierarchical model that aims to shrink unobserved between-county variance.
Alternatively, it may be reasonable to expect subpopulations with similar demographics in neighbouring counties may share some commonality (variance) with respect to vaccination uptake observable across demographic strata. In this model, we smooth across counties within education group. Assuming individuals within the same education group from neighbouring counties share similar probabilities of first-dose vaccination, we specify a modified form of the Besag-York-Mollié (BYM) spatial random effect (Besag et al., 1991; Besag, 1974), a BYM2 (Riebler et al., 2016) spatial random effect that includes an IID random effect on county to smooth within and between counties across education, :
| (4) |
We include a fixed effect on age, , and use PC priors. This represents a complex spatial Bayesian hierarchical model that smooths between and within counties across education, whilst accounting for age.
2.2.4 Multilevel regression and poststratification
To attempt to adjust for the non-representativeness of the CTIS data, we produce marginal posterior estimates of first-dose vaccination using weights built from the marginal estimates of each demographic stratum (“level”) in each county, and also stratum-specific county population totals from census data. For each model, we sample one thousand draws of the marginal posterior probabilities of first-dose vaccination within each county , age , and educational attainment : where . From this, we can take the sample’s median and 95% credibility interval: .
The poststratification data are taken from the 5-year 2017-2021 ACS. These data represent the population counts for each demographic stratum by age ( 3 levels), and educational attainment ( 6 levels), for each county ( 58 counties): rows in the poststratification table for each sex (2,088 total). Using the poststratification data, we calculate a poststratification weight, i.e., the proportion of the total population for each sex in county , age , and education : . Estimates of the proportion of the population at the state level can then be calculated: . County-level population estimates are thus,
| (5) |
and can be aggregated to the state level: . Total population estimates are produced by summing the male and female estimates at the desired geographic level (county or state).
| Model Description | Age Specification* | Educational Attainment Specification* | County Specification* |
| fixed effect on age, fixed effect on education, IID by county | fixed | fixed | IID |
| fixed effect on age, RW1 by education, IID by county | fixed | RW1 | IID |
| fixed effect on age, BYM2 by education | fixed | BYM2 | IID(implicit) |
| fixed effect on age, RW1 by education, BYM2 by county | fixed | RW1 | BYM2 |
*Key: IID = independent and identically distributed; RW1 = first-order random walk; BYM2 = modified Besag-York-Mollié (BYM2)
** The BYM2 model has an implicit IID by area (in this case, county).
3 Results
In this section, we report the results of the Bayesian hierarchical models and state- and county-level aggregated poststratified estimates of first-dose COVID-19 vaccination in California as of June 30, 2021. Bayesian hierarchical regression results for each model are reported in Table LABEL:tab:inla_regression_results in the Appendix. Table LABEL:tab:lcporesults_bysex provides a summary of the model selection results using the mean logarithmic conditional predictive ordinate (LCPO) (Geisser, 1993; Gneiting and Raftery, 2007; Held et al., 2010). For both female and male models, there was an equal preference for both models without spatial dependence (i.e., those containing IID by county), as well as the fixed effect on age, RW1 by education, BYM2 by county models. A parsimonious approach to model selection would suggest the simplest model – fixed effects on age and education, IID by county – to be preferable for both sexes.
| Model Name | Sex | LCPO |
|---|---|---|
| fixed effect on age, fixed effect on education, IID by county | Female | 0.31 |
| fixed effect on age, RW1 by education, IID by county | Female | 0.31 |
| fixed effect on age, RW1 by education, BYM2 by county | Female | 0.31 |
| fixed effect on age, BYM2 by education | Female | 0.32 |
| fixed effect on age, fixed effect on education, IID by county | Male | 0.33 |
| fixed effect on age, RW1 by education, IID by county | Male | 0.33 |
| fixed effect on age, RW1 by education, BYM2 by county | Male | 0.33 |
| fixed effect on age, BYM2 by education | Male | 0.34 |
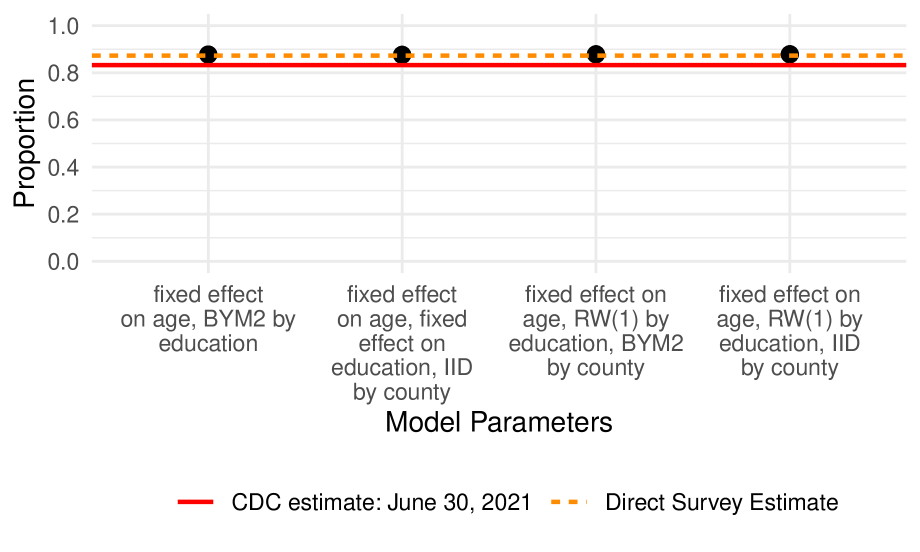
Results comparing modelled estimates aggregated from the county- to the state-level with CDC baseline estimates are visualized in Figure 1 and reported in Table LABEL:tab:state_propestimates in the Appendix. State-level aggregates for all four models captured the direct mean survey estimates produced from CTIS survey weights, but did not capture the CDC estimate for the proportion of individuals in California who had received the first-dose COVID-19 vaccination for June 30, 2021.
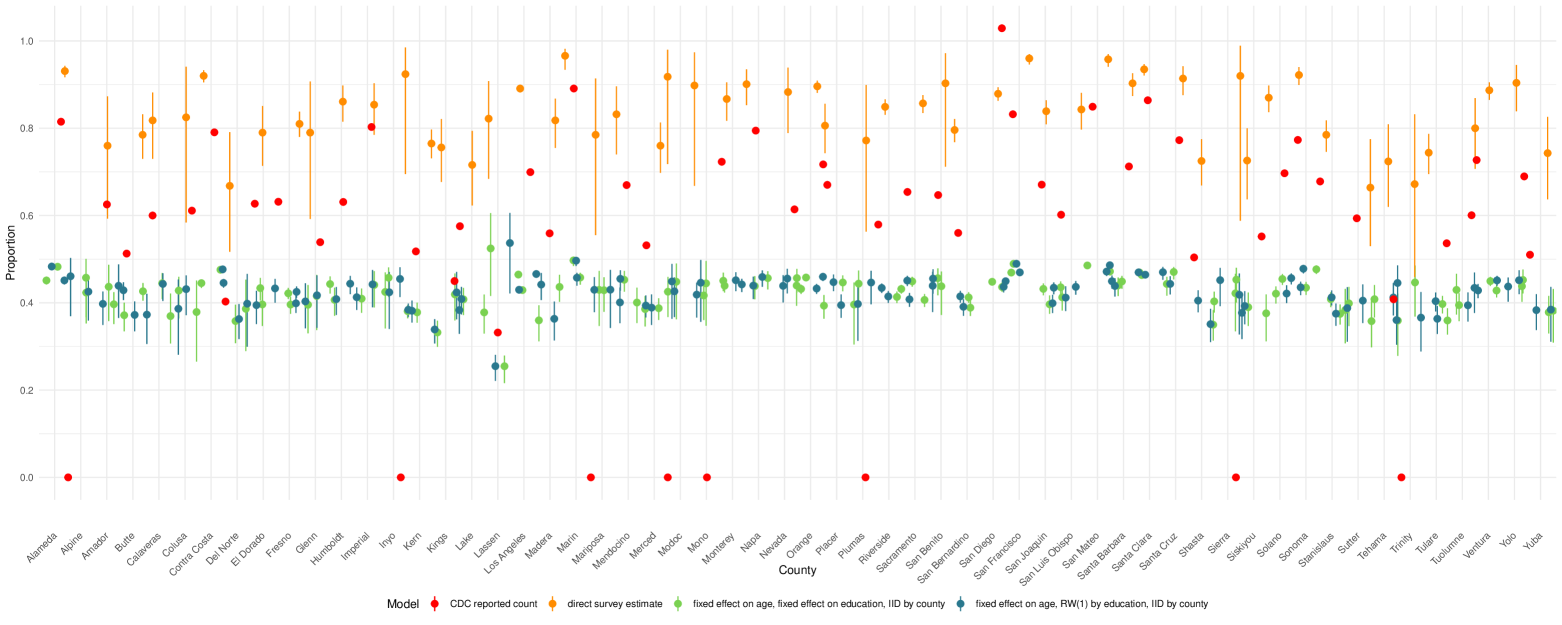
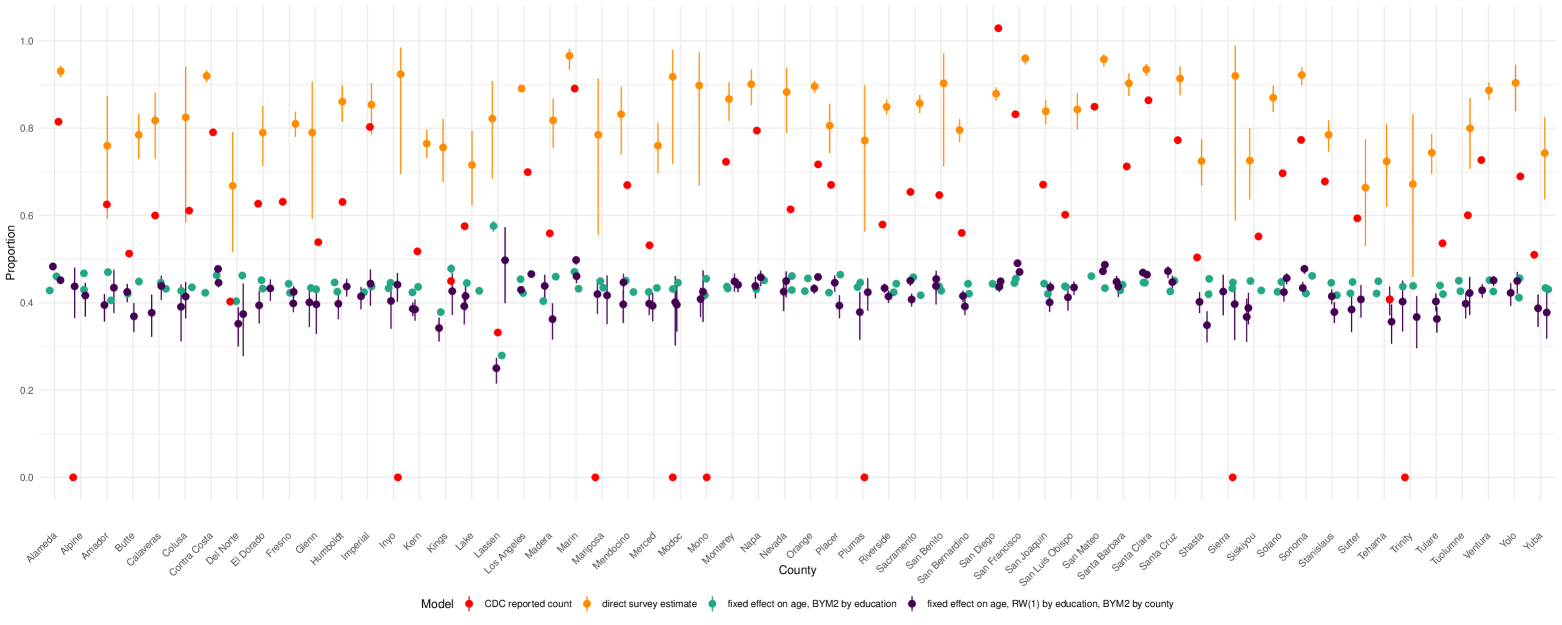
Results for the county-level estimates produced in this analysis are illustrated in Figure 2 and reported in Table LABEL:tab:county_propestimates in the Appendix. We recall the weights provided in the CTIS are known to be inappropriate for producing vaccination estimates below the state level. We use the county-level CDC estimates of first-dose vaccination for June 30, 2021 as the closest approximation of the truth with which to compare the validity of our modelled estimates. MRP estimates would be considered accurate if they captured CDC state-level estimates (and even more desirably, county-level estimates). In this case, spatial and classic MRP performed similarly and did not capture CDC estimates, tending to over-smooth estimates downward.
4 Discussion
MRP is a quick, computationally inexpensive, and relatively simple-to-implement indirect estimation method. Its ease and flexibility has made it increasingly popular. New advancements in statistical computation now allow us to implement both classic and spatial MRP pipelines for extremely complex Bayesian hierarchical models using INLA. We can now produce and visualize these estimates in minutes. From an implementation standpoint, this is extremely exciting.
As with any statistical method, MRP has limitations. In this analysis, we were unable to capture the “true” county-level estimates of first-dose vaccination provided by the CDC, though all four models contained state-level estimates produced by the direct mean survey weights. Unfortunately, MRP is a method that is only effective when its model accurately reflects the outcome of interest in the target population (Kennedy and Gelman, 2021). It will produce estimates for virtually all demographic strata across each geographic unit; it is up to us to validate these. In modelling situations, we make decisions based on expertise provided in the appropriate literature and also according to variables present in the available data. While MRP is able to make predictions for all observed and unobserved areas represented in the survey data used to train the model, the model will be unable to effectively capture the outcome of interest if there is inadequate population and contextual data available with which to predict and poststratify.
Here, we followed the classic MRP approach of only including covariates present in the data; these were limited because they had to match categorization definitions across data sources (i.e., same age ranges used for age bins, etc.). As previously noted, it has been suggested that COVID-19 vaccine hesitancy in California (and the US, more broadly) had been driven by lower likelihood of vaccination among members of groups historically marginalized according to race/ethnicity (e.g., Nguyen et al., 2022; Khubchandani and Macias, 2021; Willis et al., 2021), but by early 2021 COVID-19 vaccine trends in California were significantly driven by and positively associated with greater educational attainment (Thomas et al., 2021). As the CDC did not release a cross-tabulation of county vaccination counts by sex, age, race/ethnicity, and education, we could not predict the probability of these strata and reliably verify them. Modelling choices in MRP are necessarily based on strong assumptions with respect to demographic structures that underlie the outcome of interest in the target population. Excluding key structuring demographics from the model due to a lack of availability or granularity in the poststratification data suffuses the model with unintended but strong, perhaps even incorrect, assumptions. This was the case with this evaluation: first-dose vaccination estimates are likely to be strongly structured according to sex, age, educational attainment, but this analysis provides evidence that the demographics-specific outcome data represented in this survey sample do not capture important subpopulation vaccination trends. These models were also limited because CDC estimates were only available for very few age categories 18-24 years, 26-64 years, 65+ years).
Naturally, the question remains: how could we improve these models, and MRP estimation broadly? Kastellec et al. (2015) suggest expanding the poststratification table by using auxiliary survey data including area-level ecological/population characteristics with the aim of reducing the differences between the survey sample and target population. In our case, including race/ethnicity population proportions may improve vaccination estimates, but it remains that the validation data do not contain these details. As Kennedy and Gelman (2021) remind us, we must know our populations and models to produce generalizable results beyond our samples. To this end, another area of improvement is to try to improve the survey sample selection process. As the CTIS was administered through the Facebook platform, user activity drove sample selection, where more frequently active users were more likely to be selected. Therefore, the sample selection process contained an unavoidable temporal process, where in a daily random sample, more active users will of course be oversampled. In this case, the CTIS significantly oversampled individuals in an over-aggregated age category: aged 25-64 years. The problems inherent to this aggregation decision are difficult to overcome with MRP. It would also be beneficial to be provided better data with respect to survey weights. Companies like Facebook are producing large-scale datasets with relatively principled sampling schemes, but they do not provide the core marginals to accurately adjust the survey data they share. We encourage these companies to share their user-representative metrics so we can benchmark estimates to them.
Clearly, there are important limitations to using MRP in the current health and demographics data landscape. Indirect estimation methods are used when direct estimation methods are unavailable, such as in emergency response and planning situations. This is includes public health agencies’ needs with respect to tracking effects and aspects of COVID-19 response during the first years of the pandemic. Indirect estimation methods therefore have the potential to meet a critical need in times of crisis. Better demographics must be recorded and released to researchers to improve local- and state-level response and policy decisions. We must not only work to balance individual privacy concerns with data granularity, but also align demographic strata and geographic data choices in survey products with generalizable population data used in national census products, and also make them available to researchers.
4.1 Limitations
The CTIS itself has a few limitations and errors. The Delphi Group describe these on the CTIS website (Delphi Group, 2024). They acknowledge the survey weights are inappropriate for estimation below the state level. Additionally, between June 15 and July 4, 2021, a random 1% of the sample was sent the instrument for the previous wave (10) rather than that which was current at the time (wave 11). The Delphi Group claim to have not detected trend discontinuities as a result of the error, despite differences in the two instruments. Additionally, between June 17 and 24, 2021, users using an Android phone to access the Facebook application through which the survey was administered were unable to open the app due to a bug in the in-app web browser. The Delphi Group reported that they had recovered 89.5% of the initial decrease in total response volume as of June 26, 2021.
5 Conclusion
MRP is an increasingly popular tool used to adjust non-representative survey data to reflect the target population (Gao et al., 2021). Many population health outcomes of interest, including vaccination uptake, are known to have both demographic and spatial structure. Both classic and spatial MRP can now be implemented within a Bayesian framework and in a computationally efficient manner using INLA, avoiding MCMC. In this analysis, though model selection preferred both classic and spatial MRP models, these were unable to produce reliable estimates of first-dose vaccination in California for June 30, 2021, in comparison to CDC reported estimates of the same. Data aggregation choices on the part of the CTIS and Facebook are partially the issue. Clearly, further research is necessary to delineate the utility of spatial MRP. We suggest analyses using MRP be undertaken with care, and must use appropriate validation such as would be possible if, for instance in this case, user-representative metrics were available to researchers.
6 Competing interests
No competing interest is declared.
7 Author contributions statement
A.S. and J.W. conceived the experiments. A.S. and Z.W.A. gained access to the data. A.S. cleaned the data, coded and implemented the experiments, completed analysis, and visualized the results. A.S. wrote the manuscript. A.S., Z.W.A., and J.W. reviewed the manuscript.
8 Acknowledgments
Partial support for this research came from a Shanahan Endowment Fellowship and a Eunice Kennedy Shriver National Institute of Child Health and Human Development training grant, T32 HD101442-01, and research infrastructure grant, P2C HD042828, to the Center for Studies in Demography & Ecology at the University of Washington. Additionally, partial support came from NSF Grant #BCS-2028160, and from ARO Award #W911NF-19-1-0407. This research is based on survey results from Carnegie Mellon University’s Delphi Group. We thank the Delphi Group for access to their data, and Facebook’s Data for Social Good Team for access to the accompanying user data and weights.
References
- Bafumi and Gelman [2006] J. Bafumi and A. E. Gelman. Fitting Multilevel Models When Predictors and Group Effects Correlate. In Annual Meeting of the Midwest Political Science Association, Chicago, 2006. Columbia Academic Commons. 10.7916/D87P953X.
- Banerjee [2016] S. Banerjee. Spatial Data Analysis. Annual Review of Public Health, 37:47–60, 2016. ISSN 1545-2093. 10.1146/annurev-publhealth-032315-021711.
- Besag [1974] J. Besag. Spatial Interaction and the Statistical Analysis of Lattice Systems. Journal of the Royal Statistical Society. Series B (Methodological), 36(2):192–236, 1974. ISSN 0035-9246.
- Besag et al. [1991] J. Besag, J. York, and A. Mollié. Bayesian image restoration, with two applications in spatial statistics. Annals of the Institute of Statistical Mathematics, 43(1):1–20, Mar. 1991. ISSN 1572-9052. 10.1007/BF00116466.
- Bradley et al. [2021] V. C. Bradley, S. Kuriwaki, M. Isakov, D. Sejdinovic, X.-L. Meng, and S. Flaxman. Unrepresentative big surveys significantly overestimated US vaccine uptake. Nature, 600(7890):695–700, Dec. 2021. ISSN 1476-4687. 10.1038/s41586-021-04198-4.
- Centers for Disease Control and Prevention [2023a] Centers for Disease Control and Prevention. COVID-19 Vaccinations in the United States, County. https://data.cdc.gov/Vaccinations/COVID-19-Vaccinations-in-the-United-States-County/8xkx-amqh/about_data, 2023a.
- Centers for Disease Control and Prevention [2023b] Centers for Disease Control and Prevention. COVID-19 Vaccination Age and Sex Trends in the United States, National and Jurisdictional. https://data.cdc.gov/Vaccinations/COVID-19-Vaccination-Age-and-Sex-Trends-in-the-Uni/5i5k-6cmh/about_data, 2023b.
- Delphi Group [2024] Delphi Group. Data and Sampling Errors, 2024.
- Diez Roux [2001] A. V. Diez Roux. Investigating Neighborhood and Area Effects on Health. American Journal of Public Health, 91(11):1783–1789, Nov. 2001. ISSN 0090-0036.
- Diez Roux et al. [2001] A. V. Diez Roux, S. S. Merkin, D. Arnett, L. Chambless, M. Massing, F. J. Nieto, P. Sorlie, M. Szklo, H. A. Tyroler, and R. L. Watson. Neighborhood of Residence and Incidence of Coronary Heart Disease. New England Journal of Medicine, 345(2):99–106, July 2001. ISSN 0028-4793. 10.1056/NEJM200107123450205.
- Dong and Wakefield [2021] T. Q. Dong and J. Wakefield. Modeling and presentation of vaccination coverage estimates using data from household surveys. Vaccine, 39(18):2584–2594, Apr. 2021. ISSN 1873-2518. 10.1016/j.vaccine.2021.03.007.
- Gao et al. [2021] Y. Gao, L. Kennedy, D. Simpson, and A. Gelman. Improving Multilevel Regression and Poststratification with Structured Priors. Bayesian Analysis, 16(3):719–744, Sept. 2021. ISSN 1936-0975, 1931-6690. 10.1214/20-BA1223.
- Geisser [1993] S. Geisser. Predictive Inference: An Introduction. Chapman & Hall, Inc., 1993.
- Gelman and Little [1997] A. Gelman and T. C. Little. Poststratification into many categories using hierarchical logistic regression. Survey Methodology, 23(2):127–135, 1997.
- Gneiting and Raftery [2007] T. Gneiting and A. E. Raftery. Strictly Proper Scoring Rules, Prediction, and Estimation. Journal of the American Statistical Association, 102(477):359–378, Mar. 2007. ISSN 0162-1459. 10.1198/016214506000001437.
- Held et al. [2010] L. Held, B. Schrödle, and H. Rue. Posterior and Cross-validatory Predictive Checks: A Comparison of MCMC and INLA. In T. Kneib and G. Tutz, editors, Statistical Modelling and Regression Structures: Festschrift in Honour of Ludwig Fahrmeir, pages 91–110. Physica-Verlag HD, Heidelberg, 2010. ISBN 978-3-7908-2413-1. 10.1007/978-3-7908-2413-1_6.
- Kastellec et al. [2015] J. P. Kastellec, J. R. Lax, M. Malecki, and J. H. Phillips. Polarizing the Electoral Connection: Partisan Representation in Supreme Court Confirmation Politics. The Journal of Politics, 77(3):787–804, July 2015. ISSN 0022-3816. 10.1086/681261.
- Kennedy and Gelman [2021] L. Kennedy and A. Gelman. Know your population and know your model: Using model-based regression and poststratification to generalize findings beyond the observed sample. Psychological Methods, 26(5):547–558, 2021. ISSN 1939-1463. 10.1037/met0000362.
- Khubchandani and Macias [2021] J. Khubchandani and Y. Macias. COVID-19 vaccination hesitancy in Hispanics and African-Americans: A review and recommendations for practice. Brain, Behavior, & Immunity - Health, 15:100277, Aug. 2021. ISSN 2666-3546. 10.1016/j.bbih.2021.100277.
- Little [1993] R. J. A. Little. Post-Stratification: A Modeler’s Perspective. Journal of the American Statistical Association, 88(423):1001–1012, Sept. 1993. ISSN 0162-1459. 10.1080/01621459.1993.10476368.
- Lopez-Martin et al. [2022] J. Lopez-Martin, J. H. Phillips, and A. Gelman. Multilevel Regression and Poststratification Case Studies. https://bookdown.org/jl5522/MRP-case-studies/, May 2022.
- Martins et al. [2013] T. G. Martins, D. Simpson, F. Lindgren, and H. Rue. Bayesian computing with INLA: New features, Feb. 2013.
- Morris et al. [2019] M. Morris, K. Wheeler-Martin, D. Simpson, S. J. Mooney, A. Gelman, and C. DiMaggio. Bayesian hierarchical spatial models: Implementing the Besag York Mollié model in stan. Spatial and Spatio-Temporal Epidemiology, 31:100301, Nov. 2019. ISSN 1877-5853. 10.1016/j.sste.2019.100301.
- Nguyen et al. [2022] L. H. Nguyen, A. D. Joshi, D. A. Drew, J. Merino, W. Ma, C.-H. Lo, S. Kwon, K. Wang, M. S. Graham, L. Polidori, C. Menni, C. H. Sudre, A. Anyane-Yeboa, C. M. Astley, E. T. Warner, C. Y. Hu, S. Selvachandran, R. Davies, D. Nash, P. W. Franks, J. Wolf, S. Ourselin, C. J. Steves, T. D. Spector, and A. T. Chan. Self-reported COVID-19 vaccine hesitancy and uptake among participants from different racial and ethnic groups in the United States and United Kingdom. Nature Communications, 13(1):636, Feb. 2022. ISSN 2041-1723. 10.1038/s41467-022-28200-3.
- Park et al. [2004] D. K. Park, A. Gelman, and J. Bafumi. Bayesian Multilevel Estimation with Poststratification: State-Level Estimates from National Polls. Political Analysis, 12(4):375–385, 2004. ISSN 1047-1987, 1476-4989. 10.1093/pan/mph024.
- Riebler et al. [2016] A. Riebler, S. H. Sørbye, D. Simpson, and H. Rue. An intuitive Bayesian spatial model for disease mapping that accounts for scaling. Statistical Methods in Medical Research, 25(4):1145–1165, Aug. 2016. ISSN 1477-0334. 10.1177/0962280216660421.
- Rue and Held [2005] H. Rue and L. Held. Gaussian Markov Random Fields: Theory and Applications. Chapman and Hall/CRC, New York, Feb. 2005. ISBN 978-0-429-20882-9. 10.1201/9780203492024.
- Rue et al. [2009] H. Rue, S. Martino, and N. Chopin. Approximate Bayesian inference for latent Gaussian models by using integrated nested Laplace approximations. Journal of the Royal Statistical Society: Series B (Statistical Methodology), 71(2):319–392, 2009. ISSN 1467-9868. 10.1111/j.1467-9868.2008.00700.x.
- Salomon et al. [2021] J. A. Salomon, A. Reinhart, A. Bilinski, E. J. Chua, W. La Motte-Kerr, M. M. Rönn, M. B. Reitsma, K. A. Morris, S. LaRocca, T. H. Farag, F. Kreuter, R. Rosenfeld, and R. J. Tibshirani. The US COVID-19 Trends and Impact Survey: Continuous real-time measurement of COVID-19 symptoms, risks, protective behaviors, testing, and vaccination. Proceedings of the National Academy of Sciences of the United States of America, 118(51):e2111454118, Dec. 2021. ISSN 1091-6490. 10.1073/pnas.2111454118.
- Simpson et al. [2017] D. Simpson, H. Rue, A. Riebler, T. G. Martins, and S. H. Sørbye. Penalising Model Component Complexity: A Principled, Practical Approach to Constructing Priors. Statistical Science, 32(1):1–28, Feb. 2017. ISSN 0883-4237, 2168-8745. 10.1214/16-STS576.
- Thomas et al. [2021] K. Thomas, J. Darling, and A. Cassil. COVID-19 Vaccine Hesitancy: Education Divide Widens. Technical Report 2, USC Dornsife Center for Economic and Social Research, Feb. 2021.
- U.S. Census Bureau [2022] U.S. Census Bureau. American Community Survey 5-year Sample, 2018-2022. Technical report, U.S. Census Bureau, 2022.
- Valliant [2020] R. Valliant. Comparing Alternatives for Estimation from Nonprobability Samples. Journal of Survey Statistics and Methodology, 8(2):231–263, Apr. 2020. ISSN 2325-0984. 10.1093/jssam/smz003.
- Waller and Carlin [2010] L. A. Waller and B. P. Carlin. Disease mapping. Chapman & Hall/CRC handbooks of modern statistical methods, 2010:217–243, 2010. 10.1201/9781420072884-c14.
- Wang et al. [2015] W. Wang, D. Rothschild, S. Goel, and A. Gelman. Forecasting elections with non-representative polls. International Journal of Forecasting, 31(3):980–991, July 2015. ISSN 0169-2070. 10.1016/j.ijforecast.2014.06.001.
- Willis et al. [2021] D. E. Willis, J. A. Andersen, K. Bryant-Moore, J. P. Selig, C. R. Long, H. C. Felix, G. M. Curran, and P. A. McElfish. COVID-19 vaccine hesitancy: Race/ethnicity, trust, and fear. Clinical and Translational Science, 14(6):2200–2207, Nov. 2021. ISSN 1752-8054. 10.1111/cts.13077.
9 Appendix
| Vaccination Status | Age | Sex | Education Level | Mean | 95% Confidence Interval |
|---|---|---|---|---|---|
| No | 18-24 years | Female | Less than high school | 0.069 | 0.029, 0.109 |
| No | 18-24 years | Female | High school or equivalent | 0.394 | 0.318, 0.469 |
| No | 18-24 years | Female | Some college | 0.374 | 0.300, 0.448 |
| No | 18-24 years | Female | Associate’s degree | 0.078 | 0.037, 0.119 |
| No | 18-24 years | Female | Bachelor’s degree | 0.068 | 0.029, 0.107 |
| No | 18-24 years | Female | Professional or graduate degree | 0.018 | -0.003, 0.038 |
| No | 18-24 years | Male | Less than high school | 0.093 | 0.032, 0.154 |
| No | 18-24 years | Male | High school or equivalent | 0.464 | 0.350, 0.578 |
| No | 18-24 years | Male | Some college | 0.306 | 0.203, 0.409 |
| No | 18-24 years | Male | Associate’s degree | 0.051 | 0.006, 0.097 |
| No | 18-24 years | Male | Bachelor’s degree | 0.058 | 0.011, 0.106 |
| No | 18-24 years | Male | Professional or graduate degree | 0.028 | -0.010, 0.066 |
| No | 25-64 years | Female | Less than high school | 0.079 | 0.068, 0.090 |
| No | 25-64 years | Female | High school or equivalent | 0.214 | 0.197, 0.231 |
| No | 25-64 years | Female | Some college | 0.326 | 0.307, 0.345 |
| No | 25-64 years | Female | Associate’s degree | 0.143 | 0.128, 0.157 |
| No | 25-64 years | Female | Bachelor’s degree | 0.156 | 0.141, 0.170 |
| No | 25-64 years | Female | Professional or graduate degree | 0.083 | 0.072, 0.093 |
| No | 25-64 years | Male | Less than high school | 0.097 | 0.081, 0.114 |
| No | 25-64 years | Male | High school or equivalent | 0.225 | 0.203, 0.247 |
| No | 25-64 years | Male | Some college | 0.308 | 0.284, 0.333 |
| No | 25-64 years | Male | Associate’s degree | 0.099 | 0.084, 0.114 |
| No | 25-64 years | Male | Bachelor’s degree | 0.174 | 0.155, 0.193 |
| No | 25-64 years | Male | Professional or graduate degree | 0.096 | 0.082, 0.111 |
| No | 65 years and over | Female | Less than high school | 0.031 | 0.004, 0.059 |
| No | 65 years and over | Female | High school or equivalent | 0.183 | 0.119, 0.248 |
| No | 65 years and over | Female | Some college | 0.334 | 0.255, 0.414 |
| No | 65 years and over | Female | Associate’s degree | 0.145 | 0.089, 0.200 |
| No | 65 years and over | Female | Bachelor’s degree | 0.115 | 0.055, 0.175 |
| No | 65 years and over | Female | Professional or graduate degree | 0.191 | 0.125, 0.258 |
| No | 65 years and over | Male | Less than high school | 0.015 | -0.006, 0.037 |
| No | 65 years and over | Male | High school or equivalent | 0.100 | 0.042, 0.159 |
| No | 65 years and over | Male | Some college | 0.308 | 0.187, 0.429 |
| No | 65 years and over | Male | Associate’s degree | 0.089 | 0.036, 0.141 |
| No | 65 years and over | Male | Bachelor’s degree | 0.181 | 0.107, 0.255 |
| No | 65 years and over | Male | Professional or graduate degree | 0.307 | 0.153, 0.461 |
| Yes | 18-24 years | Female | Less than high school | 0.028 | 0.016, 0.040 |
| Yes | 18-24 years | Female | High school or equivalent | 0.243 | 0.212, 0.275 |
| Yes | 18-24 years | Female | Some college | 0.367 | 0.332, 0.402 |
| Yes | 18-24 years | Female | Associate’s degree | 0.094 | 0.073, 0.116 |
| Yes | 18-24 years | Female | Bachelor’s degree | 0.239 | 0.209, 0.269 |
| Yes | 18-24 years | Female | Professional or graduate degree | 0.029 | 0.016, 0.041 |
| Yes | 18-24 years | Male | Less than high school | 0.019 | 0.004, 0.034 |
| Yes | 18-24 years | Male | High school or equivalent | 0.275 | 0.223, 0.328 |
| Yes | 18-24 years | Male | Some college | 0.349 | 0.292, 0.406 |
| Yes | 18-24 years | Male | Associate’s degree | 0.087 | 0.053, 0.121 |
| Yes | 18-24 years | Male | Bachelor’s degree | 0.244 | 0.194, 0.295 |
| Yes | 18-24 years | Male | Professional or graduate degree | 0.025 | 0.010, 0.040 |
| Yes | 25-64 years | Female | Less than high school | 0.072 | 0.068, 0.075 |
| Yes | 25-64 years | Female | High school or equivalent | 0.139 | 0.135, 0.144 |
| Yes | 25-64 years | Female | Some college | 0.244 | 0.238, 0.250 |
| Yes | 25-64 years | Female | Associate’s degree | 0.111 | 0.106, 0.115 |
| Yes | 25-64 years | Female | Bachelor’s degree | 0.244 | 0.239, 0.250 |
| Yes | 25-64 years | Female | Professional or graduate degree | 0.190 | 0.185, 0.195 |
| Yes | 25-64 years | Male | Less than high school | 0.077 | 0.072, 0.083 |
| Yes | 25-64 years | Male | High school or equivalent | 0.143 | 0.136, 0.150 |
| Yes | 25-64 years | Male | Some college | 0.232 | 0.224, 0.239 |
| Yes | 25-64 years | Male | Associate’s degree | 0.086 | 0.081, 0.091 |
| Yes | 25-64 years | Male | Bachelor’s degree | 0.264 | 0.256, 0.272 |
| Yes | 25-64 years | Male | Professional or graduate degree | 0.198 | 0.191, 0.205 |
| Yes | 65 years and over | Female | Less than high school | 0.024 | 0.017, 0.030 |
| Yes | 65 years and over | Female | High school or equivalent | 0.118 | 0.106, 0.131 |
| Yes | 65 years and over | Female | Some college | 0.300 | 0.282, 0.319 |
| Yes | 65 years and over | Female | Associate’s degree | 0.126 | 0.113, 0.139 |
| Yes | 65 years and over | Female | Bachelor’s degree | 0.228 | 0.211, 0.245 |
| Yes | 65 years and over | Female | Professional or graduate degree | 0.204 | 0.187, 0.220 |
| Yes | 65 years and over | Male | Less than high school | 0.027 | 0.015, 0.039 |
| Yes | 65 years and over | Male | High school or equivalent | 0.088 | 0.072, 0.104 |
| Yes | 65 years and over | Male | Some college | 0.208 | 0.186, 0.230 |
| Yes | 65 years and over | Male | Associate’s degree | 0.103 | 0.086, 0.120 |
| Yes | 65 years and over | Male | Bachelor’s degree | 0.271 | 0.246, 0.295 |
| Yes | 65 years and over | Male | Professional or graduate degree | 0.303 | 0.278, 0.327 |
| Total | Sex | Age Group | Estimate | Proportion of Subpopulation |
| 25,296,329 | ||||
| Female | 18-24 years | 1,112,672 | 0.037 | |
| Female | 25-49 years | 7,610,234 | 0.250 | |
| Female | 65+ years | 4,480,140 | 0.147 | |
| Male | 18-24 years | 1,044,329 | 0.034 | |
| Male | 25-49 years | 7,253,978 | 0.239 | |
| Male | 65+ years | 3,794,976 | 0.125 |
| County | Administered First Doses | County Population | Proportion with First Dose |
|---|---|---|---|
| Kern | 328433 | 634299 | 0.518 |
| Calaveras | 22930 | 38210 | 0.600 |
| San Mateo | 517120 | 608854 | 0.849 |
| Alameda | 1075757 | 1319993 | 0.815 |
| Lassen | 8517 | 25663 | 0.332 |
| Santa Barbara | 246398 | 345856 | 0.712 |
| Marin | 184868 | 207467 | 0.891 |
| Shasta | 70861 | 140599 | 0.504 |
| Fresno | 447645 | 708813 | 0.632 |
| San Bernardino | 891558 | 1591687 | 0.560 |
| Amador | 20677 | 33061 | 0.625 |
| San Diego | 2681747 | 2605720 | 1.029 |
| Madera | 63270 | 113144 | 0.559 |
| Santa Clara | 1298175 | 1502391 | 0.864 |
| Nevada | 50614 | 82417 | 0.614 |
| Colusa | 9552 | 15628 | 0.611 |
| Del Norte | 8738 | 21689 | 0.403 |
| Merced | 102591 | 192932 | 0.532 |
| Glenn | 11085 | 20569 | 0.539 |
| Tulare | 172279 | 321178 | 0.536 |
| Lake | 29208 | 50748 | 0.576 |
| Monterey | 231150 | 319627 | 0.723 |
| Mendocino | 45891 | 68518 | 0.670 |
| Inyo | 0 | 14208 | 0.000 |
| Placer | 204216 | 304683 | 0.670 |
| Solano | 241047 | 345913 | 0.697 |
| Ventura | 473866 | 651752 | 0.727 |
| Plumas | 0 | 15672 | 0.000 |
| Sutter | 42348 | 71336 | 0.594 |
| Los Angeles | 5498966 | 7862123 | 0.699 |
| El Dorado | 95587 | 152434 | 0.627 |
| Imperial | 103417 | 128808 | 0.803 |
| Trinity | 0 | 10380 | 0.000 |
| Butte | 91529 | 178479 | 0.513 |
| Yuba | 28655 | 56169 | 0.510 |
| Napa | 87419 | 110017 | 0.795 |
| Sacramento | 767893 | 1174096 | 0.654 |
| Santa Cruz | 170671 | 220884 | 0.773 |
| San Francisco | 630235 | 757421 | 0.832 |
| Riverside | 1056673 | 1824041 | 0.579 |
| Mariposa | 0 | 14475 | 0.000 |
| Sonoma | 308660 | 399200 | 0.773 |
| Yolo | 119167 | 172797 | 0.690 |
| Orange | 1773308 | 2472630 | 0.717 |
| San Benito | 29566 | 45703 | 0.647 |
| Alpine | 0 | 907 | 0.000 |
| Stanislaus | 269919 | 398058 | 0.678 |
| San Luis Obispo | 139967 | 232568 | 0.602 |
| Humboldt | 69519 | 110156 | 0.631 |
| Kings | 49559 | 110167 | 0.450 |
| Sierra | 0 | 2454 | 0.000 |
| Tehama | 19935 | 48847 | 0.408 |
| Tuolumne | 27125 | 45161 | 0.601 |
| Siskiyou | 19164 | 34716 | 0.552 |
| Modoc | 0 | 7110 | 0.000 |
| Mono | 0 | 11412 | 0.000 |
| San Joaquin | 367555 | 547945 | 0.671 |
| Contra Costa | 701761 | 887597 | 0.791 |
| Mendocino | 44597 | 68518 | 0.651 |
| Mariposa | 0 | 14475 | 0.000 |
| Santa Clara | 1260555 | 1502391 | 0.839 |
| Siskiyou | 18701 | 34716 | 0.539 |
| Calaveras | 22254 | 38210 | 0.582 |
| Yuba | 26748 | 56169 | 0.476 |
| San Diego | 2572100 | 2605720 | 0.987 |
| Sutter | 40588 | 71336 | 0.569 |
| Butte | 88864 | 178479 | 0.498 |
| Kings | 46799 | 110167 | 0.425 |
| Alpine | 0 | 907 | 0.000 |
| Marin | 181406 | 207467 | 0.874 |
| Plumas | 0 | 15672 | 0.000 |
| Madera | 61325 | 113144 | 0.542 |
| Amador | 19870 | 33061 | 0.601 |
| El Dorado | 90880 | 152434 | 0.596 |
| Colusa | 9238 | 15628 | 0.591 |
| Mono | 0 | 11412 | 0.000 |
| San Benito | 28370 | 45703 | 0.621 |
| Lake | 28252 | 50748 | 0.557 |
| Alameda | 1045026 | 1319993 | 0.792 |
| Sacramento | 736494 | 1174096 | 0.627 |
| Riverside | 1015351 | 1824041 | 0.557 |
| Merced | 97593 | 192932 | 0.506 |
| Napa | 85240 | 110017 | 0.775 |
| Tehama | 19214 | 48847 | 0.393 |
| San Luis Obispo | 135650 | 232568 | 0.583 |
| Del Norte | 8442 | 21689 | 0.389 |
| Fresno | 431573 | 708813 | 0.609 |
| San Joaquin | 350563 | 547945 | 0.640 |
| Monterey | 222005 | 319627 | 0.695 |
| Tulare | 165932 | 321178 | 0.517 |
| Sierra | 0 | 2454 | 0.000 |
| Contra Costa | 683958 | 887597 | 0.771 |
| Yolo | 115956 | 172797 | 0.671 |
| Los Angeles | 5281948 | 7862123 | 0.672 |
| Lassen | 8285 | 25663 | 0.323 |
| Sonoma | 299561 | 399200 | 0.750 |
| Tuolumne | 26448 | 45161 | 0.586 |
| Nevada | 48581 | 82417 | 0.589 |
| Solano | 231111 | 345913 | 0.668 |
| Ventura | 458167 | 651752 | 0.703 |
| San Mateo | 502751 | 608854 | 0.826 |
| Glenn | 10699 | 20569 | 0.520 |
| Inyo | 0 | 14208 | 0.000 |
| Modoc | 0 | 7110 | 0.000 |
| Kern | 314492 | 634299 | 0.496 |
| Santa Cruz | 166130 | 220884 | 0.752 |
| Humboldt | 67248 | 110156 | 0.610 |
| Trinity | 0 | 10380 | 0.000 |
| Imperial | 96461 | 128808 | 0.749 |
| Placer | 197873 | 304683 | 0.649 |
| Santa Barbara | 238242 | 345856 | 0.689 |
| Stanislaus | 260886 | 398058 | 0.655 |
| San Bernardino | 852107 | 1591687 | 0.535 |
| Orange | 1713456 | 2472630 | 0.693 |
| San Francisco | 612116 | 757421 | 0.808 |
| Shasta | 68532 | 140599 | 0.487 |
| Type | Model Name | Sex | DIC | Mean | SD | 0.025quant | 0.5quant | 0.975quant | mode | KLD |
|---|---|---|---|---|---|---|---|---|---|---|
| Spatial | fixed effect on age, BYM2 by education | female | 0.955 | 0.954 | 0.526 | 1.385 | 0.216 | 0.0000001406 | ||
| Spatial | fixed effect on age, BYM2 by education | female | 0.598 | 0.598 | 0.487 | 0.71 | 0.057 | 0.0000000001 | ||
| Spatial | fixed effect on age, BYM2 by education | female | -0.224 | -0.223 | -0.614 | 0.161 | 0.193 | 0.0000013268 | ||
| Spatial | fixed effect on age, BYM2 by education | female | -0.44 | -0.439 | -0.817 | -0.066 | 0.186 | 0.0000024973 | ||
| Spatial | fixed effect on age, BYM2 by education | female | -0.294 | -0.294 | -0.669 | 0.079 | 0.185 | 0.0000027593 | ||
| Spatial | fixed effect on age, BYM2 by education | female | -0.201 | -0.2 | -0.582 | 0.177 | 0.188 | 0.0000020244 | ||
| Spatial | fixed effect on age, BYM2 by education | female | 0.464 | 0.463 | 0.088 | 0.842 | 0.187 | 0.0000023413 | ||
| Spatial | fixed effect on age, BYM2 by education | female | 0.74 | 0.739 | 0.363 | 1.127 | 0.19 | 0.0000018705 | ||
| Spatial | fixed effect on age, BYM2 by education | female | -0.049 | -0.051 | -0.952 | 0.866 | 0.45 | 0.0000026657 | ||
| Spatial | fixed effect on age, BYM2 by education | female | 0.039 | 0.041 | -0.874 | 0.94 | 0.449 | 0.0000024821 | ||
| Spatial | fixed effect on age, BYM2 by education | female | 0.072 | 0.076 | -0.851 | 0.974 | 0.453 | 0.0000021595 | ||
| Spatial | fixed effect on age, BYM2 by education | female | -0.026 | -0.023 | -1.159 | 1.087 | 0.555 | 0.0000017765 | ||
| Spatial | fixed effect on age, BYM2 by education | female | -0.127 | -0.128 | -1.1 | 0.853 | 0.485 | 0.0000011911 | ||
| Spatial | fixed effect on age, BYM2 by education | female | -0.061 | -0.064 | -0.966 | 0.859 | 0.452 | 0.0000025672 | ||
| Spatial | fixed effect on age, BYM2 by education | female | 0.11 | 0.117 | -0.821 | 1.008 | 0.455 | 0.0000017938 | ||
| Spatial | fixed effect on age, BYM2 by education | female | 0.057 | 0.061 | -0.85 | 0.95 | 0.444 | 0.0000043364 | ||
| Spatial | fixed effect on age, BYM2 by education | female | -0.066 | -0.071 | -0.948 | 0.839 | 0.442 | 0.0000034521 | ||
| Spatial | fixed effect on age, BYM2 by education | female | -0.114 | -0.121 | -1.005 | 0.816 | 0.452 | 0.0000025634 | ||
| Spatial | fixed effect on age, BYM2 by education | female | -0.014 | -0.015 | -0.884 | 0.86 | 0.43 | 0.0000044649 | ||
| Spatial | fixed effect on age, BYM2 by education | female | 0.127 | 0.134 | -0.815 | 1.035 | 0.46 | 0.0000015937 | ||
| Spatial | fixed effect on age, BYM2 by education | female | -0.089 | -0.094 | -0.99 | 0.836 | 0.453 | 0.0000024983 | ||
| Spatial | fixed effect on age, BYM2 by education | female | 0.104 | 0.108 | -0.847 | 1.039 | 0.468 | 0.0000017453 | ||
| Spatial | fixed effect on age, BYM2 by education | female | -0.031 | -0.03 | -1.081 | 1.013 | 0.519 | 0.0000021668 | ||
| Spatial | fixed effect on age, BYM2 by education | female | -0.118 | -0.125 | -1.022 | 0.819 | 0.457 | 0.0000022471 | ||
| Spatial | fixed effect on age, BYM2 by education | female | 0.149 | 0.156 | -0.804 | 1.063 | 0.466 | 0.0000011957 | ||
| Spatial | fixed effect on age, BYM2 by education | female | -0.13 | -0.136 | -1.053 | 0.823 | 0.467 | 0.0000018123 | ||
| Spatial | fixed effect on age, BYM2 by education | female | 0.09 | 0.098 | -0.823 | 0.968 | 0.444 | 0.0000025509 | ||
| Spatial | fixed effect on age, BYM2 by education | female | 0.111 | 0.114 | -0.841 | 1.046 | 0.469 | 0.0000012955 | ||
| Spatial | fixed effect on age, BYM2 by education | female | 0.139 | 0.151 | -0.79 | 1.009 | 0.448 | 0.0000022126 | ||
| Spatial | fixed effect on age, BYM2 by education | female | 0.078 | 0.083 | -0.844 | 0.976 | 0.451 | 0.0000022773 | ||
| Spatial | fixed effect on age, BYM2 by education | female | 0 | 0 | -0.957 | 0.957 | 0.474 | 0.0000014957 | ||
| Spatial | fixed effect on age, BYM2 by education | female | -0.118 | -0.126 | -1.015 | 0.815 | 0.455 | 0.0000024168 | ||
| Spatial | fixed effect on age, BYM2 by education | female | -0.119 | -0.12 | -1.085 | 0.856 | 0.482 | 0.0000012686 | ||
| Spatial | fixed effect on age, BYM2 by education | female | -0.126 | -0.118 | -1.234 | 0.944 | 0.539 | 0.0000008237 | ||
| Spatial | fixed effect on age, BYM2 by education | female | -0.063 | -0.065 | -0.991 | 0.874 | 0.462 | 0.0000020205 | ||
| Spatial | fixed effect on age, BYM2 by education | female | 0.099 | 0.102 | -0.849 | 1.028 | 0.466 | 0.0000023357 | ||
| Spatial | fixed effect on age, BYM2 by education | female | 0.091 | 0.093 | -0.859 | 1.03 | 0.469 | 0.0000013182 | ||
| Spatial | fixed effect on age, BYM2 by education | female | -0.08 | -0.08 | -1.058 | 0.898 | 0.485 | 0.0000012529 | ||
| Spatial | fixed effect on age, BYM2 by education | female | 0.045 | 0.049 | -0.856 | 0.928 | 0.441 | 0.0000030004 | ||
| Spatial | fixed effect on age, BYM2 by education | female | 0.02 | 0.019 | -0.91 | 0.95 | 0.46 | 0.0000036985 | ||
| Spatial | fixed effect on age, BYM2 by education | female | -0.074 | -0.08 | -0.954 | 0.831 | 0.442 | 0.0000034585 | ||
| Spatial | fixed effect on age, BYM2 by education | female | -0.021 | -0.021 | -1.022 | 0.982 | 0.497 | 0.0000026615 | ||
| Spatial | fixed effect on age, BYM2 by education | female | -0.13 | -0.136 | -1.063 | 0.828 | 0.471 | 0.0000016479 | ||
| Spatial | fixed effect on age, BYM2 by education | female | 0.017 | 0.019 | -0.881 | 0.908 | 0.442 | 0.0000030472 | ||
| Spatial | fixed effect on age, BYM2 by education | female | 0.018 | 0.018 | -0.954 | 0.991 | 0.482 | 0.0000023777 | ||
| Spatial | fixed effect on age, BYM2 by education | female | 0.106 | 0.114 | -0.819 | 0.996 | 0.451 | 0.0000021696 | ||
| Spatial | fixed effect on age, BYM2 by education | female | -0.112 | -0.121 | -0.995 | 0.811 | 0.448 | 0.0000028547 | ||
| Spatial | fixed effect on age, BYM2 by education | female | -0.101 | -0.103 | -1.056 | 0.862 | 0.476 | 0.0000014386 | ||
| Spatial | fixed effect on age, BYM2 by education | female | -0.09 | -0.096 | -0.976 | 0.827 | 0.447 | 0.0000030245 | ||
| Spatial | fixed effect on age, BYM2 by education | female | -0.125 | -0.123 | -1.14 | 0.881 | 0.502 | 0.0000009244 | ||
| Spatial | fixed effect on age, BYM2 by education | female | 0.014 | 0.014 | -0.908 | 0.931 | 0.455 | 0.0000022202 | ||
| Spatial | fixed effect on age, BYM2 by education | female | 0.012 | 0.012 | -0.935 | 0.962 | 0.47 | 0.0000030248 | ||
| Spatial | fixed effect on age, BYM2 by education | female | 0.066 | 0.071 | -0.847 | 0.958 | 0.447 | 0.0000024245 | ||
| Spatial | fixed effect on age, BYM2 by education | female | 0.096 | 0.101 | -0.834 | 1.001 | 0.455 | 0.0000024792 | ||
| Spatial | fixed effect on age, BYM2 by education | female | 0.044 | 0.045 | -0.897 | 0.978 | 0.465 | 0.0000016616 | ||
| Spatial | fixed effect on age, BYM2 by education | female | 0.144 | 0.148 | -0.821 | 1.088 | 0.476 | 0.0000009227 | ||
| Spatial | fixed effect on age, BYM2 by education | female | 0.125 | 0.132 | -0.82 | 1.04 | 0.463 | 0.0000018591 | ||
| Spatial | fixed effect on age, BYM2 by education | female | -0.124 | -0.124 | -1.11 | 0.863 | 0.49 | 0.0000010874 | ||
| Spatial | fixed effect on age, BYM2 by education | female | -0.037 | -0.039 | -0.938 | 0.872 | 0.448 | 0.0000028110 | ||
| Spatial | fixed effect on age, BYM2 by education | female | 0.121 | 0.129 | -0.812 | 1.015 | 0.455 | 0.0000017937 | ||
| Spatial | fixed effect on age, BYM2 by education | female | -0.132 | -0.193 | -2.285 | 2.245 | 1.122 | 0.0000002086 | ||
| Spatial | fixed effect on age, BYM2 by education | female | -0.634 | -0.688 | -2.193 | 1.169 | 0.849 | 0.0000002047 | ||
| Spatial | fixed effect on age, BYM2 by education | female | -0.477 | -0.513 | -1.996 | 1.207 | 0.803 | 0.0000001318 | ||
| Spatial | fixed effect on age, BYM2 by education | female | 0.004 | -0.048 | -1.997 | 2.186 | 1.041 | 0.0000001786 | ||
| Spatial | fixed effect on age, BYM2 by education | female | 0.626 | 0.669 | -1.076 | 2.133 | 0.817 | 0.0000001490 | ||
| Spatial | fixed effect on age, BYM2 by education | female | 0.878 | 0.93 | -1.077 | 2.577 | 0.942 | 0.0000002579 | ||
| Spatial | fixed effect on age, BYM2 by education | female | -0.204 | -0.206 | -1.863 | 1.468 | 0.849 | 0.0000000007 | ||
| Spatial | fixed effect on age, BYM2 by education | female | 0.144 | 0.145 | -1.473 | 1.758 | 0.824 | 0.0000000001 | ||
| Spatial | fixed effect on age, BYM2 by education | female | 0.275 | 0.277 | -1.376 | 1.917 | 0.84 | 0.0000000005 | ||
| Spatial | fixed effect on age, BYM2 by education | female | -0.056 | -0.068 | -3.243 | 3.196 | 1.636 | 0.0000000085 | ||
| Spatial | fixed effect on age, BYM2 by education | female | -0.512 | -0.525 | -2.658 | 1.706 | 1.111 | 0.0000000122 | ||
| Spatial | fixed effect on age, BYM2 by education | female | -0.252 | -0.256 | -1.941 | 1.457 | 0.866 | 0.0000000017 | ||
| Spatial | fixed effect on age, BYM2 by education | female | 0.426 | 0.43 | -1.224 | 2.054 | 0.836 | 0.0000000024 | ||
| Spatial | fixed effect on age, BYM2 by education | female | 0.257 | 0.262 | -1.488 | 1.972 | 0.875 | 0.0000000234 | ||
| Spatial | fixed effect on age, BYM2 by education | female | -0.273 | -0.279 | -1.814 | 1.3 | 0.793 | 0.0000000058 | ||
| Spatial | fixed effect on age, BYM2 by education | female | -0.46 | -0.476 | -2.132 | 1.298 | 0.872 | 0.0000000278 | ||
| Spatial | fixed effect on age, BYM2 by education | female | -0.066 | -0.066 | -1.375 | 1.244 | 0.667 | 0.0000000000 | ||
| Spatial | fixed effect on age, BYM2 by education | female | 0.498 | 0.507 | -1.263 | 2.211 | 0.886 | 0.0000000089 | ||
| Spatial | fixed effect on age, BYM2 by education | female | -0.364 | -0.372 | -2.062 | 1.38 | 0.876 | 0.0000000087 | ||
| Spatial | fixed effect on age, BYM2 by education | female | 0.425 | 0.435 | -1.551 | 2.348 | 0.992 | 0.0000000090 | ||
| Spatial | fixed effect on age, BYM2 by education | female | -0.075 | -0.093 | -2.89 | 2.838 | 1.452 | 0.0000000240 | ||
| Spatial | fixed effect on age, BYM2 by education | female | -0.478 | -0.494 | -2.23 | 1.361 | 0.913 | 0.0000000263 | ||
| Spatial | fixed effect on age, BYM2 by education | female | 0.576 | 0.587 | -1.232 | 2.327 | 0.908 | 0.0000000128 | ||
| Spatial | fixed effect on age, BYM2 by education | female | -0.522 | -0.54 | -2.407 | 1.461 | 0.983 | 0.0000000282 | ||
| Spatial | fixed effect on age, BYM2 by education | female | 0.349 | 0.352 | -1.151 | 1.831 | 0.76 | 0.0000000016 | ||
| Spatial | fixed effect on age, BYM2 by education | female | 0.433 | 0.437 | -1.448 | 2.29 | 0.953 | 0.0000000020 | ||
| Spatial | fixed effect on age, BYM2 by education | female | 0.547 | 0.563 | -1.044 | 2.049 | 0.789 | 0.0000000363 | ||
| Spatial | fixed effect on age, BYM2 by education | female | 0.301 | 0.304 | -1.342 | 1.926 | 0.833 | 0.0000000013 | ||
| Spatial | fixed effect on age, BYM2 by education | female | -0.011 | -0.01 | -2.009 | 1.987 | 1.019 | 0.0000000000 | ||
| Spatial | fixed effect on age, BYM2 by education | female | -0.479 | -0.496 | -2.189 | 1.322 | 0.892 | 0.0000000297 | ||
| Spatial | fixed effect on age, BYM2 by education | female | -0.479 | -0.49 | -2.586 | 1.689 | 1.089 | 0.0000000096 | ||
| Spatial | fixed effect on age, BYM2 by education | female | -0.507 | -0.514 | -3.308 | 2.336 | 1.438 | 0.0000000024 | ||
| Spatial | fixed effect on age, BYM2 by education | female | -0.263 | -0.266 | -2.113 | 1.607 | 0.948 | 0.0000000013 | ||
| Spatial | fixed effect on age, BYM2 by education | female | 0.411 | 0.423 | -1.61 | 2.362 | 1.009 | 0.0000000177 | ||
| Spatial | fixed effect on age, BYM2 by education | female | 0.35 | 0.351 | -1.526 | 2.217 | 0.955 | 0.0000000003 | ||
| Spatial | fixed effect on age, BYM2 by education | female | -0.327 | -0.331 | -2.482 | 1.851 | 1.104 | 0.0000000012 | ||
| Spatial | fixed effect on age, BYM2 by education | female | 0.169 | 0.169 | -1.308 | 1.642 | 0.752 | 0.0000000002 | ||
| Spatial | fixed effect on age, BYM2 by education | female | 0.114 | 0.109 | -1.907 | 2.161 | 1.029 | 0.0000000230 | ||
| Spatial | fixed effect on age, BYM2 by education | female | -0.307 | -0.314 | -1.834 | 1.262 | 0.788 | 0.0000000090 | ||
| Spatial | fixed effect on age, BYM2 by education | female | -0.037 | -0.055 | -2.585 | 2.601 | 1.312 | 0.0000000298 | ||
| Spatial | fixed effect on age, BYM2 by education | female | -0.526 | -0.543 | -2.466 | 1.509 | 1.011 | 0.0000000249 | ||
| Spatial | fixed effect on age, BYM2 by education | female | 0.058 | 0.058 | -1.451 | 1.564 | 0.769 | 0.0000000001 | ||
| Spatial | fixed effect on age, BYM2 by education | female | 0.117 | 0.111 | -2.17 | 2.434 | 1.169 | 0.0000000094 | ||
| Spatial | fixed effect on age, BYM2 by education | female | 0.414 | 0.42 | -1.208 | 2 | 0.818 | 0.0000000055 | ||
| Spatial | fixed effect on age, BYM2 by education | female | -0.457 | -0.473 | -2.068 | 1.245 | 0.842 | 0.0000000328 | ||
| Spatial | fixed effect on age, BYM2 by education | female | -0.412 | -0.42 | -2.445 | 1.665 | 1.047 | 0.0000000054 | ||
| Spatial | fixed effect on age, BYM2 by education | female | -0.367 | -0.378 | -1.976 | 1.298 | 0.833 | 0.0000000143 | ||
| Spatial | fixed effect on age, BYM2 by education | female | -0.505 | -0.515 | -2.863 | 1.911 | 1.216 | 0.0000000066 | ||
| Spatial | fixed effect on age, BYM2 by education | female | 0.044 | 0.044 | -1.68 | 1.765 | 0.878 | 0.0000000001 | ||
| Spatial | fixed effect on age, BYM2 by education | female | 0.089 | 0.082 | -2.055 | 2.27 | 1.096 | 0.0000000169 | ||
| Spatial | fixed effect on age, BYM2 by education | female | 0.252 | 0.253 | -1.309 | 1.809 | 0.795 | 0.0000000002 | ||
| Spatial | fixed effect on age, BYM2 by education | female | 0.394 | 0.404 | -1.411 | 2.14 | 0.903 | 0.0000000129 | ||
| Spatial | fixed effect on age, BYM2 by education | female | 0.162 | 0.163 | -1.681 | 2.004 | 0.94 | 0.0000000001 | ||
| Spatial | fixed effect on age, BYM2 by education | female | 0.558 | 0.565 | -1.386 | 2.459 | 0.981 | 0.0000000061 | ||
| Spatial | fixed effect on age, BYM2 by education | female | 0.504 | 0.519 | -1.39 | 2.313 | 0.942 | 0.0000000228 | ||
| Spatial | fixed effect on age, BYM2 by education | female | -0.501 | -0.513 | -2.714 | 1.775 | 1.143 | 0.0000000091 | ||
| Spatial | fixed effect on age, BYM2 by education | female | -0.159 | -0.161 | -1.788 | 1.478 | 0.832 | 0.0000000003 | ||
| Spatial | fixed effect on age, BYM2 by education | female | 0.471 | 0.478 | -1.184 | 2.09 | 0.835 | 0.0000000060 | ||
| Spatial | fixed effect on age, BYM2 by education | male | 0.932 | 0.932 | 0.478 | 1.389 | 0.23 | 0.0000000019 | ||
| Spatial | fixed effect on age, BYM2 by education | male | 0.53 | 0.53 | 0.38 | 0.68 | 0.077 | 0.0000000001 | ||
| Spatial | fixed effect on age, BYM2 by education | male | -0.269 | -0.267 | -0.641 | 0.095 | 0.184 | 0.0000011132 | ||
| Spatial | fixed effect on age, BYM2 by education | male | -0.432 | -0.431 | -0.788 | -0.083 | 0.175 | 0.0000025884 | ||
| Spatial | fixed effect on age, BYM2 by education | male | -0.227 | -0.226 | -0.577 | 0.122 | 0.173 | 0.0000029771 | ||
| Spatial | fixed effect on age, BYM2 by education | male | -0.106 | -0.105 | -0.471 | 0.254 | 0.181 | 0.0000014338 | ||
| Spatial | fixed effect on age, BYM2 by education | male | 0.42 | 0.419 | 0.069 | 0.775 | 0.175 | 0.0000025190 | ||
| Spatial | fixed effect on age, BYM2 by education | male | 0.659 | 0.657 | 0.307 | 1.024 | 0.178 | 0.0000019101 | ||
| Spatial | fixed effect on age, BYM2 by education | male | -0.043 | -0.045 | -0.879 | 0.803 | 0.416 | 0.0000035852 | ||
| Spatial | fixed effect on age, BYM2 by education | male | 0.038 | 0.04 | -0.808 | 0.872 | 0.415 | 0.0000032946 | ||
| Spatial | fixed effect on age, BYM2 by education | male | 0.068 | 0.071 | -0.787 | 0.903 | 0.418 | 0.0000028825 | ||
| Spatial | fixed effect on age, BYM2 by education | male | -0.041 | -0.037 | -1.098 | 0.99 | 0.516 | 0.0000022224 | ||
| Spatial | fixed effect on age, BYM2 by education | male | -0.119 | -0.121 | -1.02 | 0.789 | 0.449 | 0.0000016033 | ||
| Spatial | fixed effect on age, BYM2 by education | male | -0.054 | -0.056 | -0.891 | 0.797 | 0.417 | 0.0000034720 | ||
| Spatial | fixed effect on age, BYM2 by education | male | 0.103 | 0.109 | -0.759 | 0.933 | 0.42 | 0.0000024261 | ||
| Spatial | fixed effect on age, BYM2 by education | male | 0.056 | 0.06 | -0.785 | 0.882 | 0.411 | 0.0000055953 | ||
| Spatial | fixed effect on age, BYM2 by education | male | -0.056 | -0.061 | -0.873 | 0.779 | 0.408 | 0.0000046844 | ||
| Spatial | fixed effect on age, BYM2 by education | male | -0.105 | -0.113 | -0.93 | 0.755 | 0.418 | 0.0000034092 | ||
| Spatial | fixed effect on age, BYM2 by education | male | -0.01 | -0.011 | -0.816 | 0.797 | 0.397 | 0.0000058513 | ||
| Spatial | fixed effect on age, BYM2 by education | male | 0.118 | 0.125 | -0.754 | 0.957 | 0.425 | 0.0000021724 | ||
| Spatial | fixed effect on age, BYM2 by education | male | -0.081 | -0.086 | -0.915 | 0.775 | 0.418 | 0.0000033764 | ||
| Spatial | fixed effect on age, BYM2 by education | male | 0.098 | 0.101 | -0.783 | 0.963 | 0.433 | 0.0000023422 | ||
| Spatial | fixed effect on age, BYM2 by education | male | -0.047 | -0.045 | -1.025 | 0.922 | 0.482 | 0.0000026714 | ||
| Spatial | fixed effect on age, BYM2 by education | male | -0.11 | -0.117 | -0.946 | 0.758 | 0.423 | 0.0000029766 | ||
| Spatial | fixed effect on age, BYM2 by education | male | 0.137 | 0.145 | -0.744 | 0.982 | 0.43 | 0.0000016658 | ||
| Spatial | fixed effect on age, BYM2 by education | male | -0.122 | -0.128 | -0.976 | 0.762 | 0.432 | 0.0000023779 | ||
| Spatial | fixed effect on age, BYM2 by education | male | 0.084 | 0.091 | -0.761 | 0.896 | 0.411 | 0.0000033859 | ||
| Spatial | fixed effect on age, BYM2 by education | male | 0.104 | 0.107 | -0.778 | 0.968 | 0.434 | 0.0000017796 | ||
| Spatial | fixed effect on age, BYM2 by education | male | 0.129 | 0.141 | -0.731 | 0.933 | 0.414 | 0.0000029697 | ||
| Spatial | fixed effect on age, BYM2 by education | male | 0.073 | 0.078 | -0.78 | 0.904 | 0.417 | 0.0000030370 | ||
| Spatial | fixed effect on age, BYM2 by education | male | 0.002 | 0.002 | -0.884 | 0.888 | 0.438 | 0.0000020382 | ||
| Spatial | fixed effect on age, BYM2 by education | male | -0.107 | -0.114 | -0.936 | 0.756 | 0.42 | 0.0000033122 | ||
| Spatial | fixed effect on age, BYM2 by education | male | -0.111 | -0.112 | -1.006 | 0.792 | 0.446 | 0.0000017198 | ||
| Spatial | fixed effect on age, BYM2 by education | male | -0.118 | -0.111 | -1.146 | 0.874 | 0.5 | 0.0000011118 | ||
| Spatial | fixed effect on age, BYM2 by education | male | -0.055 | -0.057 | -0.914 | 0.812 | 0.427 | 0.0000027791 | ||
| Spatial | fixed effect on age, BYM2 by education | male | 0.098 | 0.102 | -0.782 | 0.958 | 0.431 | 0.0000029601 | ||
| Spatial | fixed effect on age, BYM2 by education | male | 0.085 | 0.087 | -0.795 | 0.954 | 0.434 | 0.0000018055 | ||
| Spatial | fixed effect on age, BYM2 by education | male | -0.073 | -0.072 | -0.978 | 0.833 | 0.449 | 0.0000017397 | ||
| Spatial | fixed effect on age, BYM2 by education | male | 0.043 | 0.047 | -0.791 | 0.86 | 0.408 | 0.0000039503 | ||
| Spatial | fixed effect on age, BYM2 by education | male | 0.01 | 0.01 | -0.85 | 0.873 | 0.426 | 0.0000048521 | ||
| Spatial | fixed effect on age, BYM2 by education | male | -0.065 | -0.07 | -0.878 | 0.772 | 0.407 | 0.0000046896 | ||
| Spatial | fixed effect on age, BYM2 by education | male | -0.036 | -0.036 | -0.965 | 0.896 | 0.461 | 0.0000033240 | ||
| Spatial | fixed effect on age, BYM2 by education | male | -0.123 | -0.128 | -0.987 | 0.766 | 0.436 | 0.0000021712 | ||
| Spatial | fixed effect on age, BYM2 by education | male | 0.018 | 0.02 | -0.814 | 0.842 | 0.409 | 0.0000040200 | ||
| Spatial | fixed effect on age, BYM2 by education | male | 0.024 | 0.024 | -0.877 | 0.925 | 0.446 | 0.0000031915 | ||
| Spatial | fixed effect on age, BYM2 by education | male | 0.099 | 0.106 | -0.758 | 0.921 | 0.417 | 0.0000029070 | ||
| Spatial | fixed effect on age, BYM2 by education | male | -0.102 | -0.11 | -0.918 | 0.752 | 0.414 | 0.0000038715 | ||
| Spatial | fixed effect on age, BYM2 by education | male | -0.094 | -0.095 | -0.977 | 0.799 | 0.44 | 0.0000019702 | ||
| Spatial | fixed effect on age, BYM2 by education | male | -0.079 | -0.085 | -0.899 | 0.768 | 0.412 | 0.0000041456 | ||
| Spatial | fixed effect on age, BYM2 by education | male | -0.117 | -0.116 | -1.058 | 0.815 | 0.465 | 0.0000012610 | ||
| Spatial | fixed effect on age, BYM2 by education | male | 0.014 | 0.015 | -0.839 | 0.864 | 0.421 | 0.0000029695 | ||
| Spatial | fixed effect on age, BYM2 by education | male | 0.007 | 0.006 | -0.871 | 0.887 | 0.435 | 0.0000039946 | ||
| Spatial | fixed effect on age, BYM2 by education | male | 0.063 | 0.067 | -0.783 | 0.888 | 0.414 | 0.0000032197 | ||
| Spatial | fixed effect on age, BYM2 by education | male | 0.088 | 0.093 | -0.773 | 0.925 | 0.421 | 0.0000033300 | ||
| Spatial | fixed effect on age, BYM2 by education | male | 0.042 | 0.043 | -0.829 | 0.907 | 0.43 | 0.0000022439 | ||
| Spatial | fixed effect on age, BYM2 by education | male | 0.134 | 0.138 | -0.76 | 1.006 | 0.44 | 0.0000013073 | ||
| Spatial | fixed effect on age, BYM2 by education | male | 0.118 | 0.124 | -0.758 | 0.964 | 0.428 | 0.0000024640 | ||
| Spatial | fixed effect on age, BYM2 by education | male | -0.116 | -0.117 | -1.03 | 0.799 | 0.454 | 0.0000014785 | ||
| Spatial | fixed effect on age, BYM2 by education | male | -0.031 | -0.033 | -0.866 | 0.81 | 0.414 | 0.0000037723 | ||
| Spatial | fixed effect on age, BYM2 by education | male | 0.112 | 0.12 | -0.751 | 0.939 | 0.42 | 0.0000024277 | ||
| Spatial | fixed effect on age, BYM2 by education | male | -0.221 | -0.293 | -2.355 | 2.183 | 1.129 | 0.0000002193 | ||
| Spatial | fixed effect on age, BYM2 by education | male | -0.654 | -0.71 | -2.214 | 1.163 | 0.855 | 0.0000002186 | ||
| Spatial | fixed effect on age, BYM2 by education | male | -0.435 | -0.465 | -1.953 | 1.226 | 0.795 | 0.0000001204 | ||
| Spatial | fixed effect on age, BYM2 by education | male | 0.095 | 0.06 | -1.934 | 2.243 | 1.035 | 0.0000001632 | ||
| Spatial | fixed effect on age, BYM2 by education | male | 0.624 | 0.668 | -1.076 | 2.13 | 0.816 | 0.0000001499 | ||
| Spatial | fixed effect on age, BYM2 by education | male | 0.873 | 0.925 | -1.078 | 2.568 | 0.939 | 0.0000002511 | ||
| Spatial | fixed effect on age, BYM2 by education | male | -0.195 | -0.197 | -1.853 | 1.476 | 0.848 | 0.0000000006 | ||
| Spatial | fixed effect on age, BYM2 by education | male | 0.151 | 0.152 | -1.467 | 1.765 | 0.824 | 0.0000000001 | ||
| Spatial | fixed effect on age, BYM2 by education | male | 0.28 | 0.282 | -1.372 | 1.922 | 0.84 | 0.0000000005 | ||
| Spatial | fixed effect on age, BYM2 by education | male | -0.129 | -0.143 | -3.312 | 3.135 | 1.639 | 0.0000000100 | ||
| Spatial | fixed effect on age, BYM2 by education | male | -0.518 | -0.531 | -2.665 | 1.704 | 1.112 | 0.0000000127 | ||
| Spatial | fixed effect on age, BYM2 by education | male | -0.241 | -0.245 | -1.929 | 1.465 | 0.865 | 0.0000000016 | ||
| Spatial | fixed effect on age, BYM2 by education | male | 0.428 | 0.432 | -1.222 | 2.057 | 0.836 | 0.0000000024 | ||
| Spatial | fixed effect on age, BYM2 by education | male | 0.27 | 0.276 | -1.479 | 1.982 | 0.876 | 0.0000000242 | ||
| Spatial | fixed effect on age, BYM2 by education | male | -0.255 | -0.26 | -1.794 | 1.313 | 0.791 | 0.0000000050 | ||
| Spatial | fixed effect on age, BYM2 by education | male | -0.459 | -0.475 | -2.131 | 1.3 | 0.872 | 0.0000000281 | ||
| Spatial | fixed effect on age, BYM2 by education | male | -0.055 | -0.055 | -1.365 | 1.254 | 0.667 | 0.0000000000 | ||
| Spatial | fixed effect on age, BYM2 by education | male | 0.499 | 0.508 | -1.263 | 2.213 | 0.886 | 0.0000000089 | ||
| Spatial | fixed effect on age, BYM2 by education | male | -0.357 | -0.365 | -2.054 | 1.385 | 0.875 | 0.0000000085 | ||
| Spatial | fixed effect on age, BYM2 by education | male | 0.43 | 0.44 | -1.548 | 2.353 | 0.993 | 0.0000000093 | ||
| Spatial | fixed effect on age, BYM2 by education | male | -0.152 | -0.174 | -2.962 | 2.777 | 1.455 | 0.0000000270 | ||
| Spatial | fixed effect on age, BYM2 by education | male | -0.48 | -0.496 | -2.232 | 1.361 | 0.914 | 0.0000000270 | ||
| Spatial | fixed effect on age, BYM2 by education | male | 0.576 | 0.587 | -1.232 | 2.326 | 0.908 | 0.0000000127 | ||
| Spatial | fixed effect on age, BYM2 by education | male | -0.529 | -0.548 | -2.416 | 1.458 | 0.985 | 0.0000000294 | ||
| Spatial | fixed effect on age, BYM2 by education | male | 0.352 | 0.355 | -1.148 | 1.836 | 0.761 | 0.0000000016 | ||
| Spatial | fixed effect on age, BYM2 by education | male | 0.435 | 0.439 | -1.446 | 2.293 | 0.953 | 0.0000000020 | ||
| Spatial | fixed effect on age, BYM2 by education | male | 0.547 | 0.564 | -1.044 | 2.05 | 0.789 | 0.0000000361 | ||
| Spatial | fixed effect on age, BYM2 by education | male | 0.304 | 0.308 | -1.339 | 1.93 | 0.833 | 0.0000000013 | ||
| Spatial | fixed effect on age, BYM2 by education | male | -0.002 | -0.002 | -2.001 | 1.996 | 1.019 | 0.0000000000 | ||
| Spatial | fixed effect on age, BYM2 by education | male | -0.469 | -0.485 | -2.177 | 1.328 | 0.891 | 0.0000000289 | ||
| Spatial | fixed effect on age, BYM2 by education | male | -0.482 | -0.494 | -2.59 | 1.688 | 1.089 | 0.0000000099 | ||
| Spatial | fixed effect on age, BYM2 by education | male | -0.511 | -0.519 | -3.314 | 2.333 | 1.439 | 0.0000000025 | ||
| Spatial | fixed effect on age, BYM2 by education | male | -0.248 | -0.251 | -2.097 | 1.618 | 0.947 | 0.0000000011 | ||
| Spatial | fixed effect on age, BYM2 by education | male | 0.437 | 0.451 | -1.593 | 2.391 | 1.012 | 0.0000000197 | ||
| Spatial | fixed effect on age, BYM2 by education | male | 0.353 | 0.354 | -1.524 | 2.221 | 0.955 | 0.0000000003 | ||
| Spatial | fixed effect on age, BYM2 by education | male | -0.32 | -0.324 | -2.475 | 1.857 | 1.104 | 0.0000000012 | ||
| Spatial | fixed effect on age, BYM2 by education | male | 0.175 | 0.176 | -1.303 | 1.649 | 0.753 | 0.0000000002 | ||
| Spatial | fixed effect on age, BYM2 by education | male | 0.08 | 0.073 | -1.935 | 2.131 | 1.029 | 0.0000000236 | ||
| Spatial | fixed effect on age, BYM2 by education | male | -0.291 | -0.297 | -1.816 | 1.273 | 0.786 | 0.0000000081 | ||
| Spatial | fixed effect on age, BYM2 by education | male | -0.105 | -0.126 | -2.646 | 2.547 | 1.315 | 0.0000000327 | ||
| Spatial | fixed effect on age, BYM2 by education | male | -0.533 | -0.551 | -2.475 | 1.506 | 1.013 | 0.0000000259 | ||
| Spatial | fixed effect on age, BYM2 by education | male | 0.066 | 0.067 | -1.443 | 1.573 | 0.769 | 0.0000000001 | ||
| Spatial | fixed effect on age, BYM2 by education | male | 0.145 | 0.141 | -2.146 | 2.454 | 1.168 | 0.0000000089 | ||
| Spatial | fixed effect on age, BYM2 by education | male | 0.416 | 0.422 | -1.207 | 2.003 | 0.818 | 0.0000000056 | ||
| Spatial | fixed effect on age, BYM2 by education | male | -0.448 | -0.464 | -2.057 | 1.251 | 0.84 | 0.0000000320 | ||
| Spatial | fixed effect on age, BYM2 by education | male | -0.41 | -0.418 | -2.443 | 1.667 | 1.047 | 0.0000000055 | ||
| Spatial | fixed effect on age, BYM2 by education | male | -0.351 | -0.361 | -1.958 | 1.308 | 0.83 | 0.0000000132 | ||
| Spatial | fixed effect on age, BYM2 by education | male | -0.51 | -0.52 | -2.87 | 1.909 | 1.217 | 0.0000000068 | ||
| Spatial | fixed effect on age, BYM2 by education | male | 0.052 | 0.052 | -1.673 | 1.773 | 0.879 | 0.0000000001 | ||
| Spatial | fixed effect on age, BYM2 by education | male | 0.068 | 0.06 | -2.073 | 2.25 | 1.096 | 0.0000000173 | ||
| Spatial | fixed effect on age, BYM2 by education | male | 0.257 | 0.258 | -1.305 | 1.815 | 0.795 | 0.0000000002 | ||
| Spatial | fixed effect on age, BYM2 by education | male | 0.39 | 0.401 | -1.413 | 2.136 | 0.903 | 0.0000000129 | ||
| Spatial | fixed effect on age, BYM2 by education | male | 0.169 | 0.169 | -1.676 | 2.011 | 0.94 | 0.0000000001 | ||
| Spatial | fixed effect on age, BYM2 by education | male | 0.558 | 0.565 | -1.385 | 2.458 | 0.98 | 0.0000000061 | ||
| Spatial | fixed effect on age, BYM2 by education | male | 0.511 | 0.527 | -1.385 | 2.322 | 0.943 | 0.0000000233 | ||
| Spatial | fixed effect on age, BYM2 by education | male | -0.505 | -0.517 | -2.719 | 1.773 | 1.144 | 0.0000000094 | ||
| Spatial | fixed effect on age, BYM2 by education | male | -0.147 | -0.148 | -1.775 | 1.488 | 0.832 | 0.0000000002 | ||
| Spatial | fixed effect on age, BYM2 by education | male | 0.473 | 0.48 | -1.183 | 2.092 | 0.835 | 0.0000000060 | ||
| Non-Spatial | fixed effect on age, fixed effect on education, IID by county | female | -0.069 | -0.069 | -0.323 | 0.185 | 0.129 | 0.0000000001 | ||
| Non-Spatial | fixed effect on age, fixed effect on education, IID by county | female | 0.624 | 0.624 | 0.51 | 0.738 | 0.058 | 0.0000000001 | ||
| Non-Spatial | fixed effect on age, fixed effect on education, IID by county | female | 0.223 | 0.223 | 0.197 | 0.248 | 0.013 | 0.0000000001 | ||
| Non-Spatial | fixed effect on age, fixed effect on education, IID by county | male | -0.144 | -0.144 | -0.476 | 0.188 | 0.169 | 0.0000000001 | ||
| Non-Spatial | fixed effect on age, fixed effect on education, IID by county | male | 0.605 | 0.605 | 0.453 | 0.757 | 0.078 | 0.0000000001 | ||
| Non-Spatial | fixed effect on age, fixed effect on education, IID by county | male | 0.204 | 0.204 | 0.173 | 0.234 | 0.015 | 0.0000000001 | ||
| Spatial | fixed effect on age, RW(1) by education, BYM2 by county | female | 0.721 | 0.721 | 0.476 | 0.968 | 0.125 | 0.0000000001 | ||
| Spatial | fixed effect on age, RW(1) by education, BYM2 by county | female | 0.624 | 0.624 | 0.511 | 0.737 | 0.058 | 0.0000000001 | ||
| Spatial | fixed effect on age, RW(1) by education, BYM2 by county | female | -0.24 | -0.241 | -0.361 | -0.12 | 0.061 | 0.0000000002 | ||
| Spatial | fixed effect on age, RW(1) by education, BYM2 by county | female | -0.395 | -0.395 | -0.474 | -0.315 | 0.041 | 0.0000000003 | ||
| Spatial | fixed effect on age, RW(1) by education, BYM2 by county | female | -0.259 | -0.259 | -0.326 | -0.192 | 0.034 | 0.0000000000 | ||
| Spatial | fixed effect on age, RW(1) by education, BYM2 by county | female | -0.139 | -0.139 | -0.231 | -0.047 | 0.047 | 0.0000000006 | ||
| Spatial | fixed effect on age, RW(1) by education, BYM2 by county | female | 0.382 | 0.382 | 0.299 | 0.466 | 0.043 | 0.0000000002 | ||
| Spatial | fixed effect on age, RW(1) by education, BYM2 by county | female | 0.651 | 0.65 | 0.547 | 0.754 | 0.053 | 0.0000000003 | ||
| Spatial | fixed effect on age, RW(1) by education, BYM2 by county | male | 0.529 | 0.529 | 0.204 | 0.856 | 0.166 | 0.0000000000 | ||
| Spatial | fixed effect on age, RW(1) by education, BYM2 by county | male | 0.601 | 0.601 | 0.45 | 0.753 | 0.077 | 0.0000000001 | ||
| Spatial | fixed effect on age, RW(1) by education, BYM2 by county | male | -0.286 | -0.287 | -0.42 | -0.152 | 0.068 | 0.0000000004 | ||
| Spatial | fixed effect on age, RW(1) by education, BYM2 by county | male | -0.371 | -0.371 | -0.467 | -0.277 | 0.049 | 0.0000000022 | ||
| Spatial | fixed effect on age, RW(1) by education, BYM2 by county | male | -0.183 | -0.183 | -0.265 | -0.1 | 0.042 | 0.0000000000 | ||
| Spatial | fixed effect on age, RW(1) by education, BYM2 by county | male | -0.027 | -0.026 | -0.147 | 0.091 | 0.061 | 0.0000000043 | ||
| Spatial | fixed effect on age, RW(1) by education, BYM2 by county | male | 0.327 | 0.326 | 0.233 | 0.42 | 0.048 | 0.0000000008 | ||
| Spatial | fixed effect on age, RW(1) by education, BYM2 by county | male | 0.541 | 0.541 | 0.426 | 0.656 | 0.059 | 0.0000000013 | ||
| Non-Spatial | fixed effect on age, RW(1) by education, IID by county | female | 0.777 | 0.777 | 0.536 | 1.019 | 0.123 | 0.0000000001 | ||
| Non-Spatial | fixed effect on age, RW(1) by education, IID by county | female | 0.621 | 0.621 | 0.508 | 0.734 | 0.058 | 0.0000000001 | ||
| Non-Spatial | fixed effect on age, RW(1) by education, IID by county | female | -0.237 | -0.237 | -0.357 | -0.117 | 0.061 | 0.0000000002 | ||
| Non-Spatial | fixed effect on age, RW(1) by education, IID by county | female | -0.393 | -0.393 | -0.473 | -0.314 | 0.041 | 0.0000000003 | ||
| Non-Spatial | fixed effect on age, RW(1) by education, IID by county | female | -0.26 | -0.26 | -0.327 | -0.193 | 0.034 | 0.0000000000 | ||
| Non-Spatial | fixed effect on age, RW(1) by education, IID by county | female | -0.141 | -0.14 | -0.232 | -0.049 | 0.047 | 0.0000000007 | ||
| Non-Spatial | fixed effect on age, RW(1) by education, IID by county | female | 0.381 | 0.381 | 0.298 | 0.465 | 0.043 | 0.0000000002 | ||
| Non-Spatial | fixed effect on age, RW(1) by education, IID by county | female | 0.65 | 0.65 | 0.546 | 0.754 | 0.053 | 0.0000000003 | ||
| Non-Spatial | fixed effect on age, RW(1) by education, IID by county | male | 0.613 | 0.613 | 0.288 | 0.937 | 0.165 | 0.0000000001 | ||
| Non-Spatial | fixed effect on age, RW(1) by education, IID by county | male | 0.598 | 0.598 | 0.446 | 0.75 | 0.077 | 0.0000000001 | ||
| Non-Spatial | fixed effect on age, RW(1) by education, IID by county | male | -0.286 | -0.286 | -0.419 | -0.151 | 0.068 | 0.0000000005 | ||
| Non-Spatial | fixed effect on age, RW(1) by education, IID by county | male | -0.37 | -0.37 | -0.466 | -0.275 | 0.049 | 0.0000000027 | ||
| Non-Spatial | fixed effect on age, RW(1) by education, IID by county | male | -0.184 | -0.184 | -0.266 | -0.102 | 0.042 | 0.0000000000 | ||
| Non-Spatial | fixed effect on age, RW(1) by education, IID by county | male | -0.028 | -0.028 | -0.148 | 0.089 | 0.06 | 0.0000000053 | ||
| Non-Spatial | fixed effect on age, RW(1) by education, IID by county | male | 0.326 | 0.326 | 0.233 | 0.42 | 0.048 | 0.0000000009 | ||
| Non-Spatial | fixed effect on age, RW(1) by education, IID by county | male | 0.542 | 0.542 | 0.427 | 0.658 | 0.059 | 0.0000000017 |
| Type | County | Model Name | Estimate | 95% CI: Lower | 95% CI: Upper |
|---|---|---|---|---|---|
| Non-Spatial | Alameda | CDC reported count | 0.815 | 0.815 | 0.815 |
| Non-Spatial | Alameda | direct survey estimate | 0.931 | 0.918 | 0.945 |
| Non-Spatial | Alameda | fixed effect on age, RW(1) by education, IID by county | 0.451 | 0.442 | 0.459 |
| Non-Spatial | Alameda | fixed effect on age, RW(1) by education, IID by county | 0.483 | 0.476 | 0.489 |
| Non-Spatial | Alameda | fixed effect on age, fixed effect on education, IID by county | 0.451 | 0.442 | 0.459 |
| Non-Spatial | Alameda | fixed effect on age, fixed effect on education, IID by county | 0.483 | 0.476 | 0.488 |
| Non-Spatial | Alpine | CDC reported count | 0 | 0 | 0 |
| Non-Spatial | Alpine | fixed effect on age, RW(1) by education, IID by county | 0.461 | 0.369 | 0.503 |
| Non-Spatial | Alpine | fixed effect on age, RW(1) by education, IID by county | 0.426 | 0.359 | 0.458 |
| Non-Spatial | Alpine | fixed effect on age, fixed effect on education, IID by county | 0.458 | 0.367 | 0.501 |
| Non-Spatial | Alpine | fixed effect on age, fixed effect on education, IID by county | 0.423 | 0.353 | 0.455 |
| Non-Spatial | Amador | CDC reported count | 0.625 | 0.625 | 0.625 |
| Non-Spatial | Amador | direct survey estimate | 0.76 | 0.619 | 0.902 |
| Non-Spatial | Amador | fixed effect on age, RW(1) by education, IID by county | 0.439 | 0.365 | 0.488 |
| Non-Spatial | Amador | fixed effect on age, RW(1) by education, IID by county | 0.398 | 0.349 | 0.426 |
| Non-Spatial | Amador | fixed effect on age, fixed effect on education, IID by county | 0.437 | 0.358 | 0.487 |
| Non-Spatial | Amador | fixed effect on age, fixed effect on education, IID by county | 0.397 | 0.351 | 0.425 |
| Non-Spatial | Butte | CDC reported count | 0.513 | 0.513 | 0.513 |
| Non-Spatial | Butte | direct survey estimate | 0.785 | 0.734 | 0.836 |
| Non-Spatial | Butte | fixed effect on age, RW(1) by education, IID by county | 0.372 | 0.335 | 0.403 |
| Non-Spatial | Butte | fixed effect on age, RW(1) by education, IID by county | 0.429 | 0.406 | 0.447 |
| Non-Spatial | Butte | fixed effect on age, fixed effect on education, IID by county | 0.371 | 0.335 | 0.4 |
| Non-Spatial | Butte | fixed effect on age, fixed effect on education, IID by county | 0.426 | 0.405 | 0.445 |
| Non-Spatial | Calaveras | CDC reported count | 0.6 | 0.6 | 0.6 |
| Non-Spatial | Calaveras | direct survey estimate | 0.818 | 0.742 | 0.894 |
| Non-Spatial | Calaveras | fixed effect on age, RW(1) by education, IID by county | 0.373 | 0.306 | 0.421 |
| Non-Spatial | Calaveras | fixed effect on age, RW(1) by education, IID by county | 0.443 | 0.404 | 0.468 |
| Non-Spatial | Calaveras | fixed effect on age, fixed effect on education, IID by county | 0.37 | 0.307 | 0.421 |
| Non-Spatial | Calaveras | fixed effect on age, fixed effect on education, IID by county | 0.445 | 0.408 | 0.468 |
| Non-Spatial | Colusa | CDC reported count | 0.611 | 0.611 | 0.611 |
| Non-Spatial | Colusa | direct survey estimate | 0.825 | 0.65 | 1 |
| Non-Spatial | Colusa | fixed effect on age, RW(1) by education, IID by county | 0.386 | 0.281 | 0.453 |
| Non-Spatial | Colusa | fixed effect on age, RW(1) by education, IID by county | 0.431 | 0.372 | 0.463 |
| Non-Spatial | Colusa | fixed effect on age, fixed effect on education, IID by county | 0.379 | 0.265 | 0.451 |
| Non-Spatial | Colusa | fixed effect on age, fixed effect on education, IID by county | 0.428 | 0.364 | 0.46 |
| Non-Spatial | Contra Costa | CDC reported count | 0.791 | 0.791 | 0.791 |
| Non-Spatial | Contra Costa | direct survey estimate | 0.92 | 0.907 | 0.934 |
| Non-Spatial | Contra Costa | fixed effect on age, RW(1) by education, IID by county | 0.446 | 0.435 | 0.454 |
| Non-Spatial | Contra Costa | fixed effect on age, RW(1) by education, IID by county | 0.477 | 0.468 | 0.484 |
| Non-Spatial | Contra Costa | fixed effect on age, fixed effect on education, IID by county | 0.445 | 0.434 | 0.453 |
| Non-Spatial | Contra Costa | fixed effect on age, fixed effect on education, IID by county | 0.476 | 0.468 | 0.483 |
| Non-Spatial | Del Norte | CDC reported count | 0.403 | 0.403 | 0.403 |
| Non-Spatial | Del Norte | direct survey estimate | 0.668 | 0.528 | 0.808 |
| Non-Spatial | Del Norte | fixed effect on age, RW(1) by education, IID by county | 0.398 | 0.299 | 0.466 |
| Non-Spatial | Del Norte | fixed effect on age, RW(1) by education, IID by county | 0.363 | 0.317 | 0.397 |
| Non-Spatial | Del Norte | fixed effect on age, fixed effect on education, IID by county | 0.386 | 0.289 | 0.453 |
| Non-Spatial | Del Norte | fixed effect on age, fixed effect on education, IID by county | 0.358 | 0.308 | 0.396 |
| Non-Spatial | El Dorado | CDC reported count | 0.627 | 0.627 | 0.627 |
| Non-Spatial | El Dorado | direct survey estimate | 0.79 | 0.722 | 0.859 |
| Non-Spatial | El Dorado | fixed effect on age, RW(1) by education, IID by county | 0.395 | 0.351 | 0.428 |
| Non-Spatial | El Dorado | fixed effect on age, RW(1) by education, IID by county | 0.433 | 0.4 | 0.455 |
| Non-Spatial | El Dorado | fixed effect on age, fixed effect on education, IID by county | 0.396 | 0.347 | 0.429 |
| Non-Spatial | El Dorado | fixed effect on age, fixed effect on education, IID by county | 0.434 | 0.405 | 0.457 |
| Non-Spatial | Fresno | CDC reported count | 0.632 | 0.632 | 0.632 |
| Non-Spatial | Fresno | direct survey estimate | 0.81 | 0.781 | 0.839 |
| Non-Spatial | Fresno | fixed effect on age, RW(1) by education, IID by county | 0.399 | 0.377 | 0.418 |
| Non-Spatial | Fresno | fixed effect on age, RW(1) by education, IID by county | 0.425 | 0.411 | 0.437 |
| Non-Spatial | Fresno | fixed effect on age, fixed effect on education, IID by county | 0.396 | 0.375 | 0.414 |
| Non-Spatial | Fresno | fixed effect on age, fixed effect on education, IID by county | 0.422 | 0.409 | 0.434 |
| Non-Spatial | Glenn | CDC reported count | 0.539 | 0.539 | 0.539 |
| Non-Spatial | Glenn | direct survey estimate | 0.79 | 0.632 | 0.947 |
| Non-Spatial | Glenn | fixed effect on age, RW(1) by education, IID by county | 0.417 | 0.343 | 0.463 |
| Non-Spatial | Glenn | fixed effect on age, RW(1) by education, IID by county | 0.403 | 0.341 | 0.445 |
| Non-Spatial | Glenn | fixed effect on age, fixed effect on education, IID by county | 0.416 | 0.337 | 0.464 |
| Non-Spatial | Glenn | fixed effect on age, fixed effect on education, IID by county | 0.395 | 0.33 | 0.441 |
| Non-Spatial | Humboldt | CDC reported count | 0.631 | 0.631 | 0.631 |
| Non-Spatial | Humboldt | direct survey estimate | 0.861 | 0.82 | 0.903 |
| Non-Spatial | Humboldt | fixed effect on age, RW(1) by education, IID by county | 0.408 | 0.372 | 0.436 |
| Non-Spatial | Humboldt | fixed effect on age, RW(1) by education, IID by county | 0.444 | 0.42 | 0.462 |
| Non-Spatial | Humboldt | fixed effect on age, fixed effect on education, IID by county | 0.407 | 0.37 | 0.435 |
| Non-Spatial | Humboldt | fixed effect on age, fixed effect on education, IID by county | 0.443 | 0.421 | 0.46 |
| Non-Spatial | Imperial | CDC reported count | 0.803 | 0.803 | 0.803 |
| Non-Spatial | Imperial | direct survey estimate | 0.854 | 0.795 | 0.912 |
| Non-Spatial | Imperial | fixed effect on age, RW(1) by education, IID by county | 0.442 | 0.39 | 0.475 |
| Non-Spatial | Imperial | fixed effect on age, RW(1) by education, IID by county | 0.413 | 0.384 | 0.435 |
| Non-Spatial | Imperial | fixed effect on age, fixed effect on education, IID by county | 0.441 | 0.389 | 0.473 |
| Non-Spatial | Imperial | fixed effect on age, fixed effect on education, IID by county | 0.41 | 0.377 | 0.433 |
| Non-Spatial | Inyo | CDC reported count | 0 | 0 | 0 |
| Non-Spatial | Inyo | direct survey estimate | 0.924 | 0.806 | 1.042 |
| Non-Spatial | Inyo | fixed effect on age, RW(1) by education, IID by county | 0.424 | 0.34 | 0.47 |
| Non-Spatial | Inyo | fixed effect on age, RW(1) by education, IID by county | 0.455 | 0.413 | 0.481 |
| Non-Spatial | Inyo | fixed effect on age, fixed effect on education, IID by county | 0.425 | 0.341 | 0.47 |
| Non-Spatial | Inyo | fixed effect on age, fixed effect on education, IID by county | 0.457 | 0.413 | 0.481 |
| Non-Spatial | Kern | CDC reported count | 0.518 | 0.518 | 0.518 |
| Non-Spatial | Kern | direct survey estimate | 0.765 | 0.733 | 0.798 |
| Non-Spatial | Kern | fixed effect on age, RW(1) by education, IID by county | 0.382 | 0.355 | 0.405 |
| Non-Spatial | Kern | fixed effect on age, RW(1) by education, IID by county | 0.384 | 0.368 | 0.398 |
| Non-Spatial | Kern | fixed effect on age, fixed effect on education, IID by county | 0.378 | 0.355 | 0.4 |
| Non-Spatial | Kern | fixed effect on age, fixed effect on education, IID by county | 0.381 | 0.364 | 0.395 |
| Non-Spatial | Kings | CDC reported count | 0.45 | 0.45 | 0.45 |
| Non-Spatial | Kings | direct survey estimate | 0.756 | 0.684 | 0.828 |
| Non-Spatial | Kings | fixed effect on age, RW(1) by education, IID by county | 0.424 | 0.362 | 0.471 |
| Non-Spatial | Kings | fixed effect on age, RW(1) by education, IID by county | 0.339 | 0.307 | 0.362 |
| Non-Spatial | Kings | fixed effect on age, fixed effect on education, IID by county | 0.419 | 0.36 | 0.467 |
| Non-Spatial | Kings | fixed effect on age, fixed effect on education, IID by county | 0.332 | 0.299 | 0.359 |
| Non-Spatial | Lake | CDC reported count | 0.576 | 0.576 | 0.576 |
| Non-Spatial | Lake | direct survey estimate | 0.716 | 0.63 | 0.802 |
| Non-Spatial | Lake | fixed effect on age, RW(1) by education, IID by county | 0.383 | 0.329 | 0.422 |
| Non-Spatial | Lake | fixed effect on age, RW(1) by education, IID by county | 0.409 | 0.373 | 0.437 |
| Non-Spatial | Lake | fixed effect on age, fixed effect on education, IID by county | 0.378 | 0.329 | 0.419 |
| Non-Spatial | Lake | fixed effect on age, fixed effect on education, IID by county | 0.408 | 0.372 | 0.434 |
| Non-Spatial | Lassen | CDC reported count | 0.332 | 0.332 | 0.332 |
| Non-Spatial | Lassen | direct survey estimate | 0.822 | 0.711 | 0.933 |
| Non-Spatial | Lassen | fixed effect on age, RW(1) by education, IID by county | 0.537 | 0.422 | 0.606 |
| Non-Spatial | Lassen | fixed effect on age, RW(1) by education, IID by county | 0.255 | 0.221 | 0.281 |
| Non-Spatial | Lassen | fixed effect on age, fixed effect on education, IID by county | 0.525 | 0.416 | 0.606 |
| Non-Spatial | Lassen | fixed effect on age, fixed effect on education, IID by county | 0.255 | 0.216 | 0.279 |
| Non-Spatial | Los Angeles | CDC reported count | 0.699 | 0.699 | 0.699 |
| Non-Spatial | Los Angeles | direct survey estimate | 0.891 | 0.882 | 0.9 |
| Non-Spatial | Los Angeles | fixed effect on age, RW(1) by education, IID by county | 0.43 | 0.421 | 0.438 |
| Non-Spatial | Los Angeles | fixed effect on age, RW(1) by education, IID by county | 0.466 | 0.46 | 0.472 |
| Non-Spatial | Los Angeles | fixed effect on age, fixed effect on education, IID by county | 0.429 | 0.422 | 0.436 |
| Non-Spatial | Los Angeles | fixed effect on age, fixed effect on education, IID by county | 0.465 | 0.459 | 0.47 |
| Non-Spatial | Madera | CDC reported count | 0.559 | 0.559 | 0.559 |
| Non-Spatial | Madera | direct survey estimate | 0.818 | 0.762 | 0.874 |
| Non-Spatial | Madera | fixed effect on age, RW(1) by education, IID by county | 0.363 | 0.314 | 0.403 |
| Non-Spatial | Madera | fixed effect on age, RW(1) by education, IID by county | 0.442 | 0.406 | 0.468 |
| Non-Spatial | Madera | fixed effect on age, fixed effect on education, IID by county | 0.36 | 0.312 | 0.394 |
| Non-Spatial | Madera | fixed effect on age, fixed effect on education, IID by county | 0.436 | 0.402 | 0.464 |
| Non-Spatial | Marin | CDC reported count | 0.891 | 0.891 | 0.891 |
| Non-Spatial | Marin | direct survey estimate | 0.966 | 0.943 | 0.989 |
| Non-Spatial | Marin | fixed effect on age, RW(1) by education, IID by county | 0.457 | 0.439 | 0.469 |
| Non-Spatial | Marin | fixed effect on age, RW(1) by education, IID by county | 0.497 | 0.484 | 0.505 |
| Non-Spatial | Marin | fixed effect on age, fixed effect on education, IID by county | 0.458 | 0.442 | 0.469 |
| Non-Spatial | Marin | fixed effect on age, fixed effect on education, IID by county | 0.497 | 0.484 | 0.505 |
| Non-Spatial | Mariposa | CDC reported count | 0 | 0 | 0 |
| Non-Spatial | Mariposa | direct survey estimate | 0.785 | 0.604 | 0.966 |
| Non-Spatial | Mariposa | fixed effect on age, RW(1) by education, IID by county | 0.43 | 0.342 | 0.475 |
| Non-Spatial | Mariposa | fixed effect on age, RW(1) by education, IID by county | 0.43 | 0.378 | 0.459 |
| Non-Spatial | Mariposa | fixed effect on age, fixed effect on education, IID by county | 0.43 | 0.347 | 0.473 |
| Non-Spatial | Mariposa | fixed effect on age, fixed effect on education, IID by county | 0.429 | 0.379 | 0.458 |
| Non-Spatial | Mendocino | CDC reported count | 0.67 | 0.67 | 0.67 |
| Non-Spatial | Mendocino | direct survey estimate | 0.832 | 0.755 | 0.91 |
| Non-Spatial | Mendocino | fixed effect on age, RW(1) by education, IID by county | 0.401 | 0.353 | 0.435 |
| Non-Spatial | Mendocino | fixed effect on age, RW(1) by education, IID by county | 0.455 | 0.428 | 0.475 |
| Non-Spatial | Mendocino | fixed effect on age, fixed effect on education, IID by county | 0.401 | 0.354 | 0.435 |
| Non-Spatial | Mendocino | fixed effect on age, fixed effect on education, IID by county | 0.453 | 0.426 | 0.473 |
| Non-Spatial | Merced | CDC reported count | 0.532 | 0.532 | 0.532 |
| Non-Spatial | Merced | direct survey estimate | 0.76 | 0.702 | 0.818 |
| Non-Spatial | Merced | fixed effect on age, RW(1) by education, IID by county | 0.389 | 0.349 | 0.419 |
| Non-Spatial | Merced | fixed effect on age, RW(1) by education, IID by county | 0.394 | 0.367 | 0.417 |
| Non-Spatial | Merced | fixed effect on age, fixed effect on education, IID by county | 0.386 | 0.346 | 0.416 |
| Non-Spatial | Merced | fixed effect on age, fixed effect on education, IID by county | 0.388 | 0.361 | 0.41 |
| Non-Spatial | Modoc | CDC reported count | 0 | 0 | 0 |
| Non-Spatial | Modoc | direct survey estimate | 0.918 | 0.806 | 1.029 |
| Non-Spatial | Modoc | fixed effect on age, RW(1) by education, IID by county | 0.449 | 0.363 | 0.489 |
| Non-Spatial | Modoc | fixed effect on age, RW(1) by education, IID by county | 0.426 | 0.367 | 0.458 |
| Non-Spatial | Modoc | fixed effect on age, fixed effect on education, IID by county | 0.448 | 0.362 | 0.49 |
| Non-Spatial | Modoc | fixed effect on age, fixed effect on education, IID by county | 0.425 | 0.367 | 0.459 |
| Non-Spatial | Mono | CDC reported count | 0 | 0 | 0 |
| Non-Spatial | Mono | direct survey estimate | 0.898 | 0.762 | 1.033 |
| Non-Spatial | Mono | fixed effect on age, RW(1) by education, IID by county | 0.446 | 0.356 | 0.498 |
| Non-Spatial | Mono | fixed effect on age, RW(1) by education, IID by county | 0.419 | 0.366 | 0.446 |
| Non-Spatial | Mono | fixed effect on age, fixed effect on education, IID by county | 0.445 | 0.347 | 0.496 |
| Non-Spatial | Mono | fixed effect on age, fixed effect on education, IID by county | 0.417 | 0.36 | 0.445 |
| Non-Spatial | Monterey | CDC reported count | 0.723 | 0.723 | 0.723 |
| Non-Spatial | Monterey | direct survey estimate | 0.867 | 0.823 | 0.911 |
| Non-Spatial | Monterey | fixed effect on age, RW(1) by education, IID by county | 0.452 | 0.427 | 0.47 |
| Non-Spatial | Monterey | fixed effect on age, RW(1) by education, IID by county | 0.442 | 0.425 | 0.455 |
| Non-Spatial | Monterey | fixed effect on age, fixed effect on education, IID by county | 0.451 | 0.427 | 0.469 |
| Non-Spatial | Monterey | fixed effect on age, fixed effect on education, IID by county | 0.439 | 0.424 | 0.452 |
| Non-Spatial | Napa | CDC reported count | 0.795 | 0.795 | 0.795 |
| Non-Spatial | Napa | direct survey estimate | 0.901 | 0.861 | 0.941 |
| Non-Spatial | Napa | fixed effect on age, RW(1) by education, IID by county | 0.439 | 0.409 | 0.46 |
| Non-Spatial | Napa | fixed effect on age, RW(1) by education, IID by county | 0.459 | 0.437 | 0.474 |
| Non-Spatial | Napa | fixed effect on age, fixed effect on education, IID by county | 0.438 | 0.408 | 0.461 |
| Non-Spatial | Napa | fixed effect on age, fixed effect on education, IID by county | 0.457 | 0.431 | 0.472 |
| Non-Spatial | Nevada | CDC reported count | 0.614 | 0.614 | 0.614 |
| Non-Spatial | Nevada | direct survey estimate | 0.883 | 0.811 | 0.956 |
| Non-Spatial | Nevada | fixed effect on age, RW(1) by education, IID by county | 0.439 | 0.401 | 0.463 |
| Non-Spatial | Nevada | fixed effect on age, RW(1) by education, IID by county | 0.456 | 0.422 | 0.478 |
| Non-Spatial | Nevada | fixed effect on age, fixed effect on education, IID by county | 0.44 | 0.393 | 0.464 |
| Non-Spatial | Nevada | fixed effect on age, fixed effect on education, IID by county | 0.457 | 0.424 | 0.478 |
| Non-Spatial | Orange | CDC reported count | 0.717 | 0.717 | 0.717 |
| Non-Spatial | Orange | direct survey estimate | 0.896 | 0.881 | 0.91 |
| Non-Spatial | Orange | fixed effect on age, RW(1) by education, IID by county | 0.433 | 0.42 | 0.443 |
| Non-Spatial | Orange | fixed effect on age, RW(1) by education, IID by county | 0.46 | 0.45 | 0.468 |
| Non-Spatial | Orange | fixed effect on age, fixed effect on education, IID by county | 0.432 | 0.42 | 0.442 |
| Non-Spatial | Orange | fixed effect on age, fixed effect on education, IID by county | 0.458 | 0.45 | 0.466 |
| Non-Spatial | Placer | CDC reported count | 0.67 | 0.67 | 0.67 |
| Non-Spatial | Placer | direct survey estimate | 0.806 | 0.749 | 0.863 |
| Non-Spatial | Placer | fixed effect on age, RW(1) by education, IID by county | 0.395 | 0.366 | 0.419 |
| Non-Spatial | Placer | fixed effect on age, RW(1) by education, IID by county | 0.447 | 0.427 | 0.465 |
| Non-Spatial | Placer | fixed effect on age, fixed effect on education, IID by county | 0.393 | 0.364 | 0.418 |
| Non-Spatial | Placer | fixed effect on age, fixed effect on education, IID by county | 0.447 | 0.427 | 0.463 |
| Non-Spatial | Plumas | CDC reported count | 0 | 0 | 0 |
| Non-Spatial | Plumas | direct survey estimate | 0.772 | 0.602 | 0.942 |
| Non-Spatial | Plumas | fixed effect on age, RW(1) by education, IID by county | 0.397 | 0.313 | 0.45 |
| Non-Spatial | Plumas | fixed effect on age, RW(1) by education, IID by county | 0.446 | 0.397 | 0.473 |
| Non-Spatial | Plumas | fixed effect on age, fixed effect on education, IID by county | 0.396 | 0.304 | 0.447 |
| Non-Spatial | Plumas | fixed effect on age, fixed effect on education, IID by county | 0.444 | 0.395 | 0.474 |
| Non-Spatial | Riverside | CDC reported count | 0.579 | 0.579 | 0.579 |
| Non-Spatial | Riverside | direct survey estimate | 0.849 | 0.832 | 0.867 |
| Non-Spatial | Riverside | fixed effect on age, RW(1) by education, IID by county | 0.415 | 0.4 | 0.427 |
| Non-Spatial | Riverside | fixed effect on age, RW(1) by education, IID by county | 0.434 | 0.423 | 0.444 |
| Non-Spatial | Riverside | fixed effect on age, fixed effect on education, IID by county | 0.413 | 0.399 | 0.426 |
| Non-Spatial | Riverside | fixed effect on age, fixed effect on education, IID by county | 0.432 | 0.421 | 0.441 |
| Non-Spatial | Sacramento | CDC reported count | 0.654 | 0.654 | 0.654 |
| Non-Spatial | Sacramento | direct survey estimate | 0.857 | 0.837 | 0.878 |
| Non-Spatial | Sacramento | fixed effect on age, RW(1) by education, IID by county | 0.408 | 0.391 | 0.422 |
| Non-Spatial | Sacramento | fixed effect on age, RW(1) by education, IID by county | 0.451 | 0.438 | 0.462 |
| Non-Spatial | Sacramento | fixed effect on age, fixed effect on education, IID by county | 0.407 | 0.39 | 0.42 |
| Non-Spatial | Sacramento | fixed effect on age, fixed effect on education, IID by county | 0.449 | 0.437 | 0.46 |
| Non-Spatial | San Benito | CDC reported count | 0.647 | 0.647 | 0.647 |
| Non-Spatial | San Benito | direct survey estimate | 0.903 | 0.786 | 1.019 |
| Non-Spatial | San Benito | fixed effect on age, RW(1) by education, IID by county | 0.439 | 0.379 | 0.471 |
| Non-Spatial | San Benito | fixed effect on age, RW(1) by education, IID by county | 0.456 | 0.421 | 0.477 |
| Non-Spatial | San Benito | fixed effect on age, fixed effect on education, IID by county | 0.438 | 0.372 | 0.472 |
| Non-Spatial | San Benito | fixed effect on age, fixed effect on education, IID by county | 0.456 | 0.417 | 0.479 |
| Non-Spatial | San Bernardino | CDC reported count | 0.56 | 0.56 | 0.56 |
| Non-Spatial | San Bernardino | direct survey estimate | 0.796 | 0.77 | 0.822 |
| Non-Spatial | San Bernardino | fixed effect on age, RW(1) by education, IID by county | 0.391 | 0.37 | 0.408 |
| Non-Spatial | San Bernardino | fixed effect on age, RW(1) by education, IID by county | 0.415 | 0.4 | 0.427 |
| Non-Spatial | San Bernardino | fixed effect on age, fixed effect on education, IID by county | 0.389 | 0.37 | 0.406 |
| Non-Spatial | San Bernardino | fixed effect on age, fixed effect on education, IID by county | 0.412 | 0.4 | 0.424 |
| Non-Spatial | San Diego | CDC reported count | 1.029 | 1.029 | 1.029 |
| Non-Spatial | San Diego | direct survey estimate | 0.879 | 0.864 | 0.895 |
| Non-Spatial | San Diego | fixed effect on age, RW(1) by education, IID by county | 0.437 | 0.424 | 0.448 |
| Non-Spatial | San Diego | fixed effect on age, RW(1) by education, IID by county | 0.449 | 0.441 | 0.457 |
| Non-Spatial | San Diego | fixed effect on age, fixed effect on education, IID by county | 0.436 | 0.425 | 0.447 |
| Non-Spatial | San Diego | fixed effect on age, fixed effect on education, IID by county | 0.448 | 0.441 | 0.455 |
| Non-Spatial | San Francisco | CDC reported count | 0.832 | 0.832 | 0.832 |
| Non-Spatial | San Francisco | direct survey estimate | 0.96 | 0.948 | 0.972 |
| Non-Spatial | San Francisco | fixed effect on age, RW(1) by education, IID by county | 0.489 | 0.481 | 0.496 |
| Non-Spatial | San Francisco | fixed effect on age, RW(1) by education, IID by county | 0.47 | 0.462 | 0.476 |
| Non-Spatial | San Francisco | fixed effect on age, fixed effect on education, IID by county | 0.489 | 0.481 | 0.495 |
| Non-Spatial | San Francisco | fixed effect on age, fixed effect on education, IID by county | 0.469 | 0.461 | 0.475 |
| Non-Spatial | San Joaquin | CDC reported count | 0.671 | 0.671 | 0.671 |
| Non-Spatial | San Joaquin | direct survey estimate | 0.839 | 0.811 | 0.866 |
| Non-Spatial | San Joaquin | fixed effect on age, RW(1) by education, IID by county | 0.399 | 0.377 | 0.418 |
| Non-Spatial | San Joaquin | fixed effect on age, RW(1) by education, IID by county | 0.435 | 0.42 | 0.447 |
| Non-Spatial | San Joaquin | fixed effect on age, fixed effect on education, IID by county | 0.397 | 0.375 | 0.417 |
| Non-Spatial | San Joaquin | fixed effect on age, fixed effect on education, IID by county | 0.432 | 0.417 | 0.444 |
| Non-Spatial | San Luis Obispo | CDC reported count | 0.602 | 0.602 | 0.602 |
| Non-Spatial | San Luis Obispo | direct survey estimate | 0.843 | 0.801 | 0.885 |
| Non-Spatial | San Luis Obispo | fixed effect on age, RW(1) by education, IID by county | 0.412 | 0.381 | 0.438 |
| Non-Spatial | San Luis Obispo | fixed effect on age, RW(1) by education, IID by county | 0.437 | 0.419 | 0.45 |
| Non-Spatial | San Luis Obispo | fixed effect on age, fixed effect on education, IID by county | 0.412 | 0.382 | 0.437 |
| Non-Spatial | San Luis Obispo | fixed effect on age, fixed effect on education, IID by county | 0.436 | 0.418 | 0.449 |
| Non-Spatial | San Mateo | CDC reported count | 0.849 | 0.849 | 0.849 |
| Non-Spatial | San Mateo | direct survey estimate | 0.958 | 0.944 | 0.973 |
| Non-Spatial | San Mateo | fixed effect on age, RW(1) by education, IID by county | 0.472 | 0.461 | 0.479 |
| Non-Spatial | San Mateo | fixed effect on age, RW(1) by education, IID by county | 0.486 | 0.478 | 0.492 |
| Non-Spatial | San Mateo | fixed effect on age, fixed effect on education, IID by county | 0.472 | 0.462 | 0.478 |
| Non-Spatial | San Mateo | fixed effect on age, fixed effect on education, IID by county | 0.486 | 0.477 | 0.491 |
| Non-Spatial | Santa Barbara | CDC reported count | 0.712 | 0.712 | 0.712 |
| Non-Spatial | Santa Barbara | direct survey estimate | 0.903 | 0.877 | 0.928 |
| Non-Spatial | Santa Barbara | fixed effect on age, RW(1) by education, IID by county | 0.439 | 0.414 | 0.456 |
| Non-Spatial | Santa Barbara | fixed effect on age, RW(1) by education, IID by county | 0.449 | 0.432 | 0.462 |
| Non-Spatial | Santa Barbara | fixed effect on age, fixed effect on education, IID by county | 0.44 | 0.416 | 0.458 |
| Non-Spatial | Santa Barbara | fixed effect on age, fixed effect on education, IID by county | 0.449 | 0.432 | 0.462 |
| Non-Spatial | Santa Clara | CDC reported count | 0.864 | 0.864 | 0.864 |
| Non-Spatial | Santa Clara | direct survey estimate | 0.935 | 0.922 | 0.948 |
| Non-Spatial | Santa Clara | fixed effect on age, RW(1) by education, IID by county | 0.47 | 0.46 | 0.478 |
| Non-Spatial | Santa Clara | fixed effect on age, RW(1) by education, IID by county | 0.464 | 0.456 | 0.471 |
| Non-Spatial | Santa Clara | fixed effect on age, fixed effect on education, IID by county | 0.47 | 0.46 | 0.477 |
| Non-Spatial | Santa Clara | fixed effect on age, fixed effect on education, IID by county | 0.464 | 0.457 | 0.47 |
| Non-Spatial | Santa Cruz | CDC reported count | 0.773 | 0.773 | 0.773 |
| Non-Spatial | Santa Cruz | direct survey estimate | 0.914 | 0.882 | 0.947 |
| Non-Spatial | Santa Cruz | fixed effect on age, RW(1) by education, IID by county | 0.443 | 0.419 | 0.461 |
| Non-Spatial | Santa Cruz | fixed effect on age, RW(1) by education, IID by county | 0.47 | 0.453 | 0.482 |
| Non-Spatial | Santa Cruz | fixed effect on age, fixed effect on education, IID by county | 0.443 | 0.416 | 0.46 |
| Non-Spatial | Santa Cruz | fixed effect on age, fixed effect on education, IID by county | 0.471 | 0.454 | 0.482 |
| Non-Spatial | Shasta | CDC reported count | 0.504 | 0.504 | 0.504 |
| Non-Spatial | Shasta | direct survey estimate | 0.725 | 0.672 | 0.778 |
| Non-Spatial | Shasta | fixed effect on age, RW(1) by education, IID by county | 0.351 | 0.31 | 0.386 |
| Non-Spatial | Shasta | fixed effect on age, RW(1) by education, IID by county | 0.405 | 0.378 | 0.429 |
| Non-Spatial | Shasta | fixed effect on age, fixed effect on education, IID by county | 0.35 | 0.313 | 0.383 |
| Non-Spatial | Shasta | fixed effect on age, fixed effect on education, IID by county | 0.403 | 0.378 | 0.425 |
| Non-Spatial | Sierra | CDC reported count | 0 | 0 | 0 |
| Non-Spatial | Sierra | direct survey estimate | 0.92 | 0.766 | 1.074 |
| Non-Spatial | Sierra | fixed effect on age, RW(1) by education, IID by county | 0.419 | 0.328 | 0.467 |
| Non-Spatial | Sierra | fixed effect on age, RW(1) by education, IID by county | 0.452 | 0.392 | 0.48 |
| Non-Spatial | Sierra | fixed effect on age, fixed effect on education, IID by county | 0.422 | 0.335 | 0.467 |
| Non-Spatial | Sierra | fixed effect on age, fixed effect on education, IID by county | 0.453 | 0.401 | 0.48 |
| Non-Spatial | Siskiyou | CDC reported count | 0.552 | 0.552 | 0.552 |
| Non-Spatial | Siskiyou | direct survey estimate | 0.726 | 0.644 | 0.808 |
| Non-Spatial | Siskiyou | fixed effect on age, RW(1) by education, IID by county | 0.377 | 0.317 | 0.42 |
| Non-Spatial | Siskiyou | fixed effect on age, RW(1) by education, IID by county | 0.393 | 0.351 | 0.427 |
| Non-Spatial | Siskiyou | fixed effect on age, fixed effect on education, IID by county | 0.376 | 0.312 | 0.419 |
| Non-Spatial | Siskiyou | fixed effect on age, fixed effect on education, IID by county | 0.39 | 0.347 | 0.424 |
| Non-Spatial | Solano | CDC reported count | 0.697 | 0.697 | 0.697 |
| Non-Spatial | Solano | direct survey estimate | 0.87 | 0.84 | 0.901 |
| Non-Spatial | Solano | fixed effect on age, RW(1) by education, IID by county | 0.421 | 0.4 | 0.44 |
| Non-Spatial | Solano | fixed effect on age, RW(1) by education, IID by county | 0.457 | 0.442 | 0.467 |
| Non-Spatial | Solano | fixed effect on age, fixed effect on education, IID by county | 0.421 | 0.398 | 0.437 |
| Non-Spatial | Solano | fixed effect on age, fixed effect on education, IID by county | 0.455 | 0.441 | 0.466 |
| Non-Spatial | Sonoma | CDC reported count | 0.773 | 0.773 | 0.773 |
| Non-Spatial | Sonoma | direct survey estimate | 0.922 | 0.902 | 0.942 |
| Non-Spatial | Sonoma | fixed effect on age, RW(1) by education, IID by county | 0.435 | 0.417 | 0.448 |
| Non-Spatial | Sonoma | fixed effect on age, RW(1) by education, IID by county | 0.478 | 0.467 | 0.487 |
| Non-Spatial | Sonoma | fixed effect on age, fixed effect on education, IID by county | 0.435 | 0.418 | 0.448 |
| Non-Spatial | Sonoma | fixed effect on age, fixed effect on education, IID by county | 0.477 | 0.466 | 0.486 |
| Non-Spatial | Stanislaus | CDC reported count | 0.678 | 0.678 | 0.678 |
| Non-Spatial | Stanislaus | direct survey estimate | 0.785 | 0.749 | 0.821 |
| Non-Spatial | Stanislaus | fixed effect on age, RW(1) by education, IID by county | 0.375 | 0.347 | 0.398 |
| Non-Spatial | Stanislaus | fixed effect on age, RW(1) by education, IID by county | 0.413 | 0.394 | 0.428 |
| Non-Spatial | Stanislaus | fixed effect on age, fixed effect on education, IID by county | 0.375 | 0.35 | 0.396 |
| Non-Spatial | Stanislaus | fixed effect on age, fixed effect on education, IID by county | 0.408 | 0.39 | 0.424 |
| Non-Spatial | Sutter | CDC reported count | 0.594 | 0.594 | 0.594 |
| Non-Spatial | Sutter | direct survey estimate | 0.664 | 0.539 | 0.788 |
| Non-Spatial | Sutter | fixed effect on age, RW(1) by education, IID by county | 0.388 | 0.311 | 0.436 |
| Non-Spatial | Sutter | fixed effect on age, RW(1) by education, IID by county | 0.405 | 0.354 | 0.442 |
| Non-Spatial | Sutter | fixed effect on age, fixed effect on education, IID by county | 0.384 | 0.307 | 0.432 |
| Non-Spatial | Sutter | fixed effect on age, fixed effect on education, IID by county | 0.399 | 0.347 | 0.437 |
| Non-Spatial | Tehama | CDC reported count | 0.408 | 0.408 | 0.408 |
| Non-Spatial | Tehama | direct survey estimate | 0.724 | 0.629 | 0.82 |
| Non-Spatial | Tehama | fixed effect on age, RW(1) by education, IID by county | 0.36 | 0.304 | 0.403 |
| Non-Spatial | Tehama | fixed effect on age, RW(1) by education, IID by county | 0.412 | 0.371 | 0.445 |
| Non-Spatial | Tehama | fixed effect on age, fixed effect on education, IID by county | 0.358 | 0.298 | 0.404 |
| Non-Spatial | Tehama | fixed effect on age, fixed effect on education, IID by county | 0.408 | 0.367 | 0.441 |
| Non-Spatial | Trinity | CDC reported count | 0 | 0 | 0 |
| Non-Spatial | Trinity | direct survey estimate | 0.672 | 0.478 | 0.867 |
| Non-Spatial | Trinity | fixed effect on age, RW(1) by education, IID by county | 0.445 | 0.368 | 0.486 |
| Non-Spatial | Trinity | fixed effect on age, RW(1) by education, IID by county | 0.366 | 0.289 | 0.425 |
| Non-Spatial | Trinity | fixed effect on age, fixed effect on education, IID by county | 0.447 | 0.368 | 0.485 |
| Non-Spatial | Trinity | fixed effect on age, fixed effect on education, IID by county | 0.359 | 0.278 | 0.421 |
| Non-Spatial | Tulare | CDC reported count | 0.536 | 0.536 | 0.536 |
| Non-Spatial | Tulare | direct survey estimate | 0.744 | 0.698 | 0.789 |
| Non-Spatial | Tulare | fixed effect on age, RW(1) by education, IID by county | 0.363 | 0.329 | 0.393 |
| Non-Spatial | Tulare | fixed effect on age, RW(1) by education, IID by county | 0.404 | 0.38 | 0.423 |
| Non-Spatial | Tulare | fixed effect on age, fixed effect on education, IID by county | 0.36 | 0.327 | 0.387 |
| Non-Spatial | Tulare | fixed effect on age, fixed effect on education, IID by county | 0.397 | 0.376 | 0.416 |
| Non-Spatial | Tuolumne | CDC reported count | 0.601 | 0.601 | 0.601 |
| Non-Spatial | Tuolumne | direct survey estimate | 0.8 | 0.719 | 0.881 |
| Non-Spatial | Tuolumne | fixed effect on age, RW(1) by education, IID by county | 0.434 | 0.377 | 0.47 |
| Non-Spatial | Tuolumne | fixed effect on age, RW(1) by education, IID by county | 0.394 | 0.357 | 0.424 |
| Non-Spatial | Tuolumne | fixed effect on age, fixed effect on education, IID by county | 0.43 | 0.373 | 0.467 |
| Non-Spatial | Tuolumne | fixed effect on age, fixed effect on education, IID by county | 0.395 | 0.358 | 0.422 |
| Non-Spatial | Ventura | CDC reported count | 0.727 | 0.727 | 0.727 |
| Non-Spatial | Ventura | direct survey estimate | 0.887 | 0.866 | 0.907 |
| Non-Spatial | Ventura | fixed effect on age, RW(1) by education, IID by county | 0.428 | 0.411 | 0.443 |
| Non-Spatial | Ventura | fixed effect on age, RW(1) by education, IID by county | 0.451 | 0.439 | 0.462 |
| Non-Spatial | Ventura | fixed effect on age, fixed effect on education, IID by county | 0.428 | 0.412 | 0.442 |
| Non-Spatial | Ventura | fixed effect on age, fixed effect on education, IID by county | 0.45 | 0.439 | 0.459 |
| Non-Spatial | Yolo | CDC reported count | 0.69 | 0.69 | 0.69 |
| Non-Spatial | Yolo | direct survey estimate | 0.904 | 0.853 | 0.956 |
| Non-Spatial | Yolo | fixed effect on age, RW(1) by education, IID by county | 0.437 | 0.403 | 0.458 |
| Non-Spatial | Yolo | fixed effect on age, RW(1) by education, IID by county | 0.452 | 0.42 | 0.474 |
| Non-Spatial | Yolo | fixed effect on age, fixed effect on education, IID by county | 0.438 | 0.402 | 0.459 |
| Non-Spatial | Yolo | fixed effect on age, fixed effect on education, IID by county | 0.452 | 0.422 | 0.476 |
| Non-Spatial | Yuba | CDC reported count | 0.51 | 0.51 | 0.51 |
| Non-Spatial | Yuba | direct survey estimate | 0.743 | 0.648 | 0.838 |
| Non-Spatial | Yuba | fixed effect on age, RW(1) by education, IID by county | 0.384 | 0.311 | 0.436 |
| Non-Spatial | Yuba | fixed effect on age, RW(1) by education, IID by county | 0.383 | 0.338 | 0.42 |
| Non-Spatial | Yuba | fixed effect on age, fixed effect on education, IID by county | 0.382 | 0.309 | 0.431 |
| Non-Spatial | Yuba | fixed effect on age, fixed effect on education, IID by county | 0.378 | 0.33 | 0.416 |
| Spatial | Alameda | CDC reported count | 0.815 | 0.815 | 0.815 |
| Spatial | Alameda | direct survey estimate | 0.931 | 0.918 | 0.945 |
| Spatial | Alameda | fixed effect on age, BYM2 by education | 0.428 | 0.421 | 0.435 |
| Spatial | Alameda | fixed effect on age, BYM2 by education | 0.461 | 0.455 | 0.465 |
| Spatial | Alameda | fixed effect on age, RW(1) by education, BYM2 by county | 0.452 | 0.443 | 0.459 |
| Spatial | Alameda | fixed effect on age, RW(1) by education, BYM2 by county | 0.483 | 0.476 | 0.489 |
| Spatial | Alpine | CDC reported count | 0 | 0 | 0 |
| Spatial | Alpine | fixed effect on age, BYM2 by education | 0.467 | 0.459 | 0.472 |
| Spatial | Alpine | fixed effect on age, BYM2 by education | 0.43 | 0.426 | 0.431 |
| Spatial | Alpine | fixed effect on age, RW(1) by education, BYM2 by county | 0.438 | 0.365 | 0.481 |
| Spatial | Alpine | fixed effect on age, RW(1) by education, BYM2 by county | 0.417 | 0.368 | 0.445 |
| Spatial | Amador | CDC reported count | 0.625 | 0.625 | 0.625 |
| Spatial | Amador | direct survey estimate | 0.76 | 0.619 | 0.902 |
| Spatial | Amador | fixed effect on age, BYM2 by education | 0.47 | 0.462 | 0.478 |
| Spatial | Amador | fixed effect on age, BYM2 by education | 0.406 | 0.401 | 0.41 |
| Spatial | Amador | fixed effect on age, RW(1) by education, BYM2 by county | 0.435 | 0.377 | 0.476 |
| Spatial | Amador | fixed effect on age, RW(1) by education, BYM2 by county | 0.395 | 0.357 | 0.42 |
| Spatial | Butte | CDC reported count | 0.513 | 0.513 | 0.513 |
| Spatial | Butte | direct survey estimate | 0.785 | 0.734 | 0.836 |
| Spatial | Butte | fixed effect on age, BYM2 by education | 0.421 | 0.412 | 0.428 |
| Spatial | Butte | fixed effect on age, BYM2 by education | 0.449 | 0.443 | 0.454 |
| Spatial | Butte | fixed effect on age, RW(1) by education, BYM2 by county | 0.369 | 0.333 | 0.399 |
| Spatial | Butte | fixed effect on age, RW(1) by education, BYM2 by county | 0.425 | 0.402 | 0.444 |
| Spatial | Calaveras | CDC reported count | 0.6 | 0.6 | 0.6 |
| Spatial | Calaveras | direct survey estimate | 0.818 | 0.742 | 0.894 |
| Spatial | Calaveras | fixed effect on age, BYM2 by education | 0.432 | 0.424 | 0.439 |
| Spatial | Calaveras | fixed effect on age, BYM2 by education | 0.446 | 0.441 | 0.451 |
| Spatial | Calaveras | fixed effect on age, RW(1) by education, BYM2 by county | 0.377 | 0.322 | 0.419 |
| Spatial | Calaveras | fixed effect on age, RW(1) by education, BYM2 by county | 0.439 | 0.406 | 0.462 |
| Spatial | Colusa | CDC reported count | 0.611 | 0.611 | 0.611 |
| Spatial | Colusa | direct survey estimate | 0.825 | 0.65 | 1 |
| Spatial | Colusa | fixed effect on age, BYM2 by education | 0.436 | 0.426 | 0.444 |
| Spatial | Colusa | fixed effect on age, BYM2 by education | 0.428 | 0.421 | 0.433 |
| Spatial | Colusa | fixed effect on age, RW(1) by education, BYM2 by county | 0.391 | 0.311 | 0.442 |
| Spatial | Colusa | fixed effect on age, RW(1) by education, BYM2 by county | 0.414 | 0.365 | 0.447 |
| Spatial | Contra Costa | CDC reported count | 0.791 | 0.791 | 0.791 |
| Spatial | Contra Costa | direct survey estimate | 0.92 | 0.907 | 0.934 |
| Spatial | Contra Costa | fixed effect on age, BYM2 by education | 0.423 | 0.416 | 0.429 |
| Spatial | Contra Costa | fixed effect on age, BYM2 by education | 0.463 | 0.458 | 0.468 |
| Spatial | Contra Costa | fixed effect on age, RW(1) by education, BYM2 by county | 0.446 | 0.435 | 0.454 |
| Spatial | Contra Costa | fixed effect on age, RW(1) by education, BYM2 by county | 0.478 | 0.469 | 0.485 |
| Spatial | Del Norte | CDC reported count | 0.403 | 0.403 | 0.403 |
| Spatial | Del Norte | direct survey estimate | 0.668 | 0.528 | 0.808 |
| Spatial | Del Norte | fixed effect on age, BYM2 by education | 0.463 | 0.453 | 0.471 |
| Spatial | Del Norte | fixed effect on age, BYM2 by education | 0.404 | 0.398 | 0.409 |
| Spatial | Del Norte | fixed effect on age, RW(1) by education, BYM2 by county | 0.374 | 0.278 | 0.445 |
| Spatial | Del Norte | fixed effect on age, RW(1) by education, BYM2 by county | 0.352 | 0.3 | 0.39 |
| Spatial | El Dorado | CDC reported count | 0.627 | 0.627 | 0.627 |
| Spatial | El Dorado | direct survey estimate | 0.79 | 0.722 | 0.859 |
| Spatial | El Dorado | fixed effect on age, BYM2 by education | 0.433 | 0.425 | 0.439 |
| Spatial | El Dorado | fixed effect on age, BYM2 by education | 0.452 | 0.447 | 0.457 |
| Spatial | El Dorado | fixed effect on age, RW(1) by education, BYM2 by county | 0.394 | 0.352 | 0.427 |
| Spatial | El Dorado | fixed effect on age, RW(1) by education, BYM2 by county | 0.433 | 0.404 | 0.454 |
| Spatial | Fresno | CDC reported count | 0.632 | 0.632 | 0.632 |
| Spatial | Fresno | direct survey estimate | 0.81 | 0.781 | 0.839 |
| Spatial | Fresno | fixed effect on age, BYM2 by education | 0.423 | 0.414 | 0.431 |
| Spatial | Fresno | fixed effect on age, BYM2 by education | 0.444 | 0.437 | 0.449 |
| Spatial | Fresno | fixed effect on age, RW(1) by education, BYM2 by county | 0.399 | 0.378 | 0.417 |
| Spatial | Fresno | fixed effect on age, RW(1) by education, BYM2 by county | 0.425 | 0.411 | 0.438 |
| Spatial | Glenn | CDC reported count | 0.539 | 0.539 | 0.539 |
| Spatial | Glenn | direct survey estimate | 0.79 | 0.632 | 0.947 |
| Spatial | Glenn | fixed effect on age, BYM2 by education | 0.431 | 0.421 | 0.439 |
| Spatial | Glenn | fixed effect on age, BYM2 by education | 0.434 | 0.428 | 0.44 |
| Spatial | Glenn | fixed effect on age, RW(1) by education, BYM2 by county | 0.396 | 0.329 | 0.44 |
| Spatial | Glenn | fixed effect on age, RW(1) by education, BYM2 by county | 0.401 | 0.345 | 0.44 |
| Spatial | Humboldt | CDC reported count | 0.631 | 0.631 | 0.631 |
| Spatial | Humboldt | direct survey estimate | 0.861 | 0.82 | 0.903 |
| Spatial | Humboldt | fixed effect on age, BYM2 by education | 0.425 | 0.417 | 0.433 |
| Spatial | Humboldt | fixed effect on age, BYM2 by education | 0.447 | 0.441 | 0.452 |
| Spatial | Humboldt | fixed effect on age, RW(1) by education, BYM2 by county | 0.398 | 0.363 | 0.427 |
| Spatial | Humboldt | fixed effect on age, RW(1) by education, BYM2 by county | 0.437 | 0.414 | 0.455 |
| Spatial | Imperial | CDC reported count | 0.803 | 0.803 | 0.803 |
| Spatial | Imperial | direct survey estimate | 0.854 | 0.795 | 0.912 |
| Spatial | Imperial | fixed effect on age, BYM2 by education | 0.438 | 0.428 | 0.446 |
| Spatial | Imperial | fixed effect on age, BYM2 by education | 0.424 | 0.418 | 0.43 |
| Spatial | Imperial | fixed effect on age, RW(1) by education, BYM2 by county | 0.444 | 0.393 | 0.477 |
| Spatial | Imperial | fixed effect on age, RW(1) by education, BYM2 by county | 0.415 | 0.385 | 0.436 |
| Spatial | Inyo | CDC reported count | 0 | 0 | 0 |
| Spatial | Inyo | direct survey estimate | 0.924 | 0.806 | 1.042 |
| Spatial | Inyo | fixed effect on age, BYM2 by education | 0.433 | 0.426 | 0.44 |
| Spatial | Inyo | fixed effect on age, BYM2 by education | 0.446 | 0.44 | 0.451 |
| Spatial | Inyo | fixed effect on age, RW(1) by education, BYM2 by county | 0.404 | 0.341 | 0.447 |
| Spatial | Inyo | fixed effect on age, RW(1) by education, BYM2 by county | 0.442 | 0.402 | 0.468 |
| Spatial | Kern | CDC reported count | 0.518 | 0.518 | 0.518 |
| Spatial | Kern | direct survey estimate | 0.765 | 0.733 | 0.798 |
| Spatial | Kern | fixed effect on age, BYM2 by education | 0.437 | 0.427 | 0.445 |
| Spatial | Kern | fixed effect on age, BYM2 by education | 0.424 | 0.418 | 0.429 |
| Spatial | Kern | fixed effect on age, RW(1) by education, BYM2 by county | 0.385 | 0.359 | 0.408 |
| Spatial | Kern | fixed effect on age, RW(1) by education, BYM2 by county | 0.386 | 0.37 | 0.401 |
| Spatial | Kings | CDC reported count | 0.45 | 0.45 | 0.45 |
| Spatial | Kings | direct survey estimate | 0.756 | 0.684 | 0.828 |
| Spatial | Kings | fixed effect on age, BYM2 by education | 0.478 | 0.468 | 0.488 |
| Spatial | Kings | fixed effect on age, BYM2 by education | 0.379 | 0.373 | 0.384 |
| Spatial | Kings | fixed effect on age, RW(1) by education, BYM2 by county | 0.427 | 0.372 | 0.468 |
| Spatial | Kings | fixed effect on age, RW(1) by education, BYM2 by county | 0.342 | 0.311 | 0.366 |
| Spatial | Lake | CDC reported count | 0.576 | 0.576 | 0.576 |
| Spatial | Lake | direct survey estimate | 0.716 | 0.63 | 0.802 |
| Spatial | Lake | fixed effect on age, BYM2 by education | 0.428 | 0.419 | 0.435 |
| Spatial | Lake | fixed effect on age, BYM2 by education | 0.445 | 0.44 | 0.451 |
| Spatial | Lake | fixed effect on age, RW(1) by education, BYM2 by county | 0.392 | 0.35 | 0.425 |
| Spatial | Lake | fixed effect on age, RW(1) by education, BYM2 by county | 0.415 | 0.384 | 0.44 |
| Spatial | Lassen | CDC reported count | 0.332 | 0.332 | 0.332 |
| Spatial | Lassen | direct survey estimate | 0.822 | 0.711 | 0.933 |
| Spatial | Lassen | fixed effect on age, BYM2 by education | 0.576 | 0.563 | 0.588 |
| Spatial | Lassen | fixed effect on age, BYM2 by education | 0.279 | 0.276 | 0.282 |
| Spatial | Lassen | fixed effect on age, RW(1) by education, BYM2 by county | 0.498 | 0.399 | 0.573 |
| Spatial | Lassen | fixed effect on age, RW(1) by education, BYM2 by county | 0.25 | 0.215 | 0.274 |
| Spatial | Los Angeles | CDC reported count | 0.699 | 0.699 | 0.699 |
| Spatial | Los Angeles | direct survey estimate | 0.891 | 0.882 | 0.9 |
| Spatial | Los Angeles | fixed effect on age, BYM2 by education | 0.422 | 0.415 | 0.43 |
| Spatial | Los Angeles | fixed effect on age, BYM2 by education | 0.454 | 0.448 | 0.459 |
| Spatial | Los Angeles | fixed effect on age, RW(1) by education, BYM2 by county | 0.43 | 0.421 | 0.438 |
| Spatial | Los Angeles | fixed effect on age, RW(1) by education, BYM2 by county | 0.466 | 0.459 | 0.472 |
| Spatial | Madera | CDC reported count | 0.559 | 0.559 | 0.559 |
| Spatial | Madera | direct survey estimate | 0.818 | 0.762 | 0.874 |
| Spatial | Madera | fixed effect on age, BYM2 by education | 0.404 | 0.395 | 0.412 |
| Spatial | Madera | fixed effect on age, BYM2 by education | 0.46 | 0.453 | 0.466 |
| Spatial | Madera | fixed effect on age, RW(1) by education, BYM2 by county | 0.363 | 0.316 | 0.399 |
| Spatial | Madera | fixed effect on age, RW(1) by education, BYM2 by county | 0.439 | 0.409 | 0.464 |
| Spatial | Marin | CDC reported count | 0.891 | 0.891 | 0.891 |
| Spatial | Marin | direct survey estimate | 0.966 | 0.943 | 0.989 |
| Spatial | Marin | fixed effect on age, BYM2 by education | 0.432 | 0.426 | 0.438 |
| Spatial | Marin | fixed effect on age, BYM2 by education | 0.471 | 0.466 | 0.475 |
| Spatial | Marin | fixed effect on age, RW(1) by education, BYM2 by county | 0.461 | 0.445 | 0.471 |
| Spatial | Marin | fixed effect on age, RW(1) by education, BYM2 by county | 0.498 | 0.487 | 0.506 |
| Spatial | Mariposa | CDC reported count | 0 | 0 | 0 |
| Spatial | Mariposa | direct survey estimate | 0.785 | 0.604 | 0.966 |
| Spatial | Mariposa | fixed effect on age, BYM2 by education | 0.45 | 0.442 | 0.456 |
| Spatial | Mariposa | fixed effect on age, BYM2 by education | 0.435 | 0.429 | 0.439 |
| Spatial | Mariposa | fixed effect on age, RW(1) by education, BYM2 by county | 0.417 | 0.351 | 0.463 |
| Spatial | Mariposa | fixed effect on age, RW(1) by education, BYM2 by county | 0.42 | 0.374 | 0.449 |
| Spatial | Mendocino | CDC reported count | 0.67 | 0.67 | 0.67 |
| Spatial | Mendocino | direct survey estimate | 0.832 | 0.755 | 0.91 |
| Spatial | Mendocino | fixed effect on age, BYM2 by education | 0.425 | 0.417 | 0.432 |
| Spatial | Mendocino | fixed effect on age, BYM2 by education | 0.451 | 0.445 | 0.456 |
| Spatial | Mendocino | fixed effect on age, RW(1) by education, BYM2 by county | 0.396 | 0.354 | 0.428 |
| Spatial | Mendocino | fixed effect on age, RW(1) by education, BYM2 by county | 0.447 | 0.421 | 0.467 |
| Spatial | Merced | CDC reported count | 0.532 | 0.532 | 0.532 |
| Spatial | Merced | direct survey estimate | 0.76 | 0.702 | 0.818 |
| Spatial | Merced | fixed effect on age, BYM2 by education | 0.425 | 0.416 | 0.433 |
| Spatial | Merced | fixed effect on age, BYM2 by education | 0.434 | 0.428 | 0.44 |
| Spatial | Merced | fixed effect on age, RW(1) by education, BYM2 by county | 0.393 | 0.358 | 0.422 |
| Spatial | Merced | fixed effect on age, RW(1) by education, BYM2 by county | 0.398 | 0.372 | 0.419 |
| Spatial | Modoc | CDC reported count | 0 | 0 | 0 |
| Spatial | Modoc | direct survey estimate | 0.918 | 0.806 | 1.029 |
| Spatial | Modoc | fixed effect on age, BYM2 by education | 0.446 | 0.438 | 0.453 |
| Spatial | Modoc | fixed effect on age, BYM2 by education | 0.432 | 0.426 | 0.436 |
| Spatial | Modoc | fixed effect on age, RW(1) by education, BYM2 by county | 0.402 | 0.302 | 0.461 |
| Spatial | Modoc | fixed effect on age, RW(1) by education, BYM2 by county | 0.396 | 0.334 | 0.441 |
| Spatial | Mono | CDC reported count | 0 | 0 | 0 |
| Spatial | Mono | direct survey estimate | 0.898 | 0.762 | 1.033 |
| Spatial | Mono | fixed effect on age, BYM2 by education | 0.455 | 0.447 | 0.463 |
| Spatial | Mono | fixed effect on age, BYM2 by education | 0.417 | 0.412 | 0.422 |
| Spatial | Mono | fixed effect on age, RW(1) by education, BYM2 by county | 0.425 | 0.356 | 0.474 |
| Spatial | Mono | fixed effect on age, RW(1) by education, BYM2 by county | 0.409 | 0.367 | 0.435 |
| Spatial | Monterey | CDC reported count | 0.723 | 0.723 | 0.723 |
| Spatial | Monterey | direct survey estimate | 0.867 | 0.823 | 0.911 |
| Spatial | Monterey | fixed effect on age, BYM2 by education | 0.437 | 0.428 | 0.445 |
| Spatial | Monterey | fixed effect on age, BYM2 by education | 0.433 | 0.427 | 0.438 |
| Spatial | Monterey | fixed effect on age, RW(1) by education, BYM2 by county | 0.449 | 0.426 | 0.467 |
| Spatial | Monterey | fixed effect on age, RW(1) by education, BYM2 by county | 0.441 | 0.424 | 0.454 |
| Spatial | Napa | CDC reported count | 0.795 | 0.795 | 0.795 |
| Spatial | Napa | direct survey estimate | 0.901 | 0.861 | 0.941 |
| Spatial | Napa | fixed effect on age, BYM2 by education | 0.431 | 0.423 | 0.438 |
| Spatial | Napa | fixed effect on age, BYM2 by education | 0.451 | 0.446 | 0.456 |
| Spatial | Napa | fixed effect on age, RW(1) by education, BYM2 by county | 0.439 | 0.41 | 0.46 |
| Spatial | Napa | fixed effect on age, RW(1) by education, BYM2 by county | 0.458 | 0.438 | 0.474 |
| Spatial | Nevada | CDC reported count | 0.614 | 0.614 | 0.614 |
| Spatial | Nevada | direct survey estimate | 0.883 | 0.811 | 0.956 |
| Spatial | Nevada | fixed effect on age, BYM2 by education | 0.429 | 0.422 | 0.436 |
| Spatial | Nevada | fixed effect on age, BYM2 by education | 0.461 | 0.456 | 0.466 |
| Spatial | Nevada | fixed effect on age, RW(1) by education, BYM2 by county | 0.425 | 0.381 | 0.454 |
| Spatial | Nevada | fixed effect on age, RW(1) by education, BYM2 by county | 0.45 | 0.412 | 0.472 |
| Spatial | Orange | CDC reported count | 0.717 | 0.717 | 0.717 |
| Spatial | Orange | direct survey estimate | 0.896 | 0.881 | 0.91 |
| Spatial | Orange | fixed effect on age, BYM2 by education | 0.427 | 0.419 | 0.433 |
| Spatial | Orange | fixed effect on age, BYM2 by education | 0.456 | 0.45 | 0.461 |
| Spatial | Orange | fixed effect on age, RW(1) by education, BYM2 by county | 0.432 | 0.42 | 0.442 |
| Spatial | Orange | fixed effect on age, RW(1) by education, BYM2 by county | 0.459 | 0.45 | 0.467 |
| Spatial | Placer | CDC reported count | 0.67 | 0.67 | 0.67 |
| Spatial | Placer | direct survey estimate | 0.806 | 0.749 | 0.863 |
| Spatial | Placer | fixed effect on age, BYM2 by education | 0.423 | 0.417 | 0.43 |
| Spatial | Placer | fixed effect on age, BYM2 by education | 0.464 | 0.459 | 0.469 |
| Spatial | Placer | fixed effect on age, RW(1) by education, BYM2 by county | 0.394 | 0.364 | 0.417 |
| Spatial | Placer | fixed effect on age, RW(1) by education, BYM2 by county | 0.446 | 0.425 | 0.463 |
| Spatial | Plumas | CDC reported count | 0 | 0 | 0 |
| Spatial | Plumas | direct survey estimate | 0.772 | 0.602 | 0.942 |
| Spatial | Plumas | fixed effect on age, BYM2 by education | 0.436 | 0.428 | 0.443 |
| Spatial | Plumas | fixed effect on age, BYM2 by education | 0.446 | 0.441 | 0.451 |
| Spatial | Plumas | fixed effect on age, RW(1) by education, BYM2 by county | 0.379 | 0.315 | 0.425 |
| Spatial | Plumas | fixed effect on age, RW(1) by education, BYM2 by county | 0.424 | 0.382 | 0.456 |
| Spatial | Riverside | CDC reported count | 0.579 | 0.579 | 0.579 |
| Spatial | Riverside | direct survey estimate | 0.849 | 0.832 | 0.867 |
| Spatial | Riverside | fixed effect on age, BYM2 by education | 0.424 | 0.416 | 0.432 |
| Spatial | Riverside | fixed effect on age, BYM2 by education | 0.444 | 0.438 | 0.449 |
| Spatial | Riverside | fixed effect on age, RW(1) by education, BYM2 by county | 0.415 | 0.399 | 0.428 |
| Spatial | Riverside | fixed effect on age, RW(1) by education, BYM2 by county | 0.434 | 0.423 | 0.444 |
| Spatial | Sacramento | CDC reported count | 0.654 | 0.654 | 0.654 |
| Spatial | Sacramento | direct survey estimate | 0.857 | 0.837 | 0.878 |
| Spatial | Sacramento | fixed effect on age, BYM2 by education | 0.417 | 0.41 | 0.424 |
| Spatial | Sacramento | fixed effect on age, BYM2 by education | 0.459 | 0.453 | 0.464 |
| Spatial | Sacramento | fixed effect on age, RW(1) by education, BYM2 by county | 0.408 | 0.391 | 0.421 |
| Spatial | Sacramento | fixed effect on age, RW(1) by education, BYM2 by county | 0.451 | 0.439 | 0.462 |
| Spatial | San Benito | CDC reported count | 0.647 | 0.647 | 0.647 |
| Spatial | San Benito | direct survey estimate | 0.903 | 0.786 | 1.019 |
| Spatial | San Benito | fixed effect on age, BYM2 by education | 0.428 | 0.419 | 0.435 |
| Spatial | San Benito | fixed effect on age, BYM2 by education | 0.438 | 0.432 | 0.443 |
| Spatial | San Benito | fixed effect on age, RW(1) by education, BYM2 by county | 0.438 | 0.396 | 0.467 |
| Spatial | San Benito | fixed effect on age, RW(1) by education, BYM2 by county | 0.455 | 0.421 | 0.474 |
| Spatial | San Bernardino | CDC reported count | 0.56 | 0.56 | 0.56 |
| Spatial | San Bernardino | direct survey estimate | 0.796 | 0.77 | 0.822 |
| Spatial | San Bernardino | fixed effect on age, BYM2 by education | 0.421 | 0.412 | 0.429 |
| Spatial | San Bernardino | fixed effect on age, BYM2 by education | 0.444 | 0.437 | 0.449 |
| Spatial | San Bernardino | fixed effect on age, RW(1) by education, BYM2 by county | 0.392 | 0.372 | 0.409 |
| Spatial | San Bernardino | fixed effect on age, RW(1) by education, BYM2 by county | 0.416 | 0.402 | 0.428 |
| Spatial | San Diego | CDC reported count | 1.029 | 1.029 | 1.029 |
| Spatial | San Diego | direct survey estimate | 0.879 | 0.864 | 0.895 |
| Spatial | San Diego | fixed effect on age, BYM2 by education | 0.436 | 0.428 | 0.443 |
| Spatial | San Diego | fixed effect on age, BYM2 by education | 0.444 | 0.438 | 0.448 |
| Spatial | San Diego | fixed effect on age, RW(1) by education, BYM2 by county | 0.437 | 0.424 | 0.448 |
| Spatial | San Diego | fixed effect on age, RW(1) by education, BYM2 by county | 0.449 | 0.441 | 0.457 |
| Spatial | San Francisco | CDC reported count | 0.832 | 0.832 | 0.832 |
| Spatial | San Francisco | direct survey estimate | 0.96 | 0.948 | 0.972 |
| Spatial | San Francisco | fixed effect on age, BYM2 by education | 0.455 | 0.449 | 0.461 |
| Spatial | San Francisco | fixed effect on age, BYM2 by education | 0.445 | 0.441 | 0.45 |
| Spatial | San Francisco | fixed effect on age, RW(1) by education, BYM2 by county | 0.491 | 0.483 | 0.496 |
| Spatial | San Francisco | fixed effect on age, RW(1) by education, BYM2 by county | 0.471 | 0.463 | 0.476 |
| Spatial | San Joaquin | CDC reported count | 0.671 | 0.671 | 0.671 |
| Spatial | San Joaquin | direct survey estimate | 0.839 | 0.811 | 0.866 |
| Spatial | San Joaquin | fixed effect on age, BYM2 by education | 0.42 | 0.412 | 0.428 |
| Spatial | San Joaquin | fixed effect on age, BYM2 by education | 0.444 | 0.438 | 0.45 |
| Spatial | San Joaquin | fixed effect on age, RW(1) by education, BYM2 by county | 0.401 | 0.379 | 0.419 |
| Spatial | San Joaquin | fixed effect on age, RW(1) by education, BYM2 by county | 0.435 | 0.421 | 0.448 |
| Spatial | San Luis Obispo | CDC reported count | 0.602 | 0.602 | 0.602 |
| Spatial | San Luis Obispo | direct survey estimate | 0.843 | 0.801 | 0.885 |
| Spatial | San Luis Obispo | fixed effect on age, BYM2 by education | 0.437 | 0.428 | 0.444 |
| Spatial | San Luis Obispo | fixed effect on age, BYM2 by education | 0.438 | 0.432 | 0.443 |
| Spatial | San Luis Obispo | fixed effect on age, RW(1) by education, BYM2 by county | 0.412 | 0.382 | 0.437 |
| Spatial | San Luis Obispo | fixed effect on age, RW(1) by education, BYM2 by county | 0.435 | 0.418 | 0.449 |
| Spatial | San Mateo | CDC reported count | 0.849 | 0.849 | 0.849 |
| Spatial | San Mateo | direct survey estimate | 0.958 | 0.944 | 0.973 |
| Spatial | San Mateo | fixed effect on age, BYM2 by education | 0.434 | 0.427 | 0.44 |
| Spatial | San Mateo | fixed effect on age, BYM2 by education | 0.461 | 0.456 | 0.465 |
| Spatial | San Mateo | fixed effect on age, RW(1) by education, BYM2 by county | 0.472 | 0.463 | 0.479 |
| Spatial | San Mateo | fixed effect on age, RW(1) by education, BYM2 by county | 0.487 | 0.48 | 0.493 |
| Spatial | Santa Barbara | CDC reported count | 0.712 | 0.712 | 0.712 |
| Spatial | Santa Barbara | direct survey estimate | 0.903 | 0.877 | 0.928 |
| Spatial | Santa Barbara | fixed effect on age, BYM2 by education | 0.429 | 0.42 | 0.437 |
| Spatial | Santa Barbara | fixed effect on age, BYM2 by education | 0.442 | 0.435 | 0.447 |
| Spatial | Santa Barbara | fixed effect on age, RW(1) by education, BYM2 by county | 0.437 | 0.413 | 0.456 |
| Spatial | Santa Barbara | fixed effect on age, RW(1) by education, BYM2 by county | 0.448 | 0.431 | 0.461 |
| Spatial | Santa Clara | CDC reported count | 0.864 | 0.864 | 0.864 |
| Spatial | Santa Clara | direct survey estimate | 0.935 | 0.922 | 0.948 |
| Spatial | Santa Clara | fixed effect on age, BYM2 by education | 0.447 | 0.44 | 0.453 |
| Spatial | Santa Clara | fixed effect on age, BYM2 by education | 0.446 | 0.441 | 0.451 |
| Spatial | Santa Clara | fixed effect on age, RW(1) by education, BYM2 by county | 0.469 | 0.46 | 0.477 |
| Spatial | Santa Clara | fixed effect on age, RW(1) by education, BYM2 by county | 0.464 | 0.457 | 0.471 |
| Spatial | Santa Cruz | CDC reported count | 0.773 | 0.773 | 0.773 |
| Spatial | Santa Cruz | direct survey estimate | 0.914 | 0.882 | 0.947 |
| Spatial | Santa Cruz | fixed effect on age, BYM2 by education | 0.426 | 0.418 | 0.433 |
| Spatial | Santa Cruz | fixed effect on age, BYM2 by education | 0.45 | 0.445 | 0.456 |
| Spatial | Santa Cruz | fixed effect on age, RW(1) by education, BYM2 by county | 0.447 | 0.426 | 0.463 |
| Spatial | Santa Cruz | fixed effect on age, RW(1) by education, BYM2 by county | 0.472 | 0.456 | 0.484 |
| Spatial | Shasta | CDC reported count | 0.504 | 0.504 | 0.504 |
| Spatial | Shasta | direct survey estimate | 0.725 | 0.672 | 0.778 |
| Spatial | Shasta | fixed effect on age, BYM2 by education | 0.42 | 0.412 | 0.427 |
| Spatial | Shasta | fixed effect on age, BYM2 by education | 0.455 | 0.449 | 0.46 |
| Spatial | Shasta | fixed effect on age, RW(1) by education, BYM2 by county | 0.349 | 0.309 | 0.381 |
| Spatial | Shasta | fixed effect on age, RW(1) by education, BYM2 by county | 0.402 | 0.376 | 0.425 |
| Spatial | Sierra | CDC reported count | 0 | 0 | 0 |
| Spatial | Sierra | direct survey estimate | 0.92 | 0.766 | 1.074 |
| Spatial | Sierra | fixed effect on age, BYM2 by education | 0.433 | 0.427 | 0.44 |
| Spatial | Sierra | fixed effect on age, BYM2 by education | 0.447 | 0.443 | 0.452 |
| Spatial | Sierra | fixed effect on age, RW(1) by education, BYM2 by county | 0.397 | 0.315 | 0.447 |
| Spatial | Sierra | fixed effect on age, RW(1) by education, BYM2 by county | 0.426 | 0.371 | 0.464 |
| Spatial | Siskiyou | CDC reported count | 0.552 | 0.552 | 0.552 |
| Spatial | Siskiyou | direct survey estimate | 0.726 | 0.644 | 0.808 |
| Spatial | Siskiyou | fixed effect on age, BYM2 by education | 0.428 | 0.421 | 0.435 |
| Spatial | Siskiyou | fixed effect on age, BYM2 by education | 0.45 | 0.444 | 0.455 |
| Spatial | Siskiyou | fixed effect on age, RW(1) by education, BYM2 by county | 0.368 | 0.31 | 0.41 |
| Spatial | Siskiyou | fixed effect on age, RW(1) by education, BYM2 by county | 0.388 | 0.35 | 0.423 |
| Spatial | Solano | CDC reported count | 0.697 | 0.697 | 0.697 |
| Spatial | Solano | direct survey estimate | 0.87 | 0.84 | 0.901 |
| Spatial | Solano | fixed effect on age, BYM2 by education | 0.425 | 0.417 | 0.432 |
| Spatial | Solano | fixed effect on age, BYM2 by education | 0.448 | 0.442 | 0.453 |
| Spatial | Solano | fixed effect on age, RW(1) by education, BYM2 by county | 0.424 | 0.403 | 0.441 |
| Spatial | Solano | fixed effect on age, RW(1) by education, BYM2 by county | 0.457 | 0.442 | 0.468 |
| Spatial | Sonoma | CDC reported count | 0.773 | 0.773 | 0.773 |
| Spatial | Sonoma | direct survey estimate | 0.922 | 0.902 | 0.942 |
| Spatial | Sonoma | fixed effect on age, BYM2 by education | 0.421 | 0.414 | 0.428 |
| Spatial | Sonoma | fixed effect on age, BYM2 by education | 0.462 | 0.456 | 0.467 |
| Spatial | Sonoma | fixed effect on age, RW(1) by education, BYM2 by county | 0.434 | 0.418 | 0.448 |
| Spatial | Sonoma | fixed effect on age, RW(1) by education, BYM2 by county | 0.478 | 0.467 | 0.486 |
| Spatial | Stanislaus | CDC reported count | 0.678 | 0.678 | 0.678 |
| Spatial | Stanislaus | direct survey estimate | 0.785 | 0.749 | 0.821 |
| Spatial | Stanislaus | fixed effect on age, BYM2 by education | 0.417 | 0.409 | 0.425 |
| Spatial | Stanislaus | fixed effect on age, BYM2 by education | 0.446 | 0.44 | 0.451 |
| Spatial | Stanislaus | fixed effect on age, RW(1) by education, BYM2 by county | 0.379 | 0.354 | 0.401 |
| Spatial | Stanislaus | fixed effect on age, RW(1) by education, BYM2 by county | 0.415 | 0.397 | 0.431 |
| Spatial | Sutter | CDC reported count | 0.594 | 0.594 | 0.594 |
| Spatial | Sutter | direct survey estimate | 0.664 | 0.539 | 0.788 |
| Spatial | Sutter | fixed effect on age, BYM2 by education | 0.422 | 0.413 | 0.429 |
| Spatial | Sutter | fixed effect on age, BYM2 by education | 0.448 | 0.442 | 0.453 |
| Spatial | Sutter | fixed effect on age, RW(1) by education, BYM2 by county | 0.385 | 0.333 | 0.425 |
| Spatial | Sutter | fixed effect on age, RW(1) by education, BYM2 by county | 0.408 | 0.366 | 0.441 |
| Spatial | Tehama | CDC reported count | 0.408 | 0.408 | 0.408 |
| Spatial | Tehama | direct survey estimate | 0.724 | 0.629 | 0.82 |
| Spatial | Tehama | fixed effect on age, BYM2 by education | 0.421 | 0.413 | 0.429 |
| Spatial | Tehama | fixed effect on age, BYM2 by education | 0.449 | 0.444 | 0.455 |
| Spatial | Tehama | fixed effect on age, RW(1) by education, BYM2 by county | 0.357 | 0.306 | 0.396 |
| Spatial | Tehama | fixed effect on age, RW(1) by education, BYM2 by county | 0.408 | 0.371 | 0.438 |
| Spatial | Trinity | CDC reported count | 0 | 0 | 0 |
| Spatial | Trinity | direct survey estimate | 0.672 | 0.478 | 0.867 |
| Spatial | Trinity | fixed effect on age, BYM2 by education | 0.439 | 0.431 | 0.447 |
| Spatial | Trinity | fixed effect on age, BYM2 by education | 0.437 | 0.432 | 0.442 |
| Spatial | Trinity | fixed effect on age, RW(1) by education, BYM2 by county | 0.403 | 0.334 | 0.451 |
| Spatial | Trinity | fixed effect on age, RW(1) by education, BYM2 by county | 0.367 | 0.296 | 0.416 |
| Spatial | Tulare | CDC reported count | 0.536 | 0.536 | 0.536 |
| Spatial | Tulare | direct survey estimate | 0.744 | 0.698 | 0.789 |
| Spatial | Tulare | fixed effect on age, BYM2 by education | 0.42 | 0.411 | 0.428 |
| Spatial | Tulare | fixed effect on age, BYM2 by education | 0.44 | 0.433 | 0.446 |
| Spatial | Tulare | fixed effect on age, RW(1) by education, BYM2 by county | 0.363 | 0.332 | 0.391 |
| Spatial | Tulare | fixed effect on age, RW(1) by education, BYM2 by county | 0.403 | 0.381 | 0.422 |
| Spatial | Tuolumne | CDC reported count | 0.601 | 0.601 | 0.601 |
| Spatial | Tuolumne | direct survey estimate | 0.8 | 0.719 | 0.881 |
| Spatial | Tuolumne | fixed effect on age, BYM2 by education | 0.451 | 0.443 | 0.458 |
| Spatial | Tuolumne | fixed effect on age, BYM2 by education | 0.426 | 0.421 | 0.431 |
| Spatial | Tuolumne | fixed effect on age, RW(1) by education, BYM2 by county | 0.422 | 0.372 | 0.459 |
| Spatial | Tuolumne | fixed effect on age, RW(1) by education, BYM2 by county | 0.398 | 0.364 | 0.423 |
| Spatial | Ventura | CDC reported count | 0.727 | 0.727 | 0.727 |
| Spatial | Ventura | direct survey estimate | 0.887 | 0.866 | 0.907 |
| Spatial | Ventura | fixed effect on age, BYM2 by education | 0.426 | 0.418 | 0.433 |
| Spatial | Ventura | fixed effect on age, BYM2 by education | 0.452 | 0.446 | 0.457 |
| Spatial | Ventura | fixed effect on age, RW(1) by education, BYM2 by county | 0.429 | 0.412 | 0.443 |
| Spatial | Ventura | fixed effect on age, RW(1) by education, BYM2 by county | 0.451 | 0.439 | 0.462 |
| Spatial | Yolo | CDC reported count | 0.69 | 0.69 | 0.69 |
| Spatial | Yolo | direct survey estimate | 0.904 | 0.853 | 0.956 |
| Spatial | Yolo | fixed effect on age, BYM2 by education | 0.412 | 0.404 | 0.419 |
| Spatial | Yolo | fixed effect on age, BYM2 by education | 0.456 | 0.45 | 0.462 |
| Spatial | Yolo | fixed effect on age, RW(1) by education, BYM2 by county | 0.423 | 0.393 | 0.445 |
| Spatial | Yolo | fixed effect on age, RW(1) by education, BYM2 by county | 0.45 | 0.421 | 0.471 |
| Spatial | Yuba | CDC reported count | 0.51 | 0.51 | 0.51 |
| Spatial | Yuba | direct survey estimate | 0.743 | 0.648 | 0.838 |
| Spatial | Yuba | fixed effect on age, BYM2 by education | 0.431 | 0.422 | 0.438 |
| Spatial | Yuba | fixed effect on age, BYM2 by education | 0.434 | 0.428 | 0.439 |
| Spatial | Yuba | fixed effect on age, RW(1) by education, BYM2 by county | 0.378 | 0.317 | 0.425 |
| Spatial | Yuba | fixed effect on age, RW(1) by education, BYM2 by county | 0.387 | 0.345 | 0.419 |
| Type | Model Name | Estimate | 95% CI: Lower | 95% CI: Upper |
|---|---|---|---|---|
| Non-Spatial | fixed effect on age, RW(1) by education, IID by county | 0.879 | 0.85 | 0.902 |
| Non-Spatial | fixed effect on age, fixed effect on education, IID by county | 0.876 | 0.85 | 0.898 |
| Spatial | fixed effect on age, BYM2 by education | 0.877 | 0.864 | 0.89 |
| Spatial | fixed effect on age, RW(1) by education, BYM2 by county | 0.878 | 0.851 | 0.901 |