QG-SMS: Enhancing Test Item Analysis via Student Modeling and Simulation
Abstract
While the Question Generation (QG) task has been increasingly adopted in educational assessments, its evaluation remains limited by approaches that lack a clear connection to the educational values of test items. In this work, we introduce test item analysis, a method frequently used by educators to assess test question quality, into QG evaluation. Specifically, we construct pairs of candidate questions that differ in quality across dimensions such as topic coverage, item difficulty, item discrimination, and distractor efficiency. We then examine whether existing QG evaluation approaches can effectively distinguish these differences. Our findings reveal significant shortcomings in these approaches with respect to accurately assessing test item quality in relation to student performance. To address this gap, we propose a novel QG evaluation framework, QG-SMS, which leverages Large Language Model for Student Modeling and Simulation to perform test item analysis. As demonstrated in our extensive experiments and human evaluation study, the additional perspectives introduced by the simulated student profiles lead to a more effective and robust assessment of test items.
QG-SMS: Enhancing Test Item Analysis via Student Modeling and Simulation
Bang Nguyen1 Tingting Du2 Mengxia Yu1 Lawrence Angrave3 Meng Jiang1 1 University of Notre Dame 2 University of Wisconsin-Madison 3 University of Illinois at Urbana-Champaign Correspondence: bnguyen5@nd.edu
1 Introduction
The Natural Language Processing (NLP) domain has recently seen the growing adoption of the question generation (QG) task in educational assessments to help teachers measure student learning and identify misconceptions Wang et al. (2022b); Jia et al. (2021); Wang et al. (2022a); Moon et al. (2024); Nguyen et al. (2022). These generated questions are often evaluated using reference-based metrics such as ROUGE Lin (2004), BLEU Papineni et al. (2002), or BERTScore Zhang et al. (2019), which measure the syntactic and semantic similarity between the generated question and a human-written reference. However, researchers have raised concerns about the validity and reliability of reference-based metrics in accurately reflecting question quality Nguyen et al. (2024). As a result, reference-free metrics have been proposed to assess aspects of question quality independently of a single reference question Moon et al. (2022); Nguyen et al. (2024). Despite these advancements, most reference-free QG metrics primarily focus on the answerability of generated questions, lacking a direct connection to their educational value.
In this work, we introduce test item analysis, a well-established method in education for assessing test item quality, into the QG evaluation pipeline. In educational testing, test item quality is assessed through both pre-examination and post-examination analyses. Pre-examination analysis evaluates test items (i.e., quiz questions) before administration, focusing on dimensions such as topic alignment, where instructors or subject matter experts ensure that test content aligns with learning objectives Mahjabeen et al. (2017). Post-examination analysis is a powerful tool that evaluates the quality of test questions by analyzing how test takers respond to them. It occurs after test administration, providing insights into dimensions such as item difficulty, item discrimination, and distractor efficiency through statistical analyses of test-taker performance Mahjabeen et al. (2017). Post-examination analysis can help improve the test’s validity and reliability, which is valuable for improving test items that will be used again in later tests. However, it cannot evaluate test questions during the test design phase, as it requires test-taker responses which are only available after the test has been administered.
Recent studies have shown that Large Language Models (LLMs) achieve state-of-the-art alignment with human judgment via pairwise evaluation of generated outputs in natural language generation tasks Chan et al. (2023); Zeng et al. (2024). We investigate whether these evaluation approaches can provide a predictive analysis of test items by considering dimensions educators address in both pre-examination and post-examination analyses. Specifically, we consider four dimensions: topic coverage (from pre-examination analysis), and item difficulty, item discrimination, and distractor efficiency (from post-examination analysis). We examine whether existing approaches can effectively distinguish among questions based on these four dimensions–for example, by comparing two questions and identifying which one exhibits higher difficulty. Our findings, illustrated in Fig. 2, reveal a significant performance disparity: while existing QG evaluation approaches excel in pre-examination analysis (e.g., topic coverage), they struggle to accurately evaluate dimensions in post-examination analysis, such as item difficulty, discrimination, and distractor efficiency.
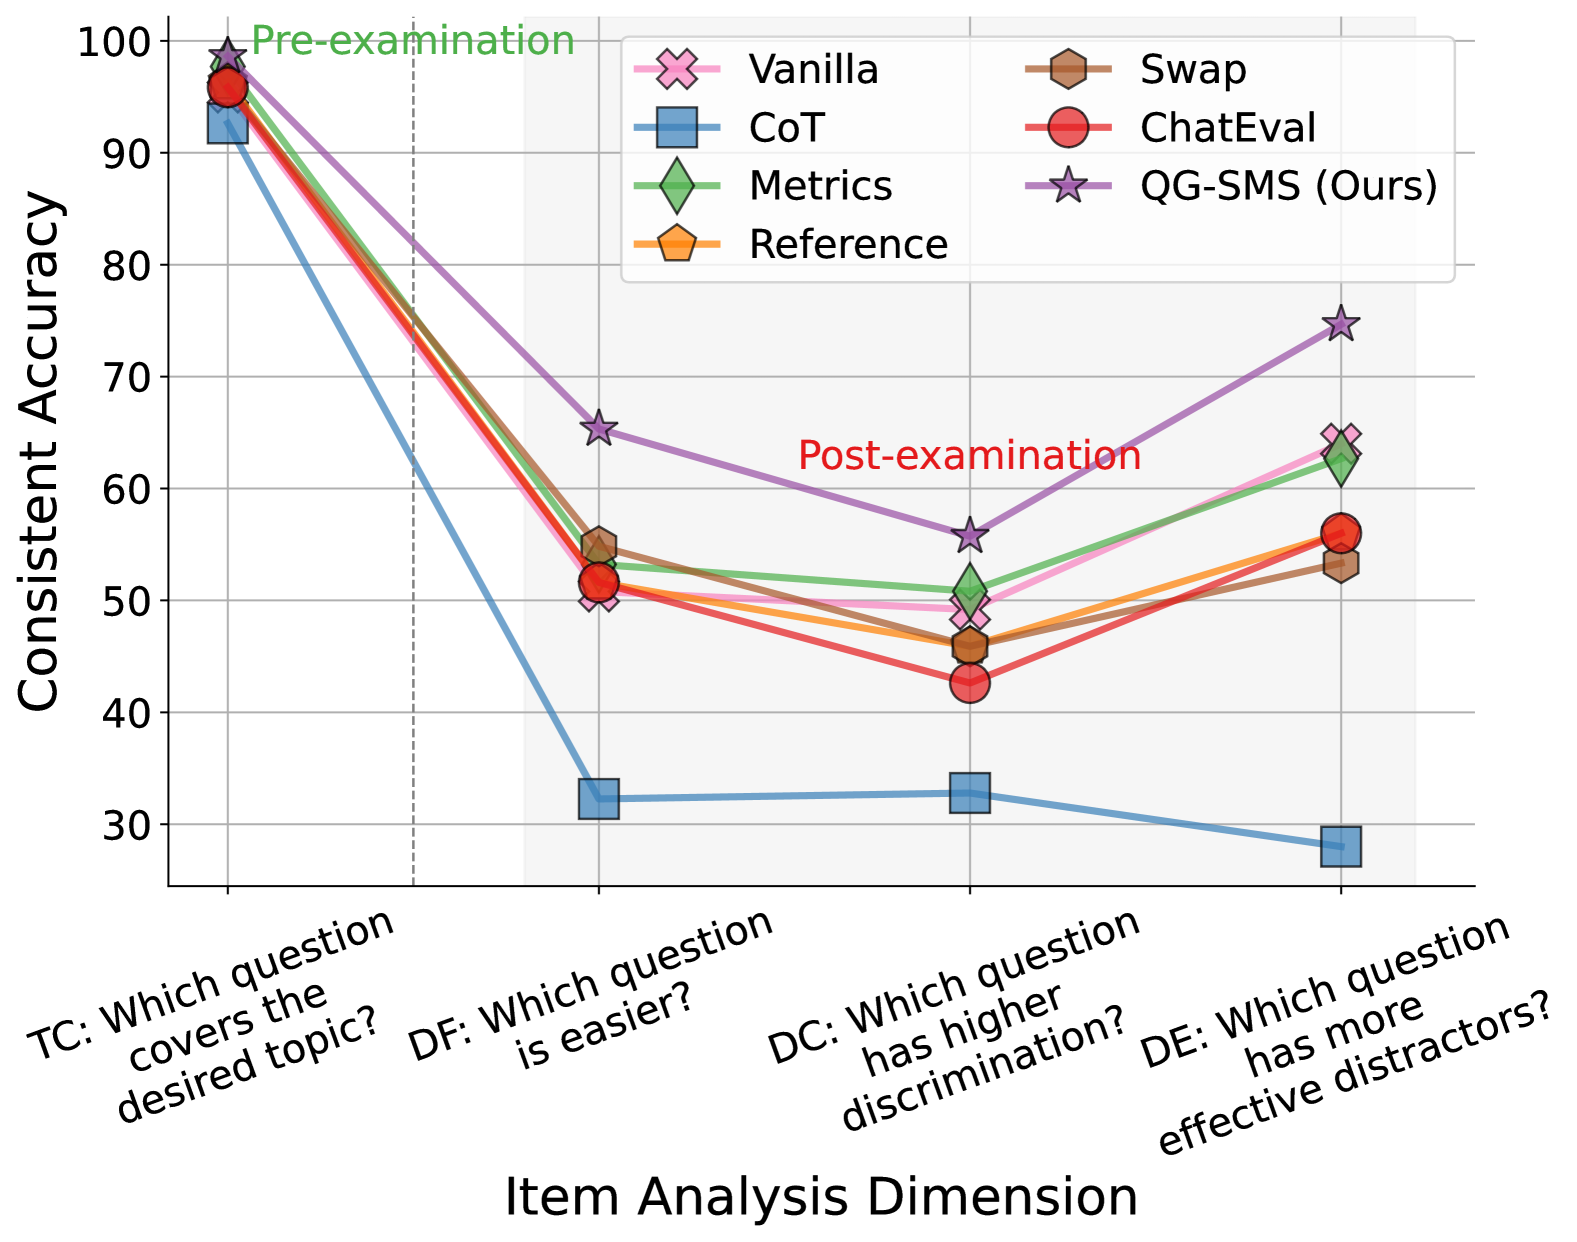
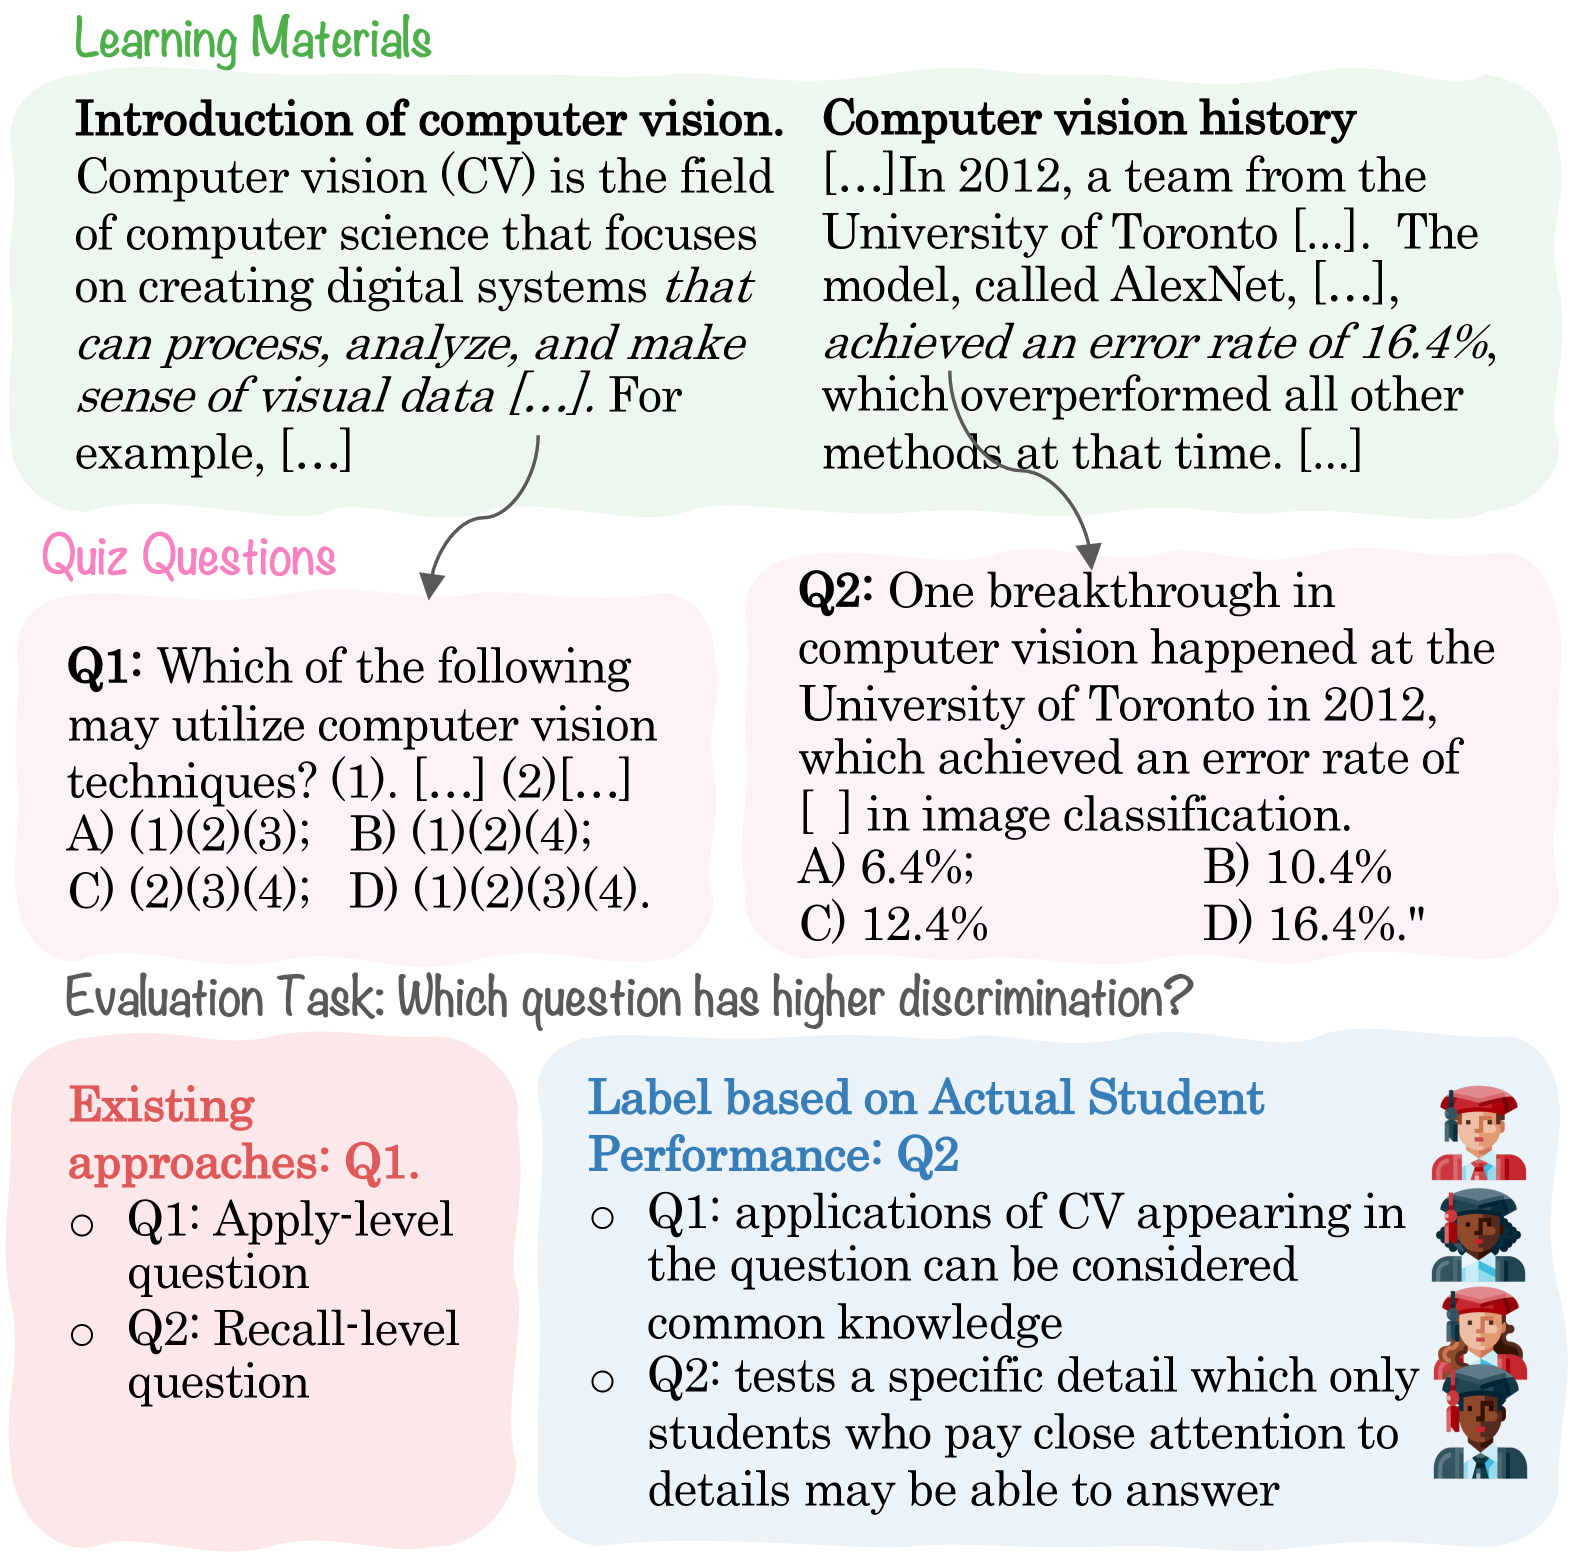
Fig. 1 illustrates the shortcomings of existing LLM-based evaluation approaches for post-examination analysis. These methods primarily assess question content while neglecting test-taker perspectives, which are crucial for evaluating question quality. To address this gap, we propose QG-SMS, a novel evaluation framework (illustrated in Fig. 3) that utilizes a large language model (LLM) to simulate students with diverse levels of understanding for test item analysis. These simulations serve as reliable indicators of student performance on candidate test items, significantly enhancing the LLM’s capacity for evaluating question quality (Fig. 2). In summary, this paper makes the following contributions:
-
•
We systematically introduce test item analysis into QG evaluation, revealing a significant performance gap in existing approaches when assessing educational aspects such as question difficulty, discrimination, and distractor efficiency.
-
•
To bridge this gap, we propose QG-SMS, a novel QG evaluation framework that leverages diverse Student Modeling and Simulation with a single LLM.
-
•
We conduct extensive experiments and human evaluation studies to showcase the effectiveness and robustness of QG-SMS.
2 Problem Definition
2.1 Statistical Measures of Test Items
Educators evaluate test items across multiple dimensions to ensure their effectiveness. In this work, we focus on four key dimensions that are well-established in educational research and have been mathematically formalized: topic coverage, item difficulty, item discrimination, and distractor efficiency Martone and Sireci (2009); Tavakol and Dennick (2011); Mahjabeen et al. (2017). While topic coverage pertains to pre-examination analysis, the remaining dimensions are primarily evaluated post-examination.
Topic coverage (TC) evaluates whether the test item covers a given topic. Mathematically, it is a binary variable, where a value of indicates that the test item covers the desired topic, otherwise.
Item Difficulty (DF) measures how easy (or difficult) a test item is for a group of students. Let be the set of students who attempted the test item and indicate whether student answered correctly. The difficulty index (DF) of the test item is defined as the proportion of students who answered the question correctly:
Item Discrimination (DC) measures the ability of the test item to differentiate between students who have a strong understanding of the learning material and those who do not. Let denote the scores of students on the specific test item, and where denote the total test score of student . The Discrimination Index DC of the test item is defined as the correlation between the student’s score on the specific item and their overall test score:
where represents the covariance between and , while , are the standard deviations of and respectively.
For multiple-choice questions, distractor efficiency (DE) assesses how well the distractors (incorrect answer choices) mislead students who hold specific misunderstandings. Let be the set of distractors of a test item, and denote whether student selects distractor . Then, the distractor efficiency (DE) of the test item is defined as the number of distractors chosen by at least students in Mahjabeen et al. (2017).
where .
2.2 Task Definition
Given learning materials such as lecture content or transcripts, our goal is to obtain a test question that effectively assesses students’ knowledge of . Since instructors may have varying requirements for test questions Wang et al. (2022a), let denote the desired characteristic or requirement of a test question with respect to a specific dimension such as question difficulty, discrimination, topic coverage, or distractor efficiency. Given two candidate questions and derived from , the task is to determine which question better satisfies the requirement 111While the current task setup relies on binary comparisons, an extended approach using multiple pairwise comparisons could establish a ranking-based system, where question rankings translate into computed DF/DE/DC scores.. We provide an example of the task in Fig. 1.
To ensure that the task is achievable, we require that the statistical measure corresponding to dimension for be significantly different from that of . For example, if represents difficulty, then the absolute difference between the difficulty indices of and must exceed a certain threshold : , where is a predefined threshold ensuring a meaningful distinction between the two questions.
3 QG-SMS: Student Modeling and Simulation for Test Item Analysis
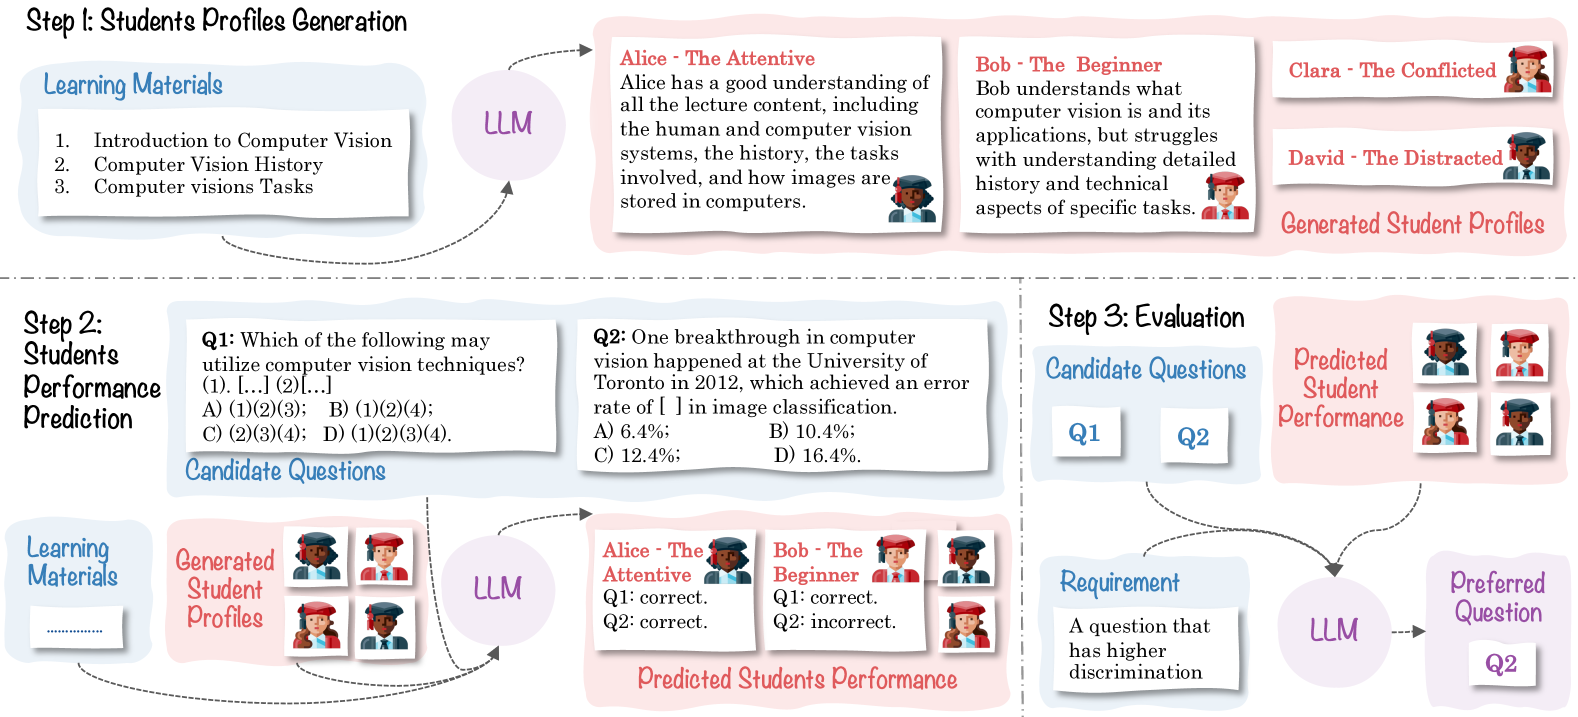
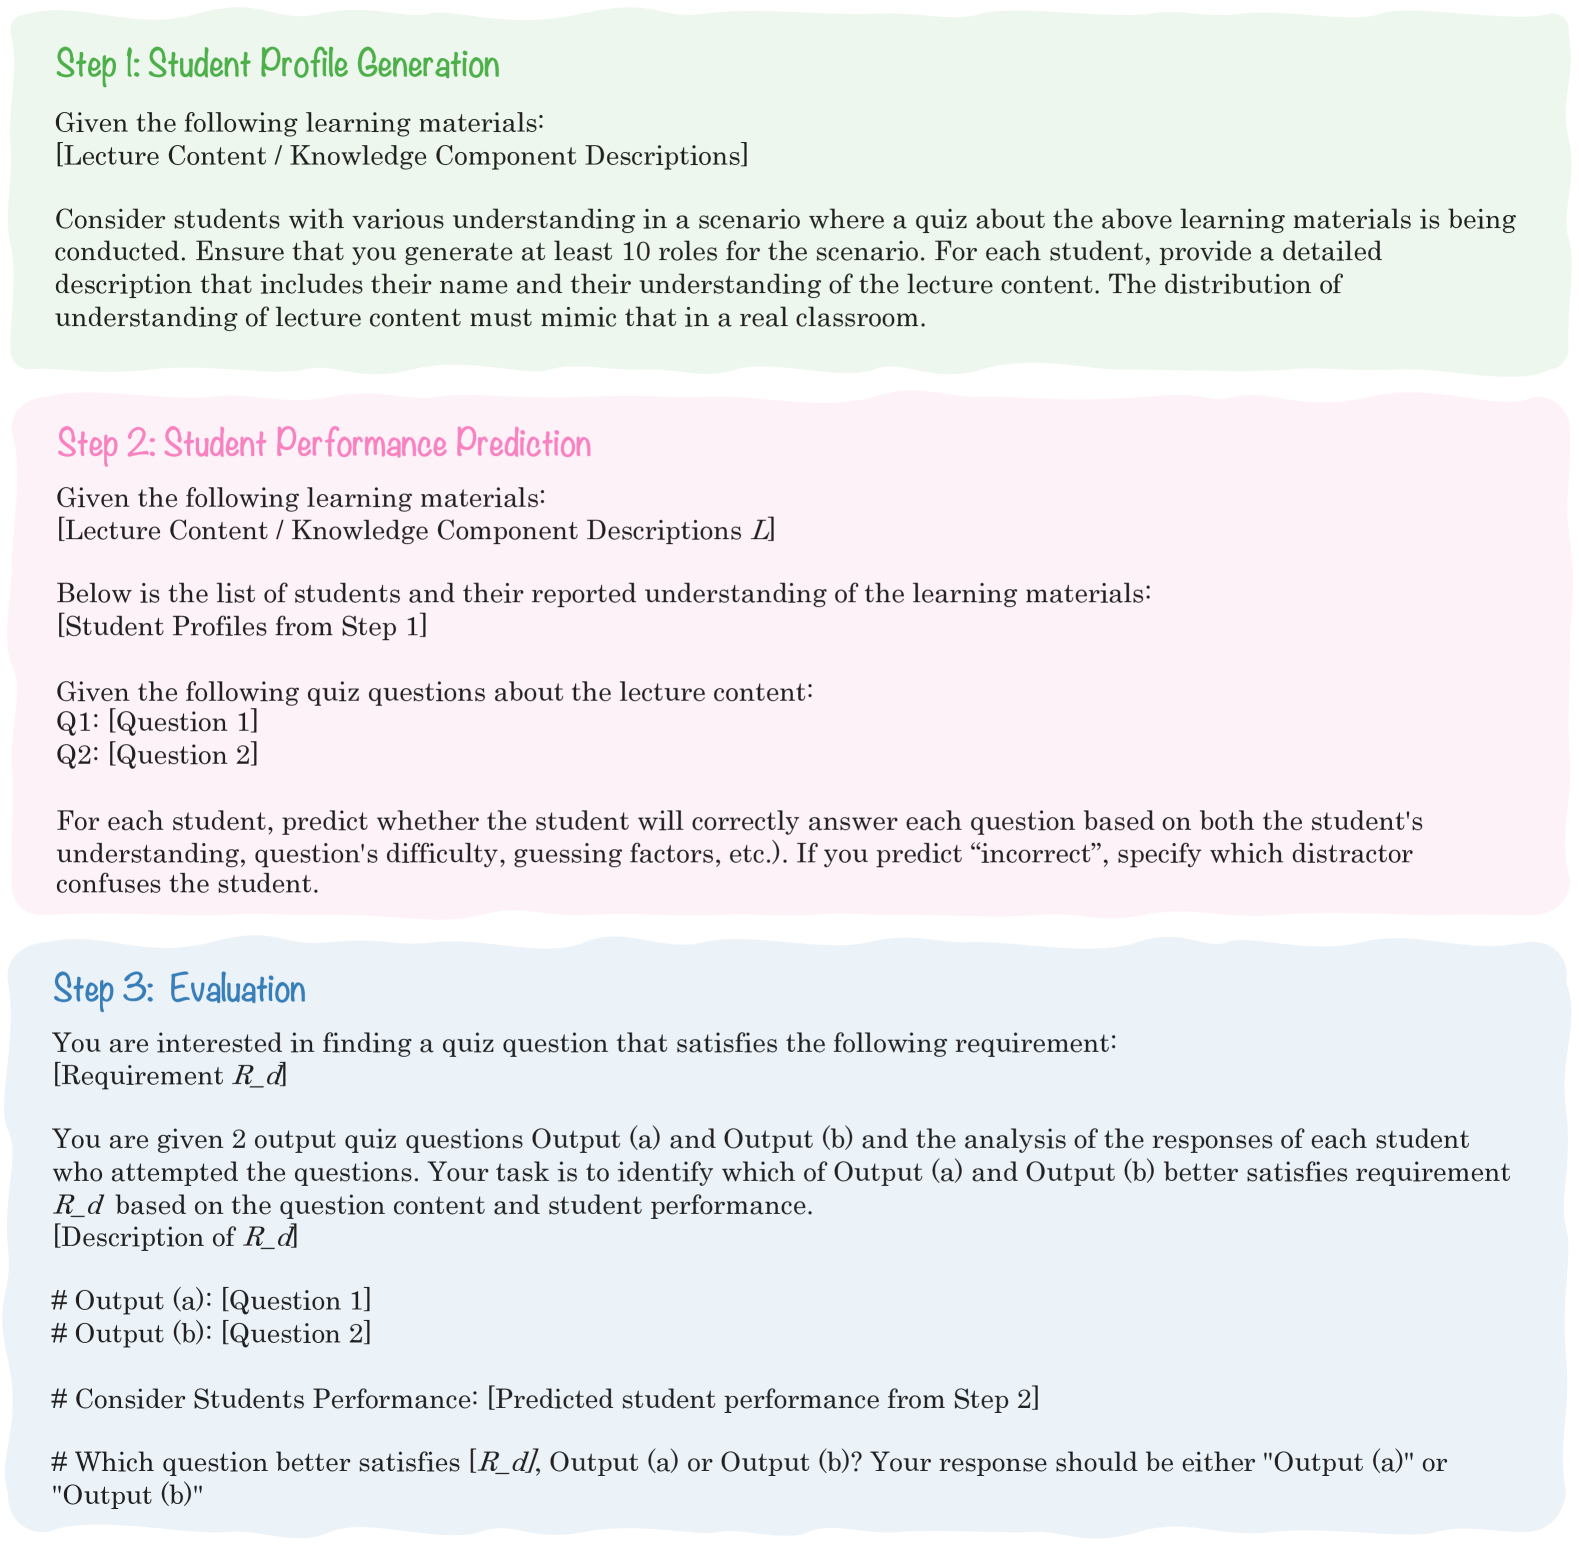
During the test design phase, it is imperative to anticipate the diverse ways students may interpret learning materials. For example, in multiple-choice tests, effective distractors help teachers identify students who hold certain misconceptions Gierl et al. (2017). In this sense, to enhance the educational alignment of automated test item evaluation, we propose QG-SMS, which leverages LLM to model and simulate how well test items measure varying levels of student understanding. As illustrated in Fig. 3, QG-SMS consists of three key steps: (1) student profile generation, (2) student performance prediction, and (3) evaluation.
Step 1 - Student Profile Generation: QG-SMS begins by simulating diverse student perspectives on the same learning materials. Given learning materials , the LLM is tasked to generate a set of students such that the distribution of student understanding reflects that in a realistic classroom. Note that we only simulate diverse student understanding of the given learning materials, avoiding the use of personal identities that may introduce social bias into the generated profiles Cheng et al. (2023). Fig. 3 presents the profiles of two simulated students Alice and Bob.
Step 2 - Student Performance Prediction: Once student profiles are established, QG-SMS simulates their performance on candidate test items. Given learning materials , a pair of candidate questions to be evaluated , and the generated student profiles , the task is to predict whether each student will correctly or incorrectly answer and .
Step 3 - Evaluation: Finally, QG-SMS assesses whether a test item fulfills its intended purpose by examining the responses of students with different levels of understanding. For example, an easy question should yield correct answers from a wide range of students, while a challenging question should only be correctly answered by those who have a deeper understanding of the learning materials. Formally, given the pair of candidate questions , the desired characteristic of the test item and the predicted student performance from step 2, the task is to determine which question better satisfies requirement .
4 Experiments
| Method | Difficulty (DF) | Discrimination (DC) | Dist. Eff. (DE) | |||||||||||||||||
|
|
|
|
|
||||||||||||||||
| AA | CA | AA | CA | AA | CA | AA | CA | AA | CA | |||||||||||
| Individual Scoring | ||||||||||||||||||||
| BERTScore | 51.61 | - | 61.73 | - | 65.57 | - | 30.11 | - | 65.33 | - | ||||||||||
| KDAlarge | 60.48 | - | 54.32 | - | 60.66 | - | 58.06 | - | 77.33 | - | ||||||||||
| Pairwise LLM-based | ||||||||||||||||||||
| Vanilla | 63.71 | 50.80 | 67.28 | 49.38 | 63.11 | 49.18 | 63.98 | 49.46 | 73.33 | 64.00 | ||||||||||
| CoT | 61.69 | 32.26 | 64.20 | 38.89 | 59.84 | 32.79 | 62.90 | 34.41 | 60.00 | 28.00 | ||||||||||
| Metrics | 65.32 | 53.22 | 64.20 | 48.77 | 65.57 | 50.82 | 61.29 | 45.16 | 72.00 | 62.67 | ||||||||||
| Reference | 66.53 | 51.61 | 62.96 | 45.06 | 62.30 | 45.90 | 60.75 | 44.09 | 69.33 | 56.00 | ||||||||||
| Swap | 66.53 | 54.84 | 68.31 | 53.70 | 64.75 | 45.90 | 62.90 | 48.39 | 68.00 | 53.33 | ||||||||||
| ChatEval | 68.95 | 51.61 | 70.99 | 59.88 | 54.92 | 42.56 | 65.05 | 53.76 | 69.33 | 56.00 | ||||||||||
| QG-SMS (Ours) | 68.55 | 65.32 | 69.44 | 64.20 | 66.39 | 55.74 | 66.66 | 56.99 | 79.33 | 74.67 | ||||||||||
4.1 Dataset Construction
We construct a dataset of question pairs (, ) with varying quality levels from two knowledge-tracing datasets: EduAgent (Xu et al., 2024) and DBE-KT (Abdelrahman et al., 2022) datasets. Both datasets contain mappings between learning materials and quiz questions, ensuring that and are related to the given learning materials . Each question is also annotated with its relevant topic, allowing us to set up pairs for the topic coverage (TC) setting. In addition, both datasets collect student responses to individual quiz questions, allowing us to compute the statistical measures discussed in 2.1. For DBE-KT, we can only compute DF and DC as information on specific distractors chosen by students who answered incorrectly is unavailable.
As discussed in 2.2, we adopt the threshold to ensure a significant quality difference between and . We set to for TC, for DE, and for DF and DC. For each pair that exhibits significant quality difference with respect to dimension , we assign labels based on and its corresponding requirement as follows:
-
•
Topic coverage: we define as "the question that covers the target topic". The label corresponds to the question with the higher TC value ( vs ).
-
•
Item Difficulty: we define as "the question that is easier to answer". The label corresponds to the question with the higher DF value.
-
•
Item Discrimination: we define as "the question that is more effective at distinguishing between high-performing and low-performing students". The label corresponds to the question with the higher DC value.
-
•
Distractor Efficiency: we define as "the question that has a higher number of effective distractors". The label corresponds to the question with the higher DE value.
Notably, can also be defined in the opposite direction to ours without altering the task setup. For example, with difficulty as , can instead be defined as "the question that is more difficult to answer". In this case, the same pair would be labeled based on which question has the lower DF value.
Ultimately, we obtained and question pairs from EduAgent and DBE-KT, respectively. These pairs serve as a benchmark for evaluating QG-SMS and existing QG evaluation mechanisms across multiple test item dimensions.
4.2 QG Evaluators
We compare QG-SMS with two individual-scoring metrics: the reference-based BERTScore Zhang et al. (2019) and the reference-free KDA Moon et al. (2022). For BERTScore, since we do not have a reference question for each pair, we instead use the learning material as the reference and measure the similarity between and each question. For KDA, we use the large version of the model-based metric. As these metrics assign separate scores to and , we must determine how to compare their scores to establish a preference. For each dimension, we select the direction that yields the highest average accuracy for the EduAgent dataset:
-
•
Easier question: BERTScore, KDA
-
•
Higher discrimination: BERTScore, KDA
-
•
Higher distractor efficiency: BERTScore, KDA
We retain this comparison direction for the DBE-KT dataset, as a reliable metric should exhibit consistent behavior across domains.
We also consider LLM-based approaches that perform pair-wise comparison of and :
Vanilla Zeng et al. (2024): We describe the question generation task in natural language, given lecture and quiz requirement , referred to as instruction . Given instruction , the LLM is then asked to choose between and based on which question better satisfies (i.e., better aligns with the specified topic, is easier, has higher discrimination ability, or has more effective distractors). The LLM simply outputs its preference without providing an explanation.
Chain-of-Thoughts (CoT) Wei et al. (2022): Given instruction , the LLM is prompted to first provide explanations before making its preference between and .
Self-Generated Metrics (Metrics) Liu et al. (2023); Saha et al. (2024): Given instruction , the LLM is first prompted to generate a set of metrics to which a well-constructed test question should adhere. It then selects or based on these self-generated metrics.
Self-Generated Reference (Reference) Zheng et al. (2023): The LLM is first prompted to generate a reference output (an example of a desirable question) based on instruction . It is then encouraged to utilize this reference to evaluate and .
Swap and Synthesize (Swap) Du et al. (2024): To address positional bias, the LLM is prompted to express its preference using CoT in both orders and . If the LLM evaluator makes contradictory choices when the question order is swapped, it is prompted to make a final decision by synthesizing the two CoT responses.
ChatEval Chan et al. (2023): This method incorporates multiple personas when using LLM as proxies for human evaluators. Given instruction , we first generate multiple expert personas for the evaluation task using the AutoAgents framework Chen et al. (2023). The LLM then assumes these personas and engages in a multi-turn discussion to determine its preference between and .
4.3 Additional Details
For all LLM-based evaluation metrics, including ours, we use the same base model, GPT-4o, across all experiments.
As LLMs are known to exhibit strong positional bias Wang et al. (2024), we run evaluations on each question pair twice, swapping their orders: and . We assess the evaluation performance using two evaluation metrics: Average Accuracy and Consistent Accuracy. We define Consistent Accuracy, applicable to LLM-based methods, as the percentage of cases where the evaluation method makes the correct judgment both when the questions are presented in their original order and when their order is swapped.
5 Results
5.1 Enhancing Test Item Analysis with QG-SMS
Reference-based metrics like BERTScore are not reliable in reflecting the educational value of test items, as their evaluation behavior for the same dimension varies significantly across domains. Tbl. 1 highlights this inconsistency: when selecting the question with the higher BERTScore as the question with higher discrimination, the average accuracy for the EduAgent dataset (Introduction to AI lectures) is 65.57%. Meanwhile, for the DBE-KT dataset (Relational Database exercises), the accuracy within the same domain drops to 30.11%.
Beyond reference-based metrics, existing LLM-based QG evaluation approaches also struggle with post-examination analysis, as shown in Fig. 2. To address this gap, QG-SMS enhances test item analysis performance by incorporating student modeling and simulation, as demonstrated in Tbl. 1. Across both datasets, QG-SMS achieves the highest average accuracy in evaluating DC and DE, and the second-highest average accuracy in evaluating DF. Additionally, QG-SMS significantly outperforms all baselines in consistent accuracy, demonstrating its robustness to input order variations. For instance, QG-SMS’s consistent accuracy for DF in the EduAgent dataset is , maintaining a gap over the second-best baseline (Swap). Fig. 3 provides a case study illustrating how simulation enhances test item analysis, facilitating a more educationally aligned evaluation.
5.2 Analysis
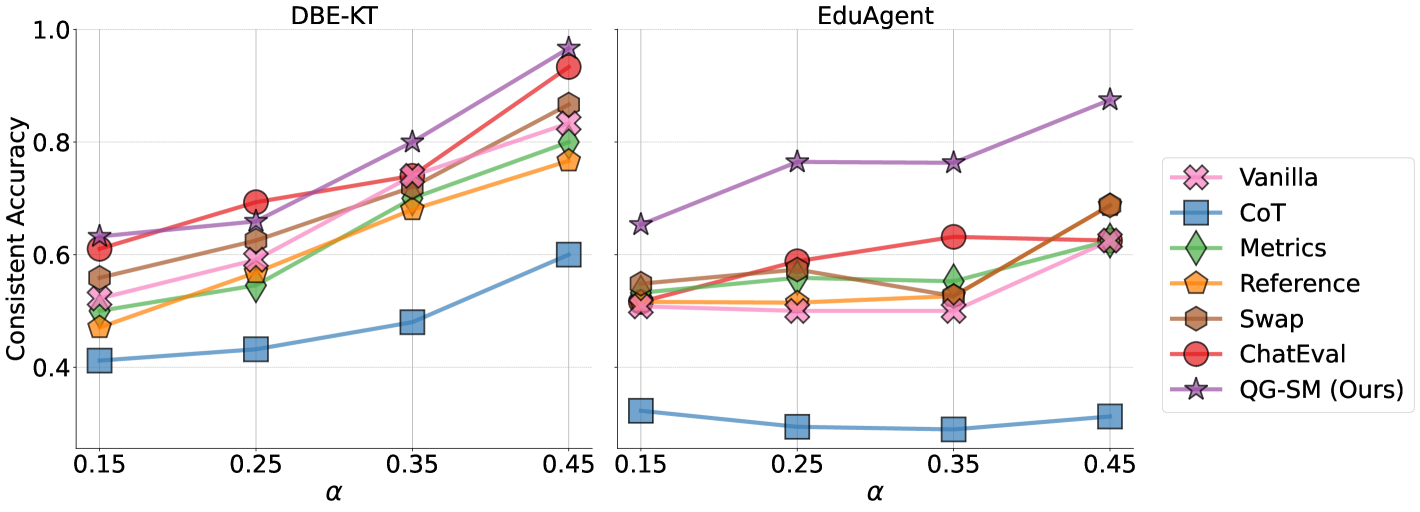
Varying : We further investigate the effectiveness of QG-SMS compared to other LLM-based approaches across different values of , i.e., the threshold of quality difference between a pair of questions. Fig. 4 indicates that the performances of all LLM-based metrics consistently improve as increases. This trend is intuitive, as higher values suggest a larger quality gap between question pairs, making the evaluation task easier. Importantly, QG-SMS remains the top performer regardless of the changes in .
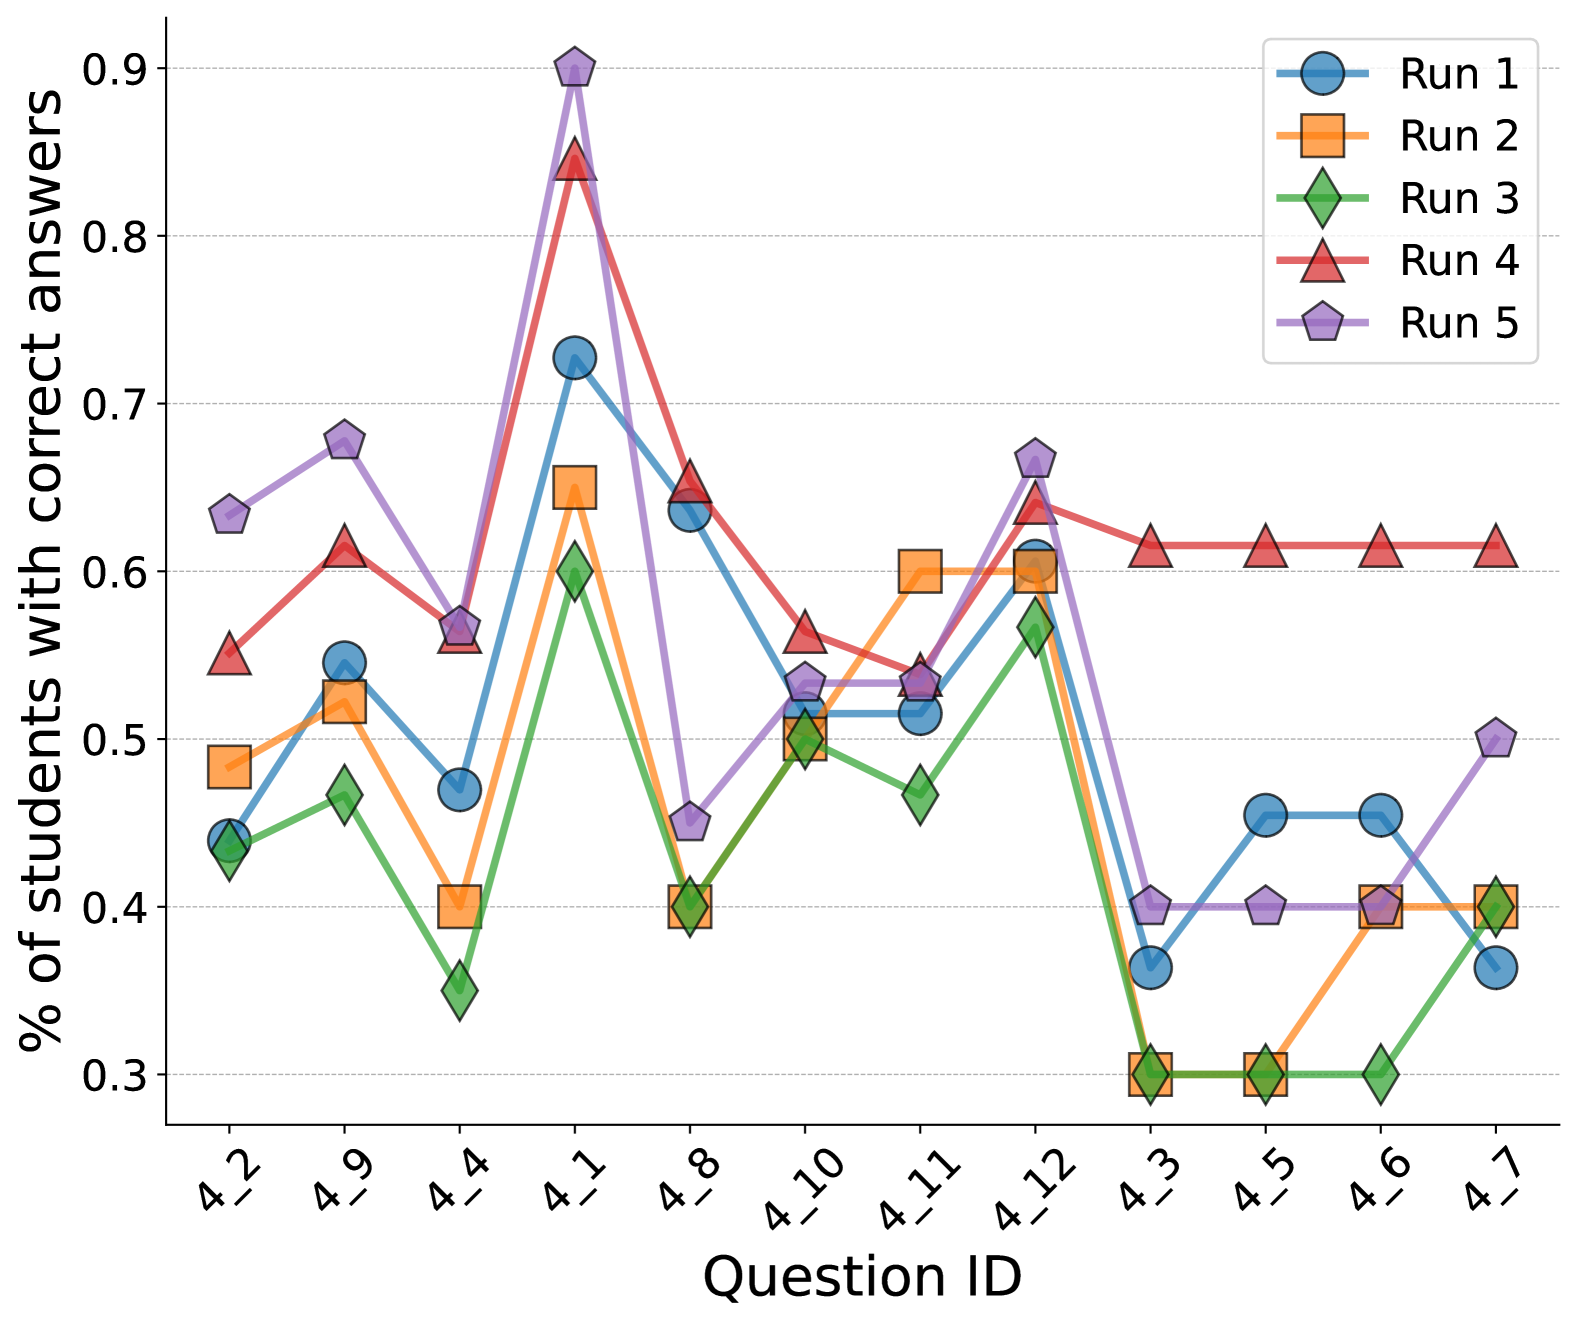
Robustness of generated student profiles: To test the robustness of the generated student profiles, we repeat Step 1 (i.e., student profile generation) and Step 2 (i.e., student performance prediction) multiple times and examine the consistency of the predicted student performance. Fig. 5 demonstrates that conditioning the student profiles solely on the lecture content already results in consistent distribution of simulated student performance on the same set of questions across different runs.
5.3 Human Evaluation Study
So far, our experiments have involved human-written questions from knowledge-tracing datasets such as DBE-KT and EduAgent. To further demonstrate the applicability of QG-SMS in the QG process, we conduct a human evaluation study with both human-written and generated questions.
Study Description: We recruit three volunteer annotators, including two graduate and one undergraduate student in Computer Science. Their domain knowledge is highly related to the lecture contents of the EduAgent dataset (e.g., AI related knowledge) and they all have some teaching experience. Annotators are tasked to make preferences on pairs of questions, including pairs of human-written and pairs of machine-generated questions. Each pair differs in one of three dimensions - DF, DC, and DE. We use the EduAgent dataset. Its lectures target a general audience, supporting the credibility of our annotators in assessing lecture content and quiz questions. We provide more details on the question generation process and instructions given to annotators in A.3.
Study Results: In 75 of 120 cases (62.5%) all three annotators agree on the same preference. For the remaining cases, we adopt the majority preference (chosen by 2 out of 3 annotators) as the representative of human judgment. We report the results of our human evaluation study in Tbl. 2.
In human-written question pairs with ground-truth labels based on student performance, our human annotators achieve the highest average accuracy () compared to LLM-based evaluators. When broken down by dimension, the average accuracy of human annotators is , , and for DF, DC, and DE respectively. This observation suggests that performing item analysis on the DC dimension poses significant challenges to our annotators. As they noted during post-examination feedback, it is challenging to identify which question more effectively distinguishes between high-performing and low-performing students when they do not have access to the specific student profiles in the classroom. In terms of evaluating DC, our proposed QG-SMS surpasses human annotators, and on the other two dimensions, DF and DE, QG-SMS achieves the closest accuracy scores to humans. On average, QG-SMS achieves the second-highest accuracy—surpassed only by human annotators. The results show the effectiveness of simulating student understanding and performance. See Tbl. 3 for detailed results.
For the other 60 pairs of generated questions, we use the human annotators’ preferences as the labels and evaluate the performance of QG evaluators accordingly. It can be seen from Tbl. 2 that QG-SMS achieves the highest average accuracy and consistent accuracy in this setting, demonstrating state-of-the-art alignment with human judgment.
| Method |
|
|
|||||
| AA | AA | CA | |||||
| Vanilla | 70.83 | 70.83 | 58.33 | ||||
| CoT | 67.50 | 65.00 | 38.33 | ||||
| Metrics | 70.83 | 69.17 | 53.33 | ||||
| Reference | 69.17 | 67.50 | 55.00 | ||||
| Swap | 73.33 | 65.00 | 48.33 | ||||
| ChatEval | 69.17 | 74.17 | 56.67 | ||||
| QG-SMS | 76.67 | 74.17 | 63.33 | ||||
| Human | 78.33 | - | - | ||||
6 Related Work
NLG Evaluation with LLM: LLM-based evaluators have garnered increasing interest due to their higher correlation with human judgments compared to traditional metrics (Zheng et al., 2023). As foundation models advance, LLM-based evaluation has evolved from scoring candidate texts based on conditioned probabilities (Fu et al., 2024) to directly generating scores according to predefined criteria (Liu et al., 2023). However, LLMs are sensitive to textual instructions and positional biases. To enhance their reliability, Wang et al. (2024) propose calibration strategies, such as requiring models to generate multiple pieces of evidence and aggregating final scores across different orders of candidates. LLM-based evaluators also benefit from prompting techniques imitating human behaviors such as in-context learning (Song et al., 2025), step-by-step reasoning (Liu et al., 2023), multi-turn optimization (Bai et al., 2023) and multi-agent debate (Chan et al., 2023). Despite these advances, as shown in this work, LLM-based methods still fall short in item analysis, calling for a more effective evaluation strategy like QG-SMS.
Student Modeling and Simulation with (L)LMs: Recent studies explore the use of (L)LMs to simulate human behaviors in general Park et al. (2023), and classroom learning in particular Xu and Zhang (2023); Zhang et al. (2024). These simulations have been applied in various educational contexts, from training novice teachers Markel et al. (2023) to promoting student engagement Zhang et al. (2024). Prior works have utilized LM-based simulations for evaluating test items, with Park et al. (2024) and Moon et al. (2022) using multiple (L)LMs with varying capacities to model different students in the classroom for assessing question answerability and difficulty. However, these studies overlook key dimensions such as item discrimination and distractor efficiency. Unlike these approaches, our proposed method, QG-SMS, demonstrates that a single LLM is capable of simulating students at diverse levels, making the pipeline more efficient and scalable. While Lu and Wang (2024) manually specify knowledge mastery levels in the prompt to the LLM, our approach eliminates this need, making simulation more flexible. Additionally, we conduct comprehensive experiments to further validate the usefulness of simulated student profiles for test item analysis.
7 Conclusion
In this work, we proposed QG-SMS, a novel simulation-based QG evaluation framework for test item analysis. We first constructed two datasets of candidate question pairs that differ in quality across multiple dimensions of educational value. Experiments with existing evaluation approaches highlight the challenges of accurately and efficiently assessing test item quality. In response, we introduce the modeling and simulation of diverse student understanding for evaluation. These simulated student profiles offer valuable insights into how well a question functions as a test item for assessing student performance. We conducted experiments across two datasets and four dimensions of test item analysis, as well as recruited human annotators to showcase the effectiveness, robustness, and adaptability of QG-SMS in performing comprehensive test item analysis.
Limitations
In this work, we evaluate the quality of test items at an individual level. We recognize that constructing assessment typically requires considering multiple dimensions and ensuring diversity within each dimension Osterlind (1997). For example, a well-designed quiz should not only cover different topics from the learning materials rather than repeatedly assessing the same concept, but also include a mix of easy, medium, and hard questions. One potential application of QG-SMS in such scenarios is to rank candidate test items based on a given dimension by comparing simulated student understanding and performance. Using these rankings, future work could explore methods to assist teachers in assembling assessments that achieve balance across relevant dimensions.
Ethical Considerations
We avoid introducing bias in the generation and use of student profiles by grounding the simulation in the learning materials alone and instructing the LLM to focus on student understanding, which provides useful insights into test item quality. However, implicit bias may still arise in these generated profiles. For example, despite prompting the LLM to use names that describe student understanding, we observed a predominance of European names (Alice, Bob, etc.). It is important to emphasize that these simulated profiles are not intended to represent specific students in a real classroom. Rather, they serve collectively to estimate the diversity of student understanding of the learning materials.
Acknowledgments
This work was supported by NSF IIS-2119531, IIS-2137396, IIS-2142827, IIS-2234058, CCF-1901059, and ONR N00014-22-1-2507.
References
- Abdelrahman et al. (2022) Ghodai Abdelrahman, Sherif Abdelfattah, Qing Wang, and Yu Lin. 2022. Dbe-kt22: A knowledge tracing dataset based on online student evaluation. arXiv preprint arXiv:2208.12651.
- Bai et al. (2023) Yushi Bai, Jiahao Ying, Yixin Cao, Xin Lv, Yuze He, Xiaozhi Wang, Jifan Yu, Kaisheng Zeng, Yijia Xiao, Haozhe Lyu, Jiayin Zhang, Juanzi Li, and Lei Hou. 2023. Benchmarking foundation models with language-model-as-an-examiner. In Advances in Neural Information Processing Systems, volume 36, pages 78142–78167. Curran Associates, Inc.
- Chan et al. (2023) Chi-Min Chan, Weize Chen, Yusheng Su, Jianxuan Yu, Wei Xue, Shanghang Zhang, Jie Fu, and Zhiyuan Liu. 2023. Chateval: Towards better llm-based evaluators through multi-agent debate. arXiv preprint arXiv:2308.07201.
- Chen et al. (2023) Guangyao Chen, Siwei Dong, Yu Shu, Ge Zhang, Jaward Sesay, Börje F Karlsson, Jie Fu, and Yemin Shi. 2023. Autoagents: A framework for automatic agent generation. arXiv preprint arXiv:2309.17288.
- Cheng et al. (2023) Myra Cheng, Tiziano Piccardi, and Diyi Yang. 2023. CoMPosT: Characterizing and evaluating caricature in LLM simulations. In Proceedings of the 2023 Conference on Empirical Methods in Natural Language Processing, pages 10853–10875, Singapore. Association for Computational Linguistics.
- Du et al. (2024) Yilun Du, Shuang Li, Antonio Torralba, Joshua B. Tenenbaum, and Igor Mordatch. 2024. Improving factuality and reasoning in language models through multiagent debate. In Proceedings of the 41st International Conference on Machine Learning, ICML’24. JMLR.org.
- Fu et al. (2024) Jinlan Fu, See-Kiong Ng, Zhengbao Jiang, and Pengfei Liu. 2024. GPTScore: Evaluate as you desire. In Proceedings of the 2024 Conference of the North American Chapter of the Association for Computational Linguistics: Human Language Technologies (Volume 1: Long Papers), pages 6556–6576, Mexico City, Mexico. Association for Computational Linguistics.
- Gierl et al. (2017) Mark J. Gierl, Okan Bulut, Qi Guo, and Xinxin Zhang. 2017. Developing, analyzing, and using distractors for multiple-choice tests in education: A comprehensive review. Review of Educational Research, 87(6):1082–1116.
- Jia et al. (2021) Xin Jia, Wenjie Zhou, Xu Sun, and Yunfang Wu. 2021. Eqg-race: Examination-type question generation. In Proceedings of the AAAI conference on artificial intelligence, volume 35, pages 13143–13151.
- Lin (2004) Chin-Yew Lin. 2004. ROUGE: A package for automatic evaluation of summaries. In Text Summarization Branches Out, pages 74–81, Barcelona, Spain. Association for Computational Linguistics.
- Liu et al. (2023) Yang Liu, Dan Iter, Yichong Xu, Shuohang Wang, Ruochen Xu, and Chenguang Zhu. 2023. G-eval: NLG evaluation using gpt-4 with better human alignment. In Proceedings of the 2023 Conference on Empirical Methods in Natural Language Processing, pages 2511–2522, Singapore. Association for Computational Linguistics.
- Lu and Wang (2024) Xinyi Lu and Xu Wang. 2024. Generative students: Using llm-simulated student profiles to support question item evaluation. In Proceedings of the Eleventh ACM Conference on Learning @ Scale, L@S ’24, page 16–27, New York, NY, USA. Association for Computing Machinery.
- Mahjabeen et al. (2017) Wajiha Mahjabeen, Saeed Alam, Usman Hassan, Tahira Zafar, Rubab Butt, Sadaf Konain, and Myedah Rizvi. 2017. Difficulty index, discrimination index and distractor efficiency in multiple choice questions. Annals of PIMS-Shaheed Zulfiqar Ali Bhutto Medical University, 13(4):310–315.
- Markel et al. (2023) Julia M. Markel, Steven G. Opferman, James A. Landay, and Chris Piech. 2023. Gpteach: Interactive ta training with gpt-based students. In Proceedings of the Tenth ACM Conference on Learning @ Scale, L@S ’23, page 226–236, New York, NY, USA. Association for Computing Machinery.
- Martone and Sireci (2009) Andrea Martone and Stephen G. Sireci. 2009. Evaluating alignment between curriculum, assessment, and instruction. Review of Educational Research, 79(4):1332–1361.
- Moon et al. (2022) Hyeongdon Moon, Yoonseok Yang, Hangyeol Yu, Seunghyun Lee, Myeongho Jeong, Juneyoung Park, Jamin Shin, Minsam Kim, and Seungtaek Choi. 2022. Evaluating the knowledge dependency of questions. In Proceedings of the 2022 Conference on Empirical Methods in Natural Language Processing, pages 10512–10526, Abu Dhabi, United Arab Emirates. Association for Computational Linguistics.
- Moon et al. (2024) Hyeonseok Moon, Jaewook Lee, Sugyeong Eo, Chanjun Park, Jaehyung Seo, and Heuiseok Lim. 2024. Generative interpretation: Toward human-like evaluation for educational question-answer pair generation. In Findings of the Association for Computational Linguistics: EACL 2024, pages 2185–2196, St. Julian’s, Malta. Association for Computational Linguistics.
- Nguyen et al. (2024) Bang Nguyen, Mengxia Yu, Yun Huang, and Meng Jiang. 2024. Reference-based metrics disprove themselves in question generation. In Findings of the Association for Computational Linguistics: EMNLP 2024, pages 13651–13666, Miami, Florida, USA. Association for Computational Linguistics.
- Nguyen et al. (2022) Huy A. Nguyen, Shravya Bhat, Steven Moore, Norman Bier, and John Stamper. 2022. Towards generalized methods for automatic question generation in educational domains. In Educating for a New Future: Making Sense of Technology-Enhanced Learning Adoption: 17th European Conference on Technology Enhanced Learning, EC-TEL 2022, Toulouse, France, September 12–16, 2022, Proceedings, page 272–284, Berlin, Heidelberg. Springer-Verlag.
- Osterlind (1997) S.J. Osterlind. 1997. Constructing Test Items: Multiple-Choice, Constructed-Response, Performance and Other Formats. Evaluation in Education and Human Services. Springer Netherlands.
- Papineni et al. (2002) Kishore Papineni, Salim Roukos, Todd Ward, and Wei-Jing Zhu. 2002. Bleu: a method for automatic evaluation of machine translation. In Proceedings of the 40th Annual Meeting of the Association for Computational Linguistics, pages 311–318, Philadelphia, Pennsylvania, USA. Association for Computational Linguistics.
- Park et al. (2024) Jae-Woo Park, Seong-Jin Park, Hyun-Sik Won, and Kang-Min Kim. 2024. Large language models are students at various levels: Zero-shot question difficulty estimation. In Findings of the Association for Computational Linguistics: EMNLP 2024, pages 8157–8177, Miami, Florida, USA. Association for Computational Linguistics.
- Park et al. (2023) Joon Sung Park, Joseph O’Brien, Carrie Jun Cai, Meredith Ringel Morris, Percy Liang, and Michael S. Bernstein. 2023. Generative agents: Interactive simulacra of human behavior. In Proceedings of the 36th Annual ACM Symposium on User Interface Software and Technology, UIST ’23, New York, NY, USA. Association for Computing Machinery.
- Saha et al. (2024) Swarnadeep Saha, Omer Levy, Asli Celikyilmaz, Mohit Bansal, Jason Weston, and Xian Li. 2024. Branch-solve-merge improves large language model evaluation and generation. In Proceedings of the 2024 Conference of the North American Chapter of the Association for Computational Linguistics: Human Language Technologies (Volume 1: Long Papers), pages 8352–8370, Mexico City, Mexico. Association for Computational Linguistics.
- Song et al. (2025) Mingyang Song, Mao Zheng, and Xuan Luo. 2025. Can many-shot in-context learning help LLMs as evaluators? a preliminary empirical study. In Proceedings of the 31st International Conference on Computational Linguistics, pages 8232–8241, Abu Dhabi, UAE. Association for Computational Linguistics.
- Tavakol and Dennick (2011) Mohsen Tavakol and Reg Dennick. 2011. Post-examination analysis of objective tests. Medical teacher, 33(6):447–458.
- Wang et al. (2024) Peiyi Wang, Lei Li, Liang Chen, Zefan Cai, Dawei Zhu, Binghuai Lin, Yunbo Cao, Lingpeng Kong, Qi Liu, Tianyu Liu, and Zhifang Sui. 2024. Large language models are not fair evaluators. In Proceedings of the 62nd Annual Meeting of the Association for Computational Linguistics (Volume 1: Long Papers), pages 9440–9450, Bangkok, Thailand. Association for Computational Linguistics.
- Wang et al. (2022a) Xu Wang, Simin Fan, Jessica Houghton, and Lu Wang. 2022a. Towards process-oriented, modular, and versatile question generation that meets educational needs. In Proceedings of the 2022 Conference of the North American Chapter of the Association for Computational Linguistics: Human Language Technologies, pages 291–302, Seattle, United States. Association for Computational Linguistics.
- Wang et al. (2022b) Zichao Wang, Jakob Valdez, Debshila Basu Mallick, and Richard G Baraniuk. 2022b. Towards human-like educational question generation with large language models. In International conference on artificial intelligence in education, pages 153–166. Springer.
- Wei et al. (2022) Jason Wei, Xuezhi Wang, Dale Schuurmans, Maarten Bosma, Fei Xia, Ed Chi, Quoc V Le, Denny Zhou, et al. 2022. Chain-of-thought prompting elicits reasoning in large language models. Advances in neural information processing systems, 35:24824–24837.
- Xu and Zhang (2023) Songlin Xu and Xinyu Zhang. 2023. Leveraging generative artificial intelligence to simulate student learning behavior. arXiv preprint arXiv:2310.19206.
- Xu et al. (2024) Songlin Xu, Xinyu Zhang, and Lianhui Qin. 2024. Eduagent: Generative student agents in learning. arXiv preprint arXiv:2404.07963.
- Zeng et al. (2024) Zhiyuan Zeng, Jiatong Yu, Tianyu Gao, Yu Meng, Tanya Goyal, and Danqi Chen. 2024. Evaluating large language models at evaluating instruction following. In International Conference on Learning Representations (ICLR).
- Zhang et al. (2019) Tianyi Zhang, Varsha Kishore, Felix Wu, Kilian Q Weinberger, and Yoav Artzi. 2019. BERTScore: Evaluating text generation with BERT. arXiv preprint arXiv:1904.09675.
- Zhang et al. (2024) Zheyuan Zhang, Daniel Zhang-Li, Jifan Yu, Linlu Gong, Jinchang Zhou, Zhiyuan Liu, Lei Hou, and Juanzi Li. 2024. Simulating classroom education with llm-empowered agents. arXiv preprint arXiv:2406.19226.
- Zheng et al. (2023) Lianmin Zheng, Wei-Lin Chiang, Ying Sheng, Siyuan Zhuang, Zhanghao Wu, Yonghao Zhuang, Zi Lin, Zhuohan Li, Dacheng Li, Eric Xing, et al. 2023. Judging llm-as-a-judge with mt-bench and chatbot arena. Advances in Neural Information Processing Systems, 36:46595–46623.
Appendix A Appendix
A.1 Prompts for QG-SMS
We provide the prompts used in each step of our proposed approach in Fig. 6. For each requirement that we discussed in 4.1, we provide the following definition in the prompt:
-
•
Item difficulty (DC): “An easier question has a higher proportion of students with a correct answer.”
-
•
Item discrimination (DC): “A question with higher discrimination is more effective at distinguishing between high-performing and low-performing students.”
-
•
Distractor efficiency (DE): “An effective distractor is one that is chosen by at least 5% of the students taking the quiz.”
A.2 Experimental Details
Assembling Learning Materials : We used all information about the learning materials provided in each dataset to assemble . In EduAgent, includes lecture transcripts and the textual descriptions of the slides used in the lecture. In DBE-KT, includes the knowledge components and the associated description or definition.
Underlying LLM: For all LLM-based experiments with GPT-4o, we used the gpt-4o-2024-05-13 checkpoint.
Baseline implementation: For BERTScore, we use the implementation of Hugging Face evaluate222https://huggingface.co/docs/evaluate/en/index package (bertscore). For KDA333https://github.com/riiid/question-score and ChatEval 444https://github.com/thunlp/ChatEval, we used the code implementation provided by the authors. To obtain the expert personas for ChatEval, we utilized the AutoAgents interactive framework555https://github.com/Link-AGI/AutoAgents given instruction as described in 4.2. We used the implementation by Zeng et al. 2024666https://github.com/princeton-nlp/LLMBar for the remaining LLM-based evaluation approaches.
A.3 Human Evaluation Details
| Method | Diff. | Disc. | Dist. Eff. |
| Vanilla | 73.81 | 56.67 | 77.08 |
| CoT | 76.19 | 56.67 | 62.50 |
| Metrics | 71.43 | 53.33 | 81.25 |
| Reference | 73.81 | 53.33 | 75.00 |
| Swap | 76.19 | 63.33 | 77.08 |
| ChatEval | 83.33 | 43.33 | 72.92 |
| QG-SMS | 85.71 | 56.67 | 81.25 |
| Human | 90.48 | 53.33 | 87.50 |
Selection of human-written question pairs: In the EduAgent dataset, both questions in a (, ) pair comes from the same lecture. However, they can be grounded to either the same or different sections of the lecture. For example, in Fig. 1, is relevant to the Introduction to computer vision section, while is relevant to the Computer vision history section. To reduce the cognitive load for annotators, we opt for question pairs that are grounded to the same section in the same lecture. Based on this condition, we selected 60 pairs of human-written questions that exhibit differing quality: 21 pairs in the DF dimension, 15 pairs in the DC dimension, and 24 pairs in the DE dimension.
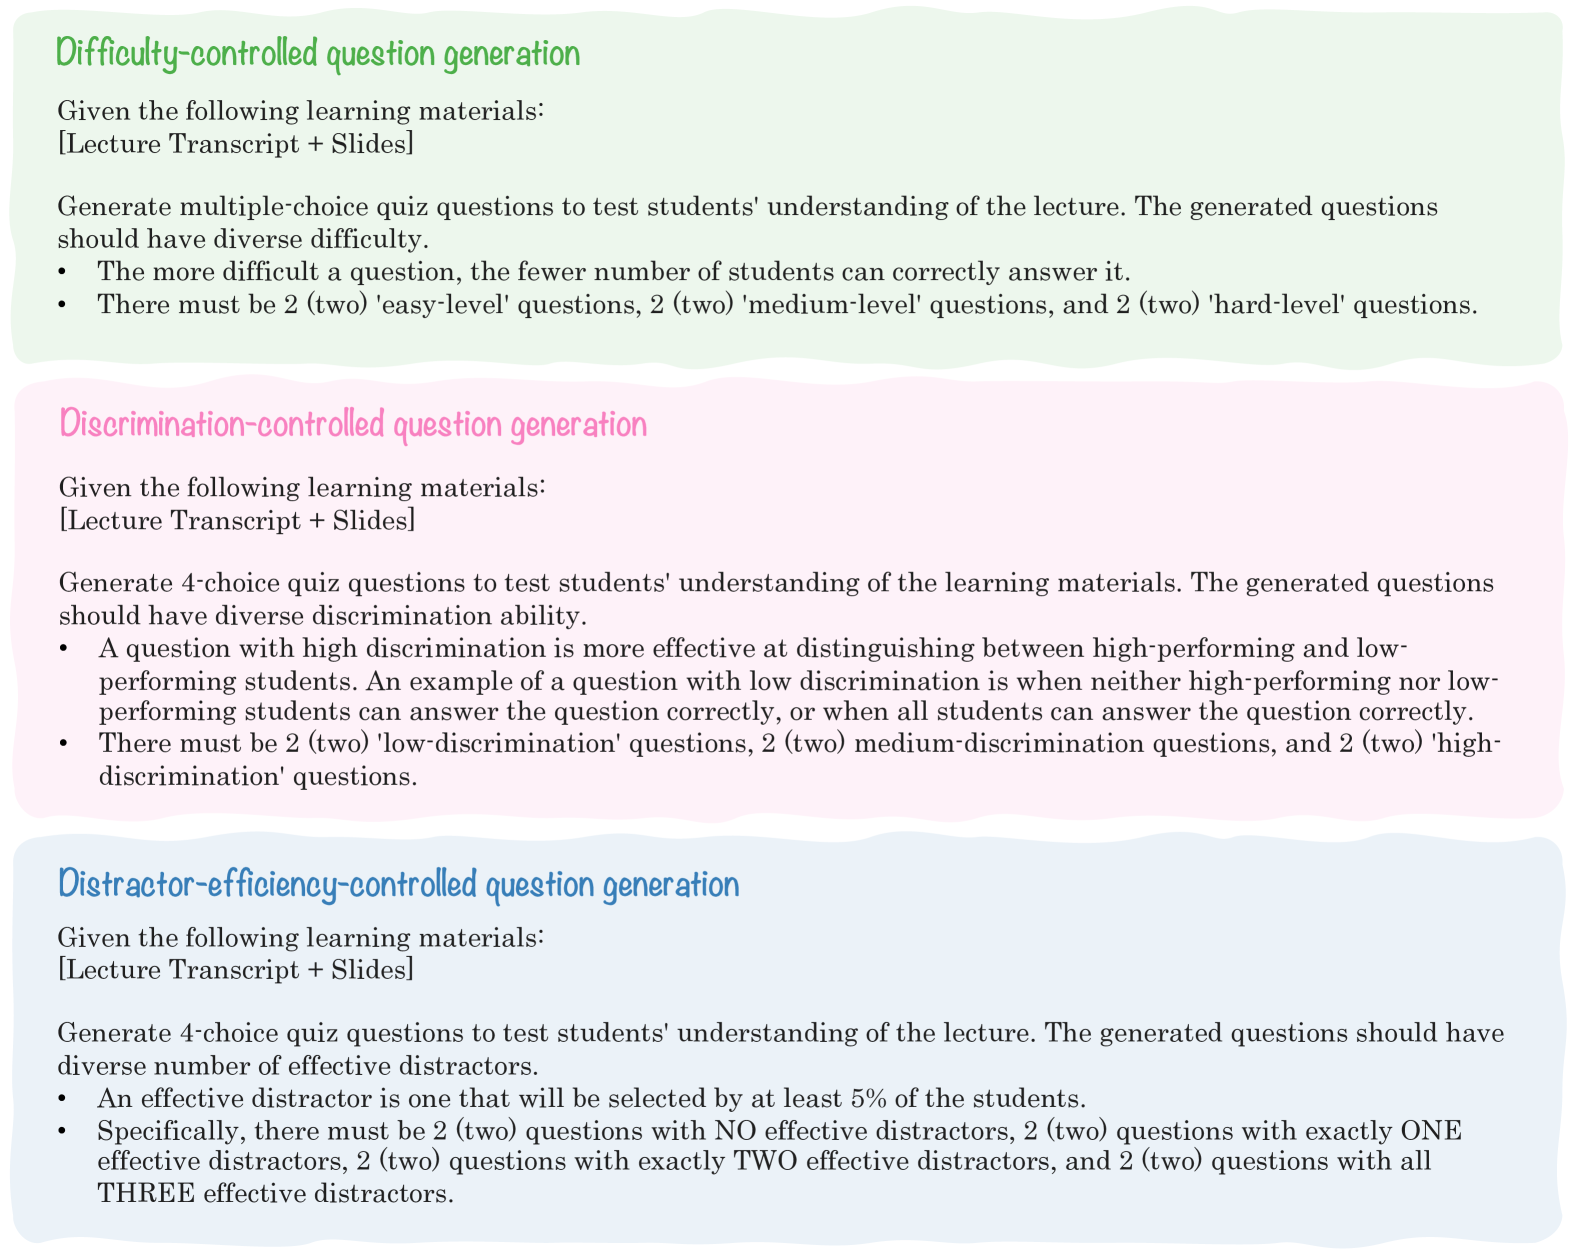
Construction of generated question pairs: To generate questions with varying quality regarding dimension , we use the zero-shot prompts provided in Fig. 7. Using GPT-4o with the gpt-4o-2024-05-13 checkpoint, we obtained a question bank of 360 generated questions across 5 lectures. Then, for each of the 60 human-written pairs, we construct a generated question pair grounded to the same section of the corresponding lecture and differs in the corresponding dimension .
Instructions for annotators: For each pair, we asked annotators to first read the section of the lecture that the pair is grounded upon before determining their preference. We provided our human annotators the same definition of each dimension in 2.1 and the desirable trait in 4.1. In this way, human annotators serve as another QG evaluation competitor for the human-written pairs, and provide the label for the generated-question pairs.