Experimental and numerical study of CO2 dissolution in a heterogeneous Hele-Shaw cell
Abstract
We investigate the convective instability resulting from the dissolution of carbon dioxide (CO2) into water in a heterogeneous Hele-Shaw cell utilizing both experimental and numerical approaches. Experiments are conducted in a Hele-Shaw cell with a variable gap width corresponding to a log-normally distributed permeability of variance . Two mean gaps (370 m and 500 m) with the same correlation lengths ( = 0.032 m and = 0.016 m) are considered. Experiments in homogeneous cells with a constant gap are also performed. The CO2 partial pressure () is varied between (0.12 bar) and (0.85 bar). The convective patterns are visualized using Bromocresol green. The effect of the heterogeneity on the instability is analyzed through its wavenumber, amplitude and growth rate. There is a good agreement between the experimental and numerical results. Fingers appear more dispersive and distorted in the heterogeneous media. Heterogeneous cases display a larger instability amplitude, faster growth rate and smaller dimensionless wavenumber. This reflects that heterogeneity accelerates the instability and the merging of the fingers. A comparison of the autocorrelation function of the fingering patterns and the permeability field shows that heterogeneity increases the dimensionless correlation length of the fingering pattern, which slows down its growth when its size becomes comparable to the heterogeneity.
I Introduction
The need to reduce anthropogenic greenhouse gas emissions has catalyzed extensive research into carbon dioxide (CO2) sequestration, a technology aimed at reducing the environmental impact of CO2. Among the various options for sequestration, injecting CO2 into saline aquifers stands out due to its significant storage capacity, surpassing that of depleted hydrocarbon reservoirs [1]. This intrinsic advantage has driven a surge in scientific inquiry and technological innovations over the past few decades [2]. Numerous studies have investigated CO2 sequestration in homogeneous porous media experimentally using analogue fluids [3, 4] and in 3D granular porous media [5]. A comprehensive review of experimental, modeling, and field studies of CO2 sequestration in various underground formations can be found in Kalam et al. (2020) [6]. However, research specifically addressing the implications of heterogeneity on convective mixing remains limited.
The effect of heterogeneity has been mainly studied numerically. Heterogeneity reduces onset times [7], notably when permeability increases [8]. However, in vertically stratified media, the onset of perturbation can be delayed or accelerated depending on the relationship between the wavenumber of the permeability variation and the specific perturbation mode [9]. Heterogeneity alters the concentration patterns during CO2 dissolution. Depending on the correlation length and variance of the permeability, three flow regimes can be identified: fingering, dispersive, and channeling [10, 11]. Numerical simulations also showed that heterogeneity induces more pronounced fingering competition, greater variability in finger width, and a reduced mixing interfacial length [12].
Research has also shown that heterogeneity impacts CO2 trapping and dissolution processes. De Paoli et al. (2016) [13] demonstrated that anisotropic sedimentary rocks can dissolve significantly more CO2 than isotropic rocks. The main factor affecting dissolution fluxes is permeability connectivity, with highly connected structures being more efficient at trapping CO2 [1] and channeling [14] increasing mass transfer. However, the correlation length of the permeability has a limited effect on the dissolution flux [11].
Previous experimental studies have primarily focused on homogeneous media [15, 16, 17, 18, 19]. Few experiments have been conducted in heterogeneous porous media. Trevisan et al. (2015) performed experiments in synthetic sand reservoirs to investigate the impact of capillary heterogeneity on flow dynamics and the trapping efficiency of supercritical CO2 [20]. Furthermore, Fernø et al. (2023) [21] conducted repeated CO2 injections in a physical model of a faulted geological cross-section, revealing that heterogeneity reduces reproducibility, especially in fault-related areas. Notably, there has been no exploration of heterogeneous Hele-Shaw cells.
Our study hence aims to understand the impact of permeability heterogeneity on the convective instability generated during CO2 dissolution into water by analyzing key parameters, such as the instability wavenumber, amplitude and growth rate. We restrict our analysis to the Darcy regime, ensuring consistency with experimental and numerical setups. Methodologically, our approach integrates experiments conducted in two-dimensional Hele-Shaw cells with varying and constant gap thicknesses, alongside numerical simulations. The manuscript is organized as follows: First, we describe the experimental and numerical methodology. Then, we detail the experimental and numerical results and analyze the structure of the convective instability and fingering patterns. At the end, some concluding remarks are provided.
II Methodology
We study the dissolution of CO2 in water and the associated convective instability in homogeneous and heterogeneous media by means of experimental and numerical observations. In the following we describe the experimental set up, the experimental images analysis and the numerical methods used in the simulations.
II.1 Experimental setup
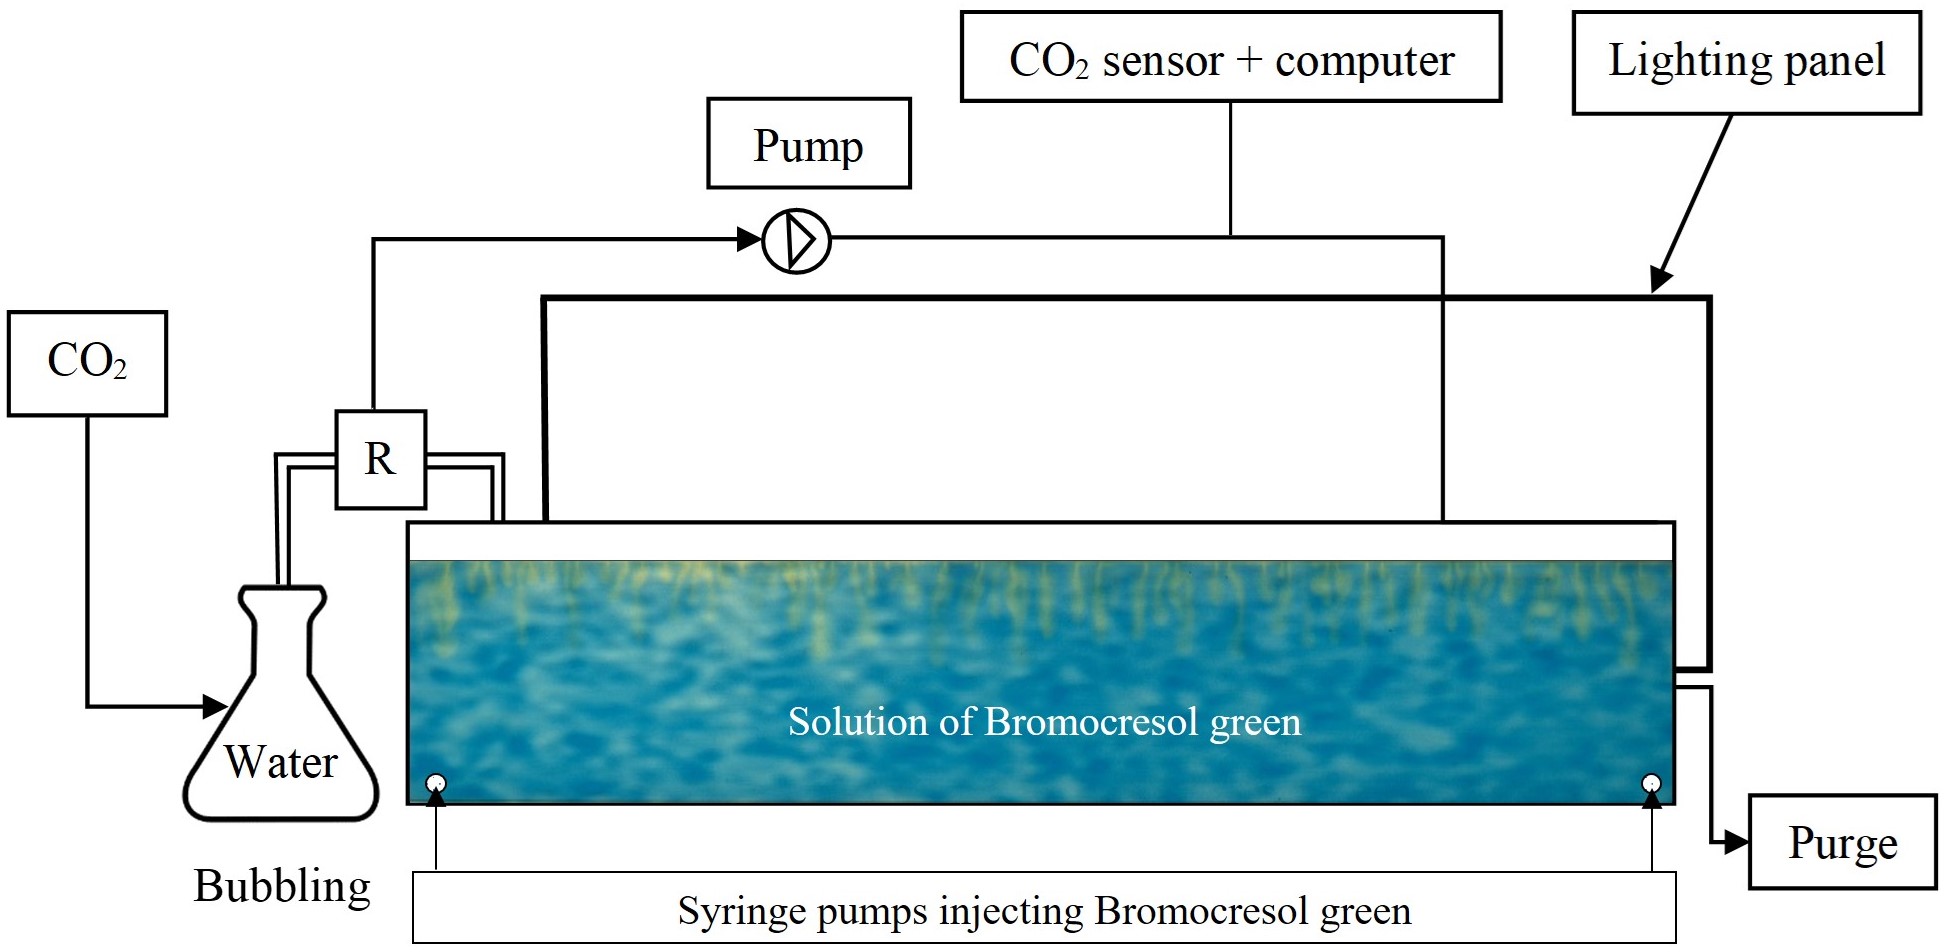
A schematic of the experiment is presented in Figure 1. The Hele-Shaw cells were constructed using polymethylmethacrylate. They have a length m. The cell is initially filled up to a height m with a mol/L aqueous solution of basic Bromocresol green, a pH-sensitive dye. When CO2 is introduced above the free surface of the aqueous solution, it dissolves in a thin diffusive layer just below the interface. The high density of the water enriched by CO2 triggers the convective instability. Since the CO2 is acidic, the color of the front turns yellow when dissolution starts. CO2 is bubbled in an Erlenmeyer flask filled with 250 ml of water to minimize evaporation and then injected into another small reservoir (R in Figure 1) connected to the Hele-Shaw cell by a pump. During injection a purge remains open to allow air to escape and prevent a drastic drop in the interface level. When the desired CO2 pressure, , is reached, the injection is stopped and the purge closed. Experiments were performed for and . A lighting panel is placed behind the cell and a camera in front. The field of view of the camera excluded the left 3 cm of the cell. Images were acquired every 30 seconds.
Experiments were conducted in homogeneous cells with constant gap width in order to compare the experimental observations of the heterogeneous cases. For the homogeneous cells, gap widths m were chosen. These values ensure that the Brinkman term is negligible [19], i.e., , where
| (1) |
| (2) |
with is the buoyancy velocity, m2/s is the diffusion coefficient of CO2 in water, the porosity (equal to 1 here), is the cell permeability and is the gravitational acceleration. The density difference depends on the CO2 partial pressure as
| (3) |
where is the density of water, is the chemical expansion coefficient of the density, the Henry’s constant of CO2 in water ( MPa-1), and kg/(ms) is the viscosity of water considered constant [22]. The parameters of the different experiments are summarized in Table 1.
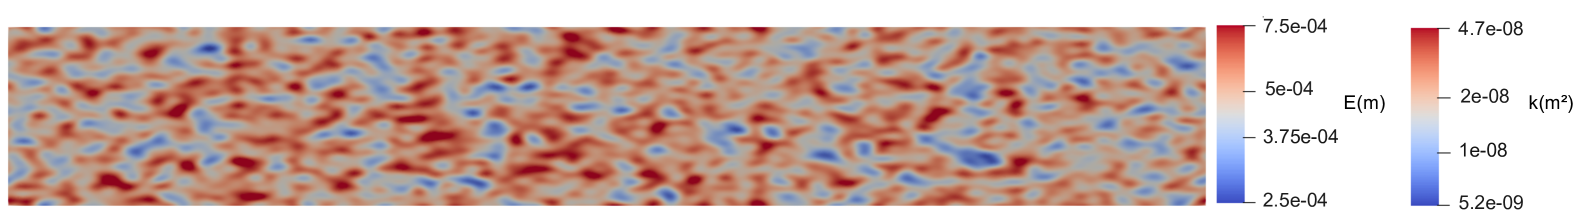
Heterogeneous cells were constructed by engraving one side of the cell with a gap thickness pattern with an accuracy of m. The pattern was obtained by transforming to depth a log-normally distributed permeability field generated using a Gaussian correlation function with horizontal correlation length m and vertical correlation length , to obtain a permeability structure resembling the natural stratification of sedimentary CO2 reservoirs. The selected is equal to ten times the theoretical critical wavelength proposed by Riaz et al., 2006 [23] with , which corresponds to . This decision was made to ensure that the size of the heterogeneity exceeds the scale of the instability. The variance of the log-permeability field was chosen as . this value ensures a permeability variation as large as possible while keeping the thickness nearly uniform in order for the flow to remain 2D at first order. Before engraving, the depth distribution was truncated to avoid very large and very small depth values.
The mean permeability was changed by adjusting the distance between the two plates of the cell. Two thickness ranges were used: 250 m m (Figure 2) and 120 m m. Both have a variance m2.
| m | m | ||||
|---|---|---|---|---|---|
| (%) | (kg/m3) | ||||
| 12 | 0.048 | 407 | 2.8 | 222.8 | 1.1 |
| 20 | 0.08 | 678 | 4.6 | 371.4 | 1.9 |
| 31 | 0.124 | 1051 | 7.2 | 575.6 | 2.9 |
| 46 | 0.184 | 1560 | 10.7 | 854.1 | 4.33 |
| 74 | 0.304 | 2577 | 17.7 | 1411.1 | 7.2 |
| 85 | 0.34 | 2882 | 19.7 | 1578.3 | 8.0 |
II.2 Processing of the experimental images
The light intensity of the experimental images reflected the variable gap width of the heterogeneous Hele-Shaw cells, which prevented the conversion of light intensity to CO2 concentration. To remove the effect of the engraved pattern from the images, we performed a robust principal component analysis on the experimental images using the principal component pursuit (pcp) algorithm [24]. Principal component analysis considers that a matrix is composed of a low rank matrix plus a sparse matrix. The pcp method finds the low rank and sparse matrices using a minimization algorithm. In our case, is the matrix resulting of stacking the initial state of the cell with an image at a given time. An example of the image processing can be seen in Figure 3. After the decomposition, the sparse matrix contains a less noisy picture of fingering patterns more suitable for the instability analysis.

II.3 Numerical simulations
Under the assumptions of incompressible fluid and the validity of the Boussinesq approximation, the governing equations for variable-density single-phase flow in a Hele-Shaw cell are [23]:
| (4) |
| (5) |
| (6) |
where is the Darcy velocity, is a normalized CO2 concentration, a linear function of concentration
| (7) |
with a function of the partial CO2 pressure given by (3) and is the dispersion tensor defined as [25]
| (8) |
with being the identity matrix, the diffusion coefficient and , the longitudinal and transverse dispersion coefficients, respectively.
The dispersion tensor takes into account the mixing induced by velocity variations across the gap thickness. The resulting longitudinal Taylor dispersion can be estimated as [26]
| (9) |
where is the Péclet number computed using the buoyancy velocity , gap thickness and diffusion . The longitudinal dispersion coefficient is then calculated as
| (10) |
The transverse dispersion coefficient has been observed to be smaller than by a factor of 5–20 [27]. Here is taken as .
For the gap thickness and CO2 pressure considered, (see Table 1). For most of the considered cases, dispersion was smaller than . Only for the cases with a mean gap of 500 m and , dispersion was comparable or slightly bigger than .
Equations (4 – 6) were solved in a rectangular domain. All boundaries are no flow, zero concentration gradient boundaries except for the top one where concentration is prescribed. An error function
| (11) |
where is the Heaviside function, a uniformly distributed variable between 0 and 1, and are the width and amplitude of the perturbation, respectively, and is taken equal to 30 s. Numerical simulations were performed using the variable-density flow and transport solver rhoDarcyFoam belonging to the open-source computational framework SECUReFoam [28], based on the finite-volume library OpenFOAM [29].
III Results and discussions
This section presents the numerical and the experimental results obtained. We compare the homogeneous and the heterogeneous experiments analyzing the fingers shape, the wavenumber, the amplitude of the instability and its growth rate.
III.1 Fingers morphology
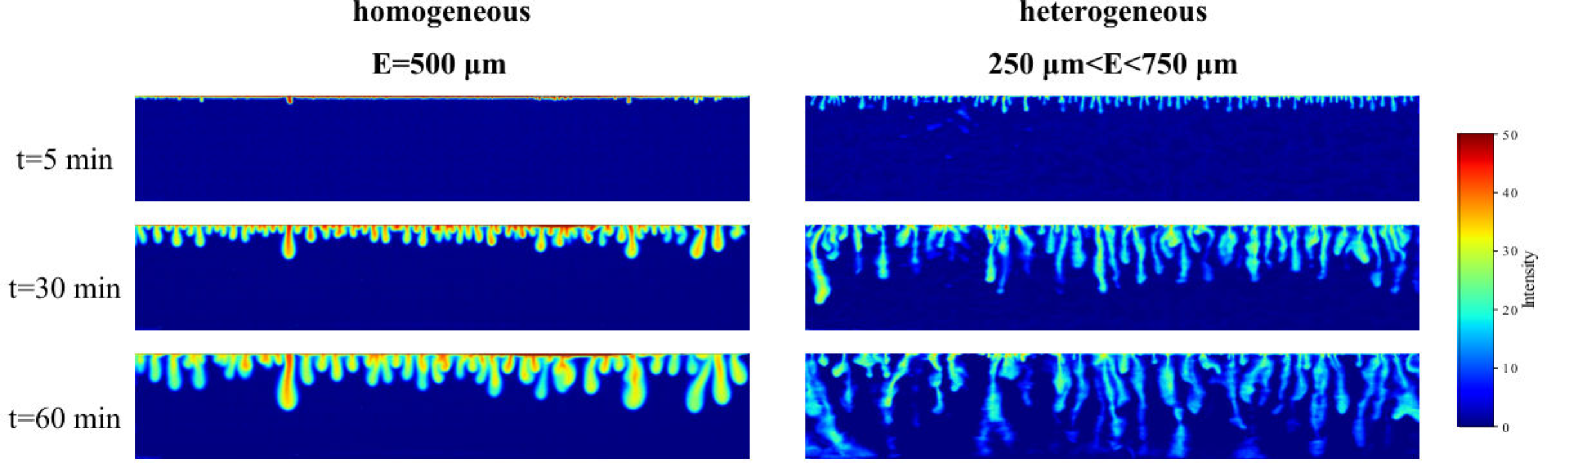
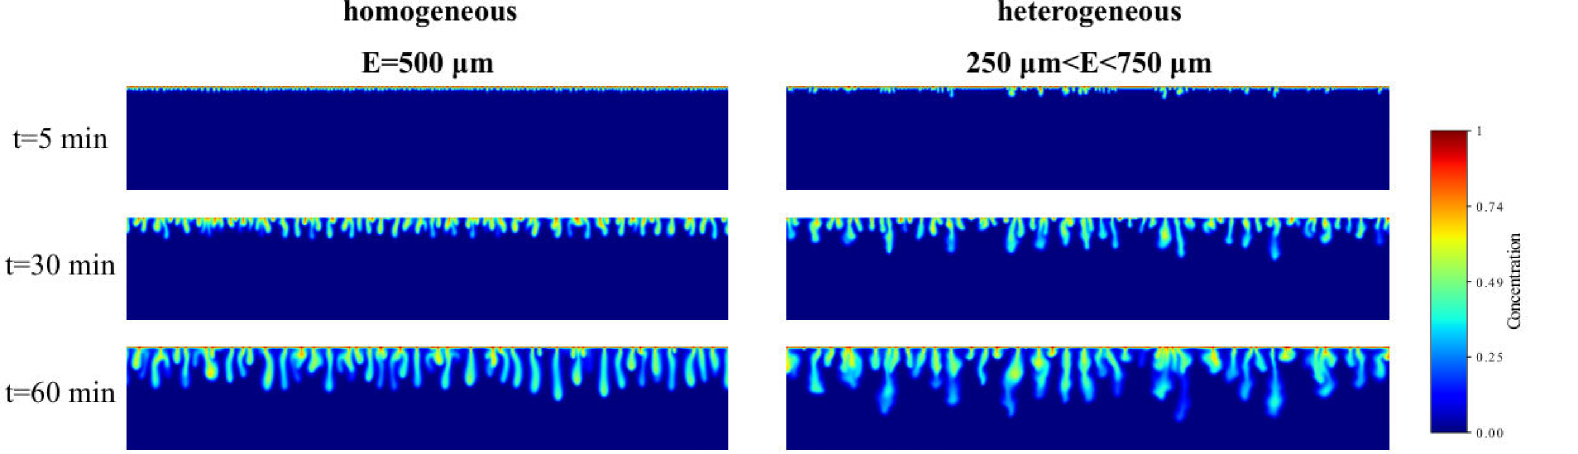
Experimental homogeneous and heterogeneous fingering patterns are noticeably different. In the heterogeneous case, fingers appear distorted and dispersive in comparison to their smoother homogeneous counterparts (Figure 4 and figures S1 – S18 in the supplementary material [30]). The same features are observable in the numerical simulations (Figure 5). Moreover, the fingers look thicker in the numerical heterogeneous case compared to their homogeneous counterparts. This fingering pattern is in agreement with the classification of Farajzadeh et al. (20110) [10] based on the Dykstra-Parson coefficient [31, 32]. Our heterogeneity field has , which place our system in the dispersive regime fingering pattern. Similar patterns can be obtained for other heterogeneity models as, for example, impervious barriers smaller that the size of the finger size [33].
Additionally, in the heterogeneous case, fingers exhibit a faster growth leading them to reach the bottom of the medium more rapidly than the homogeneous case. The frequency of finger merging is also higher in heterogeneous cases due to the presence of zones of higher and lower permeability. This contrasts with homogeneous cases, where interactions between fingers are less pronounced, resulting in a reduced merging frequency, a trend consistent in numerical and experimental observations.
III.2 Amplitude of the instability
The amplitude of the instability is quantified by calculating the standard deviation of the front’s position
| (12) |
where the overline indicates an average in the horizontal direction. In the numerical results, is determined by 0.1 concentration contour. The experimental images were converted to binary images using a threshold before extracting the contour of the fingering pattern. This process effectively removes the effect of the noise caused by the variable gap width and delineates the boundary where the concentration reaches a specified level.
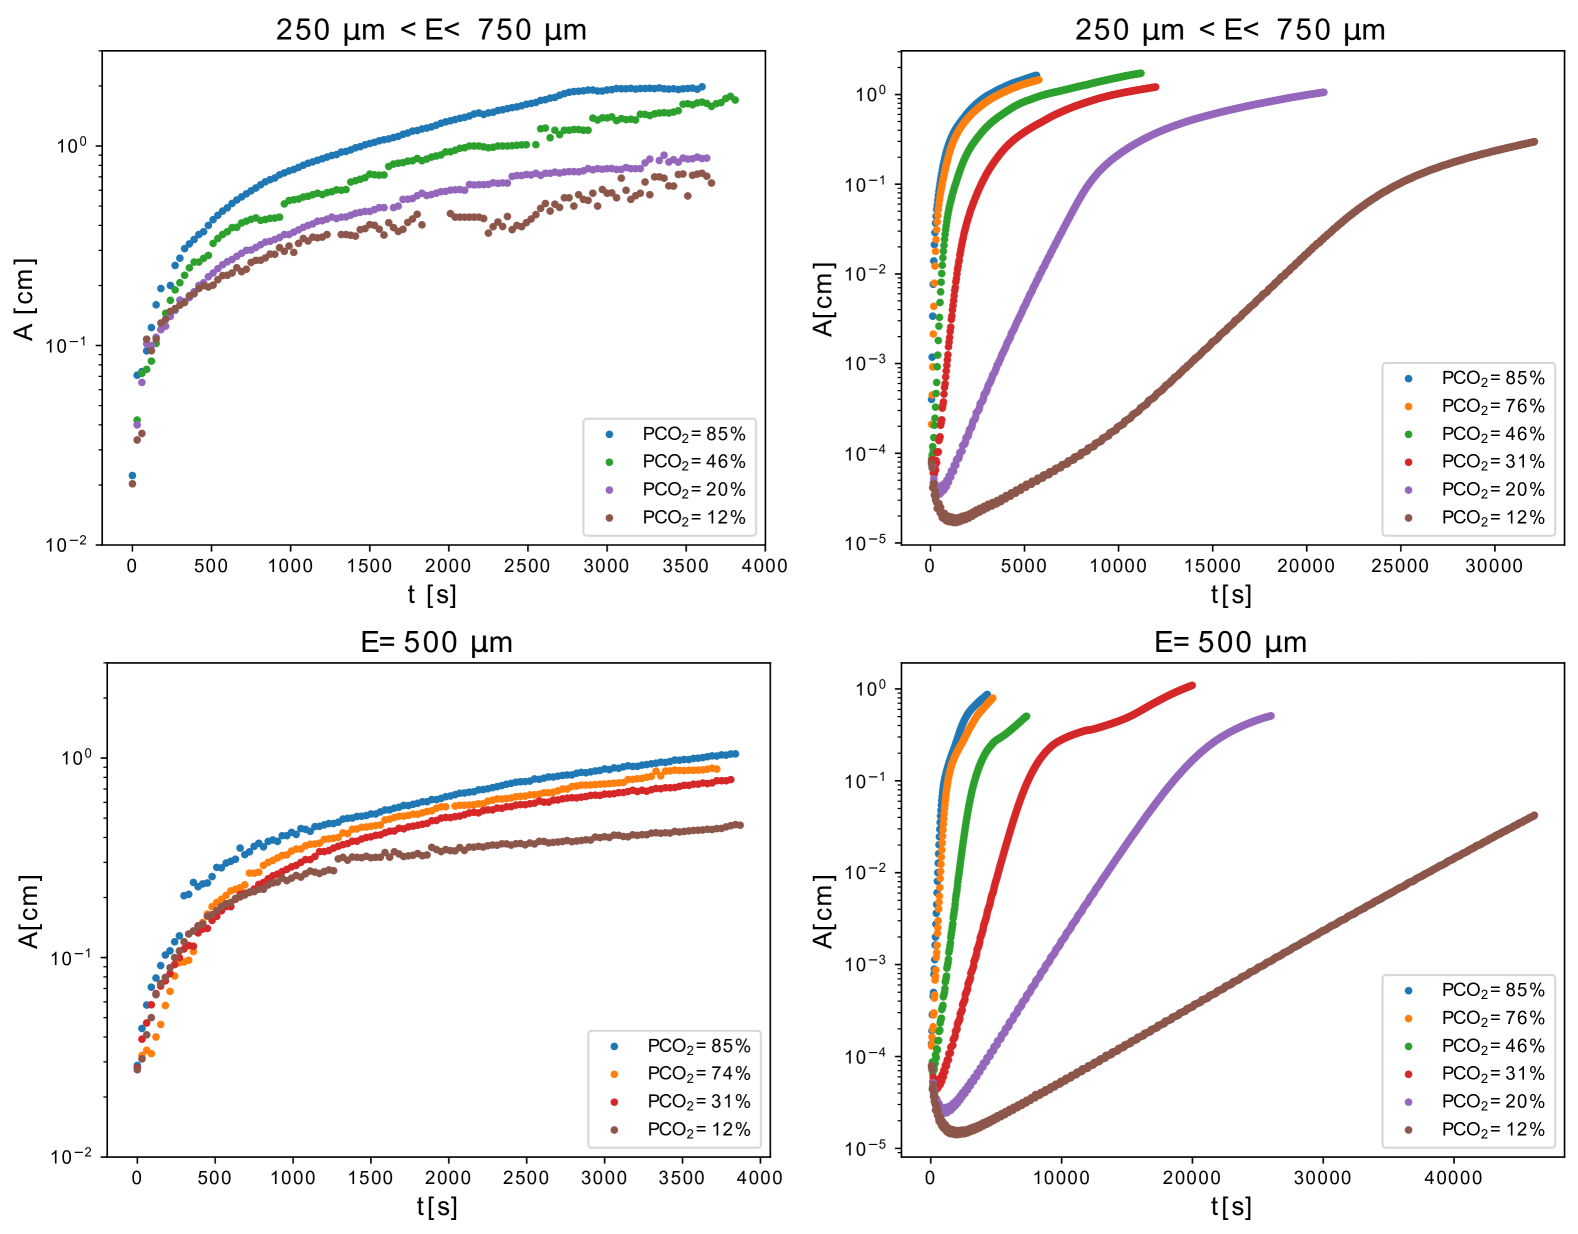
Figure 6 shows the amplitude evolution for the heterogeneous case m m and the homogeneous case m obtained experimentally and numerically. We observe that heterogeneity increases the amplitude of the front, being approximately twice as large as the homogeneous case. The amplitude is proportional to and gap thickness (for different gap cases see figure S19 in the supplementary material [30]).
Numerical results display longer times for the development of the instability. However, once the instability develops, similar behavior is observed. The amplitude is slightly smaller in the numerical simulations compared to the experimental observations. This can be attributed to the additional small scale heterogeneity introduced by the engraving of the cell and to a weaker initial noise in the numerical simulations than in the experiments.
III.3 Instability growth rate
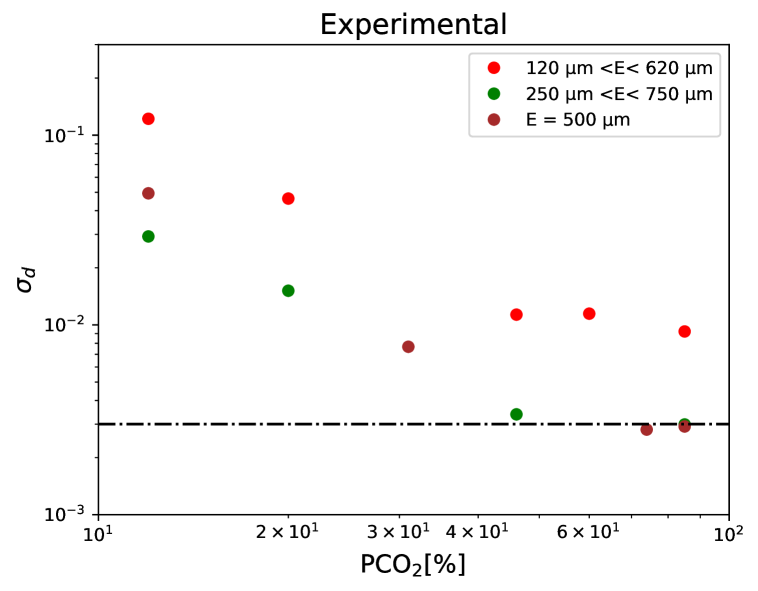
The growth rate of the instability is derived from the evolution of the amplitude of the front with time (Figure 6). The growth rate is defined as the slope observed in the linear phase, which corresponds to the early stage of the instability where it grows steadily [34]. Since the growth rate scales with , is proportional to (and, therefore, ). To compare the different cases, we define the dimensionless growth rate as
| (13) |
Figure 7 shows the numerical and experimental results for . To account for the uncertainty in the definition of the linear regime, the growth rate was estimated by shifting the beginning and end of the time interval by minutes. The numerical growth rate has a relative standard error (RSE) between 0.1% and 18.6% with a mean RSE of 8.8%. The experimental growth rate has a RSE between 3.5% and 21.5% with a mean of 3.9%. In both cases, the biggest error corresponds to the heterogeneous case with lowest and the smallest error to the homogeneous case.
The homogeneous numerical simulations closely match the numerical prediction put forth by Elenius and Johannsen (2012) [34] and previously observed experimentally in low Hele-Shaw cells [19]. The growth rates in the heterogeneous scenarios are roughly three times greater than those of the homogeneous cases with no significant dependence on or gap width. The same behavior is observed in the experimental results. The agreement between numerical and experimental results is better for the high values of . This is due to the difficulty to filter the noise for the cases with low CO2 concentration and small pH indicator color contrast. In real aquifers, the heterogeneity is usually much larger than chosen in this study. It is thus possible that the instability develops much faster in real conditions than predicted by the classical models without heterogeneity.
III.4 Instability wavenumber
We analyze the instability in terms of most unstable mode using the wavenumber of the instability [19]. The dimensionless wavenumber is defined as
| (14) |
where is the number of fingers. The number of fingers is counted by identifying the peaks in a region of interest (ROI) located at the top 5% of the vertical axis. Gaussian smoothing is applied to the data to reduce the noise and improve the visibility of peaks. Local maxima are detected using a maximum filter, which highlights points that are higher than their neighbors. A threshold, set to the 95th percentile of the smoothed data within the ROI, is used to filter out minor fluctuations and retain significant peaks. The peaks organize themselves in vertical lines that delimit the fingers’ centers. Only the highest point in each vertical line is retained to ensure that it corresponds to a finger. The correspondence between the identified peaks and the fingers is finally verified visually by overlaying the peaks on the smoothed concentration field. An estimation of the variability of the wavenumber was obtained by calculating using the distance between each pair of fingers. The numerical wavenumber has a RSE between 1.8% and 12.8% with a mean RSE of 5.5% . The experimental wavenumber has a RSE between 2.8% and 8.9% with a mean of 5.4%. Again the highest errors correspond to the lowest heterogeneous cases.
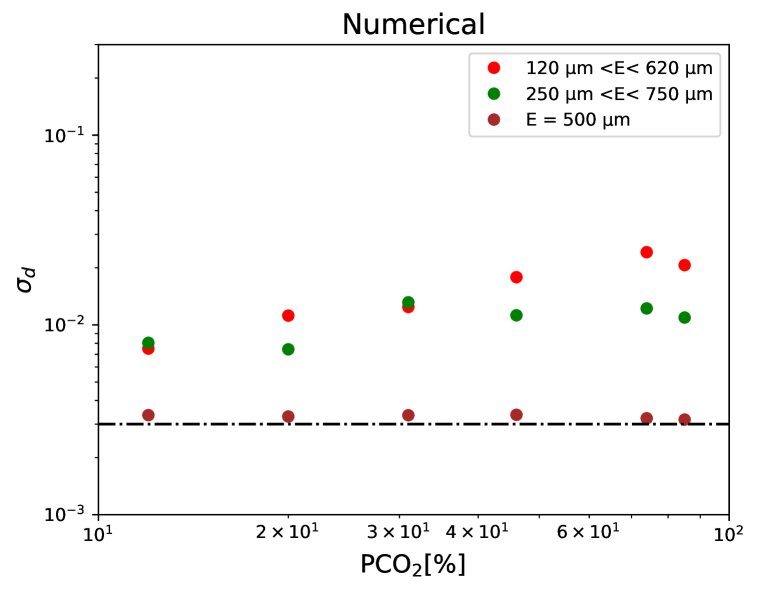
Figure 8 shows for the cases m m and at selected times. Time is measured relative to the time for the onset of convection for the numerical results. Experimentally, convection starts immediately after the stop of the CO2 injection, while numerically convection is delayed differently depending on . The numerical onset time of the instability is taken as the time for the minimum flux, calculated as the diffusive flux on the top boundary (see figure S22 and S23 in supplementary material [30]).
The values obtained for the wavenumber in the homogeneous case at early times closely match the theoretical value obtained by Riaz et al. (2006) [23]). The agreement is particularly good in the numerical simulations. We observe a decrease in with time, caused by the reduction of as fingers merge.
Similarly to the observations by Li et al. (2019) [35], a comparison between the homogeneous and heterogeneous cases reveals that, both numerically and experimentally, does not change significantly with heterogeneity particularly with lower . This is probably due to a locking of the instability to the wavelength of the forcing due to the heterogeneity. Indeed, the theoretical dimensionless wavenumber of the instability is close to the dimensionless wavenumber of the heterogeneity (, purple dash-dotted line in Figure 8) at small .
The difference between the two gap widths considered is smaller than the effect of or heterogeneity (see figure S19 in supplementary material [30] for the m homogeneous and heterogeneous cases). However, for small , the wavenumber tends to be a little higher for m than for m, suggesting that finger merging is more efficient with larger gap thicknesses.
III.5 Interaction between heterogeneity and fingering instability
To analyze the effect of the heterogeneity on the evolution of the instability, we analyze the overall fingering patterns by means of the autocorrelation function defined as
| (15) |
where is the function representing the fingering pattern and is the two-dimensional Fourier transform. The shape of ACF indicates the presence of periodic structures. The size of the periodic structure can be determined by fitting to a Gaussian variogram [36]
| (16) |
where is the sill and is the range of the variogram. We define the effective range of the variogram as the distance for which . For the Gaussian variogram . It is, therefore, representative of the correlation length of the pattern and, thus, of the finger width. We limit ourselves to the analysis of the numerical results because the Fourier spectrum of the experimental images was too noisy even after being processed with the pcp method.
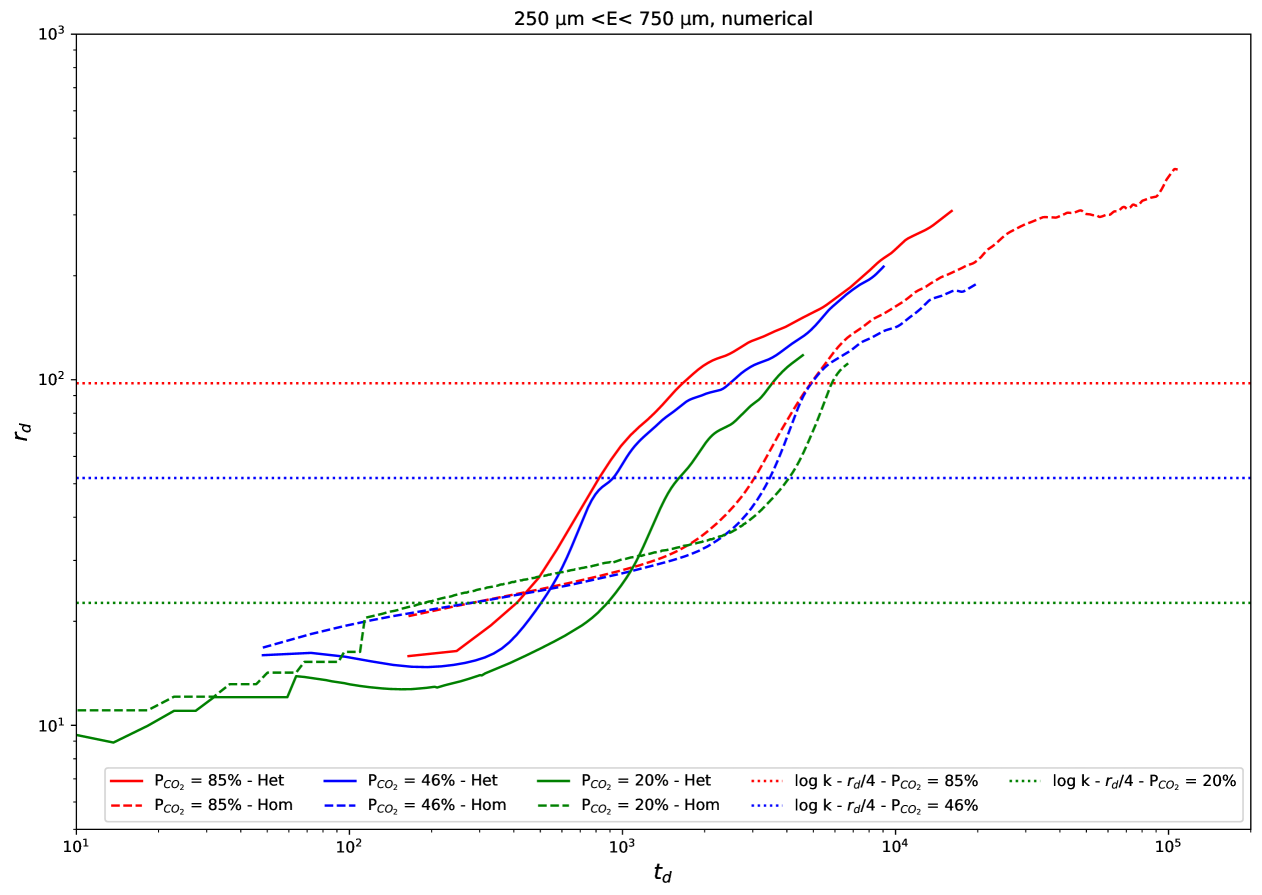
Figure 9 presents the evolution of the dimensionless effective range versus the dimensionless time of the patterns together with the dimensionless effective ranges of the permeability field (see figure S21 in the supplementary material [30] for the other case with m m). Initially, high cases have a smaller than low cases. This corresponds to the small fingers observed with high . However, the higher is, the earlier and faster grows. At late times, high cases have a higher . The range in heterogeneous cases increases at a faster rate compared to the homogeneous cases. The range is always larger for the heterogeneous cases, which supports the conclusion that heterogeneous fingers are thicker and less spaced apart than their homogeneous counterparts. It is also consistent with the smaller dimensionless wavenumber observed in the heterogeneous cases. We also observe two regimes in the range evolution. First, a sudden growth after the onset of convection and then a change in the slope around one fourth of the range of the log-permeability field (horizontal dotted line in Figure 9). When the ranges of the heterogeneity and the instability are comparable, the instability-range growth slightly diminishes, suggesting that the relative size between the fingers and heterogeneity affects the pattern size.
IV Conclusions
We studied CO2 dissolution in a heterogeneous Hele-Shaw cell numerically and experimentally. Fingers morphology shows that patterns exhibit more dispersion and distortion in heterogeneous scenarios compared to their smoother homogeneous counterparts. The evolution of the size of the fingering patterns given by the autocorrelation function showed that heterogeneity accelerates the growth of the fingering patterns with respect to the homogeneous cases. This is confirmed by the growth rate obtained from the amplitude of the instability. Low cases seem to be less affected by the heterogeneity as reflected by the behavior of the instability wavelength. This suggests an interaction between the scales of the heterogeneity and the instability that affects the pattern evolution, which deserves further investigation. In conclusion, heterogeneity amplifies the convective instability’s amplitude and accelerates the growth rate. This implies that heterogeneous porous media enhance secure CO2 storage by enhancing CO2 dissolution, thereby mitigating leakage risks.
Acknowledgements.
This project has received funding from the European Union’s Horizon 2020 research and innovation program under the Marie Skłodowska-Curie grant agreement N°956457. RB and JJH acknowledge the support of the MICIU/AEI/10.13039/501100011033 and the European Union NextGenerationEU/PRTR through the grant ESFERA CNS2023-144134.References
- Ershadnia et al. [2021] R. Ershadnia, S. Hajirezaie, A. Amooie, C. D. Wallace, N. I. Gershenzon, S. A. Hosseini, D. M. Sturmer, R. W. Ritzi, and M. R. Soltanian, CO2 geological sequestration in multiscale heterogeneous aquifers: Effects of heterogeneity, connectivity, impurity, and hysteresis, Advances in Water Resources 151, 103895 (2021).
- Ajayi et al. [2019] T. Ajayi, J. S. Gomes, and A. Bera, A review of CO2 storage in geological formations emphasizing modeling, monitoring and capacity estimation approaches, Petroleum Science 16, 1028 (2019).
- Emami-Meybodi et al. [2015] H. Emami-Meybodi, H. Hassanzadeh, C. Green, and J. Ennis-King, Convective dissolution of CO2 in saline aquifers: Progress in modeling and experiments, International Journal of Greenhouse Gas Control 40, 10.1016/j.ijggc.2015.04.003 (2015).
- Ching et al. [2017] J.-H. Ching, P. Chen, and P. Tsai, Convective Mixing in Homogeneous Porous Media Flow, Physical Review Fluids 2, 014102 (2017).
- Brouzet et al. [2022] C. Brouzet, Y. Méheust, and P. Meunier, CO2 convective dissolution in a three-dimensional granular porous medium: An experimental study, Physical Review Fluids 7, 10.1103/PhysRevFluids.7.033802 (2022).
- Kalam et al. [2020] S. Kalam, T. Olayiwola, M. M. Al-Rubaii, B. I. Amaechi, M. S. Jamal, and A. A. Awotunde, Carbon dioxide sequestration in underground formations: review of experimental, modeling, and field studies, Journal of Petroleum Exploration and Production Technology 11, 303 (2020).
- Green and Ennis-King [2018] C. Green and J. Ennis-King, Steady flux regime during convective mixing in three-dimensional heterogeneous porous media, Fluids 3, 58 (2018).
- Chen et al. [2013] C. Chen, L. Zeng, and L. Shi, Continuum-scale convective mixing in geological CO2 sequestration in anisotropic and heterogeneous saline aquifers, Advances in Water Resources 53, 175 (2013).
- Ghorbani et al. [2017] Z. Ghorbani, A. Riaz, and D. Daniel, Convective mixing in vertically-layered porous media: The linear regime and the onset of convection, Physics of Fluids 29, 084101 (2017).
- Farajzadeh et al. [2011] R. Farajzadeh, P. Ranganathan, P. Zitha, and J. Bruining, The effect of heterogeneity on the character of density-driven natural convection of CO2 overlying a brine layer, Advances in Water Resources 34, 10.1016/j.advwatres.2010.12.012 (2011).
- Ranganathan et al. [2012] P. Ranganathan, R. Farajzadeh, J. Bruining, and P. Zitha, Numerical simulation of natural convection in heterogeneous porous media for CO2 geological storage, Transport in Porous Media 95, 10.1007/s11242-012-0031-z (2012).
- Li et al. [2019] Q. Li, W.-H. Cai, F.-C. Li, B. Li, and C.-Y. Chen, Miscible density-driven flows in heterogeneous porous media: Influences of correlation length and distribution of permeability, Physical Review Fluids 4, 10.1103/PhysRevFluids.4.014502 (2019).
- De Paoli et al. [2016] M. De Paoli, F. Zonta, and A. Soldati, Influence of anisotropic permeability on convection in porous media: Implications for geological CO2 sequestration, Physics of Fluids 28, 056601 (2016), https://pubs.aip.org/aip/pof/article-pdf/doi/10.1063/1.4947425/15637584/056601_1_online.pdf .
- Zhang et al. [2024] Q. Zhang, Q. Xu, Y. Yang, S. Iglauer, J. Liu, F. Liu, L. Zhang, H. Sun, K. Zhang, and J. Yao, Permeability heterogeneity effects on density-driven CO2 natural convection and carbon sequestration efficiency, Fuel 363, 130871 (2024).
- Kneafsey and Pruess [2011] T. J. Kneafsey and K. Pruess, Laboratory experiments and numerical simulation studies of convectively enhanced carbon dioxide dissolution, Energy Procedia 4, 5114 (2011), 10th International Conference on Greenhouse Gas Control Technologies.
- Backhaus et al. [2011] S. Backhaus, K. Turitsyn, and R. E. Ecke, Convective instability and mass transport of diffusion layers in a hele-shaw geometry, Physical Review Letters 106, 104501 (2011).
- Faisal et al. [2015] T. F. Faisal, S. Chevalier, Y. Bernabe, R. Juanes, and M. Sassi, Quantitative and qualitative study of density driven CO2 mass transfer in a vertical hele-shaw cell, International Journal of Heat and Mass Transfer 81, 901 (2015).
- Outeda et al. [2014] R. Outeda, C. El Hasi, A. D’Onofrio, and A. Zalts, Experimental study of linear and nonlinear regimes of density-driven instabilities induced by CO2 dissolution in water, Chaos: An Interdisciplinary Journal of Nonlinear Science 24, 013135 (2014), https://pubs.aip.org/aip/cha/article-pdf/doi/10.1063/1.4868040/13920511/013135_1_online.pdf .
- Vreme et al. [2016] A. Vreme, F. Nadal, B. Pouligny, P. Jeandet, G. Liger-Belair, and P. Meunier, Gravitational instability due to the dissolution of carbon dioxide in a hele-shaw cell, Physical Review Fluids 1, 10.1103/PhysRevFluids.1.064301 (2016).
- Trevisan et al. [2015] L. Trevisan, R. Pini, A. Cihan, J. Birkholzer, Q. Zhou, and T. Illangasekare, Experimental analysis of spatial correlation effects on capillary trapping of supercritical CO2 at the intermediate laboratory scale in heterogeneous porous media, Water Resources Research 51, 10.1002/2015WR017440 (2015).
- Fernø et al. [2023] M. Fernø, M. Haugen, K. Eikehaug, O. Folkvord, B. Benali, J. Both, E. Storvik, C. Nixon, R. Gawthrope, and J. Nordbotten, Room-scale CO2 injections in a physical reservoir model with faults, Transport in Porous Media 151, 1 (2023).
- McBride-Wright et al. [2014] M. McBride-Wright, G. C. Maitland, and J. P. M. Trusler, Viscosity and density of aqueous solutions of carbon dioxide at temperatures from (274 to 449) K and at pressures up to 100 MPa, Journal of Chemical & Engineering Data 60, 171 (2014).
- Riaz et al. [2006] A. Riaz, M. Hesse, H. A. Tchelepi, and F. M. Orr, Onset of convection in a gravitationally unstable diffusive boundary layer in porous media, Journal of Fluid Mechanics 548, 87 (2006).
- Candès et al. [2011] E. J. Candès, X. Li, Y. Ma, and J. Wright, Robust principal component analysis?, Journal of the ACM 58, 1 (2011).
- Scheidegger [1961] A. E. Scheidegger, General theory of dispersion in porous media, Journal of Geophysical Research 66, 3273–3278 (1961).
- Detwiler et al. [2000] R. L. Detwiler, H. Rajaram, and R. J. Glass, Solute transport in variable-aperture fractures: An investigation of the relative importance of Taylor dispersion and macrodispersion, Water Resources Research 36, 1611 (2000).
- Freeze and Cherry [1979] R. A. Freeze and J. A. Cherry, Groundwater (Pearson, Upper Saddle River, NJ, 1979).
- Icardi et al. [2023] M. Icardi, E. Pescimoro, F. Municchi, and J. Hidalgo, Computational framework for complex flow and transport in heterogeneous porous media, Engineering with Computers 39, 1 (2023).
- Weller et al. [1998] H. G. Weller, G. Tabor, H. Jasak, and C. Fureby, A tensorial approach to computational continuum mechanics using object-oriented techniques, Computers in Physics 12, 620 (1998).
- [30] See Supplemental Material at URL-will-be-inserted-by-publisher.
- Dykstra and Parsons [1950] H. Dykstra and R. Parsons, Secondary recovery of oil in the united states (API and DP, American Petroleum Institute, 1950) Chap. The Prediction of Oil Recovery by Waterflood., pp. 160–174.
- Jensen et al. [1997] Jensen, Lake, and Cobb, Statistics for petroleum engineers and scientists (Prentice-Hall, London, England, 1997).
- Green and Ennis-King [2014] C. P. Green and J. Ennis-King, Steady dissolution rate due to convective mixing in anisotropic porous media, Advances in Water Resources 73, 65–73 (2014).
- Elenius and Johannsen [2012] M. Elenius and K. Johannsen, On the time scales of nonlinear instability in miscible displacement porous media flow, Computational Geosciences 16, 10.1007/s10596-012-9294-2 (2012).
- Li et al. [2020] Q. Li, W.-H. Cai, B.-X. Li, and C.-Y. Chen, Numerical study of density-driven convection in laminated heterogeneous porous media, Journal of Mechanics 36, 1 (2020).
- Webster and Oliver [2007] R. Webster and M. A. Oliver, Geostatistics for Environmental Scientists, 2nd ed., Statistics in Practice (Wiley-Blackwell, Hoboken, NJ, 2007).