The dwarf irregular galaxy NGC 6822. II. Young, intermediate and old stellar populations: comparison between theory and observations
Abstract
This paper presents a quantitative analysis of the stellar content in the Local Group dwarf irregular galaxy NGC 6822 by comparing stellar evolution models and observations in color-magnitude diagrams (CMDs) and color-color diagrams (CC-Ds). Our analysis is based on optical ground-based photometry, and deep archive HST photometry of two fields in the galaxy disk. We compared young, intermediate-age, and old stellar populations with isochrones from the BaSTI-IAC library and found that NGC 6822 hosts a quite metal-rich ([Fe/H] = 0.7 to 0.4) young component with an age ranging from 20 to 100 Myr. The intermediate-age population experienced a modest chemical enrichment between 4 and 8 Gyr ago while stars older than 11 Gyr have a low metal abundance ([Fe/H]1.70). We also identified the AGB clump population with a luminosity peak at mag. Our analysis of both the CMD and the optical-NIR-MIR CC-Ds of AGB oxygen- and carbon-rich stars, using the PARSEC+COLIBRI isochrones with and without circumstellar dust, reveal that this stellar component exhibits a spread in age from 1 to 2 Gyr and in metallicity between [Fe/H]=1.30 and 1.70. The stellar models we used reproduce very well the two distinct color sequences defined by AGB O- and C-rich stars in the various optical-NIR-MIR CC-Ds, suggesting that they are reliable diagnostics to identify and characterise intermediate-age stellar populations. However, we also find that evolutionary prescriptions in the optical -() CMDs predict, at fixed color, systematically lower luminosities than observed AGB stars.
1 Introduction
The Local Group (LG) hosts six dwarf irregular (dIrr) galaxies that are fundamental laboratories of low-intensity and/or low-metallicity star formation in stellar systems of the local Universe: Magellanic Clouds (MCs), WLM, IC 10, IC 1613 and NGC 6822. The MCs are the most prominent and massive dIrr, but current theoretical and observational evidence indicates that they are in a mutual interaction with each other and probably tidally perturbed by the Milky Way (MW; see Besla et al., 2016; Zivick et al., 2018; Choi et al., 2022, and references therein). The others are more isolated and considered unique analogs of the star forming galaxies populating the universe at the peak of cosmic star formation history (Stott et al., 2013; Du et al., 2020). Among these, NGC 6822 is the stellar system most closely resembling the MCs in mass and luminosity. Indeed, there is evidence of a sizable sample of star clusters (Hwang et al., 2011; Huxor et al., 2013), and of a disk with an ongoing star formation activity (see i.e. Tantalo et al. 2022, hereinafter Paper I; Lenkić et al., 2023). Moreover, NGC 6822 is the closest dIrr to the MW after the MCs (d 510 10 kpc; Fusco et al., 2014), and one of the most investigated dIrr galaxies, due its position in the sky (R.A.(J2000) = , DEC(J2000) = ; Paper I) that makes it observable from both the northern and the southern hemispheres. Although it is commonly considered isolated, more recent studies on its orbital history speculated that it could have crossed the virial radius of the MW 3 Gyr ago (Zhang, Mackey & Da Costa, 2021; Bennet et al., 2023).
Owing to its low Galactic latitude ( and , Mateo, 1998) NGC 6822 is affected by a fair amount of extinction. Schlegel, Finkbeiner & Davis (1998)’s map provides a mean reddening along the line of sight mag. Several studies have shown that the galaxy is also affected by differential reddening, varying from mag near the center to mag in the outermost regions (Massey et al., 1995; Gallart, Aparicio & Vilchez, 1996a; Gieren et al., 2006; Fusco et al., 2012). The true distance modulus has been measured by using several different methods. The most recent estimates come from the tip of the red giant branch (TRGB; = 23.54 0.05 mag, Fusco et al., 2012), from the period-luminosity relation of classical Cepheids ( = 23.38 0.04 mag, Rich et al., 2014) and from the Mira variables ( = 23.38 0.16 mag, Whitelock et al., 2013).
The stellar content of NGC 6822 has been studied in detail by several authors during the last century. For example, Hubble succeeded in the identification of Classical Cepheids soon after his seminal investigation on M31 (Hubble, 1925). The emerging view is that NGC 6822 hosts stellar populations ranging from very young (a few Myr) to intermediate-age (a few Gyr) and old (t10 Gyr) low-mass stars (Paper I and references therein), suggesting that NGC 6822 experienced multiple star formation episodes over its entire life. A detailed star formation history (SFH) of the galaxy was determined by Gallart et al. (1996b, c), who found that the galaxy has most likely started to form stars from a low metallicity gas ( = 0.0001-0.0004) around 12-15 Gyr ago. They also found that the star formation rate (SFR) began to grow in last 400 Myr and there has been a further enhancement in the last 100-200 Myr over the whole body of the galaxy. Several years later, Wyder (2003) derived the SFHs of four fields with optical images collected with HST/WFPC2 covering the minor axis of NGC 6822. They found that the SFHs in the investigated fields are similar for ages older than Gyr. The SFRs are fairly constant up to Myr, but in the most recent epochs they show a drop of a factor of in the more external fields and a well defined increase in the field centered on the bar. Moreover, they also compared the derived SFRs with those expected from the typical gas surface densities at the galactocentric radii of the galaxy and they found that they are comparable, thus suggesting that no large-scale redistribution either of gas or of stars is required to take account for the inferred SFRs. More recently, Cannon et al. (2012) studied images of six HST/ACS fields along the HI major axis of NGC 6822 and derived their SFHs, supporting the results of Gallart et al. (1996b, c). They argued that a high fraction of the stars formed between 14 and 6 Gyr ago and half of the total stellar mass was built up in the last 5 Gyr. Furthermore, they also suggested that the SFR increased in the last 50 Myr. Besides, the outer ACS pointings showed more old stars than in the inner ones, suggesting an active star-forming region shrinking inward with time. Fusco et al. (2014) used the same data set provided by Cannon et al. (2012), but using a different technique, to compute the SFHs of the six fields. The solutions are consistent with Cannon et al. (2012), and revealed that the star formation activity in the selected fields, but one, has slowly decreased in the last 1 Gyr. Also, they derived the age-metallicity relation (AMR) for the last 5 Gyr disclosing that the metallicity raised with time from [Fe/H] 1 to [Fe/H] 0.5 in all the six fields. The main limitation of these detailed investigations is that they only cover a minor portion of the galaxy, with small fields typically located across the central regions.
Young stellar populations in NGC 6822 have been widely examined in the near-infrared (NIR), mid-infrared (MIR) and far-infrared (FIR) bands. A huge number of Young Stellar Objects (YSOs) have been identified and characterized by using both IR observations (see i.e. Jones et al., 2019; Hirschauer et al., 2020; Lenkić et al., 2023) and machine learning technique (Kinson et al., 2021), a clear indication that the galaxy is still actively forming stars.
Intermediate-age stellar tracers, such as red clump (RC) and asymptotic giant branch (AGB) stars, have also been extensively studied in NGC 6822. AGB stars are popular stellar tracers that can be easily identified in stellar systems hosting stellar populations older than 0.5 Gyr. However, in complex stellar systems that have experienced recent star formation events, like NGC 6822, the AGB component is typically dominated by intermediate-mass stars (2 M/M 8). Note that AGB stars are among the most important contributors to the IR integrated light of a galaxy (Renzini & Buzzoni, 1986) and play a key role in the chemical enrichment of galaxies, since they produce neutron-capture elements. The thermally pulsing AGB (TP-AGB) stars are classified according to their surface carbon-to-oxygen abundance ratios (C/O) in three different groups: C-type (C/O1), O-type (C/O1, denoted also as M-type) and S-type (C/O1). Their surface chemical composition is affected by complex physical mechanisms (e.g. 3rd dredge-up, convective overshooting, mass loss, hot bottom burning) mainly depending on the stellar mass and the metallicity of the environment in which they formed. The population ratio between C- and M-type (C/M) stars can be adopted to trace the metal content of the intermediate-age stellar populations (Battinelli & Demers, 2005a; Cioni, 2009) and metal-poor/metal-intermediate stellar systems, like NGC 6822, are fundamental laboratories to trace the variation of the population ratio (see i.e. Weiss & Ferguson, 2009). Furthermore, photometric investigations on their spatial distributions indicated that the C-rich stars are more centrally concentrated than the O-rich stars (Paper I and references therein). This means that a comprehensive analysis of AGB stars covering the entire body of NGC 6822 can provide solid constraints on the role played by the environment on AGB evolution (Letarte et al., 2002; Kang et al., 2006; Kacharov et al., 2012; Sibbons et al., 2012, 2015; Hirschauer et al., 2020; Nally et al., 2024).
Nally et al. (2024) recently analyzed NIR and MIR images from the James Webb Space Telescope (JWST) to investigate AGB stars in NGC 6822, particularly to identify the AGB clump. However, their analysis of AGB stars was mainly based on a variety of NIR/MIR Color-Magnitude Diagrams (CMDs) and luminosity functions. Furthermore, a complete identification of these evolved stars can lead to a better understanding of the dust production process in a galaxy. There is mounting observational evidence that AGB stars are the primary sources of dust production in stellar systems (i.e. Boyer et al., 2011, 2012, 2015a, 2015b; Whitelock et al., 2018; Jones et al., 2018; Nally et al., 2024). Indeed, Boyer et al. (2012) found that C-rich stars contribute of the total dust injection in the SMC against the of red super-giants (RSGs).
This is the second paper of a series mainly focused on the stellar content of NGC 6822. The photometric catalog was introduced in Paper I together with solid photometric diagnostics for the identification of O- and C-rich AGB stars. Moreover, we used the population ratio C/M to constrain the mean metallicity of the intermediate-age stellar population. Previous investigations of stellar populations in NGC 6822 based on HST data (see i.e. Cannon et al., 2012; Fusco et al., 2014), were hampered by the limited area covered by the six ACS fields along the disk major axis, and by the limiting magnitude marginally reaching the oldest main sequence turn-off (MSTO) stars.
In the current investigation we take advantage of our optical ground-based data set, sampling nearly all of the galaxy, together with two very deep and accurate optical pointings based on ACS and WFC3 images to perform a more quantitative comparison in ground- and in space-based CMDs between cluster isochrones and observations. This comparison aims to provide constraints on the range in age and metallicity covered by old, intermediate, and young stellar populations. We also performed a detailed comparison in CMDs and in color-color diagrams (CC-Ds) with cluster isochrones, both taking into account and neglecting the presence of circumstellar dust in TP-AGB stars. Such comparisons between theory and observations are crucial to validate the photometric criteria adopted to select the candidate AGB stars.
The structure of the paper is as follows. Section 2 describes the selection criteria adopted to identify star samples, in the optical catalog, representative of the young, intermediate and old stellar populations. It also shows the outcomes of both these sub-samples and HST CMDs analysis. Section 4 deals with AGB stars and the comparison with stellar evolution models either including or neglecting the presence of the dust. In Section 5 we summarise the results and outline the near future plans of the current project.
2 Observations
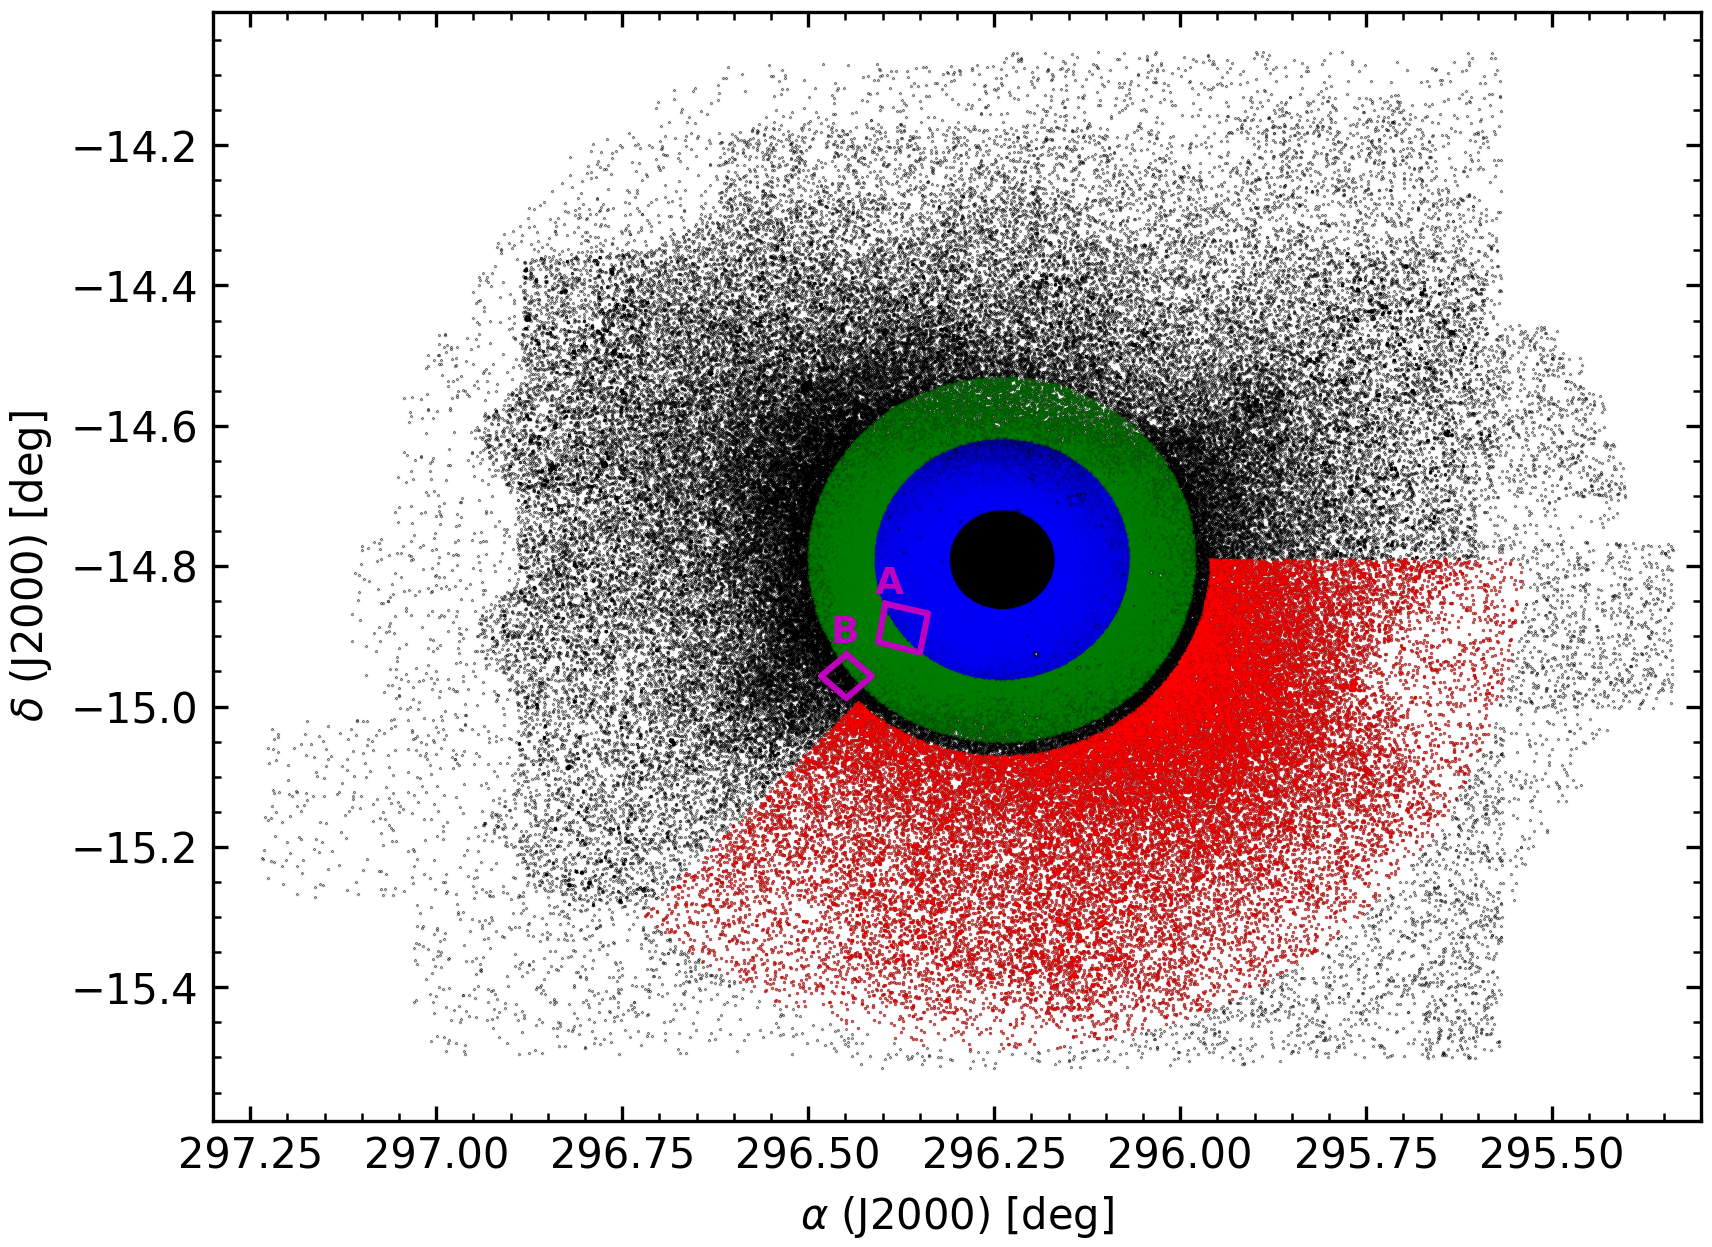
The main sample of optical images includes mosaics collected with the Hyper-Suprime-Cam (HSC) at Maunakea Subaru Telescope. This data were complemented by multi-band images acquired with the wide field imager MegaPrime available at the Canada-France-Hawaii Telescope (CFHT), with the Dark Energy Camera (DECam) on the Blanco telescope at Cerro Tololo Inter-American Observatory (CTIO), and with the Wide Field Camera (WFC) mounted on the Isaac Newton Telescope (INT) at La Palma. The entire data set covers a 2 deg2 Field of View (FoV) across the center of the galaxy. The data reduction was mainly performed with the DAOPHOT-ALLSTAR-ALLFRAME packages (Stetson, 1987, 1994). The reader interested in a more detailed discussion concerning the software we adopted to perform PSF photometry together with the precision and the uniformity of the photometric zero-points across the FoV is referred to Appendix A. To characterise the O- and C-rich AGB stars, the optical catalog was cross-correlated with NIR () photometry (Sibbons et al., 2012), based on images collected with the Wide Field CAMera at the United Kingdom Infrared Telescope (UKIRT), and the MIR (3.6, 4.5, 5.8, 8.0 and 24 ) photometry (Khan et al., 2015) collected with the Infrared Array Camera (IRAC) on board the Spitzer Space Telescope. The reader interested in more details about the optical-NIR-MIR catalogs is referred to Section 2 of Paper I. To overcome difficulties in the identification of different evolutionary features in the CMDs we are only using the catalog including candidate galaxy stars (see Section 3 in Paper I). The sky coverage from that catalog is presented in the top panel of Figure 1 (black dots).
We complemented ground-based photometry with deep archive HST data of an ACS and a WFC3 parallel field in the disk of NGC 6822, covering two pointings (Proposal ID=14191, PI A. Cole)111The archive HST data used in this paper can be found in MAST: https://doi.org/10.17909/6vkj-nm47 (catalog https://doi.org/10.17909/6vkj-nm47)., that overlap the areas Grid5 and Grid6 of the study performed by Cannon et al. (2012). Data reduction followed the standard techniques based on the DAOPHOT/ALLFRAME code (Stetson, 1987, 1994), using the same approach as in Monelli et al. (2010b). The single CTE-corrected FLC images were reduced individually, paying special care in deriving well-suited stars to model the Point-Spread Function (PSF). In a second step, images of the same WFC3 and ACS chip were combined to generate a global list of sources. The latter was fed to Allframe which improved the photometry through a simultaneous PSF-fitting on the objects of all the available frames for each detector. The photometric calibration was performed on the Vegamag system by utilizing the latest zero-points and the encircled energy corrections provided for the WFC3 and the ACS detectors222They are provided at https://www.stsci.edu/hst/instrumentation/wfc3/data-analysis/photometric-calibration/ and https://www.stsci.edu/hst/instrumentation/acs/data-analysis/zeropoints/. The sky coverage of the two fields is displayed in Figure 1 as magenta rectangles. For the sake of clarity, hereinafter we will refer to the field closer to the galaxy center as field A, and to the field farther from the center as field B, as labeled in figure. Note that the current HST data set is published here for the first time, and the derived CMD is more than 1 mag deeper than previous CMDs for NGC 6822 ( 27 mag, Fusco et al., 2014) based on HST images. Indeed, the CMD we obtained approaches a limiting magnitude mag, that is 1 mag fainter than the oldest MSTO of the galaxy as suggested by the theoretical isochrones (see Figs. 4 and 6).
To carry out a quantitative analysis of the stellar populations hosted by NGC 6822 we took advantage of the sets of stellar isochrones available in the BaSTI-IAC database and the CMD 3.7 web interface333The interested reader is referred to http://basti-iac.oa-abruzzo.inaf.it/index.html and http://stev.oapd.inaf.it/cgi-bin/cmd. To perform a detailed comparison between theory and observations, we selected three different star samples that are representative of the young, intermediate-age and old stellar populations and they will be discussed in more detail in the subsections 3.1, 3.2 and 3.3.
The top panel of Figure 1 shows the sky coverage of the catalog of candidate galaxy stars (black dots) together with the young (a few Myr; blue), intermediate-age (a few Gyr; green), and old (t10 Gyr; red) stellar samples. The selection criteria for the young, intermediate and old stellar populations are based on a heuristic approach. Dating back to Mateo (1998); Stetson et al. (1998); Monelli et al. (2003) there is solid observational evidence that stellar populations in dwarf galaxies with complex star formation histories show well defined radial gradients. Young and intermediate stellar populations are more centrally concentrated and display a more flattened distribution, while old stellar populations have a more spherical distribution and reach the outskirt of the galaxy. Our findings on the spatial distributions and the structural parameters of different stellar tracers discussed in Paper I (see Figure 16 of Paper I) fully support this circumstantial evidence. This is the main reason why we chose three different regions at increasing radial distance. The young stars have been selected in a region closer to the galaxy center. Note that the more central galactic area was not included, since the photometry is less accurate due to crowding problems. To get a more homogeneous and accurate optical CMD we decided to use an annulus (blue area in the top panel of Figure 1) enclosed in an annulus with radius ranging from 0.07 and 0.17 degrees from the galaxy center (=296.24, =-14.79; Paper I). The young sample includes 211,896 stars. The intermediate-age stellar tracers are more spatially extended, and also the RC stars steadily decrease in number towards the center due to the crowding and internal reddening (see discussion in Section 5.3 of Paper I). Therefore, they were selected in an annulus contiguous to the young stars and within a circle of 0.26 degrees in radius (green area in the top panel of Figure 1). We ended up with an intermediate-age sample of 86,809 stars. For the old stellar populations we selected a portion of the galaxy with low reddening, since the limiting magnitude is fainter and the evolved sequence is characterized by narrower color distributions. The bottom panel of Figure 1 shows the foreground reddening map of the sky region covered by the current dataset, color-coded according to the Galactic values from Schlegel et al. (1998) at the sky coordinates of the catalog. Note that in the innermost galaxy area the reddening is higher than in the outermost part. We then selected an external annulus with a radius ranging from 0.28 to 0.70 degrees. We would also like to mention here that NGC 6822 hosts eight globular clusters (GCs; Hubble, 1925; Hwang et al., 2011; Huxor et al., 2013), seven of which are located in the northern regions. To avoid contamination from both the stellar populations of the GCs and the disk of gas and young stars, we selected the old stars from a section of the external annulus in the southwestern direction of the galaxy (red area in the top panel of Figure 1). The sample contains 41,252 stars. Moreover, the boundaries of the selected regions were adjusted to overlap with HST fields. Indeed, the HST field A is at the boundary between the young and the intermediate region, while the HST field B is at the boundary between the intermediate and the old region.
3 Comparison with cluster isochrones
In the following subsections we will compare the observed -() CMD of the young, intermediate and old stellar populations with cluster isochrones, and we will discuss in more detail their evolutionary features.
3.1 Young stellar population
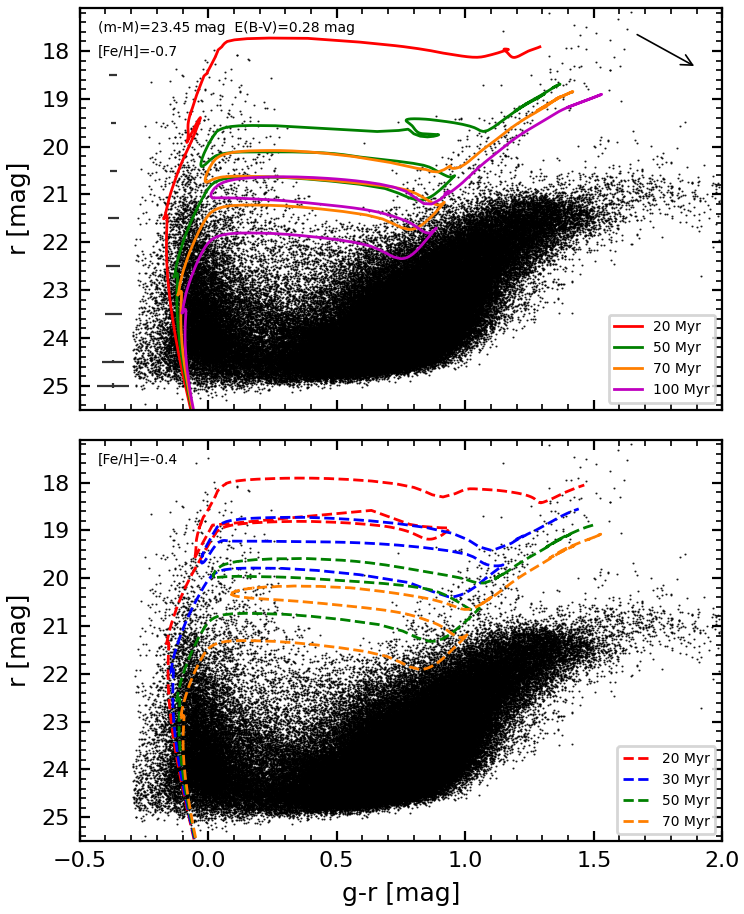
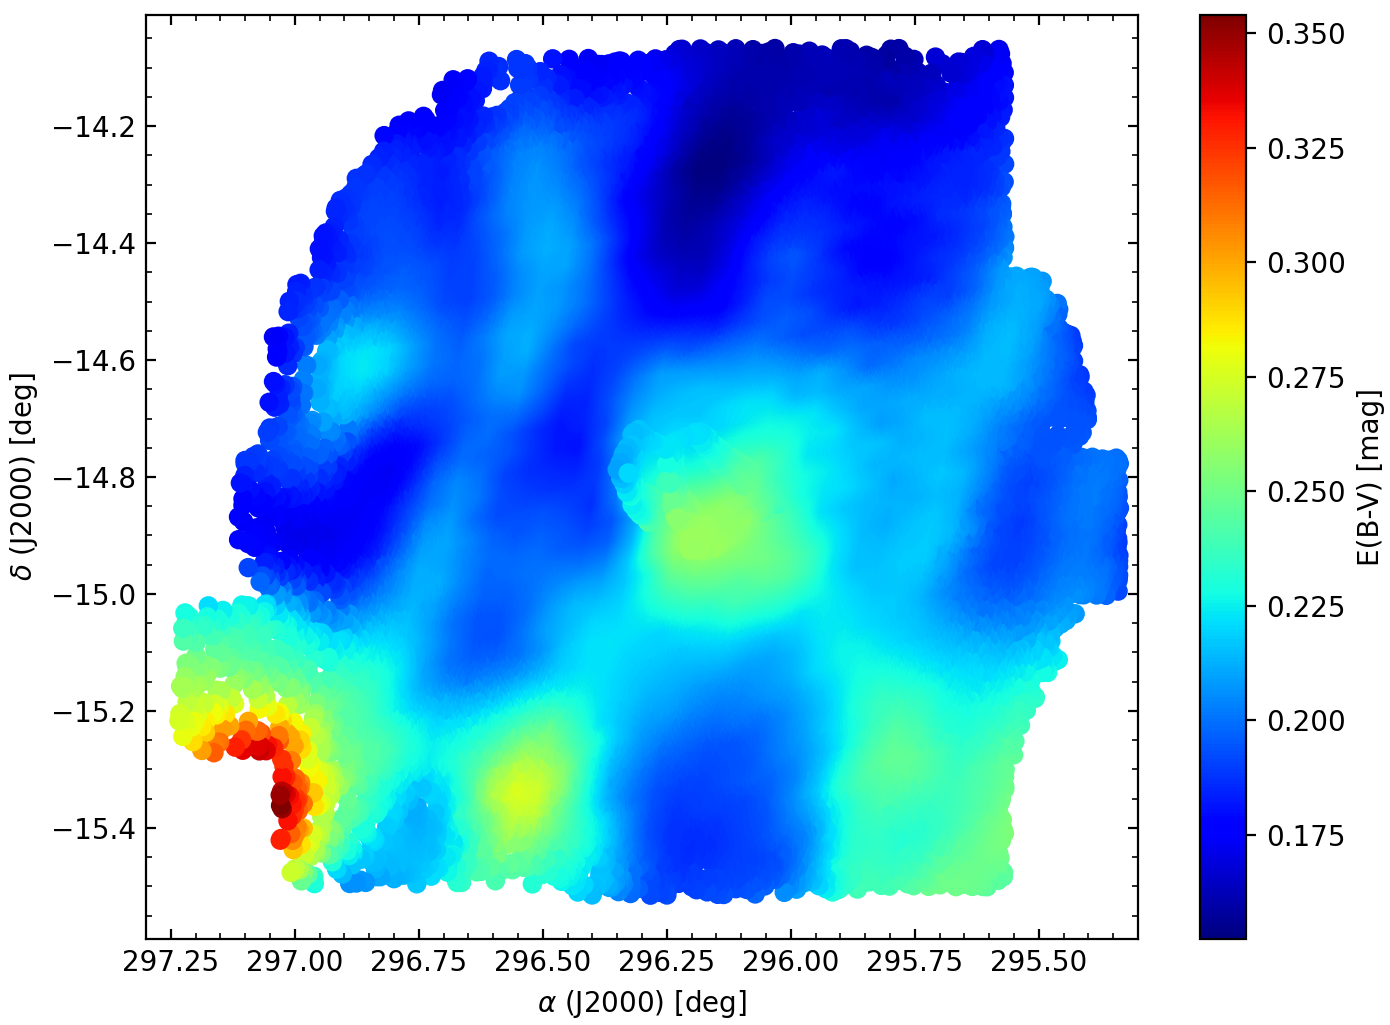
Figure 2 shows the comparison between the observed -() CMD of the young stellar populations (see Figure 1) and stellar isochrones. To improve the comparison, the sources plotted in the CMD were selected according to their () and () values. These criteria allowed us to retain only stars with accurate photometry and neglect spurious sources and/or (partially) blended sources (this resulted in a subset of 160,520 sources from the original catalog). We adopted scaled-solar isochrones from the BaSTI-IAC library (Hidalgo et al., 2018) and applied a true distance modulus of mag, and a mean mag. The adopted distance modulus is the mean value between those obtained by Fusco et al. (2012), using the TRGB, and by Rich et al. (2014), using classical Cepheids. The reddening was estimated as the mean of the reddening values, retrieved from the map provided by Schlegel et al. (1998), across the galaxy region including the young stars (blue annulus in Figure 1). The extinction in the individual photometric bands was calculated by using the Cardelli, Clayton & Mathis (1989)’s reddening law (=, =). The metallicity values of the young isochrones have been chosen according to the spectroscopic measurements of a few supergiants available in literature, i.e. [Fe/H] = -0.49 0.22 by Venn et al. (2001) and [Z] = -0.52 0.21 by Patrick et al. (2015).
The top panel of Figure 2 shows the comparison between four different stellar isochrones at a fixed metal content ([Fe/H]=-0.7) and the observed CMD. The youngest isochrone for 20 Myrs (red line) traces very well the blue edge of the young main sequence (YMS), while the older ones (t50 Myrs) accounts for the helium (He) burning region, the so-called blue loop of young stars. Note that, as expected, the CMD of the young sample is contaminated by intermediate-age and old stars (i.e. RGB and AGB). Since they are distributed over the entire body of the galaxy, reducing their presence is quite challenging. Notwithstanding the foregoing, the young evolutionary tracers can be easily distinguished, because the red giant phases of these young stellar structures are, as expected, systematically bluer than the red giant phases of both intermediate and old stellar populations. The agreement between theory and observations is quite good over the entire magnitude and color range of the quoted evolutionary phases. Indeed, more than 70% of the red giants with - colors between 1.0 and 1.5 mag and magnitudes between 18.5 and 20.5 mag are bracketed by isochrones with ages between 50 and 100 Myrs.
The bottom panel of Figure 2 shows the comparison between the observed CMD and four stellar isochrones at a richer metal content of [Fe/H]=. The current comparison does not allow us to discriminate between the two adopted metal contents, due to the degeneracy along the RSGs sequence between age and metallicity. Indeed, we note that considering a [Fe/H]= the young population features are traced by isochrones with ages up to 100 Myrs, while at higher iron abundances ([Fe/H]=) they are justified by younger isochrones. We also note that more quantitative constraints are partially hampered by the occurrence of differential reddening (Paper I). The reddening vector plotted on the top right corner shows that the comparison might be affected by possible uncertainties in the mean reddening and/or in the distance modulus and/or in the mean adopted chemical composition. More quantitative analysis would require accurate and deep optical–NIR–MIR photometry to improve the temperature/metallicity sensitivity and to mitigate the reddening uncertainty.
The comparison of the CMD of candidate young stars of NGC 6822 with models shows that the galaxy was still forming stars in a very recent epoch. This evidence is supported by the computed SFHs available in literature for NGC 6822 (i.e. Gallart et al., 1996c; Cannon et al., 2012) suggesting that the star formation activity increased over the whole main body of the galaxy in the last 100 Myr. Conversely, the SFH reconstructed by Fusco et al. (2014) for six HST fields along the major axis of the galaxy revealed that the SFR of all the fields, but one, has slowly decreased in the last 1.5 Gyr. Furthermore, Fusco et al. (2014) derived the AMR for the last 5 Gyr, disclosing that the metallicity has grown with time from [Fe/H]= to [Fe/H]=. This range of values is compatible with the metallicities constrained from the comparison between the central regions of the galaxy and the isochrones.
3.2 Intermediate stellar population
The comparison between the scaled-solar isochrones and the observed -() CMD for the intermediate-age population sample is shown in Figure 3. The catalog has been cleaned up using the same selection criteria on the and parameters as for the young sample, ending up with 75,831 stars. The isochrones were plotted by using the same distance modulus and mean reddening adopted for the young population.
To compare theory and observations for the intermediate-age stellar populations we employed isochrones with a metallicity chosen taking advantage of estimates based on C/M-metallicity relations for AGB stars, i.e. [Fe/H] = -1.3 0.2 provided by Kacharov et al. (2012), [Fe/H] = -1.14 0.07 by Sibbons et al. (2012), [Fe/H] = -1.38 0.06 by Sibbons et al. (2015), [Fe/H] = -1.286 0.095 by Hirschauer et al. (2020) and more recently [Fe/H] -1.25 (=0.04 dex) from Paper I.
The top panel of the figure displays the observed CMD and three isochrones for [Fe/H]= and ages of and Gyr. In the bottom panel we show isochrones for an age of Gyr and different iron abundances ([Fe/H]= and ). Note from the CMD that there are some YMS stars, because the intermediate-age sample was selected in a region of the galaxy where the disk of young stars is still present. To constrain the range of age and metallicity of the intermediate stellar population in NGC 6822, we considered as a reference the mean magnitude and color of the peak of RC stars, at 24.3 mag and 0.7 mag and highlighted with a red filled circle. These have been derived by using a 3D histogram of the - CMD. The CMD was split into a grid in magnitude and in color, while Z-axis shows the number of stars per grid point (see Figure 19 of Paper I). The reader interested in a more detailed discussion concerning the approach we adopted is referred to the Appendix A of Paper I. The isochrone for t=6 Gyr and [Fe/H]= properly fits the peak in magnitude of the observed RC. However, to account for the range in magnitude and color of the RC stars, isochrones with ages ranging from 4 to 8 Gyr and metal abundances ranging from [Fe/H]= to are required. This shows that intermediate-age stellar populations experienced a modest chemical enrichment over an age range of at least 4-8 Gyrs. Determinations from SFHs suggested for this galaxy either a linear chemical enrichment law (Gallart et al., 1996b) or a broad variation according to the radial distance (Fusco et al., 2014, see their Figure 9).
3.2.1 HST CMDs for intermediate-age stars
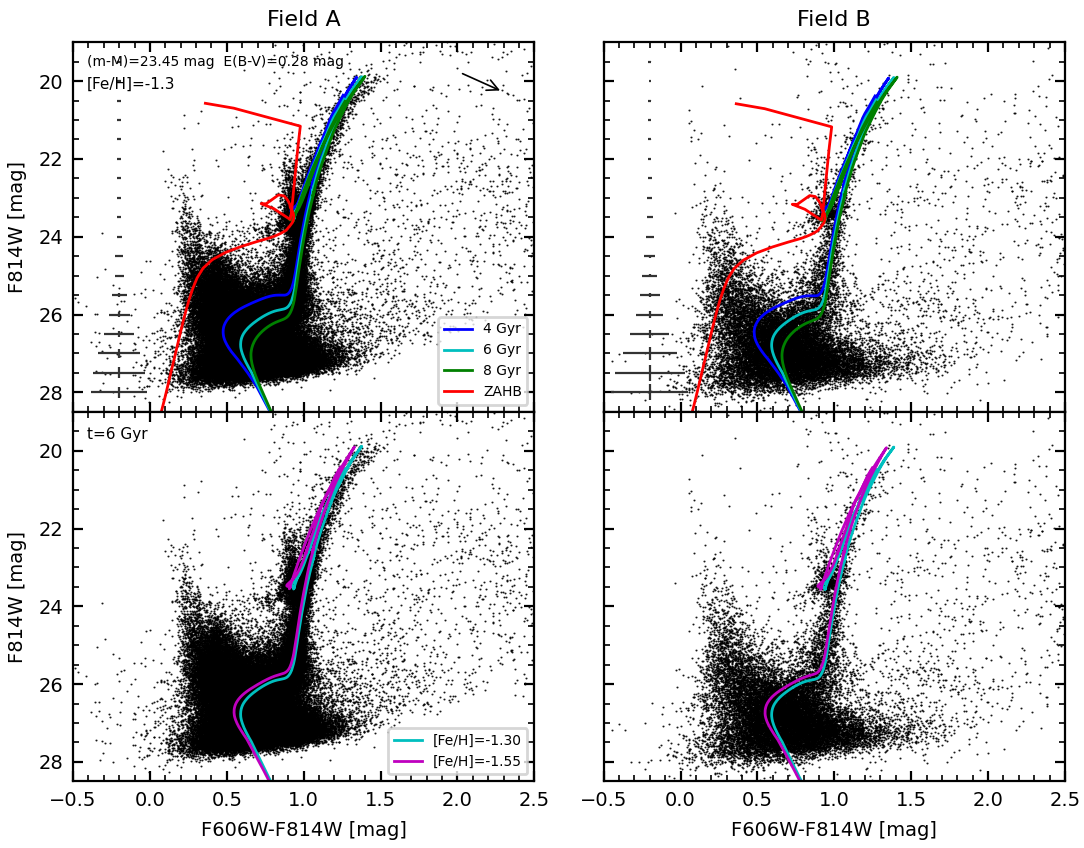
Figure 4 shows the comparison between the observed -() CMD of the HST fields A (left panels) and B (right panels) and the same scaled-solar BaSTI-IAC isochrones superimposed on the , CMD for the intermediate-age population adopted in Figure 3. The top panels also show, for a metallicity of [Fe/H]=, the core He-burning sequence (zero-age horizontal branch and RC). The models were plotted by using the same distance modulus and mean reddening adopted in all these comparisons. The extinction in the individual photometric bands was calculated by using the Cardelli et al. (1989)’s reddening law (=, =). The CMDs were cleaned up according to both their values () and the photometric errors of the stellar objects ( mag).
The RC stars can be easily identified in the CMD at between mag and colors between mag. Moreover, RGB stars display, as expected for high spatial resolution space-based observations, a narrower spread in color than the optical ground-based data. The isochrones for ages in the range Gyr and with a metallicity of [Fe/H]= (see the top panels of Figure 4) are in fair agreement with the location of both the RC and the spread in color of RGB stars. Note, also, that the predicted core He-burning sequence properly fits both the magnitudes and the colors typical of RC stars. In the bottom panels we overplotted isochrones with a fixed age of 6 Gyr and metallicities of [Fe/H]= and . The latter one fits quite well both the RC stars and the blue edge of the RGB. This means that the intermediate-age stellar populations likely have a more metal-poor tail. However, this age-metallicity degeneracy prevented us from constraining quantitatively their ranges. This evidence further strengthens the conclusions of our analysis on this population from the HSC@Subaru data.
3.3 Old stellar population
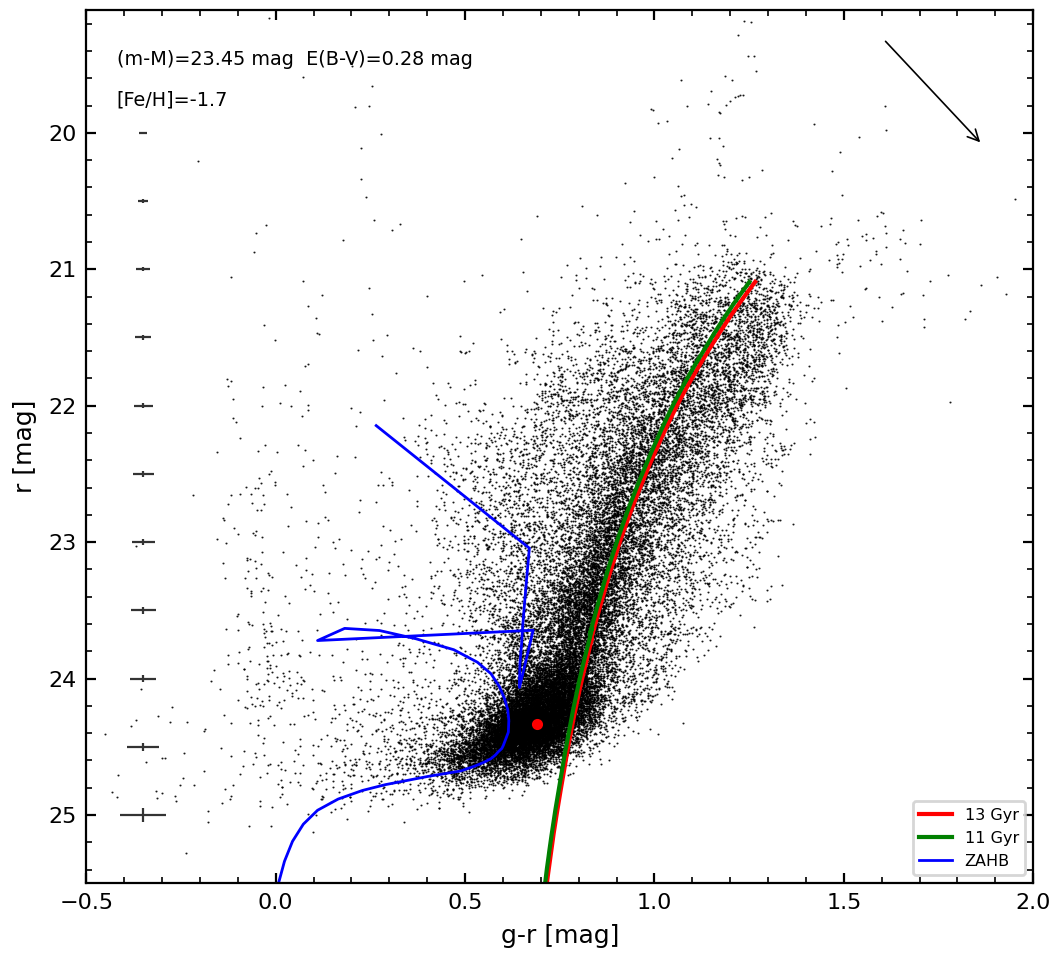
Figure 5 displays the comparison of the observed -() CMD for the old population with two scaled-solar BaSTI-IAC isochrones and a core He-burning sequence. Stellar objects were selected following criteria similar to the selection of young- and intermediate-age samples. However, we decided to add a further cut by using the photometric errors. We only retained sources with errors in color, calculated by summing in quadrature the errors on the individual magnitudes, smaller than 0.1 mag ( mag). The list has 34,928 stars with respect to the primary one. This criterion and the large sample of galaxy stars allowed us to improve the cleaning of the CMD across the faint magnitude limit. The isochrones were plotted using the same distance modulus and mean reddening used for the young- and the intermediate-age sample. We superimposed onto the observed CMD isochrones with ages of (red line) and Gyr (green line) and the core He-burning sequence (blue line), with a metallicity [Fe/H]=. The adopted metallicity is based on spectroscopic measurements of individual RGB stars in NGC 6822 provided by Tolstoy et al. (2001) ([Fe/H] = -1 0.5) and by Kirby et al. (2013) ([Fe/H] = -1.05 0.01). The adopted isochrones agree quite well with the magnitude range and the slope of the RGB in the CMD, thus suggesting a spread both in age and metallicity also for the old stellar population of NGC 6822. Furthermore, the CMD shows evidence of a well-populated red horizontal branch (HB), but the comparison with the core He-burning sequence discloses that the photometric limit of our catalog does not allow us to possibly reveal the presence of the very blue (hotter) HB stars. The adopted theoretical sequence for [Fe/H]= traces very well the lower limit of the red HB. Note that it attains, as expected for the selected ages and chemical composition, bluer colors when compared with RC stars (see the location on the CMD of the peak in magnitude of RC stars).
These qualitative results about the old population are compatible with the SFHs available in the literature. Indeed, Gallart et al. (1996b) suggested that NGC 6822 has most likely started to form stars Gyr ago from a gas at low metallicity, around which correspond to [Fe/H] = -2.2 -1.6. The metal abundances inferred from the isochrones are near the upper limit of this range. Moreover, Cannon et al. (2012) found that the derived SFHs of six HST fields located along the major axis are qualitatively consistent with each other, suggesting that a high fraction of stars was formed between 14 and 6 Gyr ago.
The anonymous referee noted that we are suggesting an increase in iron abundance ranging from [Fe/H]=-0.7 to -0.4 for the young stellar population to [Fe/H]=-1.3/-1.5 for the intermediate-age stellar population and to [Fe/H]-1.7 for the old stellar populations. This evidence can be barely compared with current spectroscopic measurements, since we still lack detailed investigations concerning the iron distribution function among the different stellar components. Indeed, the few spectroscopic measurements available in the literature are from Venn et al. (2001) using two RSG stars ([Fe/H]=-0.49 0.22), and from Kirby et al. (2013) using RGB stars ([Fe/H]=-1.05 0.01). However, the detailed SFH and age-metallicity relation (AMR) provided by Fusco et al. (2014) indicates that the iron abundance in the six HST pointings they analyzed is steadily increasing from [Fe/H]=-1.0/-1.3 (5 Gyr ago) up to [Fe/H]=-0.3/-0.6 in recent times (see their Figure 9).
When compared with similar investigations in the literature, our results show that the core He-burning sequence displays a well-defined continuum when moving from the horizontal portion of the ZAHB, where the He ignition is affected by electron degeneracy, to RC stars, whose He ignition is only partially affected by electron degeneracy, and to intermediate-mass stars who experience He ignition in non-degenerate conditions (see, e.g., Salaris & Cassisi, 2005). The identification of these evolutionary properties further supports the evidence that NGC 6822 hosts a broad variety of core He-burning variable stars (Pietrzyński et al., 2004; Baldacci et al., 2005; Mennickent et al., 2006; Feast et al., 2012; Rich et al., 2014). This means that NGC 6822 is a perfect laboratory to investigate advanced evolutionary phases, and in particular, to constrain the accuracy of old (RRLs), intermediate-age (ACs) and young (CCs) distance indicators.
3.3.1 HST CMDs for old stars
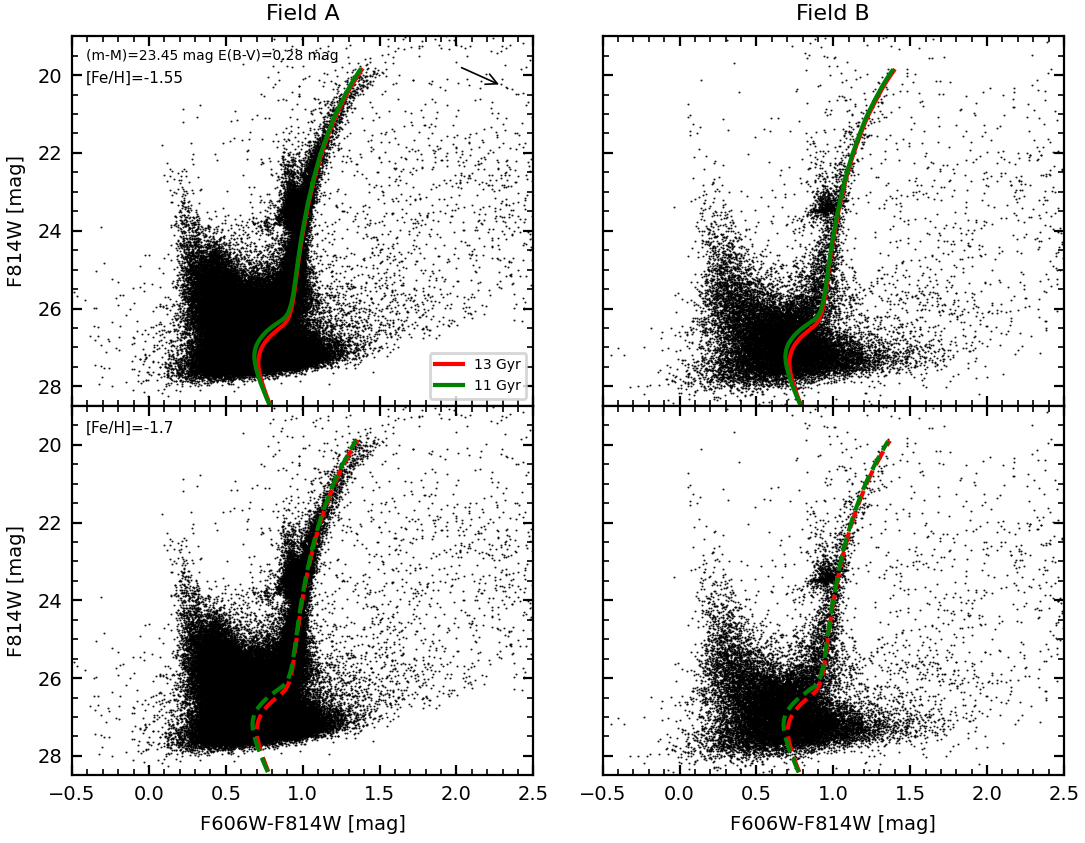
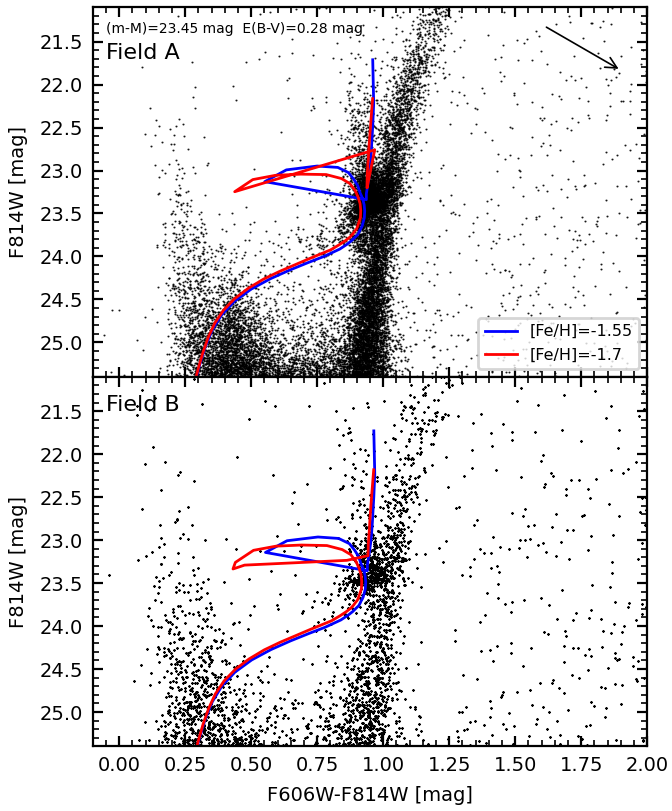
Figure 6 shows the comparison between the observed -() CMD of the HST fields A (left panels) and B (right panels) and old scaled-solar BaSTI-IAC isochrones. The models were plotted by applying the same distance modulus and mean reddening previously adopted. We already mentioned that the spread in color along the RGB is caused by variations either in age, or metallicity, or both. The adopted isochrones (11, 13 Gyr) with a fixed metal content ([Fe/H]=) takes account for magnitudes and colors of the stars distributed along the RGB (see top panels Figure 6). However, we cannot determine accurately the iron abundance(s) of the old stellar population, since the two isochrones plotted in the bottom panels of Figure 6 with the same ages and a slightly more metal-poor iron abundance ([Fe/H]=), still provide a good fit of the stars distributed along the RGB.
Figure 7 shows the comparison between the observed HB stars in fields A (top) and B (bottom) and the predicted He-burning sequence for the same iron abundances adopted in Figure 6. The CMDs were zoomed onto the region between the old HB and RC stars. The photometric accuracy of the HST photometry allows us to easily identify a group of old red HB stars located at mag and - mag, together with a number of candidate RRL stars with bluer colors and a larger spread in magnitude located at mag and - - mag. Time series multi-band photometric data and He-burning variable stars will be investigated in a forthcoming paper. A firm identification of blue HB stars is hampered by the presence of a significant number of YMS stars that overlap in the same CMD region. The HST photometry further supports the continuum along the core He-burning sequence brought forward by the ground-based wide field photometry.
3.4 Identification of the AGB clump
Based on the recent investigation of NGC 6822 stellar populations by Nally et al. (2024) and their identification of the AGB clump in the MIR ( mag, mag) CMD, we decided to take advantage of the current accurate and deep optical catalog to identify the same evolutionary phase, and to perform a detailed comparison with theoretical models. Dating back to Pulone (1992a, b) it was recognized that the AGB clump (the ignition of double shell burning) is indeed a good standard candle, minimally affected by changes in iron abundance and stellar age. The same evidence was also supported by observations of Galactic GCs (Ferraro, 1992).
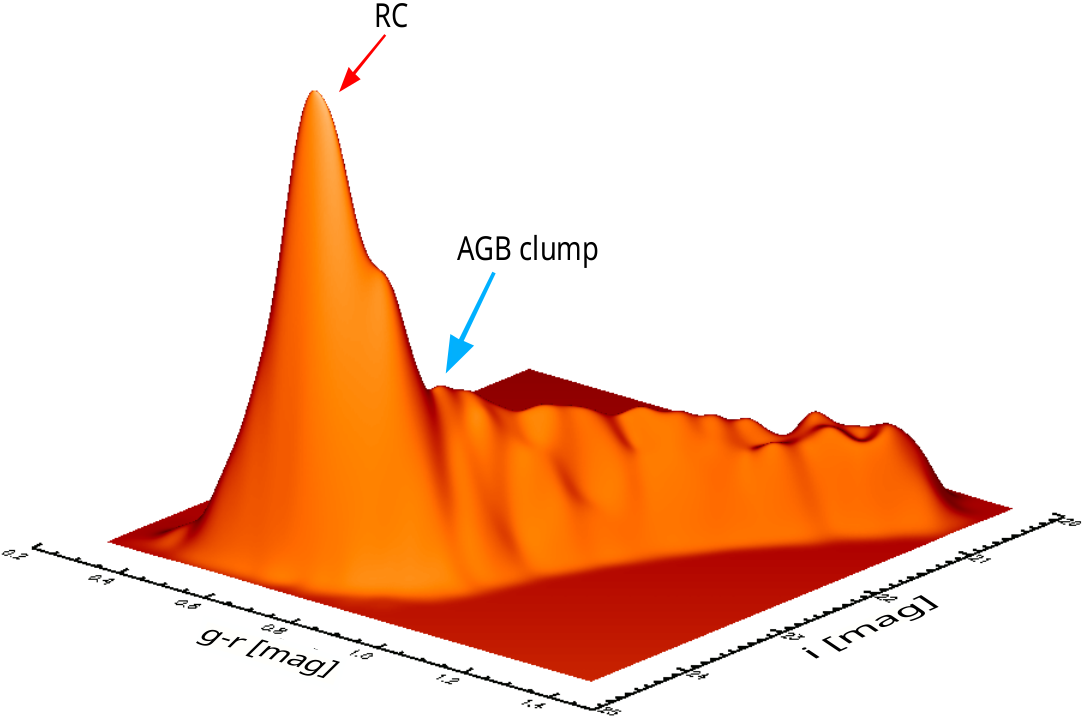
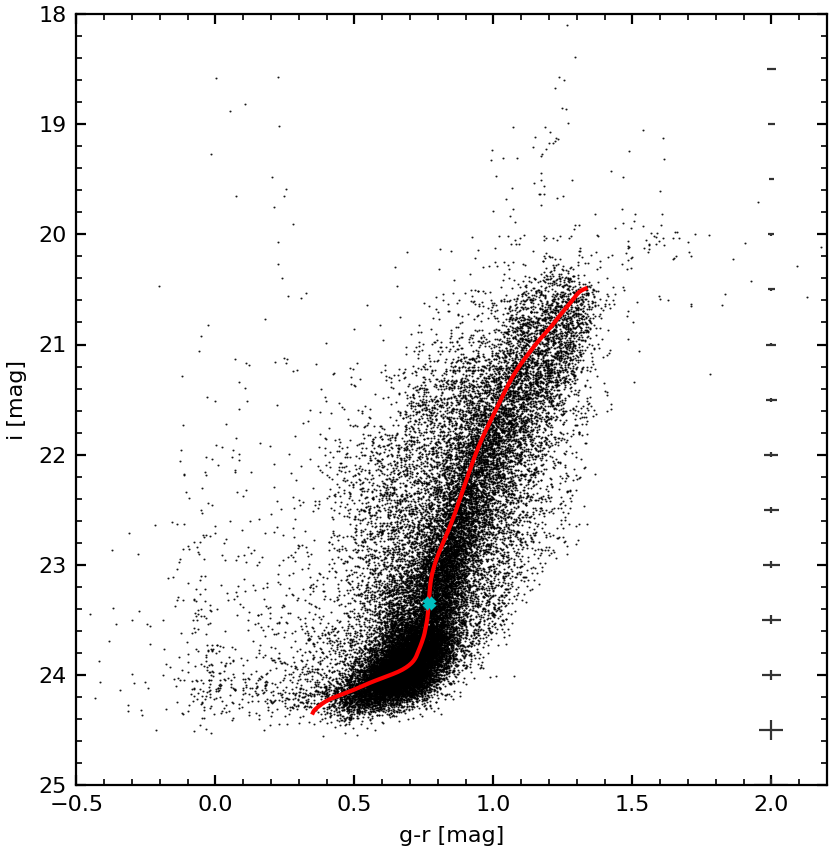
To properly identify the AGB clump we derived a three-dimensional (3D) CMD that includes the color , the magnitude , and the corresponding luminosity function of RG stars. To overcome subtle problems caused by the binning of the data, we smoothed the 3D distribution associating to the position of each star in the CMD a Gaussian with unitary weight and sigma equal to the error in the color measurement. The global 3D CMD (see the top panel of Figure 8) was computed by integrating all the Gaussians associated to individual stars over the entire color and magnitude range of RG stars. This 3D CMD allowed us to measure the ridge line (variation of the main peaks) of RG stars in NGC 6822 as a function of magnitude and color. The bottom panel of Figure 8 shows the observed -() CMD of the old stellar population with the ridge line derived on the basis of 3D CMD.
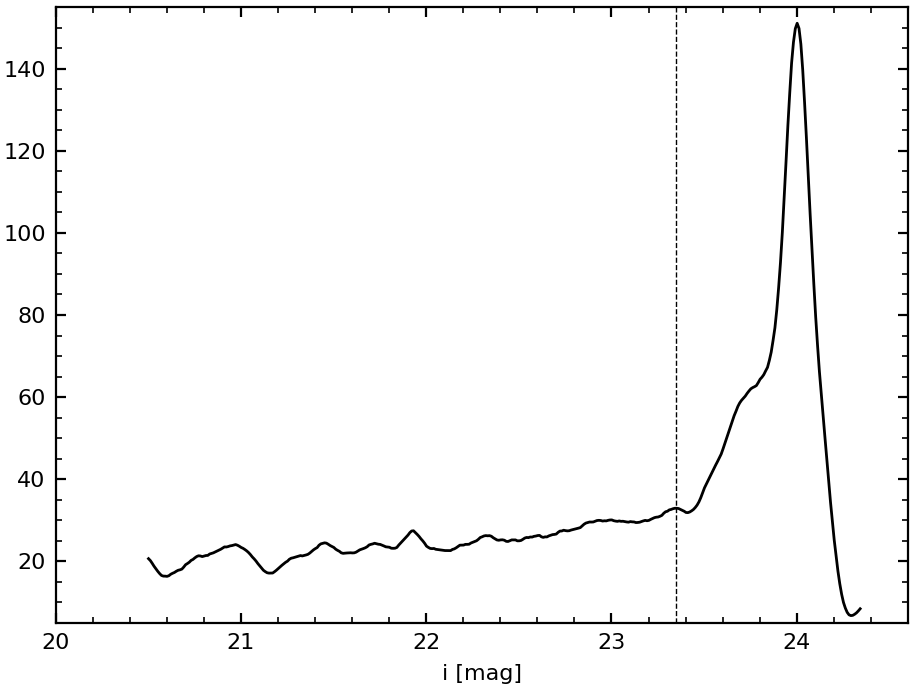
Furthermore, to trace the variation of the luminosity function of red giant stars we computed the marginal of their distribution. This means that individual RGs were shifted in magnitude and color to their closest point along the ridge line. Subsequently, we estimated their global luminosity function by smoothing the distribution with a Gaussian kernel. Figure 9 displays the marginal (arbitrary units) in the -band magnitude ranging from the tip of the RGB down to the RC. The marginal is characterised by a main peak at mag associated to RC stars (see Appendix A of Paper I), followed by a few secondary peaks at fainter magnitudes. Based on the results provided by Nally et al. (2024), according to which the AGB clump is roughly located 1 mag brighter than the RC, we identified the peak at mag with the AGB clump and the vertical dashed line plotted in this figure marks its location. The current identification is also highlighted with a cyan arrow on the 3D CMD in the top panel of Figure 8, on which we have also indicated the main peak of RC stars with a red arrow, and as a cyan filled cross on the -() CMD in the bottom panel of Figure 8.
To validate this identification, we compared the observations with several stellar isochrones from the BaSTI database, applying the same distance modulus and reddening adopted in the previous sections. In particular, we checked the location in the -() CMD of the point marking the exhaustion of core He-burning and the ensuing double shell (hydrogen, helium) burning. This evolutionary phase is typically associated with the AGB clump (Salaris & Cassisi, 2005).
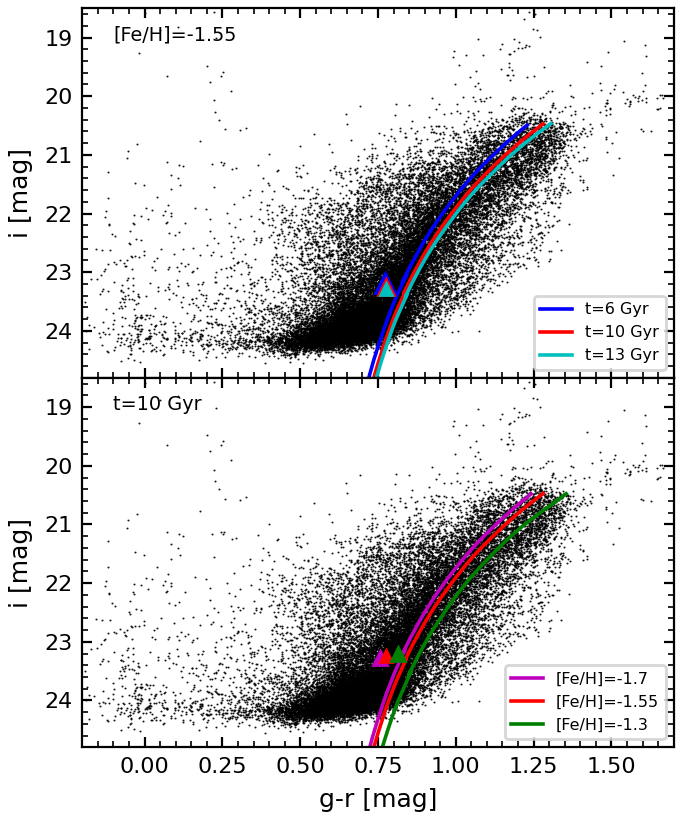
The two panels in Figure 10 show the comparison between the -() CMD of the old stellar population and isochrones at fixed metallicity ([Fe/H]=) and stellar ages of 6, 10 and 13 Gyr (top panel), and isochrones at fixed stellar age (t=10 Gyr) and metallicities equal to , , and (bottom panel). In this case we only selected the portion of the isochrones till the tip of the RGB. For each isochrone a filled triangle denotes the position of the corresponding AGB clump. Their location on the CMD agrees very well with the magnitude and color of the observed AGB clump ( mag and mag; see Figure 8). The models also show just marginal variations in magnitude and color for large variations of stellar age ( Gyr) and metal content ([Fe/H]=).
4 AGB stellar population
Several authors investigated on the identification of O- and C-rich AGB stars in complex stellar systems, leading to the development of several different photometric and spectroscopic diagnostics. Some studies have used a CC-D based on a mix of broad- (R,I) and narrow-band (CN, TiO) photometry (Albert et al., 2000; Battinelli & Demers, 2000; Letarte et al., 2002, hereinafter L02), and this approach has been established to be reliable to select C-type stars. Others took advantage of NIR CMDs and CC-Ds (Kang et al., 2006; Sibbons et al., 2012; Ren et al., 2021a; Li et al., 2025), and a combination of NIR and MIR CMDs (see e.g. Boyer et al., 2011; Hirschauer et al., 2020). In a few cases, low-resolution spectroscopy helped to improve the NIR photometric selection criteria (Kacharov et al., 2012; Sibbons et al., 2015). More recently, the use of NIR and MIR bands has been tested with the filters mounted on the NIRCam and MIRI detectors on board the JWST (Nally et al., 2024; Boyer et al., 2024), showing very interesting results.
In our previous work, we have investigated in great detail the AGB stellar population in NGC 6822. We decided to mainly focus on the use of the CC-Ds because the CMDs in the optical, NIR and MIR bands don’t allow us to remove the degeneracy in color between the two AGB subgroups, as the C-type stars at fainter magnitudes tend to have similar colors to the O-type. We first adopted approaches suggested in the literature, such as NIR and - CC-Ds. The former method, as described by Kang et al. (2006), is based on the use of the histogram in NIR colors (, ) to distinguish the two star samples, but the CC-Ds display a well-defined color sequence and don’t solve the degeneracy. The latter method, used by L02, has been proved to be very solid in the identification of the C-rich stars, whereas the O-rich stars are hampered by the contamination of field red giants. Therefore, we defined new solid diagnostics using several new optical-NIR-MIR CC-Ds, on which the O- and C-rich stars are distributed along either two almost parallel sequences (i.e. on -, -, -, -, - and - CC-Ds) or sequences with different slopes (i.e. on - and - CC-Ds). In this paper we focus our attention on the comparison between predictions based on stellar evolution models and observed CMDs and CC-Ds of the galaxy AGB population.
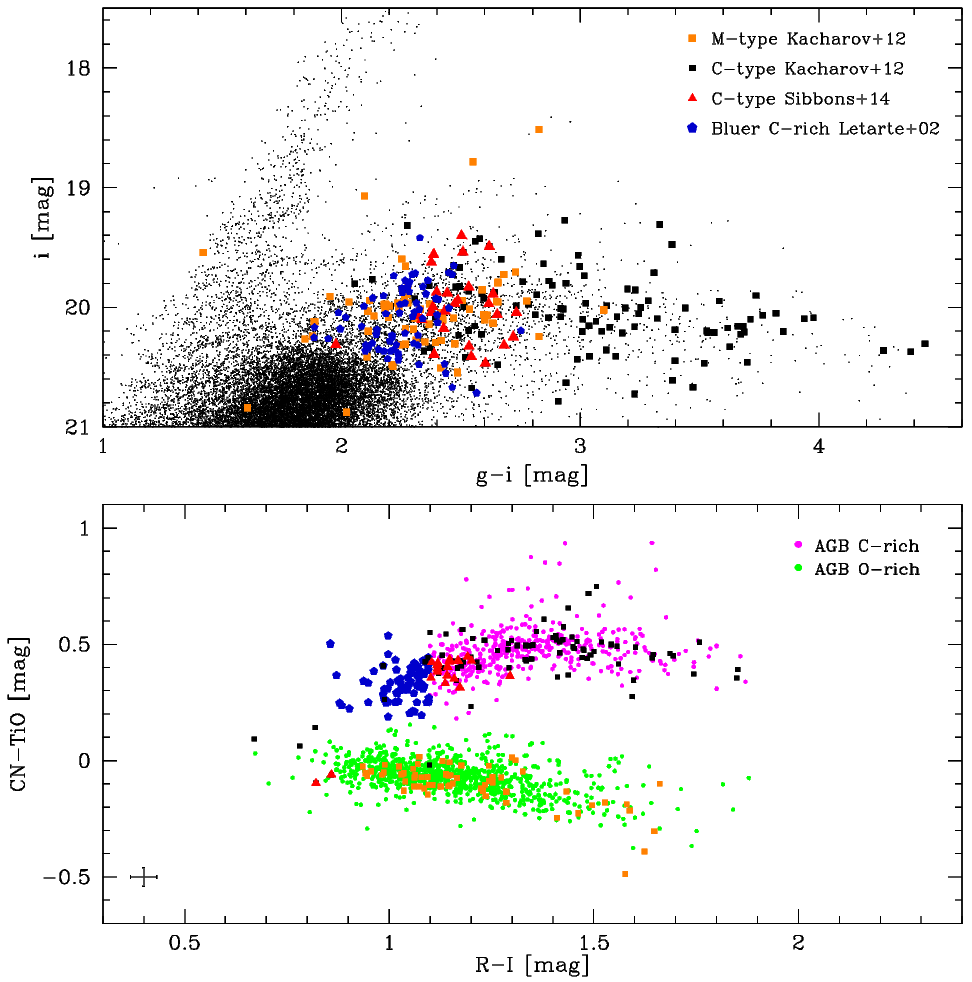
The diagrams in Figure 11 are the same as Figure 12 of Paper I. The top panel is a zoom-in on the bright portion of the -() CMD to highlight our selection of the AGB stars, on which we over-plotted the spectroscopic samples of C- and M-type stars available in the literature444The reader interested in more details concerning the spectroscopy of AGB stars is referred to Section 5.2 of Paper I for NGC 6822. The spectroscopic identification of C-type stars (Kacharov et al., 2012; Sibbons et al., 2015) and M-type stars (Kacharov et al., 2012) are marked with different symbols. The blue pentagons display the so-called ‘bluer’ C-rich stars as defined by L02 and discussed in the next paragraph. The bottom panel of the figure is the - CC-D used by L02 to select their sample of C- and O-rich stars, exploiting multiband photometry (CN, TiO, R and I) collected with both the Swope telescope and the wide-field imager CFH12K at CFHT. The plot shows the cross-match between our AGB sample and the catalog by L02. The ‘bluer’ C-rich stars are the same as the top panel, and have been defined by L02 on this CC-D as the stars that are systematically bluer than the color cut typically used to define the ‘canonical’ C-rich stars ( 1.1 mag). To perform a homogeneous comparison with similar results available in the literature, L02 decided to exclude them from their sample of C stars.
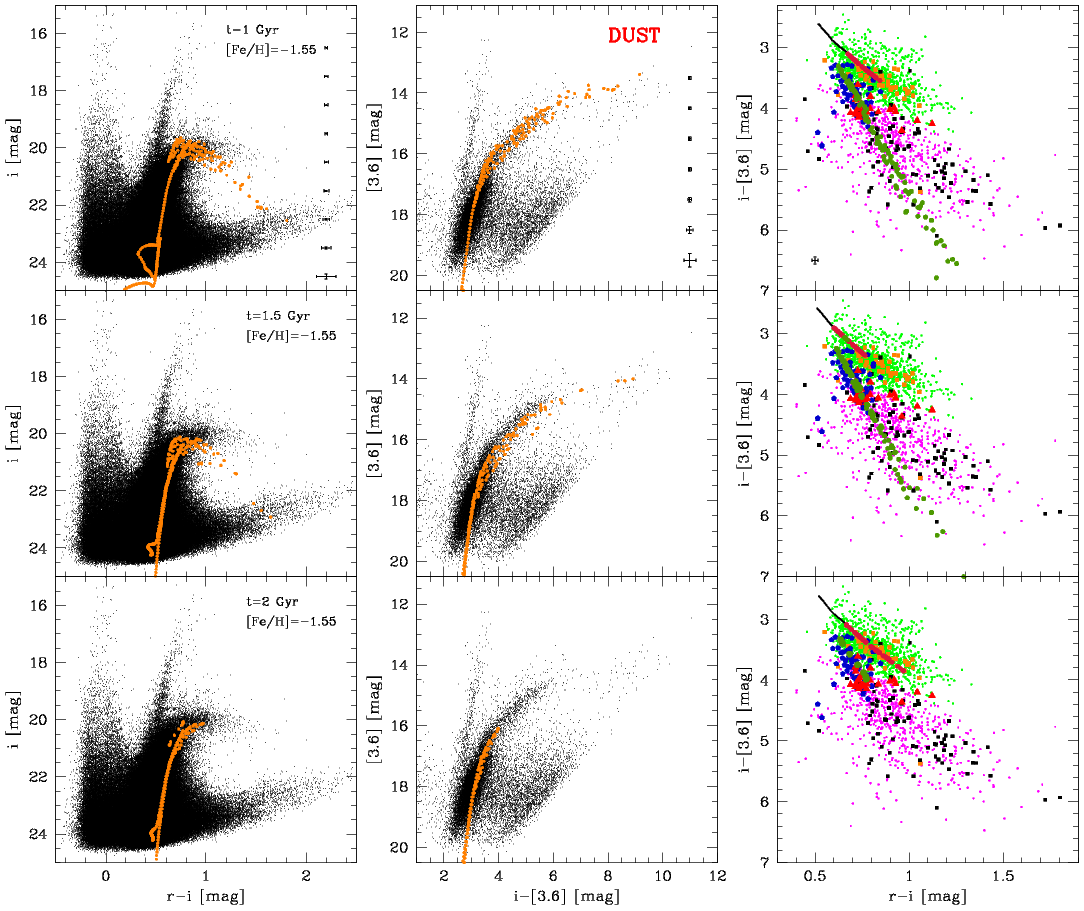
To constrain the age and metallicity ranges of the AGB stellar population, we compared both the CMDs and the CC-Ds with the PARSEC+COLIBRI stellar isochrones (Bressan et al., 2012; Marigo et al., 2013) retrieved from the CMD 3.7 web interface. The results that we are going to discuss are shown in Figs. 12, 13, 14 and 15. The comparison with each isochrone was made by using both the optical -() and the optical-MIR -() CMDs, and the optical-MIR ()-() CC-D. Among all the CC-Ds we have defined in Paper I, we chose the latter one for reasons that will become clearer in the following discussion. Furthermore, we selected the isochrones taking into account both the presence of circumstellar dust in stars during the TP-AGB phase and its absence.
Figure 12 shows the results of the comparison between the aforementioned CMDs and CC-D and three PARSEC+COLIBRI stellar isochrones for a fixed metallicity of [Fe/H]= and ages of 1 Gyr (top panels), 1.5 Gyr (middle panels) and 2 Gyr (bottom panels). The circumstellar dust during the TP-AGB phase has been considered with a dust composition of 60% Silicate and 40% Aluminium Oxide (AlOx) for M-type stars and of 85% Amorphous Carbon (AMC) and 15% Silicon Carbide (SiC) for C-type stars, as suggested in the CMD 3.7 web interface. The isochrones were adjusted to the same distance modulus ( mag) and mean reddening ( mag) adopted in the previous analysis of the young, intermediate and old components. A glance at the optical CMDs clearly shows that the total range in magnitude and color covered by AGB stars is reproduced fairly well by the ‘dusty’ isochrone at 1 Gyr. However, the slope of the theoretical TP-AGB phase is steeper than the observed one. On the other hand, the same isochrone superimposed on the optical-MIR CMD is in very good agreement with both the slope and the whole extension of the AGB evolutionary sequence. This means that the discrepancy seen in the optical CMD at very red colors may be due to inaccurate bolometric corrections, causing a too steep increase in the magnitudes compared to the data. Indeed, the presence of the dust-enhanced AGB stars require very large bolometric corrections for the the optical filters, compared to the IR. The same effect can also be seen in the isochrones with different ages. The 1.5 Gyr isochrone in both CMDs covers the entire range in color of the AGB stars but at slightly larger magnitudes, while the isochrone at 2 Gyr covers a smaller interval of colors than observed, i.e. 0.2 mag over an observed range of 1 mag in and 1 mag over an observed range of 4 mag in . We point out here that during our analysis we made several tests by changing the dust composition for the M- and C-type stars among those provided in the CMD 3.7 web interface for the COLIBRI isochrones. We found that, independently of its composition, circumstellar dust always causes the same effects in the optical filters. For these reasons, we have reported here only the results obtained by using the dust composition described before.
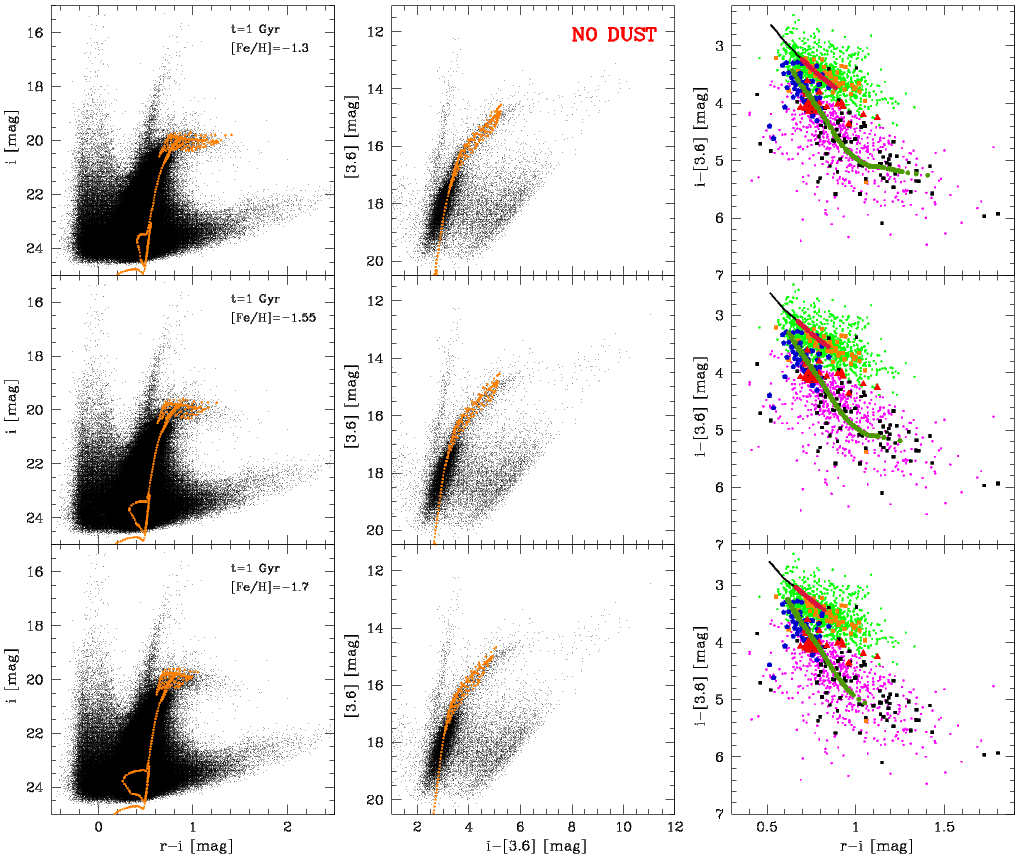
It is worth making a separate discussion on the comparison between the optical-MIR CC-D and the three isochrones, shown in the right panels of Figure 12. For the sake of clarity, the isochrones only show the AGB evolutionary phases, with the early-AGB (E-AGB) and TP-AGB denoted by different symbols. These diagrams point out a very interesting result: for the first time it is clear that on the optical-MIR ()-() CC-D the theoretical M- and C-type tracks are on two distinct color sequences, fully consistent with those defined by the spectroscopic and photometric samples. This evidence also support the use of the new photometric diagnostics developed in Paper I to identify and characterize O- and C-rich stars in stellar systems. Further evidence is that the colors, hence the location, of the ‘bluer’ C-rich are consistent with the typical optical-MIR colors of the observed C-rich sample and they are well matched by the C-type sequence of the isochrones. For this reason, in contrast with L02, we included them in the sample of ‘canonical’ C-type AGB stars. The three selected isochrones properly match the range in magnitude and color of bright AGB stars, suggesting that they cover, at fixed metal content ([Fe/H]=), ages ranging from 1 to 2 Gyr. Note that bright AGB stars allow us to investigate stellar populations systematically younger than RC stars (discussed in Section 3.2). It is worth mentioning that the current sample also includes AGB stars from older stellar populations’ progenitors, but we are not able to disentangle them from younger AGB stars. Therefore the quoted range should be considered as a lower limit to the age range covered by bright AGB stars.
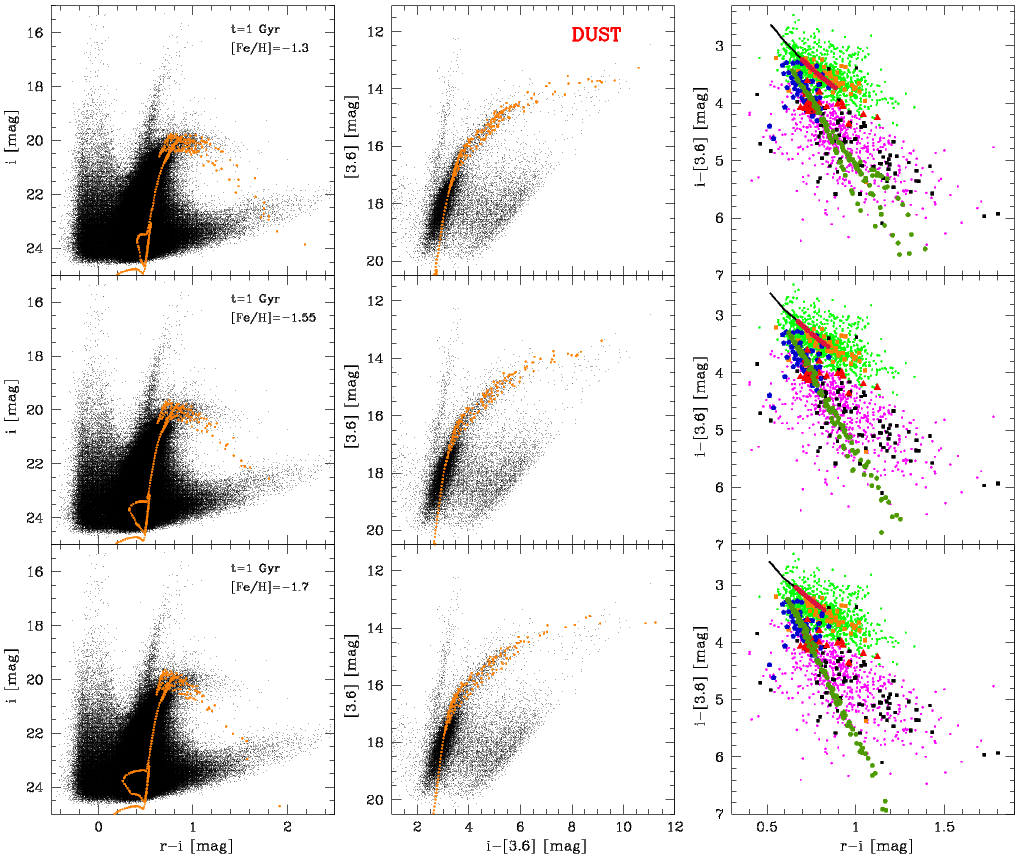
Figure 13 displays the same plots of Figure 12, but the three PARSEC+COLIBRI isochrones are for a fixed age of 1 Gyr and [Fe/H]= (top panels), [Fe/H]= (middle panels), and [Fe/H]= (bottom panels). The results of this comparison are similar to the previous one. In the optical-MIR CMD the three isochrones are a good match to the slope and the location of the observed AGB, while in the optical CMD the slope disagrees with the observations. As for the optical-MIR CC-D, the evidence is the same as in Figure 12 and the isochrones appear to reproduce a good fraction of the range in color covered by both O-rich and C-rich samples. Our results suggest that intermediate-age stellar populations, including both RC (see Section 3.2) and bright AGB stars, have ages ranging from 1 to 8 Gyr and metal abundances between [Fe/H]= and [Fe/H]=. This further supports the modest chemical enrichment experienced by this galaxy when moving from old to intermediate-age stellar populations.
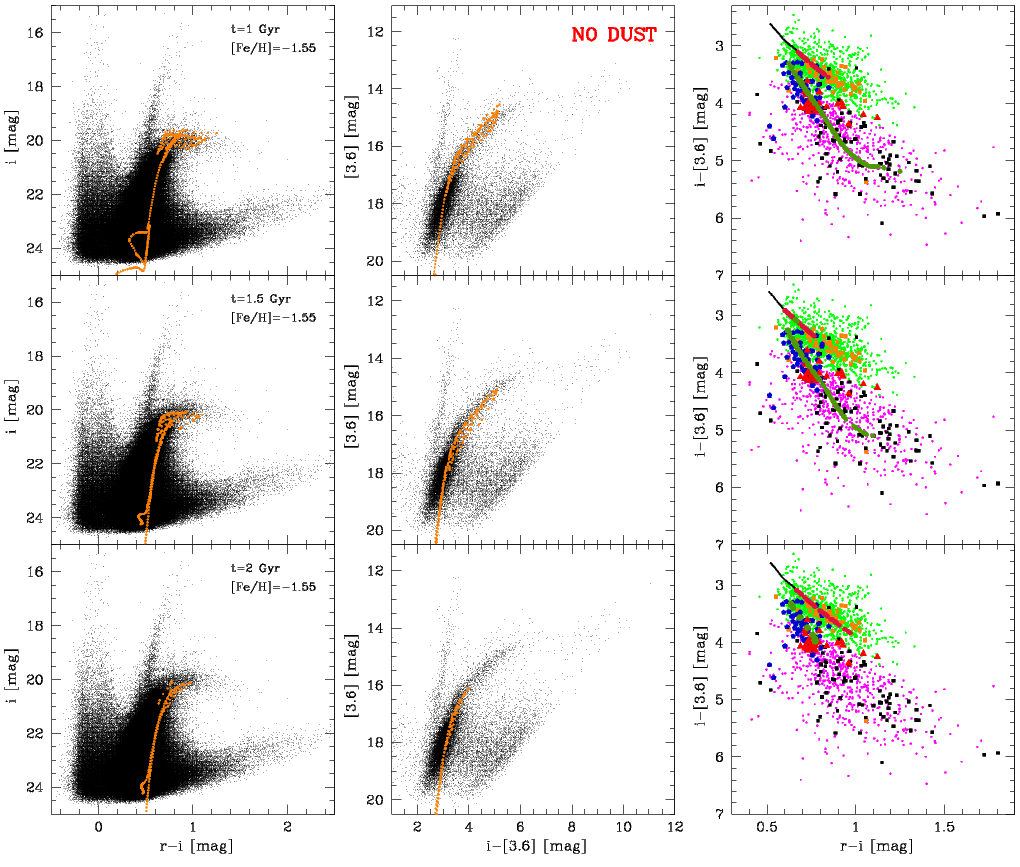
Figures 14 and 15 are the same as Figures 12 and 13, but we used PARSEC+COLIBRI isochrones without including the effect of circumstellar dust for M- and C-type stars. In this case the slope of TP-AGB phase models is in good agreement with the observed one in both the optical and optical-MIR CMDs. However, the models cover a smaller color range than observed. Indeed, due to the absence of dust, the bolometric corrections for the optical filters are greatly reduced. As for the optical-MIR ()-() CC-D, the absence of the dust does not affect the location or the slope of the theoretical M-type sequence, on the contrary the C-type sequence shows a change in the slope.
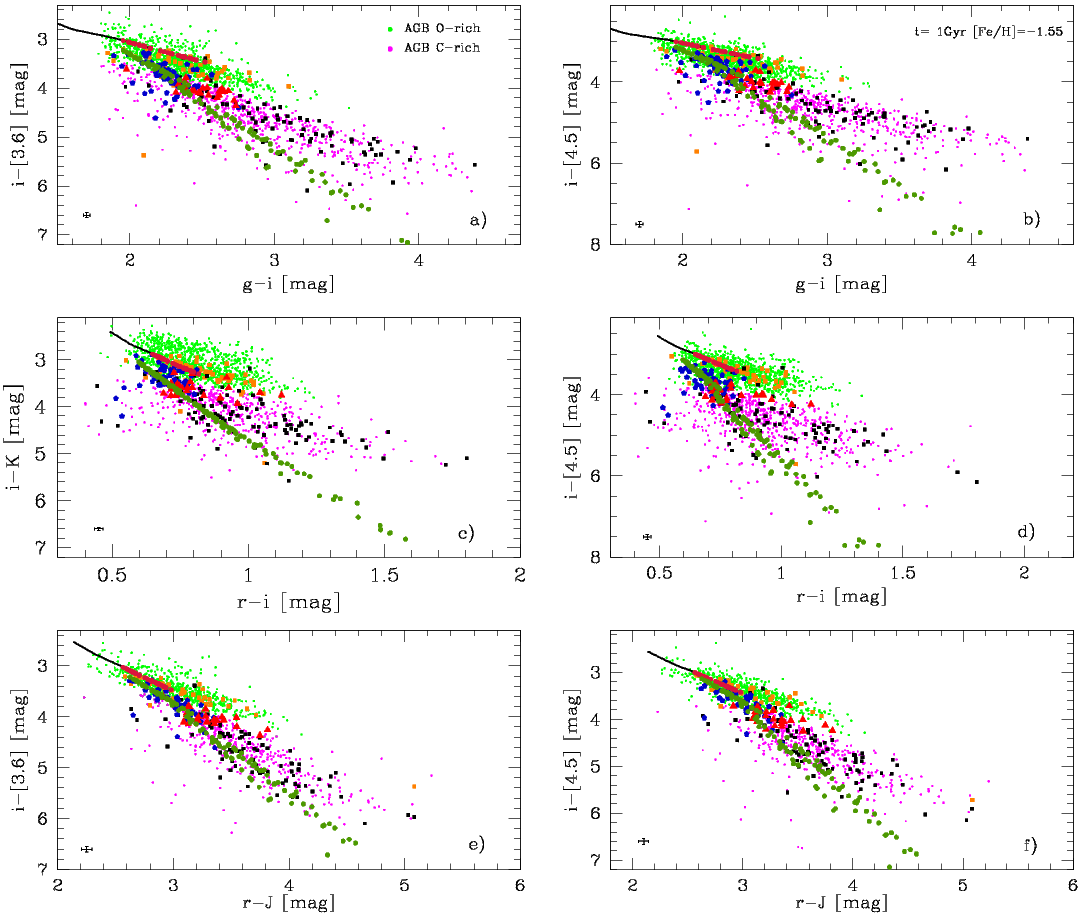
Figure 16 shows the most indicative CC-Ds defined by Paper I, on which we overplotted the isochrone that properly fit the observed magnitudes and colors of TP-AGB stars constructed by assuming t=1 Gyr, [Fe/H]= and considering the presence of the circumstellar dust. The isochrones were plotted following the same approach adopted in Figures 12, 13, 14 and 15, indeed we only display AGB evolutionary phases. The newsworthy outcome is that even changing the color combinations among the available optical, NIR and MIR magnitudes, the M- and C-type sequences predicted by the stellar models keep lying on two distinct sequences, the separation in magnitude and in color depending on the adopted color combination. Theory and observations agree quite well with the photometric sequences and the position of the spectroscopic samples on the different CC-Ds. This evidence further supports the plausibility of new diagnostics defined in Paper I. Moreover, the CC-Ds demonstrate that the ‘bluer’ C-rich stars have the same optical-NIR-MIR colors of the observed C-type sample.
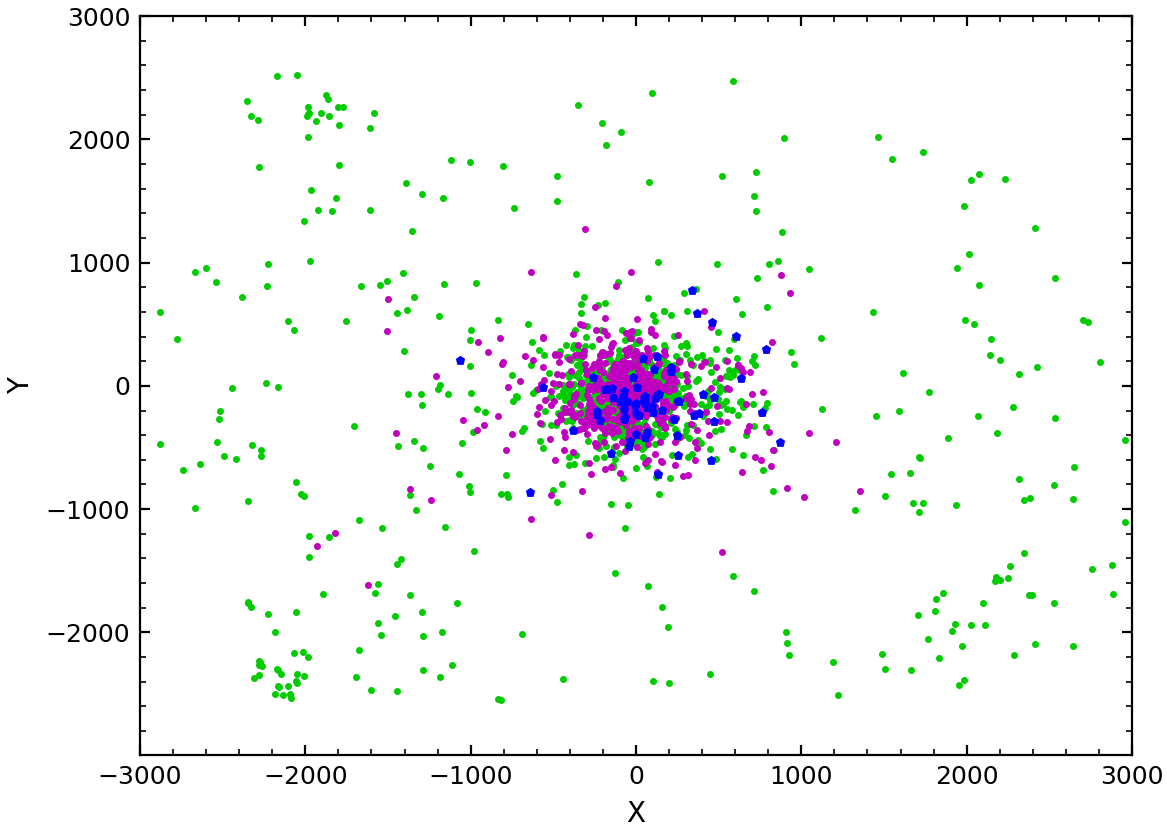
To investigate further the nature of these ‘bluer’ stars we determined their spatial distribution, shown in Figure 17 together with that of the O- and C-rich samples. As we have widely discussed in Paper I (see Sections 5.3 and 6), O- and C-rich stars have different distributions. The former are extended over the entire FoV, the latter are more centrally concentrated. The figure highlights the spatial distribution of the ‘bluer’ C-rich stars being more similar to the C-type group. The evidence from both the CC-Ds and the spatial distribution strongly suggests they can be considered ‘canonical’ C-rich stars.
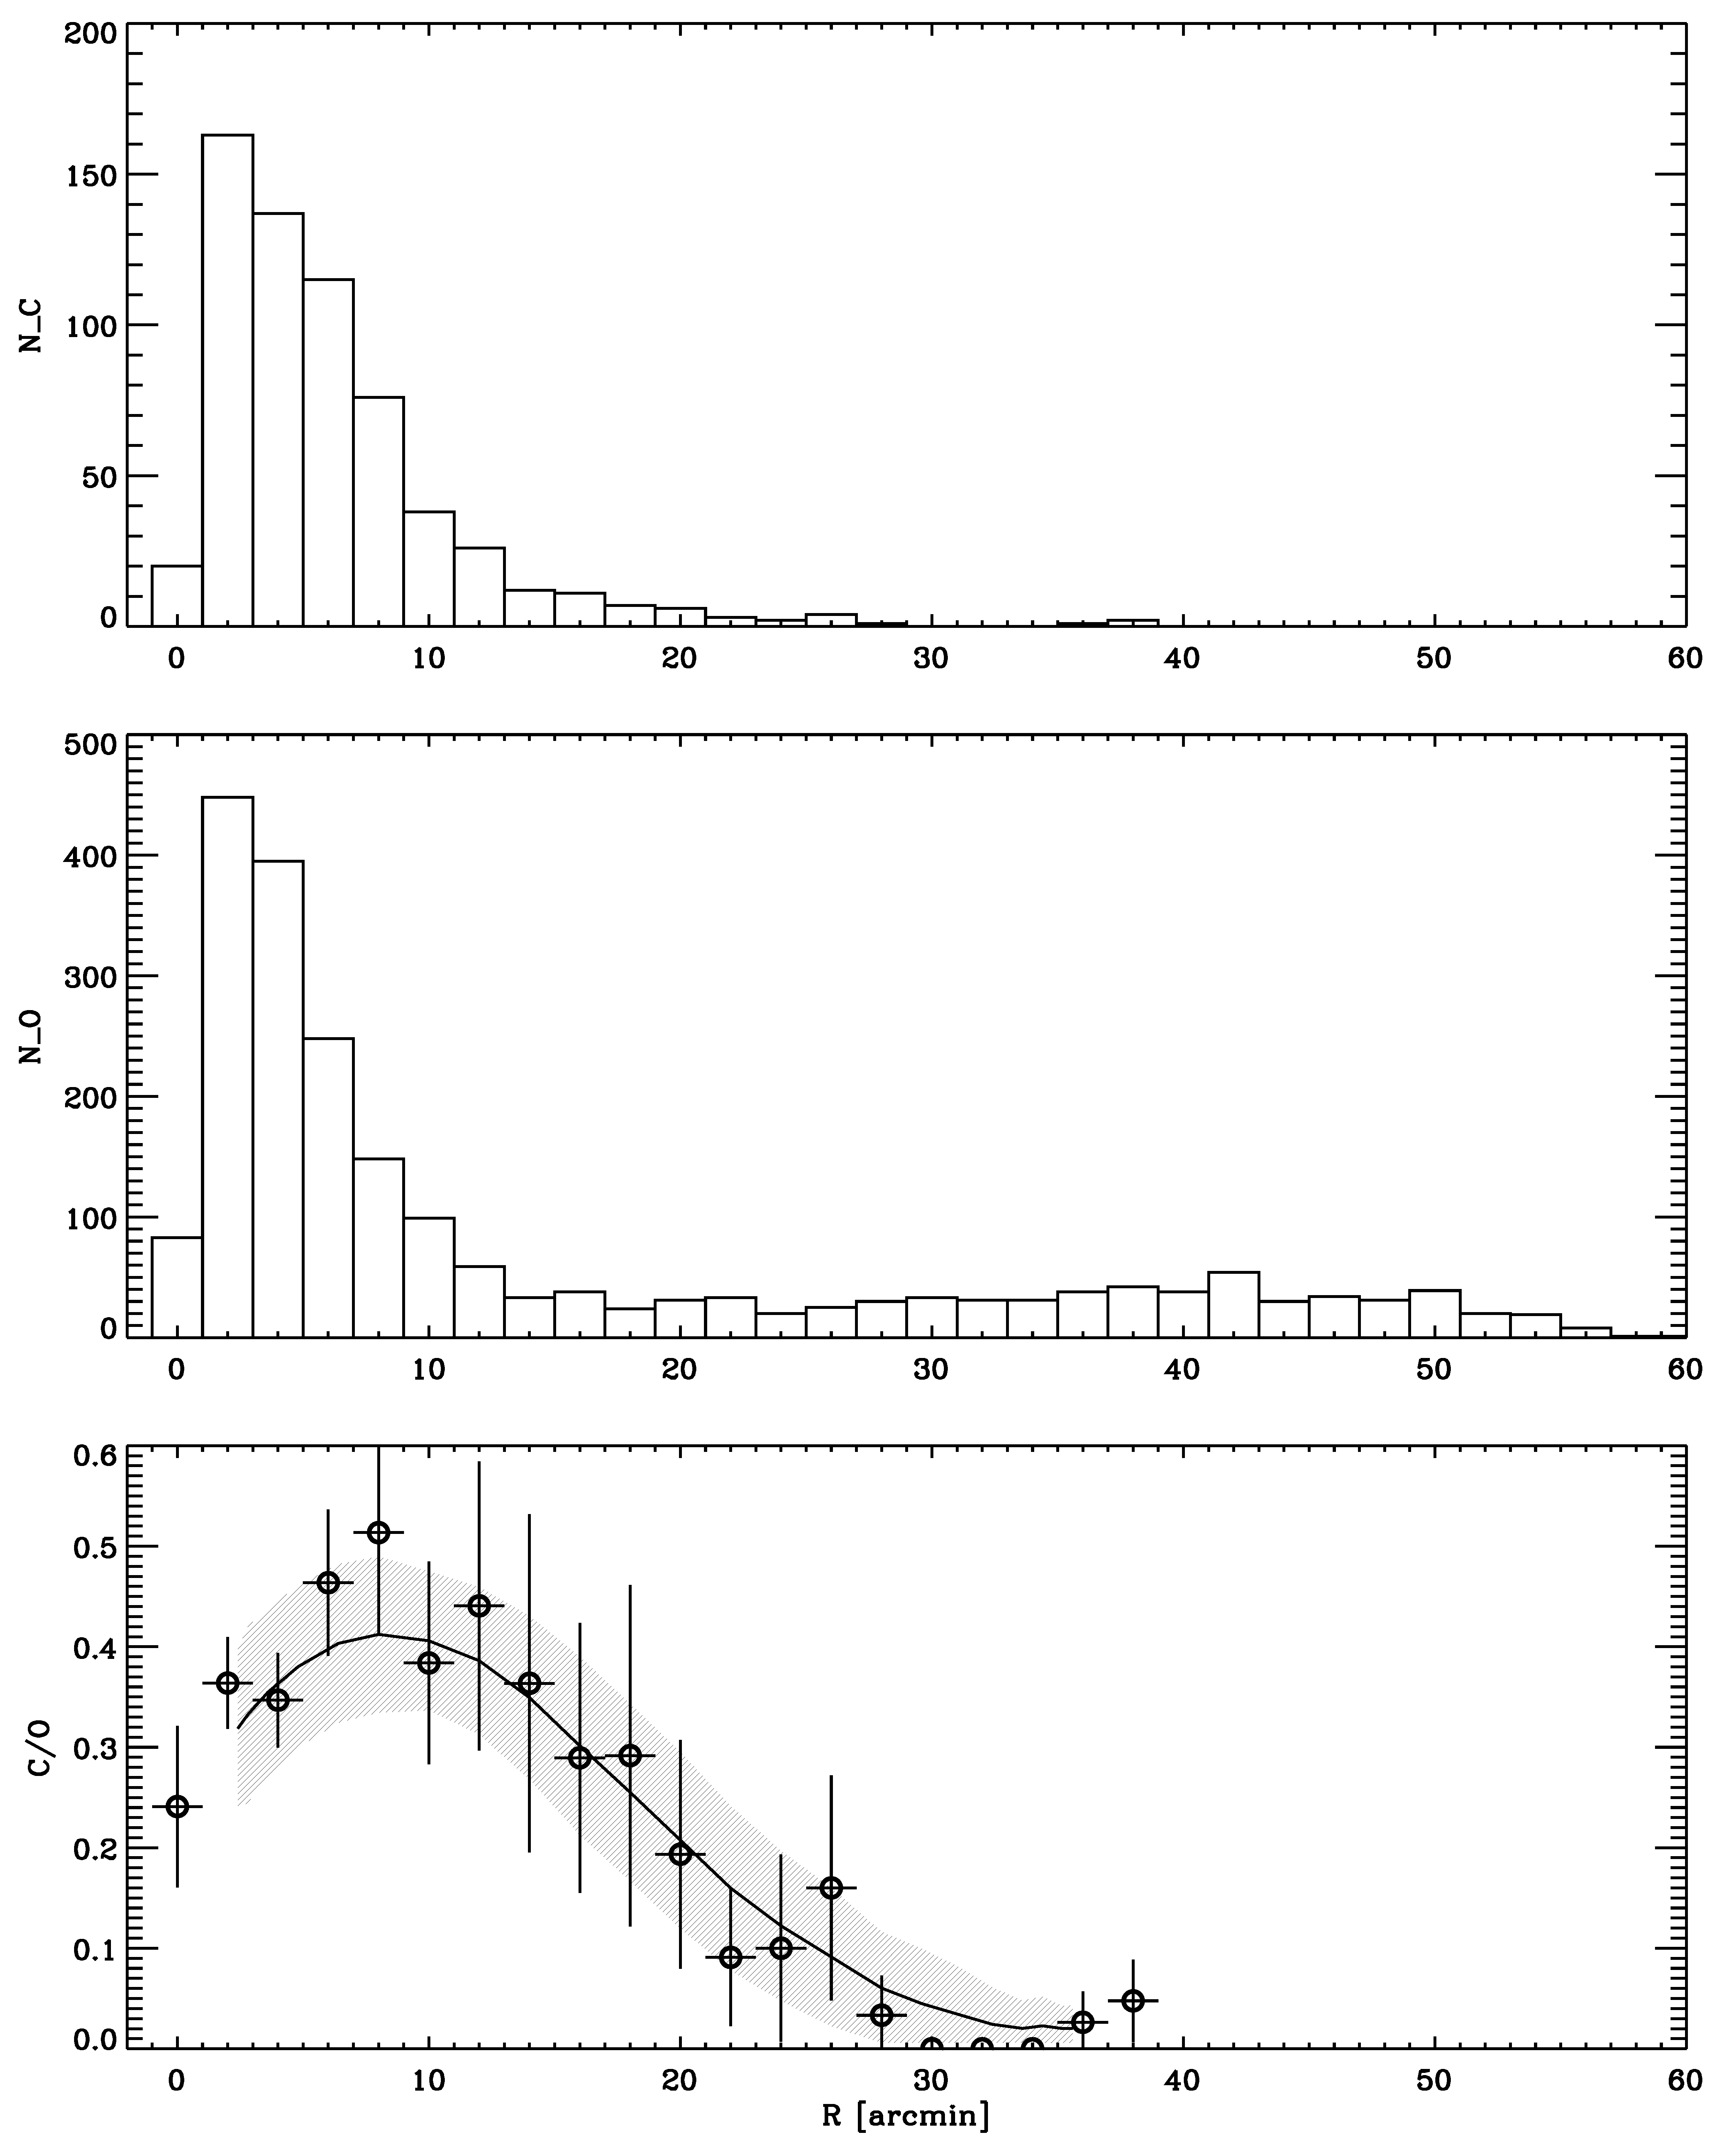
We have already discussed in Paper I the difference in spatial distribution between C-rich and O-rich stars, but we are now interested in discussing their radial distribution. To estimate the radial distance in the galactic restframe we adopted the following formula:
where and are the elliptical coordinates of both C-rich and O-rich stars, estimated taking into account the position angle and the eccentricity of NGC 6822 (see Paper I). The top and the middle panels of Figure 18 show the radial distribution C- and O-rich stars. As expected the former sample is more centrally concentrated when compared with the latter. The bottom panel of the same figure shows the ratio between C- and O-rich stars. To overcome spurious fluctuations in the ratio due to the adopted radial bin we performed a running average. We first ranked both C- and O-rich stars as a function of the radial distance. We adopted a box of eight arcmin and we estimated the mean radial distance and the ratio of the objects with between zero and eight arcmin. Then we moved outward by two arcmin and estimated the mean radial distance for the objects with between two and ten arcmin. We moved outwards with steps of two arcmin until the farthest object was included in the box. The solid line and the shaded area show the running average and its standard deviation, while the symbols display the ratios of the histograms and their Poissonian uncertainties. The ratio clearly indicates that C-rich stars are vanishing for radial distances larger than 25 arcmin. In passing, we also note that the decrease in the ratio for radial distances smaller than five arcmin is, within the errors, quite solid. This circumstantial evidence might indicate the possible presence of a bulge that is mainly dominated by old stellar populations, and in turn, smaller values of the C/O ratio. This working hypothesis requires more detailed investigations in NIR and MIR bands and at high spatial resolution.
In Tables 1 and 2 we provide all the optical-NIR-MIR photometric magnitudes and errors of the C- and O-rich samples, respectively. We also provide the ID number of the catalogs, the Gaia DR3 ID number and the sky coordinates. Note that the C-rich stars come from the selection performed in the - CC-D because they make the most populated sample when compared with the selections made on the other CC-Ds (see Section 6 of Paper I). The O-rich star sample was obtained from our global optical selection of AGB stars (- CMD, see Figure 11) once C-rich stars were removed. A full version of both tables will be supplied in an electronic form. We only list here the first 5 stars of each catalog for guidance.
Finally, we would like to draw attention on a type of AGB population, called ‘extreme’ AGB stars (or x-AGB; see Blum et al., 2006; Srinivasan et al., 2009; Boyer et al., 2011, 2015b, and references therein), dust-enshrouded objects that are experiencing strong mass loss. Accordingly, they are optically obscured, redder, and much more luminous in the IR than typical AGB stars (M- and C-type). We can roughly identify them in the optical-MIR CMD as a group of stars with colors mag. Earlier studies asserted that the progenitors of x-AGB stars could have masses around (i.e. van Loon et al., 1999). This means that they may be the evolved counterpart of the Cepheids with long periods (P 10d) present in NGC 6822 (Pietrzyński et al., 2004) and might be associated with populations of ages lower than 500 Myr. However, the latter is only a speculative suggestion and deserves a more quantitative analysis we plan to address in a forthcoming investigation.
5 Final remarks
In this second paper of our series we have carried out a quantitative photometric analysis of the dIrr galaxy NGC 6822 using the same optical-NIR-MIR dataset presented in Paper I, complemented with deep HST data of two fields in the disk of the galaxy. To delve deeper into the nature of the different stellar populations hosted by the galaxy, we compared the observations with a set of isochrones both from the BaSTI-IAC database and the CMD 3.7 web interface. We performed three different selections on our optical catalog based on the spatial distributions of the stellar components provided in Paper I. We thus obtained three samples representative of the young-, intermediate-, and old-age stellar populations in NGC 6822. We finally undertook an analysis of the C- and O-rich AGB populations. Our study has provided the following results:
(i) The comparison between the young sample and the stellar isochrones with different ages and metallicities disclosed that this population spans ages from 20 up to 100 Myr and a metal content from [Fe/H]= to [Fe/H]=. These values agree very well with the results from previous SFH studies (Gallart et al., 1996c; Cannon et al., 2012; Fusco et al., 2014).
(ii) The study on the RC stars have revealed that they are very well reproduced by stellar evolutionary models with ages from 4 to 8 Gyr, and metallicities from [Fe/H]= to [Fe/H]=. This suggests that the intermediate-age stellar populations experienced a modest chemical enrichment over an age range of at least 4-8 Gyrs. We stress that the analysis of the intermediate-age stellar population covers, for the first time, the entire body of the galaxy.
(iii) The old population is found to have ages older than 11 Gyr and low metal abundances down to [Fe/H]=. Moreover, the CMDs of both the ground-based sample and the HST fields revealed the presence of a highly populated red HB, whose faint edge is matched by a core He-burning sequence for an iron content of [Fe/H]=. This evidence is once again compatible with the SFH results (Gallart et al., 1996b; Cannon et al., 2012). However, we performed a detailed comparison between predicted and observed MSTO of the old stellar populations for the very first time.
(iv) The 3D CMD (color , magnitude , and the corresponding luminosity function of RG stars) and the marginal in -band magnitude of the RG stars allowed us to identify the rarely observed AGB clump population, with a luminosity peak of mag. Its location on the - CMD ( mag and mag) is in good agreement with the position of the clump provided by the evolutionary models. Moreover, the latter support marginal variations both in magnitude and in color for broad variations in stellar age ( Gyr) and in metal content ([Fe/H]=). It is worth mentioning that the identification of the AGB clump in NGC 6822 is, for the first time, fully supported by theoretical predictions.
(v) The analysis of the AGB population has been carried out by comparing the PARSEC+COLIBRI isochrones with three diagrams, the optical -() and the optical-MIR -() CMDs, plus the optical-MIR ()-() CC-D. The comparison has revealed that this population spans ages between 1 and 2 Gyr, and metal content between [Fe/H]= and [Fe/H]=. Looking at the used evolutionary models, we have also observed a peculiar behavior, occurring on the optical CMD only, of the isochrones that take account of the circumstellar dust during the TP-AGB phase. We found that the latter predict in the optical bands a slope, for the TP-AGB evolutionary stage, steeper than the observed one, with the models becoming increasingly too faint with increasing colors. This does not happen in the optical-MIR CMD, where models well fit the slope and the whole extension of the AGB. Moreover, the same can be seen if we account for isochrones with no dust contribution in both the optical -() and optical-MIR -() CMDs, although they cover a shorter color range. This evidence suggests that the fairly steep increase in the theoretical magnitudes of the redder AGB stars might be due to too large bolometric corrections applied to the optical filters, when the effect of the circumstellar dust, independently of its composition, is modelled. The same isochrones, with and without the circumstellar dust effect, plotted in the optical-MIR ()-() CC-D clearly show that M- and C-type models define two distinct color sequences that agree quite well with both the photometric and the spectroscopic samples. The same has been found for the other optical-NIR-MIR CC-Ds defined in Paper I. The current comparison between theory and observations fully validates the newly identified diagnostics to characterize O- and C-rich stars in stellar systems. Moreover, we also demonstrated that the so-called ‘bluer’ C-rich, as defined by L02, are truly C-rich AGB stars, since they attain colors in all the optical-NIR-MIR CC-Ds defined in Paper I and have a spatial distribution similar to the ‘canonical’ C-rich stars. To characterize in more detail the C- and O-rich stars in NGC 6822, we analyzed their radial distributions finding that, as expected, the former sample is more centrally concentrated than the latter. We then discussed the variation of the population ratio between C- and O-rich stars as a function of the radial distance. The results clearly indicate that C-rich stars are vanishing for radial distances larger than 25 arcmin. After this validation, the astrometry (Gaia complaint) together with optical, NIR and MIR photometry of candidate O- and C-rich stars are made available to the astronomical community in electronic form.
Finally, we have speculated that the x-AGB stars with redder colors than the typical AGB objects might be the evolved counterpart of Classical Cepheids in NGC 6822, associated with stellar populations younger than 500 Myr. This working hypothesis is inline with similar suggestions available in literature (i.e. van Loon et al., 1999) asserting that their progenitors could have masses of .
Acknowledgements
We thank the anonymous referee for his/her positive words concerning the
content and the cut of the paper, and for his/her pertinent suggestions that
improved its content and its readability.
It is a real pleasure to thank P. Battinelli and S. Demers for sending
us their catalog of NGC 6822 in electronic form.
M.T. is grateful to Santi Cassisi for his helpful comments and suggestions.
M.T. and M.Monelli acknowledge support from Spanish Ministry of Science, Innovation and Universities (MICIU) through the Spanish State Research Agency under the grant ”RR Lyrae stars, a lighthouse to distant galaxies and early galaxy evolution” and the European Regional Development Fun (ERDF) with reference PID2021-127042OB-I00. M. Monelli is also supported by the Severo Ochoa Programe 2020-2023 (CEX2019-000920-S), and by Spanish Ministry of Science, Innovation and Universities (MICIU) through the Spanish State Research Agency under the grant ”At the forefront of Galactic Archaeology: evolution of the luminous and dark matter components of the Milky Way and Local Group dwarf galaxies in the Gaia era” with reference PID2020-118778GB-I00/10.13039/501100011033.
M.S. acknowledges support from The Science and Technology Facilities Council Consolidated Grant ST/V00087X/1.
Several of us thank the support from Project PRIN MUR 2022 (code 2022ARWP9C) ‘Early Formation and Evolution of Bulge and HalO (EFEBHO)’ (PI: M. Marconi), funded by the European Union – Next Generation EU, and from the Large grant INAF 2023 MOVIE (PI: M. Marconi).
This research has been supported by the Munich Institute for Astro-, Particle and BioPhysics (MIAPbP) which is funded by the Deutsche Forschungsgemeinschaft (DFG, German Research Foundation) under Germany´s Excellence Strategy – EXC-2094 – 390783311.
This research has made use of both the BaSTI-IAC database
(http://basti-iac.oa-abruzzo.inaf.it/index.html) and the
CMD 3.7 web interface (http://stev.oapd.inaf.it/cgi-bin/cmd).
It has also made use of the GaiaPortal catalogs access tool, ASI - Space Science Data Center, Rome, Italy (http://gaiaportal.ssdc.asi.it).
This paper is based on data collected at the Subaru Telescope and retrieved from the HSC data archive system, which is operated by the Subaru Telescope and Astronomy Data Center at NAOJ. Data analysis was in part carried out with the cooperation of Center for Computational Astrophysics (CfCA), NAOJ. The HSC collaboration includes the astronomical communities of Japan and Taiwan, and Princeton University. The HSC instrumentation and software were developed by the National Astronomical Observatory of Japan (NAOJ), the Kavli Institute for the Physics and Mathematics of the Universe (Kavli IPMU), the University of Tokyo, the High Energy Accelerator Research Organization (KEK), the Academia Sinica Institute for Astronomy and Astrophysics in Taiwan (ASIAA), and Princeton University. Funding was contributed by the FIRST program from the Japanese Cabinet Office, the Ministry of Education, Culture, Sports, Science and Technology (MEXT), the Japan Society for the Promotion of Science (JSPS), Japan Science and Technology Agency (JST), the Toray Science Foundation, NAOJ, Kavli IPMU, KEK, ASIAA, and Princeton University.
All the HST data presented in this paper have been obtained from the Mikulski Archive for Space Telescopes (MAST) at the Space Telescope Science Institute. The specific observations analyzed can be accessed via https://doi.org/10.17909/6vkj-nm47 (catalog https://doi.org/10.17909/6vkj-nm47). STScI is operated by the Association of Universities for Research in Astronomy, Inc., under NASA contract NAS5–26555. Support to MAST for these data is provided by the NASA Office of Space Science via grant NAG5–7584 and by other grants and contracts.
This work is based in part on observations made with the Spitzer Space Telescope, which is operated by the Jet Propulsion Laboratory, California Institute of Technology under a contract with the National Aeronautics and Space Administration (NASA).
Some of the data reported here were obtained as part of the UKIRT Service Programme. UKIRT is owned by the University of Hawaii (UH) and operated by the UH Institute for Astronomy. When some of the data reported here were obtained, UKIRT was operated by the Joint Astronomy Centre on behalf of the Science and Technology Facilities Council of the U.K.
=6.2cm {rotatetable}
| ID | Gaia DR3 ID | (J2000) | (J2000) | [3.6] | [4.5] | ||||||||||||||
|---|---|---|---|---|---|---|---|---|---|---|---|---|---|---|---|---|---|---|---|
| 278720 | 4182463621278162176 | 296.06425 | -14.73605 | 23.08 | 0.004 | 20.98 | 0.004 | 20.14 | 0.002 | 17.59 | 0.043 | 16.66 | 0.024 | 16.21 | 0.025 | 15.60 | 0.030 | 15.71 | 0.050 |
| 286051 | 296.07271 | -14.85656 | 22.70 | 0.024 | 20.94 | 0.002 | 20.15 | 0.021 | 17.55 | 0.041 | 16.78 | 0.027 | 16.47 | 0.026 | 16.14 | 0.070 | 16.12 | 0.030 | |
| 286422 | 4182451011250681856 | 296.07312 | -14.80169 | 22.45 | 0.005 | 20.71 | 0.011 | 19.97 | 0.007 | 17.62 | 0.043 | 16.74 | 0.027 | 16.46 | 0.029 | 15.86 | 0.050 | 15.97 | 0.050 |
| 288006 | 296.07487 | -14.84211 | 23.63 | 0.041 | 21.69 | 0.013 | 20.44 | 0.059 | 16.45 | 0.017 | 15.74 | 0.012 | 15.42 | 0.012 | 15.27 | 0.090 | 15.11 | 0.020 | |
| 289805 | 4182443967504081536 | 296.07696 | -14.87800 | 22.67 | 0.011 | 20.88 | 0.006 | 19.88 | 0.006 | 17.48 | 0.039 | 16.59 | 0.023 | 16.14 | 0.010 | 15.61 | 0.070 | 15.60 | 0.030 |
Note. — Table 1 is published in its entirety in the machine-readable format. A portion is shown here for guidance regarding its form and content. The columns from the left to the right are the current ID, Gaia DR3 ID, sky coordinates, optical magnitudes with relative errors, NIR magnitudes with relative errors, MIR [3.6] and [4.5] magnitudes with relative errors.
=6.2cm {rotatetable}
| ID | Gaia DR3 ID | (J2000) | (J2000) | [3.6] | [4.5] | ||||||||||||||
|---|---|---|---|---|---|---|---|---|---|---|---|---|---|---|---|---|---|---|---|
| 355961 | 296.13787 | -14.76861 | 22.64 | 0.005 | 21.12 | 0.006 | 20.36 | 0.002 | 18.31 | 0.068 | 17.45 | 0.048 | 17.24 | 0.050 | 17.09 | 0.050 | 17.21 | 0.050 | |
| 356584 | 4182465438045963392 | 296.13833 | -14.66700 | 22.12 | 0.018 | 20.37 | 0.002 | 19.32 | 0.011 | 16.88 | 0.020 | 15.92 | 0.010 | 15.71 | 0.013 | 15.50 | 0.070 | 15.64 | 0.030 |
| 357611 | 4182446888084533888 | 296.13908 | -14.85591 | 22.57 | 0.004 | 21.09 | 0.003 | 20.02 | 0.003 | 17.72 | 0.043 | 17.12 | 0.037 | 16.96 | 0.041 | 16.98 | 0.210 | 16.45 | 0.030 |
| 358159 | 4182439530802291200 | 296.13950 | -14.94908 | 21.52 | 0.011 | 19.96 | 0.001 | 19.31 | 0.007 | 17.14 | 0.027 | 16.47 | 0.020 | 16.26 | 0.025 | 16.06 | 0.050 | 16.20 | 0.050 |
| 358437 | 296.13979 | -14.72897 | 22.60 | 0.003 | 20.92 | 0.004 | 20.12 | 0.003 | 17.80 | 0.045 | 16.99 | 0.034 | 16.72 | 0.032 | 16.56 | 0.070 | 16.63 | 0.070 |
Note. — Table 2 is published in its entirety in the machine-readable format. A portion is shown here for guidance regarding its form and content. The columns from the left to the right are the current ID, Gaia DR3 ID, sky coordinates, optical magnitudes with relative errors, NIR magnitudes with relative errors, MIR [3.6] and [4.5] magnitudes with relative errors.
Appendix A Precision of the current photometry
There are different softwares available in the astronomical community to perform accurate PSF photometry in crowded stellar fields. Among the different options there are DoPHOT by Schechter et al. (1993) and an updated version by Alonso-Garc´ıa et al. (2012), and DOLPHOT by Dolphin (2000, 2016). The reason why we are using DAOPHOT/ALLFRAME is threefold. a) We can extract all the information available in the images, since the position of the stellar centroids is performed simultaneously over all the multi-band images available. This typically means an improved accuracy in crowded stellar fields when approaching the limiting magnitude. b) The individual images are calibrated using local standards. This typically means a better accuracy in the photometric zero-points when compared with the calibration of the mean magnitude. c) This approach provide the unique opportunity to perform a detailed search for variable stars, since the extracted time series are homogeneous not only for the multi-band photometry, but also for the absolute calibration. The reader interested in a more detailed discussion concerning aperture and PSF photometry is referred to https://en.wikipedia.org/wiki/Photometry_(astronomy).
We now discuss the precision and the uniformity of the photometric zero-points over the FoV. In the final photometric combination of all the data for NGC 6822, the individual photometric zero point of each image is redetermined from a local network of 3,264 local standard stars within our NGC 6822 target field. The magnitudes and colors of these stars have been established by direct comparison to an all-sky network of photometric standards under development by P.B. Stetson (e.g. Stetson, 2000, 2005; Stetson et al., 2019) over approximately the last 30 years, as first mentioned in Stetson, Hesser & Smecker-Hane (1998). Most of this work is based upon other people’s public-domain data downloaded from the various on-line astronomical archives, but a significant fraction is derived from targeted observations obtained by us for this purpose.
As of the moment of this writing (2024 December 11), the database from which this photometric standard network is derived consists of 11,599 individual datasets, where a ”dataset“ is defined as the output of one CCD on one night; an eight-chip mosaic, like WFI on the ESO/MPI 2.2m telescope for instance, would produce eight datasets per night. These datasets comprise somewhat over 800,000 individual CCD images from some 4,101 nights distributed among 880 observing runs over 41.6 years (1983 January 8 through 2024 August 19). These data were obtained with (at the moment) 49 different telescopes and a greater number of different instruments.
Each dataset is individually calibrated to our current approximation of the Landolt (Landolt, 1973, 1992) realization of the Johnson UBV and Kron-Cousins RI photometric systems. The transformation equation for each dataset normally includes linear and quadratic color terms, and for larger-format CCDs linear and often quadratic terms in the spatial location of the star on the detector. Normally, mean values for the color terms are determined and employed for all the datasets of a given observing run—sometimes collectively for the individual chips in mosaic cameras, sometimes separately depending upon the transformation residuals—but zero points and spatial transformation terms are always derived for each individual dataset. On nights where photometric conditions apparently prevailed a nightly global zero point and atmospheric extinction coefficients are derived; the extinction coefficients are derived collectively and applied uniformly to all the CCDs in a multi-chip mosaic, but each chip gets its own individual nightly zero point. On apparently non-photometric nights where nevertheless useful observations had been obtained, no global zero point or extinction coefficients were derived. Instead, a specific zero point is computed each for each individual CCD image containing more than one standard. These non-photometric data do not improve the absolute zero-point of all stars contained in a particular CCD-sized patch of sky, but they do help to reduce random photometric errors relative to each other among that particular subset of stars. Of the 11,599 datasets reduced at this moment, we consider that 5,318 were obtained under photometric conditions, and 6,281 have been reduced in non-photometric mode.
A comparison of Landolt’s published photometry with our own average photometry of his stars, included within our database, show root-mean-square (rms) differences per star of 0.0143 mag in (307 stars in common), 0.0102 mag in (320 stars), 0.0102 mag in (219 stars), and 0.0137 mag in (221 stars). These values appear to represent the ultimate impossibility of duplicating the detailed wavelength sensitivity of typically available filter/detector bandpasses, as they measure the wide variety of possible stellar spectral-energy distributions. We feel, however, that overall our net standard-star network should be on Landolt’s zero points at a level of order 0.001 mag in each filter. Nightly rms residuals of observed magnitudes of individual stars from our adopted standard values are typically 0.02 mag in each filter. Specifically, the median values of the rms star-to-star calibration residual over all available datasets are: 0.0121 mag in based upon 8,306 datasets containing observations, 0.0094 mag in V (9,412 datasets), 0.0081 mag in (6,418 datasets), and 0.0110 mag in (8,252 datasets); inter-quartile ranges are 0.0076–0.0182 mag in , 0.0059–0.0139 mag in , 0.0045–0.0135 mag in , and 0.0062–0.0171 mag in . These numbers probably reflect (a) random vagaries of the instantaneous atmospheric extinction from the simple relation in different directions at different times, and (b) inadequate flat-fielding of the observed images, as well as the aforementioned (c) idiosyncrasies of individual filter/detector bandpasses as they sample different spectral-energy distributions. As context, among the data considered here, then median number of standard-star observations used to calibrate an individual dataset (i.e., the median number of standard-star observations per filter per CCD per night) is 1,881 in , 3,412 in , 2,684 in , and 2,567 in . Star-to-star residuals of order 0.02 mag divided by the square root of numbers of order suggests that the uncertainty of a typical calibration is small compared to the random uncertainty of any individual stellar measurement. Our photometry is available to concerned researchers who want a more detailed comparison of our photometric system with Landolt’s more recent publications or with other photometric studies of our target fields.
At this precise moment the all-sky standard star network includes some 273,102 stars meeting the following minimal standards: at least five observations in a given filter on photometric occasions, a standard error of the mean magnitude in a given filter no greater than 0.02 mag, and no evidence of intrinsic variability in excess of 0.05 mag, rms, considering all available filters together. However, this standard-star network evolves incrementally, mostly as new observing runs are added, but also to a lesser extent as calibration software and methodology improve, as new stars become acceptable as standards due to new data, and as apparently variable stars are recognized and removed from the list of accepted standard stars. The instantaneous state of this standard-star system in (at the moment) 364 target fields on the sky can be freely obtained by anyone at any time555They are available at https://www.canfar.net/storage/list/STETSON/homogeneous/Latest_photometry_for_targets_with_at_least_BVI and https://www.canfar.net/storage/vault/list/STETSON/homogeneous/Latest_photometry_for_targets_with_only_V_and_B_or_R_or_I.
Interested readers are welcome to download whatever they can use. We encourage them to retain older copies of the data files as new ones are made available, so that they can monitor the evolution of the network and judge whether that affects their science. We find that the adopted photometric magnitudes of a reasonably well-observed star typically change only in the third or fourth decimal place between subsequent generations of analysis.
As mentioned above, in the last step before combining the accumulated measured magnitudes into final photometric indices for target stars, the individual photometric zero point assigned to each CCD image is reconsidered on the basis of local photometric standards belonging to the larger all-sky network that happen to be contained within that image. In the particular case of NGC 6822, this means that zero points have been redetermined for 9,124 images: 2,884 , 2,087 , 1,085 , and 3,068 . Among these, the median number of local standards used to determine the personal zero point of an individual CCD image was 154 (interquartile range 70–300); the median standard error of a mean zero point obtained in this way was 0.0009 mag, interquartile range 0.0007–0.0017. More specifically, the median uncertainty of a mean zero point derived for an individual image was 0.0010 mag in , 0.0007 mag in , 0.0013 mag in , and 0.0010 mag in . The accumulated error due to uncertain zero points for a star measured in more than a few different images should therefore be small. To be sure, this uncertainty will not be the same at every point within the target area, but we do not expect this component of the error budget to vary strongly around the field: the center of the area appears in more different images than the periphery, but on the other hand measurements in the center are more compromised by crowding than those around the edge. These two effects should partially compensate each other. Overall, within our studied area 90% of stars brighter than = 23.5 appear in at least 35 images (median 96, maximum 395), 9 images (54, 267), 18 images (51, 131), and 25 images (82, 314). As we consider brighter magnitude limits, the 90-th and 50-th percentile numbers increase. For ¡ 22.5, for instance, 90% of stars appear in at least 17 images, and half appear in at least 88.
Readers in need of further details concerning our analysis are invited to communicate with co-author P.B. Stetson.
References
- Alonso-Garc´ıa et al. (2012) Alonso-García, J., Mateo, M., Sen, B., et al. 2012, AJ, 143, 70. doi:10.1088/0004-6256/143/3/70
- Astropy Collaboration et al. (2013) Astropy Collaboration, Robitaille, T. P., Tollerud, E. J., et al. 2013, A&A, 558, A33. doi:10.1051/0004-6361/201322068
- Astropy Collaboration et al. (2018) Astropy Collaboration, Price-Whelan, A. M., Sipőcz, B. M., et al. 2018, AJ, 156, 123. doi:10.3847/1538-3881/aabc4f
- Astropy Collaboration et al. (2022) Astropy Collaboration, Price-Whelan, A. M., Lim, P. L., et al. 2022, ApJ, 935, 167. doi:10.3847/1538-4357/ac7c74
- Albert et al. (2000) Albert, L., Demers, S., & Kunkel, W. E. 2000, AJ, 119, 2780. doi:10.1086/301387
- Baldacci et al. (2005) Baldacci, L., Rizzi, L., Clementini, G., Held, E. V. 2005, A&A, 431, 1189. doi:10.1051/0004-6361:20041684
- Battinelli & Demers (2000) Battinelli, P. & Demers, S. 2000, AJ, 120, 1801. doi:10.1086/301546
- Battinelli & Demers (2005a) Battinelli, P. & Demers, S. 2005a, A&A, 434, 657. doi:10.1051/0004-6361:20042278
- Besla et al. (2016) Besla, G., Martínez-Delgado, D., van der Marel, R. P., et al. 2016, ApJ, 825, 20. doi:10.3847/0004-637X/825/1/20
- Bennet et al. (2023) Bennet, P., Patel, E., Sohn, S. T., et al. 2023, arXiv:2312.09276. doi:10.48550/arXiv.2312.09276
- Blum et al. (2006) Blum, R. D., Mould, J. R., Olsen, K. A., et al. 2006, AJ, 132, 2034. doi:10.1086/508227
- Bressan et al. (2012) Bressan, A., Marigo, P., Girardi, L., et al. 2012, MNRAS, 427, 127. doi:10.1111/j.1365-2966.2012.21948.x
- Boyer et al. (2011) Boyer, M. L., Srinivasan, S., van Loon, J. T., et al. 2011, AJ, 142, 103. doi:10.1088/0004-6256/142/4/103
- Boyer et al. (2012) Boyer, M. L., Srinivasan, S., Riebel, D., et al. 2012, ApJ, 748, 40. doi:10.1088/0004-637X/748/1/40
- Boyer et al. (2015a) Boyer, M. L., McQuinn, K. B. W., Barmby, P., et al. 2015, ApJS, 216, 10. doi:10.1088/0067-0049/216/1/10
- Boyer et al. (2015b) Boyer, M. L., McQuinn, K. B. W., Barmby, P., et al. 2015, ApJ, 800, 51. doi:10.1088/0004-637X/800/1/51
- Boyer et al. (2024) Boyer, M. L., Pastorelli, G., Girardi, L., et al. 2024, arXiv:2401.14889. doi:10.48550/arXiv:2401.14889
- Cannon et al. (2012) Cannon, J. M., O’Leary, E. M., Weisz, D. R., et al. 2012, ApJ, 747, 122. doi:10.1088/0004-637X/747/2/122
- Cardelli et al. (1989) Cardelli, J. A., Clayton, G. C., & Mathis, J. S. 1989, ApJ, 345, 245. doi:10.1086/167900
- Choi et al. (2022) Choi, Y., Olsen, K. A. G., Besla, G., et al. 2022, ApJ, 927, 153. doi:10.3847/1538-4357/ac4e90
- Cioni (2009) Cioni, M.-R. L. 2009, A&A, 506, 1137. doi:10.1051/0004-6361/200912138
- Dolphin (2000) Dolphin, A. E. 2000, PASP, 112, 1383. doi:10.1086/316630
- Dolphin (2016) Dolphin, A. 2016, Astrophysics Source Code Library. ascl:1608.013
- Du et al. (2020) Du, X., Shapley, A. E., Tang, M., et al. 2020, ApJ, 890, 65. doi:10.3847/1538-4357/ab67b8
- Feast et al. (2012) Feast, M. W., Whitelock, P. A., Menzies, J. W., Matsunaga, N. 2012, MNRAS, 421, 2998. doi:10.1111/j.1365-2966.2012.20525.x
- Ferraro (1992) Ferraro, F. R. 1992, Mem. Soc. Astron. Italiana, 63, 491
- Fusco et al. (2012) Fusco, F., Buonanno, R., Bono, G., et al. 2012, A&A, 548, A129. doi:10.1051/0004-6361/201220554
- Fusco et al. (2014) Fusco, F., Buonanno, R., Hidalgo, S. L., et al. 2014, A&A, 572, A26. doi:10.1051/0004-6361/201323075
- Gallart et al. (1996a) Gallart, C., Aparicio, A., & Vilchez, J. M. 1996, AJ, 112, 1928. doi:10.1086/118153
- Gallart et al. (1996b) Gallart, C., Aparicio, A., Bertelli, G. & Chiosi, C. 1996b, AJ, 112, 1950. doi:10.1086/118154
- Gallart et al. (1996c) Gallart, C., Aparicio, A., Bertelli, G. & Chiosi, C. 1996c, AJ, 112, 2596. doi:10.1086/118205
- Gieren et al. (2006) Gieren, W., Pietrzyński, G., Nalewajko, K., et al. 2006, ApJ, 647, 1056. doi:10.1086/505574
- Hidalgo et al. (2018) Hidalgo, S. L., Pietrinferni, A., Cassisi, S., et al. 2018, ApJ, 856, 125. doi:10.3847/1538-4357/aab158
- Hirschauer et al. (2020) Hirschauer, A. S., Gray, L., Meixner, M., et al. 2020, ApJ, 892, 91. doi:10.3847/1538-4357/ab7b60
- Hubble (1925) Hubble, E. P. 1925, ApJ, 62, 409. doi:10.1086/142943
- Hunter (2007) Hunter, J. D. 2007, Computing in Science and Engineering, 9, 90. doi:10.1109/MCSE.2007.55
- Huxor et al. (2013) Huxor, A. P., Ferguson, A. M. N., Veljanoski, J., et al. 2013, MNRAS, 429, 1039. doi:10.1093/mnras/sts387
- Hwang et al. (2011) Hwang, N., Lee, M. G., Lee, J. C., et al. 2011, ApJ, 738, 58. doi:10.1088/0004-637X/738/1/58
- Jones et al. (2018) Jones, O. C., Maclay, M. T., Boyer, M. L., et al. 2018, ApJ, 854, 117. doi:10.3847/1538-4357/aaa542
- Jones et al. (2019) Jones, O. C., Sharp, M. J., Reiter, M., et al. 2019, MNRAS, 490, 832. doi:10.1093/mnras/stz2560
- Kacharov et al. (2012) Kacharov, N., Rejkuba, M., & Cioni, M.-R. L. 2012, A&A, 537, A108. doi:10.1051/0004-6361/201117383
- Kang et al. (2006) Kang, A., Sohn, Y.-J., Kim, H.-I., et al. 2006, A&A, 454, 717. doi:10.1051/0004-6361:20054763
- Khan et al. (2015) Khan, R., Stanek, K. Z., Kochanek, C. S., Sonneborn, G. 2015, ApJS, 219, 42. doi:10.1088/0067-0049/219/2/42
- Kinson et al. (2021) Kinson, D. A., Oliveira, J. M., & van Loon, J. T. 2021, MNRAS, 507, 5106. doi:10.1093/mnras/stab2386
- Kirby et al. (2013) Kirby, E. N., Cohen, J. G., Guhathakurta, P., et al. 2013, ApJ, 779, 102. doi:10.1088/0004-637X/779/2/102
- Landolt (1992) Landolt, A. U. 1992, AJ, 104, 340. doi:10.1086/116242
- Landolt (1973) Landolt, A. U. 1973, AJ, 78, 959. doi:10.1086/111503
- Lenkić et al. (2023) Lenkić, L., Conor, N., Jones, O. C., et al. 2023, arXiv:2307.15704. doi:10.48550/arXiv:2307.15704
- Letarte et al. (2002) Letarte, B., Demers, S., Battinelli, P., Kunkel, W. E. 2002, AJ, 123, 832. doi:10.1086/338319
- Li et al. (2025) Li, Zhi-wen, Yang, M., Jiang, B., et al. 2025, ApJ, 979, 208. doi:10.3847/1538-4357/ada1d4
- Marigo et al. (2013) Marigo, P., Bressan, A., Nanni, A., et al. 2013, MNRAS, 434, 488. doi:10.1093/mnras/stt1034
- Massey et al. (1995) Massey, P., Armandroff, T. E., Pyke, R., et al. 1995, AJ, 110, 2715. doi:10.1086/117725
- Mateo (1998) Mateo, M. L. 1998, ARA&A, 36, 435. doi:10.1146/annurev.astro.36.1.435
- Mennickent et al. (2006) Mennickent, R. E., Gieren, W., Soszyński, I., Pietrzyński, G. 2006, A&A, 450, 873. doi:10.1051/0004-6361:20054359
- Monelli et al. (2003) Monelli, M., Pulone, L., Corsi, C. E., et al. 2003, AJ, 126, 218. doi:10.1086/375457
- Monelli et al. (2010b) Monelli, M., Hidalgo, S. L., Stetson, P. B., et al. 2010, ApJ, 720, 1225. doi:10.1088/0004-637X/720/2/1225
- Nally et al. (2024) Nally, C., Jones, O. C., Lenkić, L., et al. 2023, arXiv:2309.13521v2. doi:10.48550/arXiv.2309.13521
- Patrick et al. (2015) Patrick, L. R., Evans, C. J., Davies, B., et al. 2015, ApJ, 803, 14. doi:10.1088/0004-637X/803/1/14
- Pietrzyński et al. (2004) Pietrzyński, G., Gieren, W., Udalski, A., et al. 2004, AJ, 128, 2815. doi:10.1086/425531
- Pulone (1992a) Pulone, L. 1992, Mem. Soc. Astron. Italiana, 63, 53
- Pulone (1992b) Pulone, L. 1992, Mem. Soc. Astron. Italiana, 63, 485
- Ren et al. (2021a) Ren, Y., Jiang, B., Yang, M., et al. 2021, ApJ, 907, 18. doi:10.3847/1538-4357/abcda5
- Renzini & Buzzoni (1986) Renzini, A. & Buzzoni, A. 1986, Spectral Evolution of Galaxies, 122, 195. doi:10.1007/978-94-009-4598-2_19
- Rich et al. (2014) Rich, J. A., Persson, S. E., Freedman, W. L., et al. 2014, ApJ, 794, 107. doi:10.1088/0004-637X/794/2/107
- Salaris & Cassisi (2005) Salaris, M. & Cassisi, S. 2005, Evolution of Stars and Stellar Populations, pp. 400. ISBN 0-470-09220-3. Wiley-VCH , December 2005
- Schechter et al. (1993) Schechter, P. L., Mateo, M., & Saha, A. 1993, PASP, 105, 1342. doi:10.1086/133316
- Schlegel et al. (1998) Schlegel, D. J., Finkbeiner, D. P., & Davis, M. 1998, ApJ, 500, 525. doi:10.1086/305772
- Sibbons et al. (2012) Sibbons, L. F., Ryan, S. G., Cioni, M.-R. L., et al. 2012, A&A, 540, A135. doi:10.1051/0004-6361/201118365
- Sibbons et al. (2015) Sibbons, L. F., Ryan, S. G., Napiwotzki, R., Thompson, G. P. 2015, A&A, 574, A102. doi:10.1051/0004-6361/201423981
- Srinivasan et al. (2009) Srinivasan, S., Meixner, M., Leitherer, C., et al. 2009, AJ, 137, 4810. doi:10.1088/0004-6256/137/6/4810
- Stetson (1987) Stetson, P. B. 1987, PASP, 99, 191. doi:10.1086/131977
- Stetson (1994) Stetson, P. B. 1994, PASP, 106, 250. doi:10.1086/133378
- Stetson et al. (1998) Stetson, P. B., Hesser, J. E., & Smecker-Hane, T. A. 1998, PASP, 110, 533. doi:10.1086/316164
- Stetson (2000) Stetson, P. B. 2000, PASP, 112, 925. doi:10.1086/316595
- Stetson (2005) Stetson, P. B. 2005, PASP, 117, 563. doi:10.1086/430281
- Stetson et al. (2019) Stetson, P. B., Pancino, E., Zocchi, A., et al. 2019, MNRAS, 485, 3042. doi:10.1093/mnras/stz585
- Stott et al. (2013) Stott, J. P., Sobral, D., Smail, I., et al. 2013, MNRAS, 430, 1158. doi:10.1093/mnras/sts684
- Tantalo et al. (2022) Tantalo, M., Dall’Ora, M., Bono, G., et al. 2022, ApJ, 933, 197. doi:10.3847/1538-4357/ac7468
- Taylor (2005) Taylor, M. B. 2005, Astronomical Data Analysis Software and Systems XIV, 347, 29
- Tolstoy et al. (2001) Tolstoy, E., Irwin, M. J., Cole, A. A., et al. 2001, MNRAS, 327, 918. doi:10.1046/j.1365-8711.2001.04785.x
- van Loon et al. (1999) van Loon, J. T., Groenewegen, M. A. T., de Koter, A., et al. 1999, A&A, 351, 559. doi:10.48550/arXiv.astro-ph/9909416
- Venn et al. (2001) Venn, K. A., Lennon, D. J., Kaufer, A., et al. 2001, ApJ, 547, 765. doi:10.1086/318424
- Weiss & Ferguson (2009) Weiss, A. & Ferguson, J. W. 2009, A&A, 508, 1343. doi:10.1051/0004-6361/200912043
- Whitelock et al. (2013) Whitelock, P. A., Menzies, J. W., Feast, M. W., et al. 2013, MNRAS, 428, 2216. doi:10.1093/mnras/sts188
- Whitelock et al. (2018) Whitelock, P. A., Menzies, J. W., Feast, M. W., et al. 2018, MNRAS, 473, 173. doi:10.1093/mnras/stx2275
- Wyder (2003) Wyder, T. K. 2003, AJ, 125, 3097. doi:10.1086/375208
- Zhang et al. (2021) Zhang, S., Mackey, D., & Da Costa, G. S. 2021, MNRAS, 508, 2098. doi:10.1093/mnras/stab2642
- Zivick et al. (2018) Zivick, P., Kallivayalil, N., van der Marel, R. P., et al. 2018, ApJ, 864, 55. doi:10.3847/1538-4357/aad4b0