Photometric-Metallicity and Distance Estimates for 70,000 RR Lyrae Stars from the Zwicky Transient Facility
Abstract
Utilizing Zwicky Transient Facility (ZTF) data and existing RR Lyrae stars (RRLs) catalogs, this study achieves the first calibration of the and relations in the ZTF photometric system for RRab and RRc stars. We also re-calibrate the period-absolute magnitude-metallicity (PMZ) and period-Wesenheit-metallicity (PWZ) relations in the ZTF -bands for RRab and RRc stars. Based on nearly 4100 stars with precise measurements of , , , and , and available spectroscopic-metallicity estimates, the photometric-metallicity relations exhibit strong internal consistency across different bands, supporting the use of a weighted averaging method for the final estimates. The photometric-metallicity estimates of globular clusters based on RR Lyrae members also show excellent agreement with high-resolution spectroscopic measurements, with typical scatter of 0.15 dex for RRab stars and 0.14 dex for RRc stars, respectively. Using hundreds of local RRLs with newly derived photometric metallicities and precise Gaia Data Release 3 parallaxes, we establish the PMZ and PWZ relations in multiple bands. Validation with globular cluster RR Lyrae members reveals typical distance errors of 3.1% and 3.0% for the PMZ relations, and 3.1% and 2.6% for the PWZ relations for RRab and RRc stars, respectively. Compared to PMZ relations, the PWZ relations are tighter and almost unbiased, making them the recommended choice for distance calculations. We present a catalog of 73,795 RRLs with precise photometric metallicities; over 95% of them have accurate distance measurements. Compared to Gaia DR3, approximately 25,000 RRLs have precise photometric metallicities and distances derived for the first time.
Subject headings:
stars: distances – stars: kinematics and dynamics – Galaxy: kinematics and dynamics1. Introduction
RR Lyrae stars (RRLs) are classical short-period (0.2 d-1 d), low-mass (1 ), pulsating variable stars that reside at the intersection of the horizontal branch and the instability strip. They are typically categorized into three subtypes based on their pulsation properties: fundamental mode RRLs (RRab), first-overtone RRLs (RRc), and double-mode RRLs (RRd). Characterized by their old age (10 Gyr) and metal-poor composition, most RRLs are widely distributed throughout the Galaxy, including the bulge (e.g., Pietrukowicz et al. 2015; Olivares Carvajal et al. 2024), thick disk (e.g., Mateu & Vivas 2018), stellar halo (e.g., Liu et al. 2022; Cabrera Garcia et al. 2024), and substructures (including streams and local overdensities; e.g., Wang et al. 2022; Ye et al. 2024; Sun et al. 2024), and are also observed in nearby galaxies (e.g., Soszyński et al. 2016a; Jacyszyn-Dobrzeniecka et al. 2017). Their relatively bright luminosities and large amplitudes of distinctive light curves make them readily identifiable, and they can serve as excellent Population II chemical tracers. Furthermore, they are well-known standard candles, with a tight period-absolute magnitude-metallicity (PMZ) relation in the infrared/mid-infrared bands. They also exhibit specific absolute magnitude-metallicity relations in the visual bands, owing to their insensitivity to bolometric corrections within the RRLs temperature range (obvious in the -band and gradually diminishing beyond the -band; Bono et al. 2003; Bhardwaj 2022). Thanks to these attributes, RRLs are invaluable for probing the chemical and kinematic properties of the Milky Way and its neighbors, offering insights into their formation and evolutionary history (e.g., Iorio & Belokurov 2019; Ablimit et al. 2022).
With the advancement of numerous photometric surveys, such as the Sloan Digital Sky Survey (SDSS; York et al. 2000) and the Sloan Extension for Galactic Understanding and Exploration (SEGUE; Yanny et al. 2009; Rockosi et al. 2022), the Two Micron All Sky Survey (2MASS; Skrutskie et al. 2006), the Pan-STARRS1 survey (PS1; Sesar et al. 2017), the Zwicky Transient Facility (ZTF; Masci et al. 2018), the SkyMapper Southern Survey (SMSS; Wolf et al. 2018), the Optical Gravitational Lensing Experiment (OGLE; Soszyński et al. 2019), the All-Sky Automated Survey for SuperNovae (ASAS-SN; Jayasinghe et al. 2021; Christy et al. 2023), and the Gaia mission (Clementini et al. 2023), large numbers of RRLs across an extensive volume of the Galaxy have been discovered. At present, the Gaia third data release (DR3) has provided the largest and most reliable all-sky catalog of 270,000 RRLs, identified over a 34 month period with multi-color data involving the -, - and -bands (Clementini et al. 2023). However, this sample of RRLs remains incomplete; due to Gaia’s scanning strategy, different sky regions have been monitored at varying epochs. In areas with sparse sampling, it becomes difficult to identify RRLs from their light curves, and even when identified, it is challenging to derive precise Fourier parameters from their curves, which are crucial for determining photometric-metallicity estimates. On the other hand, the ZTF, an optical sky survey characterized by extensive sky coverage, impressive depth, and a large number of observational epochs, is a treasure trove for the studies of variable stars (Bellm & Kulkarni 2017). However, the rapid influx of data has resulted in a notable delay in the search and classification of variable stars. For RRLs, there are only a few classification studies based on the ZTF DR2 (Chen et al. 2020; Cheung et al. 2021) and ZTF DR3 (Huang & Koposov 2022), despite the fact that ZTF data releases have advanced beyond DR20. There are likely to be numerous potential RRLs waiting to be discovered.
Metallicity is an important parameter for RRLs, and serves as a probe of the early chemical-evolution and formation history of our Galaxy. To derive [Fe/H] for RRLs, several spectroscopic methods have been developed. The most accurate method involves analyzing high-resolution spectra observed at certain phases (e.g., Sneden et al. 2011; Pancino et al. 2015; Gilligan et al. 2021), but this is inefficient in terms of precious high-resolution spectroscopic observation time and resources. The S method, originally proposed by Preston (1959), is applicable to low-to-moderate dispersion spectra (e.g., Butler 1975; Walker & Terndrup 1991; Layden 1994), but it may lead to unexpected random and systematic errors in some cases where the S index and [Fe/H] have a nonlinear scale relation. Liu et al. (2020, hereafter L20) employed a novel template-matching method, deriving metallicities for more than 5000 RRLs down to [Fe/H] , with a typical uncertainty of 0.2 dex, based on extensive low-resolution spectroscopic surveys. Recently, Wang et al. (2024) employed similar approach, deriving metallicities for approximately 11,500 RR Lyrae stars with comparable uncertainty. However, due to limitations on depth and potential selection effects from spectroscopic surveys, these methods still only provide metallicity estimates for a small fraction of recognized RRLs.
For the above reasons, the correlation between morphological light-curve characteristics and metallicity, discovered by Clement et al. (1992, 1993), Kovács & Zsoldos (1995), and Jurcsik & Kovács (1996), has been explored and refined in many photometric systems through subsequent observational and theoretical work (e.g., Smolec 2005; Nemec et al. 2013; Ngeow et al. 2016; Jurcsik & Hajdu 2023), and offers a more straightforward and cost-effective way to obtain [Fe/H] estimates. Recently, Li et al. (2023, hearafter Li23) calibrated a new period-Fourier parameters-[Fe/H] relation in the Gaia photometric system, deriving photometric metallicities for more than 130,000 RRLs using Fourier parameters from the Gaia RRL catalog with a typical uncertainty similar to that of low-resolution spectroscopic results. Recent studies employing machine learning or deep learning methods have also demonstrated improved performance in estimating [Fe/H] (e.g., Hajdu et al., 2018; Dékány et al., 2021; Dékány & Grebel, 2022; Muraveva et al., 2024; Monti et al., 2024). Moreover, establishing a new relationship using the ZTF photometric system will allow us to obtain metallicity estimates for a larger number of RRLs, particularly as future ZTF data releases are expected to uncover numerous additional RRLs.
Since RRLs serve as excellent standard candles, extensive research has been conducted to calibrate the PMZ relation across various photometric systems. With the advent of large-scale infrared missions, the PMZ relations have been well established in the -bands and -bands, achieving excellent precision, at the level of few percent (e.g., Bono et al. 2003; Catelan et al. 2004; Muraveva et al. 2015, 2018; Bhardwaj et al. 2021b; Mullen et al. 2023). For the optical bands, the relations are also well-established in various filters, such as the - and Gaia -bands (e.g., Caputo et al. 2000; Bono et al. 2003; Braga et al. 2015; Muraveva et al. 2015, 2018; Bhardwaj 2022; Li et al. 2023). To further mitigate the impact of extinction on distance estimates from the PMZ relation, the Period-Wesenheit-Metallicity (PWZ) relation was developed. It builds upon multi-band PMZ calibrations by incorporating the Wesenheit magnitude—an extinction-free parameter constructed from multi-band magnitude combinations (e.g., Madore 1982; Madore & Freedman 1991). This refinement provides an extinction-independent calibration, enabling more precise distance measurements, particularly in high-extinction regions. Similar to the PMZ relations, the PWZ relation has been rigorously calibrated across various photometric systems, spanning optical (, Gaia , , ) to infrared (, ) bands, achieving comparable precision levels (e.g., Neeley et al. 2019; Garofalo et al. 2022; Mullen et al. 2023; Zgirski et al. 2023). However, calibration efforts for both the PMZ and PWZ relations using Sloan or Sloan-like filters remain limited, with only a few studies (e.g., Sesar et al. 2017; Vivas et al. 2017; Bhardwaj et al. 2021a) focusing on specific globular clusters, or relying on small samples of globular clusters (GCs) that require further refinement. Recently, Ngeow et al. (2022) calibrated the PMZ relation using 755 RRLs from 46 globular clusters observed with the ZTF, and derived a PWZ relation from the same dataset. However, such relations, based on member stars of globular clusters, may face several issues: 1) photometric blending due to crowded fields; 2) the presence of multiple populations of varying metallicity; and 3) a limited number of calibrators, leading to sparse parameter coverage. Therefore, similar calibrations with field RRLs is important and necessary.
In this study, we have collected photometric data from ZTF for over 70,000 RRLs. From this sample, approximately 4,100 RRLs with precise metallicity estimates were selected based on the updated catalog of L20. By combining these metallicities with the derived ZTF parameters (, , , and ), we have calibrated the relations for RRab stars and relations for RRc stars in the ZTF -bands, respectively. Then, using several hundred local RRLs with photometric-metallicity from the new relations and accurate distances from Gaia parallax measurements, we have further re-determined the PMZ and PWZ relations in the three bands for RRab and RRc stars, respectively.
The structure of this paper is as follows. In Section 2, we introduce the preprocessing of photometric data and the selection process for our samples. In Section 3, we detail the calibration of the and relations, as well as the PMZ and PWZ relations in the -bands for RRLs, and provide photometric-metallicity and distance estimates for the entire sample. Additionally, this section includes internal comparisons across different bands and comparisons with other studies. In Section 4, we provide multiple external validations for the derived photometric-metallicity and distances. Section 5 presents the final RRL catalog with descriptions. Finally, Section 6 provides a summary of this work.
2. Data and Sample
In this section, we construct two primary sample sets for this work. The first set comprises RRLs from the ZTF photometric data. We use a portion of this set to calibrate the metallicity and distance relations, which are then applied to the entire set to determine the parameters for each star. The second set includes RRLs with metallicity estimates derived from spectroscopic surveys; these stars are used to calibrate the photometric metalliciy relations. Both sample sets undergo a well-defined selection process before use, as described below.
2.1. The ZTF RRL Sample
2.1.1 Data Sources and Verification
To obtain a larger pool of usable sample stars, we integrate preliminary RRL candidates using RR Lyrae catalogs from multiple photometric surveys as follows:
-
•
The Gaia DR3 RRLs table: This table ontains 270,905 RRLs from Gaia observational data beginning in 2013. They are classified into subtypes ‘RRab’, ‘RRc’, and ‘RRd’ using multi-band (-, -, and - band) data and the Specific Objects Study (SOS) Cep&RRL pipeline (Clementini et al. 2023). Given the widespread use of these sample, we employ them as a primary source for our work.
-
•
The ZTF DR3 RRLs table: This table contains 71,755 RRLs classified by the Fourier parameters and random forest method (Huang & Koposov 2022) from the ZTF data and reported as part of the Gaia early data release 3 (EDR3). This catalog has high completeness and purity relative to the Gaia DR2 RRLs (Clementini et al. 2019), and achieves more accurate period determinations than the ZTF DR2 RRL sample (Chen et al. 2020), with 96% of the sample stars in common, thanks to the increased number of observational epochs. Since subtypes of RRL stars are not provided, we only select stars with a probability score more than 0.8 (max is 1.0) and sub-classify them visually to ensure their purity.
-
•
The ASAS-SN RRLs table: This catalog is combined from two tables from ASAS-SN data in the - (Jayasinghe et al. 2021) and - (Christy et al. 2023) bands, respectively. The -band table contains 45,060 RRL candidates with 17; a newer -band table contains 26,515 RRL candidates with 18.5. The two tables share stars in common, but the -band sample stars generally performs with higher confidence, due to the higher cadence of -band data. As before, we only select those stars with probability score more than 0.8 for both ‘RRab’ and ‘RRc’ type stars.
-
•
The PS1 RRLs table: This table contains 239,044 RRLs classified by template-fitting techniques and a machine learning algorithm (Sesar et al. 2017) from the sparse, asynchronous multi-band PS1 3 survey, which probes deeper than ZTF, with similar sky coverage. In this table, the subtypes for each sample are provided with ‘RRab’ and ‘RRc’ final classification scores. Note that sum of the two scores is not equal to 1.0 because of RRd stars participating in the training process.
We combine these tables to pre-select RRLs. Given the critical role of period determination and the re-calculation method described in Section 2.1.2, we adopt the catalog-reported periods as initial values. For sources appearing in multiple catalogs, we prioritize the most reliable period based on catalog credibility, following this descending hierarchy: Gaia, ZTF, ASAS-SN, and PS1. This ranking reflects the relative accuracy of period measurements, which depends primarily on photometric precision and sampling cadence. Gaia is assigned the highest priority due to its superior photometric precision and moderate sampling cadence (40 epochs on average). ZTF and ASAS-SN follow, as they provide an order-of-magnitude higher sampling while maintaining sufficient photometric quality. PS1 is given the lowest priority due to its sparse observational cadence (12 epochs over 4.5 years). Moreover, visual inspection of the light curves indicates that this low cadence not only reduces the reliability of period determination, but also results in a high contamination rate from eclipsing binaries (EBs). To mitigate this contamination, we remove potential EBs from the combined table using EB catalogs from Gaia, ZTF, and OGLE (Mowlavi et al. 2023; Chen et al. 2020; Soszyński et al. 2016b), finding that 37% of PS1 RR Lyrae candidates are actually EBs. In the following sections, we apply stricter selection criteria to further exclude other contaminants, ultimately constructing a high-purity, high-quality sample.
Finally, considering the photometric quality of the ZTF data, we have only downloaded the light curves in the -bands for those candidates that have more than 50 high-quality photometric observation epochs (catflags0) (Masci et al. 2018).
2.1.2 Period Re-calculation
The period is a critical feature in light-curve analysis. However, the accuracy of period determination is influenced by the sampling cadence, and for ground-based surveys like ZTF and ASAS-SN, aliased periods may also occur due to the limited observational window (e.g., as discussed in Chen et al. 2020). To minimize the presence of aliased periods and ensure consistency in periods derived from the -bands, we fine-tune the initial period values within 0.001 days using the Generalized Lomb-Scargle algorithm (GLS; Lomb 1976; Scargle 1982; Ferraz-Mello 1981; Zechmeister & Kürster 2009). Subsequently, we select sample stars with correct periods based on the constraints of false-alarm probability and manual inspection of phase-folded light curves. For sample stars with ambiguous light variations, we expand the period search range to the typical theoretical range of RRLs: 0.2 to 1 day for type RRab stars, and 0.2 to 0.6 day for type RRc stars, and then once again employ the GLS to identify the correct period. After this round of screening and elimination, we exclude a portion of the non-RRLs, retaining only those stars with accurate periods.
In order to minimize contamination, all light curves in our sample have undergone manual inspection, and candidates primarily consisting of EBs and RRd have been excluded. Due to the absence or unreliability of classification scores in ZTF DR3 and PS1, we manually classified these sample stars into RRab and RRc types. These sample stars undergo a more refined selection and labeling in Section 2.1.3.
2.1.3 Fourier Decomposition, Filtering, and Labeling
Fourier decomposition parameters can parametrically represent the morphological light-curve characteristics, playing a crucial role in obtaining the physical parameters of variable stars, particularly for RRLs. Using the decomposition equation:
| (1) |
we employ the known periods () and the lcfit package by Dekany (2022), followed by a Gaussian Process Regression (GPR) of the phase-folded light curves, to derive the key parameters for the three bands, including mean magnitude (), peak-to-peak amplitude (), amplitude ratios (), phase differences (), and their errors. Furthermore, phase coverage (Phcov) and signal-to-noise ratio (SNR) are also output as indicators to evaluate the distribution and fitting quality of the photometric points in the light curve. Additionally, we introduce the standard deviation of residuals (Rstdev) as a new metric. Detailed descriptions of these indicators are presented in Table B.1.
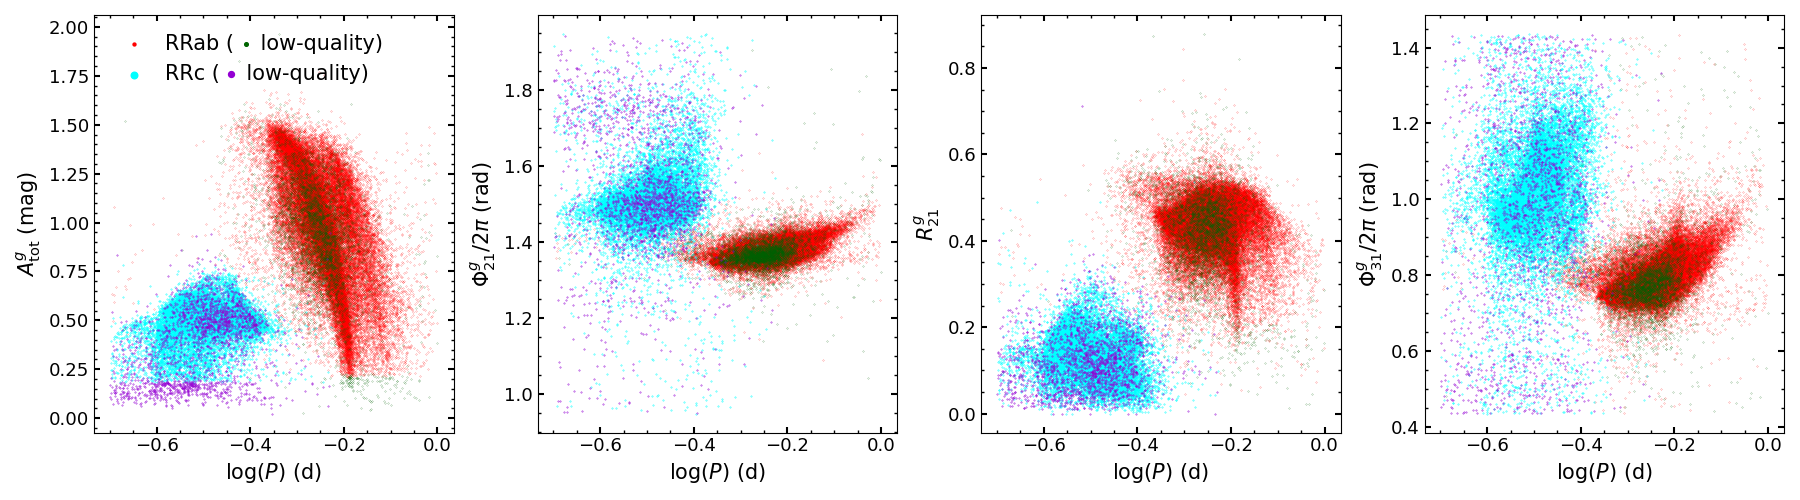
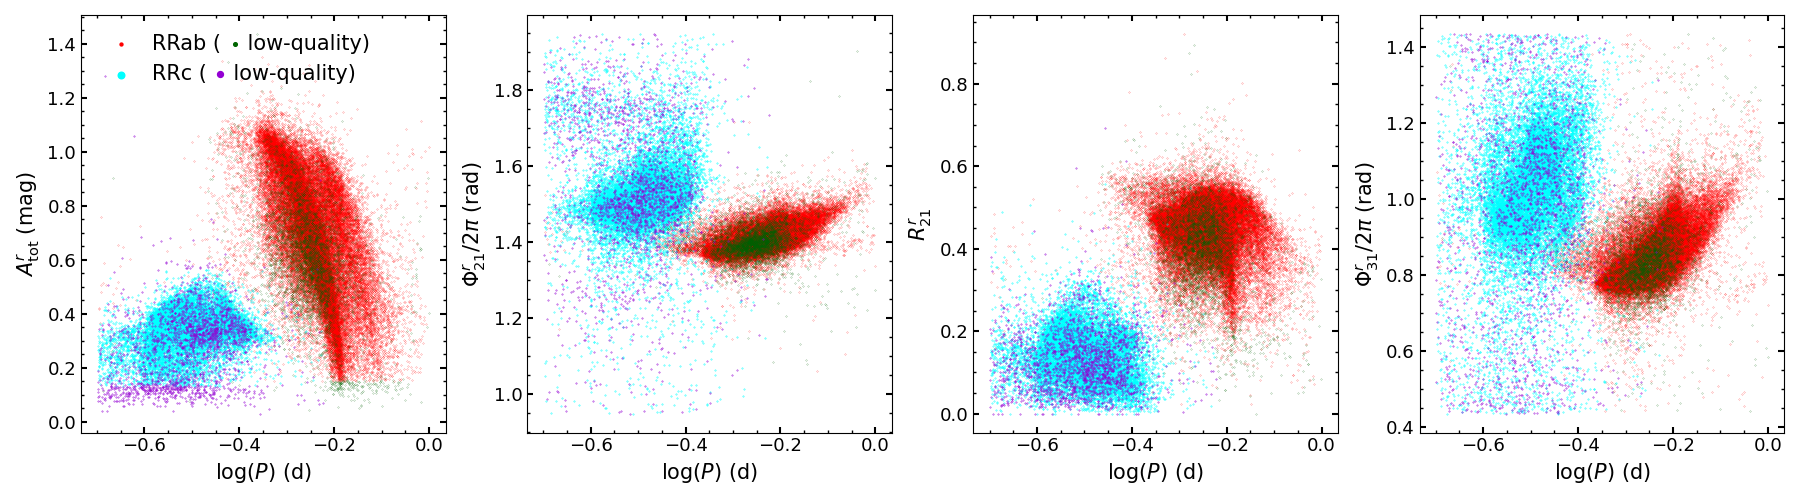
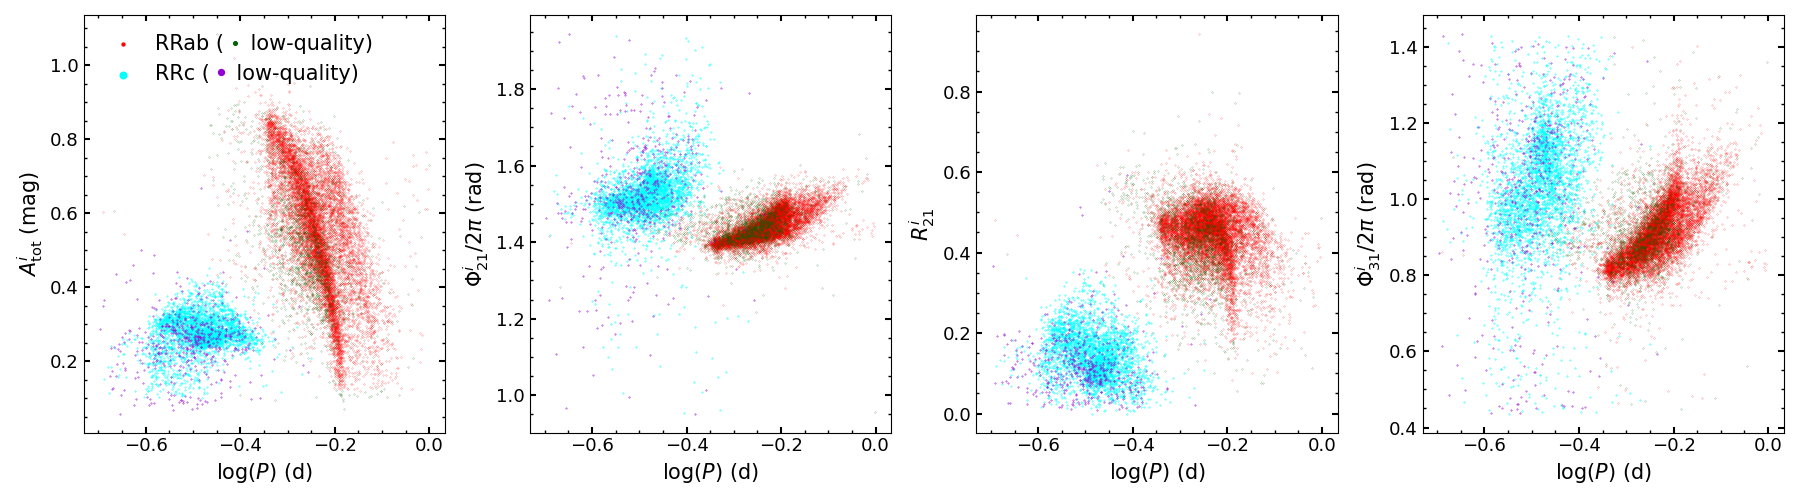
Based on the parameters obtained, we further filtered the data to yield a high-quality sample set. Finally, we obtained a total of 73,796 sample stars (52,572 type RRab and 21,224 type RRc stars; hereafter the ZTF_RRL_ALL sample) after applying the following cuts: i) Phocv 0.9; ii) SNR 50; iii) 0.2 d1 d for RRab or 0.2 d 0.6 d for RRc stars. The distribution diagrams of the Fourier parameters in the -band with best period (i.e., the mean of period in -bands; referred to as ‘period’ below if the band is not specified) are shown in Figure 1; similar distributions for the - and -bands are shown in Appendix Figure A.1 and Figure A.2. We then derive the physical parameters of these sample stars.
Furthermore, we labeled relatively low-quality sample stars with potentially problematic light curves in some bands, partially following the method discussed in Ngeow et al. (2022). In detail, they introduced several flags to label low-quality RRL stars based on light curves. For example, the ’A’ flag designates outliers in the distribution of amplitudes across the -bands, as well as amplitude ratios in band pairs; the ’C’ flag marks outliers in the period-color and period-extinction-free Q-index (; represents the mean magnitude of sample stars) relations. Following their method, we first labeled outlier sample stars with ’A’ flags based on minimum-maximum amplitude cuts in the -bands (cut values referenced from Ngeow et al. 2022, Figure 3) and the iterative 3 clipping of amplitude ratios across different band pairs. Then, we labeled outliers with ’C’ flags solely based on the period- relation, where the extinction coefficient provided by Wang & Chen (2019) was used to calculate 1.443. We have introduced a new ’D’ flag to identify excessive dispersion in the residuals of fitting light curves, as indicated by the Rstdev value. Sample stars are labeled with ’D’ flags when Rstdev exceeds 0.15/0.10 in the -band and 0.12/0.08 in the -band for type RRab and RRc stars, respectively. Finally, we marked 6645 (4420 type RRab, 2225 type RRc) outlier sample stars that have one or more flags. Because these stars may be affected by blending and other photometric problems, they are excluded for calibrating photometric-metallicity and absolute-magnitude relations. The remaining sample is referred to as the ZTF_RRL_FIT sample in the following. The Fourier parameters catalog for ZTF_RRL_ALL sample is accessible on Zenodo11110.5281/zenodo.14561442 and a description of the columns is shown in in Table B.1. Additionally, we provide a master table (Table 1) summarizing all samples and subsamples in this work, including their abbreviations and descriptions, for consolidated reference.
| Abbreviation | Description |
|---|---|
| ZTF_RRL_ALL | All sample stars |
| ZTF_RRL_FIT | Sample stars used for the subsequent calibration process |
| ZTF_RRL_FIT_META | Calibration sample stars used for the photometric-metallicity relation |
| ZTF_RRL_FIT_DIS1 | Calibration sample stars used for the PMZ relation |
| ZTF_RRL_FIT_DIS2 | Calibration sample stars used for the PWZ relation |
2.2. Spectroscopy-based Metallicity Sample
To calibrate the Fourier parameters[Fe/H] relations in the -bands (Section 3.1), we select the sample by cross-matching the ZTF_RRL_FIT sample with the updated spectroscopic sample of 10,916 RRLs from L20, using the following criteria:
-
•
The spectral signal-to-noise ratios of the sample must be greater than 20. This cut balances the need to retain a sufficient number of stars for calibration while ensuring high-quality spectra for precise [Fe/H] estimates.
-
•
The measurement errors of [Fe/H] for the sample must be smaller than 0.15 dex for both RRab and RRc stars.
-
•
The difference in period between our results and the reference period from L20 must be smaller than 0.001 day.
-
•
The measurement error of must be smaller than 0.5 rad, and the measurement error of must be smaller than 0.06 for both type RRab and RRc stars, except for the i-band of RRc. Given the limited RRc sample in the -band, the measurement errors of is set to 0.1.
Finally, we select 2875 RRab stars and 1182 RRc stars for the calibration, hereafter referred to as the ZTF_RRL_FIT_META sample. The initial numbers of sample stars to be fitted in different bands are shown as N in Table 2.
3. Photometric Estimation of Metallicity and Distance
In this section, we calibrate the period-Fourier parameters-metallicity ([Fe/H]) relations in the -bands for RRab and RRc stars using the ZTF_RRL_FIT_META sample described previously. Accurate measurements of period and Fourier parameters, particularly and , enable the derivation of metallicities for stars in the ZTF_RRL_ALL sample. Furthermore, employing local RRLs with precise distances from Gaia parallax measurements and the photometric metallicities determined here, we construct the PMZ and PWZ relations for RRLs in the -bands. These relations facilitate the calculation of absolute magnitude and distance for the entire sample of stars with photometric-metallicity estimates.
3.1. Metallicity
In the ongoing development of photometric-metallicity estimators, our work builds upon Dékány et al. (2021), who extensively explored the significance of Fourier parameters and their combined effects. This foundation has enabled us to establish an estimator for photometric-metallicity using ZTF data.
Based on Dékány et al. (2021), and our follow-up tests, we construct linear models for RRab and RRc stars across the -bands. For RRab stars, the models are parameterized by , , and . In the case of RRc stars, is further separated into and . The models are expressed as follows:
| (2) |
| (3) |
where [Fe/H] is the spectroscopic metallicity estimated by L20, and ( = 0, …, 4) are the fitting coefficients. Note that, although Dékány et al. (2021) recommended using for RRab stars, we have chosen to use instead. This decision was based on ’s superior performance in the actual fitting process. For RRc stars, the parameters used are in agreement with expectations from Dékány et al. (2021).
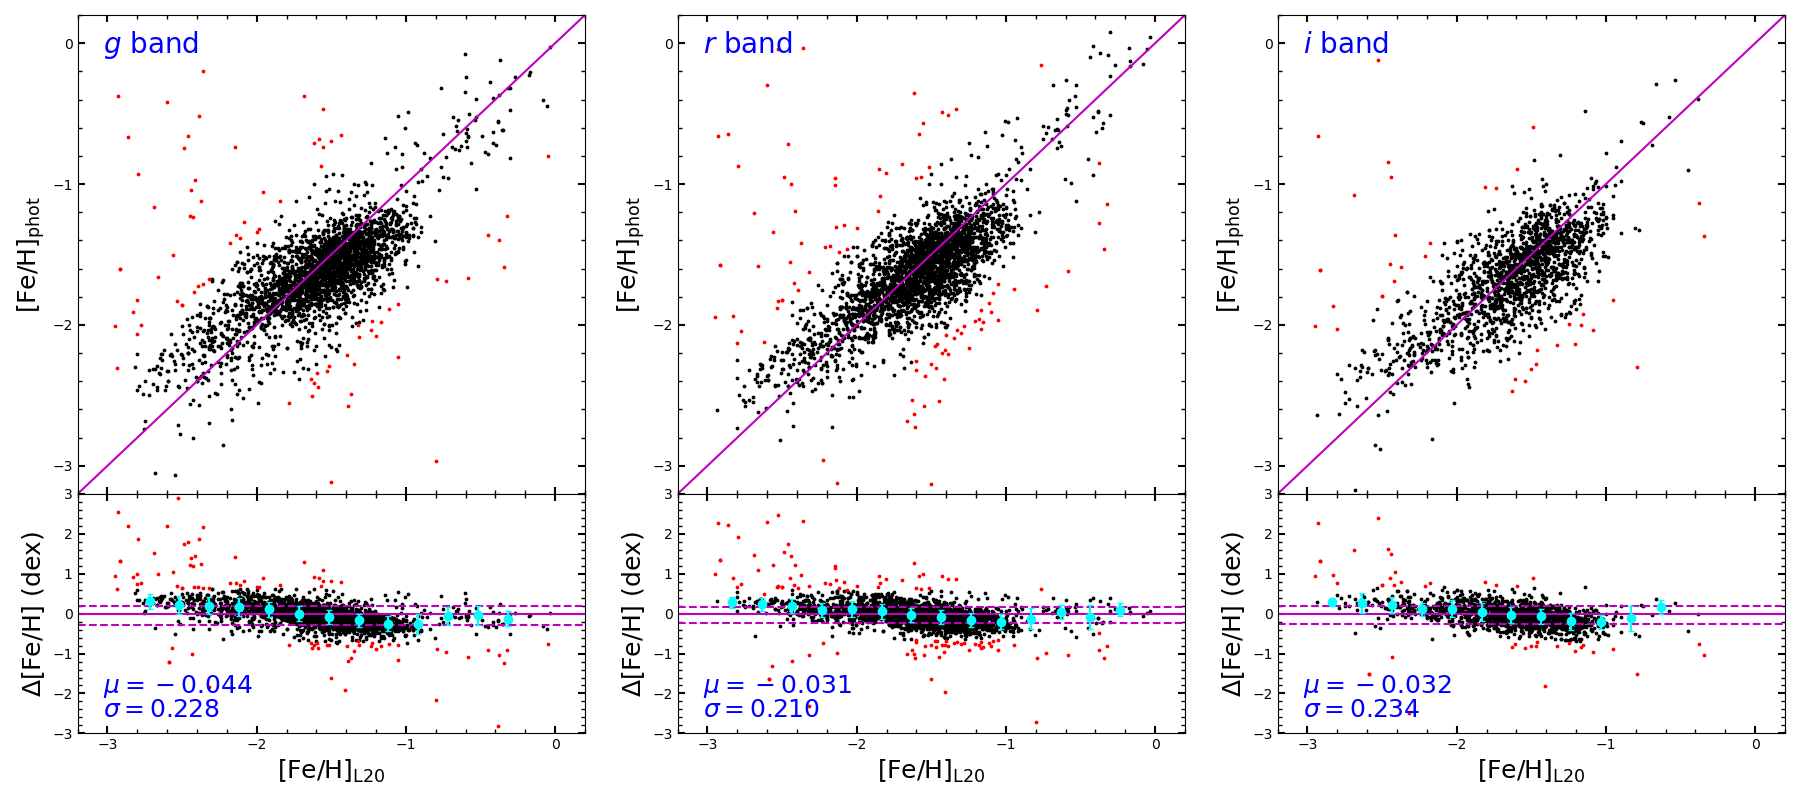
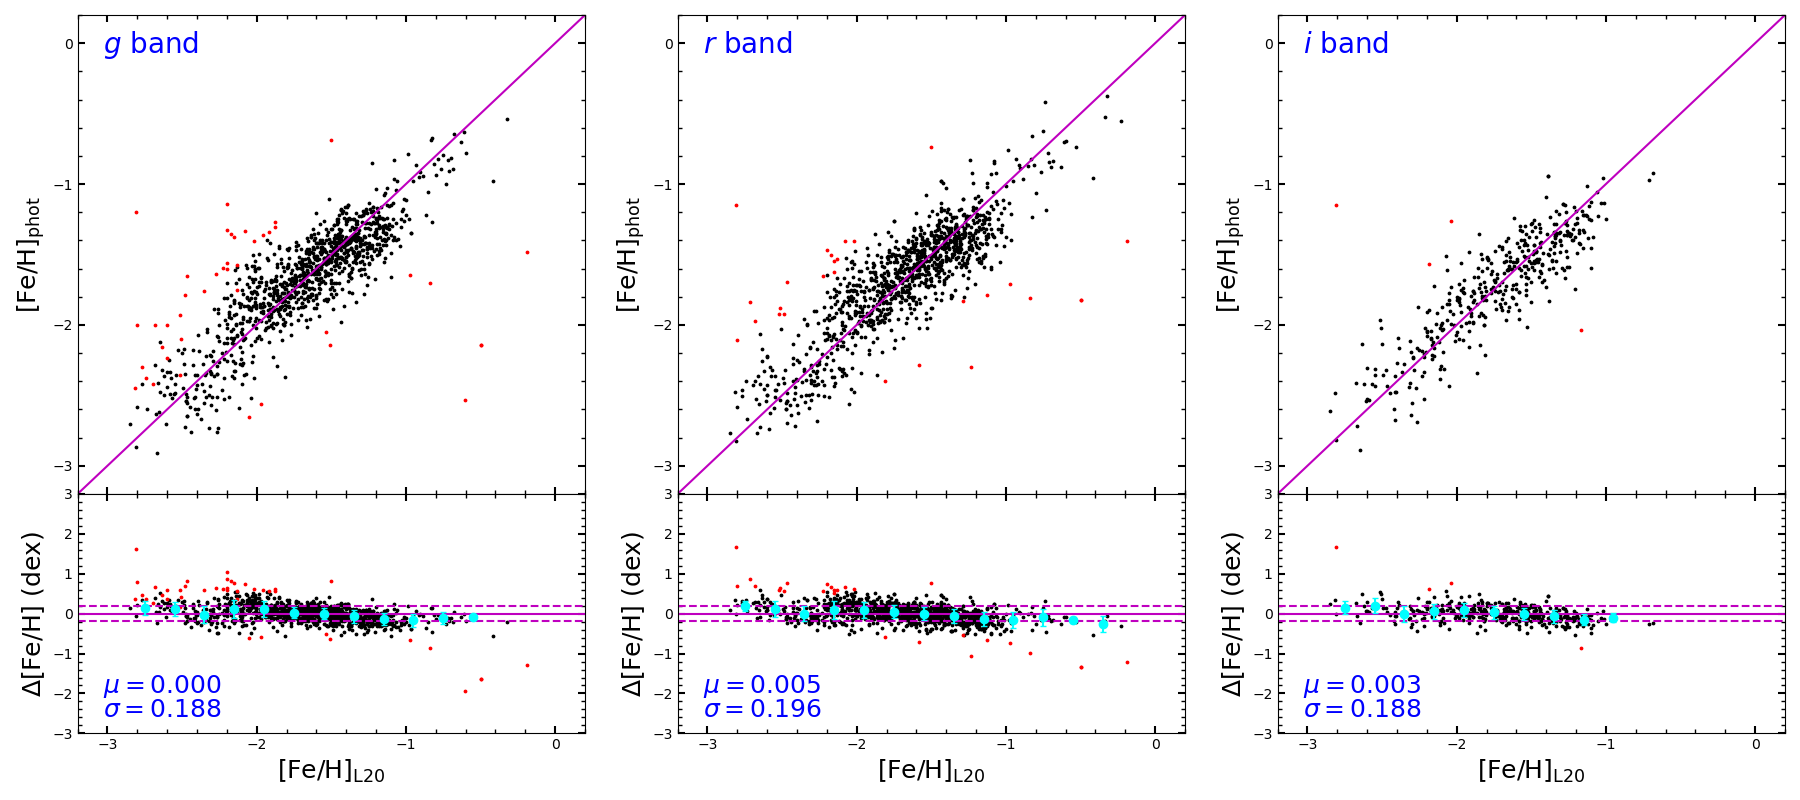
The metallicity distribution in the ZTF_RRL_FIT_META sample is non-uniform, with a primary concentration between [Fe/H] to , a tail extending toward lower metallicity, and a smaller, distinct group at the metal-rich end, as shown in Figures 2 and 3. The clustering and metal-poor tail correspond to the well-known Oosterhoff dichotomy of RR Lyrae stars (Oosterhoff, 1939; Arp, 1955; Preston, 1959), likely arising from a complex interplay between stellar and Galactic evolution (e.g., Zhang et al., 2023). Meanwhile, the rare metal-rich RRLs ([Fe/H] ) remain an open question, with hypotheses suggesting origins via binary evolution (e.g., Karczmarek et al., 2017; Bobrick et al., 2024) or accretion from nearby galaxies (e.g., Feuillet et al., 2022). To minimize the impact of this uneven sampling distribution on the fitting process, we employed a weighted fitting method based on the sample’s density, as suggested by the works of Dékány et al. (2021) and Li et al. (2023). Briefly, the weight () for each star is determined by the normalized Gaussian kernel density () derived from the metallicity distribution. An empirical density threshold value, , divides the sample into two parts: stars from the portion with density greater than are assigned , while the other portion retains a constant value . The value of is set to 0.2 for both RRab and RRc stars. The fitted coefficients for the -bands are presented in Table 2, following an iterative 3 clipping and weighted fitting procedure. A comparison of metallicity estimates from L20 and our photometric estimator is shown in Figure 2 (RRab) and Figure 3 (RRc), with the -band results displayed from left to right.
The bias and scatter of the fitting results are listed in Table 2. For RRab stars, the estimator exhibits a minor bias of 0.030.04 dex and a scatter of 0.210.23 dex across different bands, which is comparable to Li23’s findings of 0.24 dex. In the case of RRc stars, there is a negligible bias with comparable scatter of 0.190.20 dex, again in line with Li23’s result of 0.19 dex. However, upon binning the sample, a mild bias is evident at the metal-poor end and around [Fe/H] = 1, particularly for RRab stars, despite the substantial weights allocated to these regions. This bias is a common challenge in the calibration of unevenly sampled data, and is also observed in similar studies (e.g., Dékány et al. 2021; Dékány & Grebel 2022; Li et al. 2023). An increased number of metal-rich and extremely metal-poor stars in future studies is expected to reduce biases in the calibration caused by sample diversity.
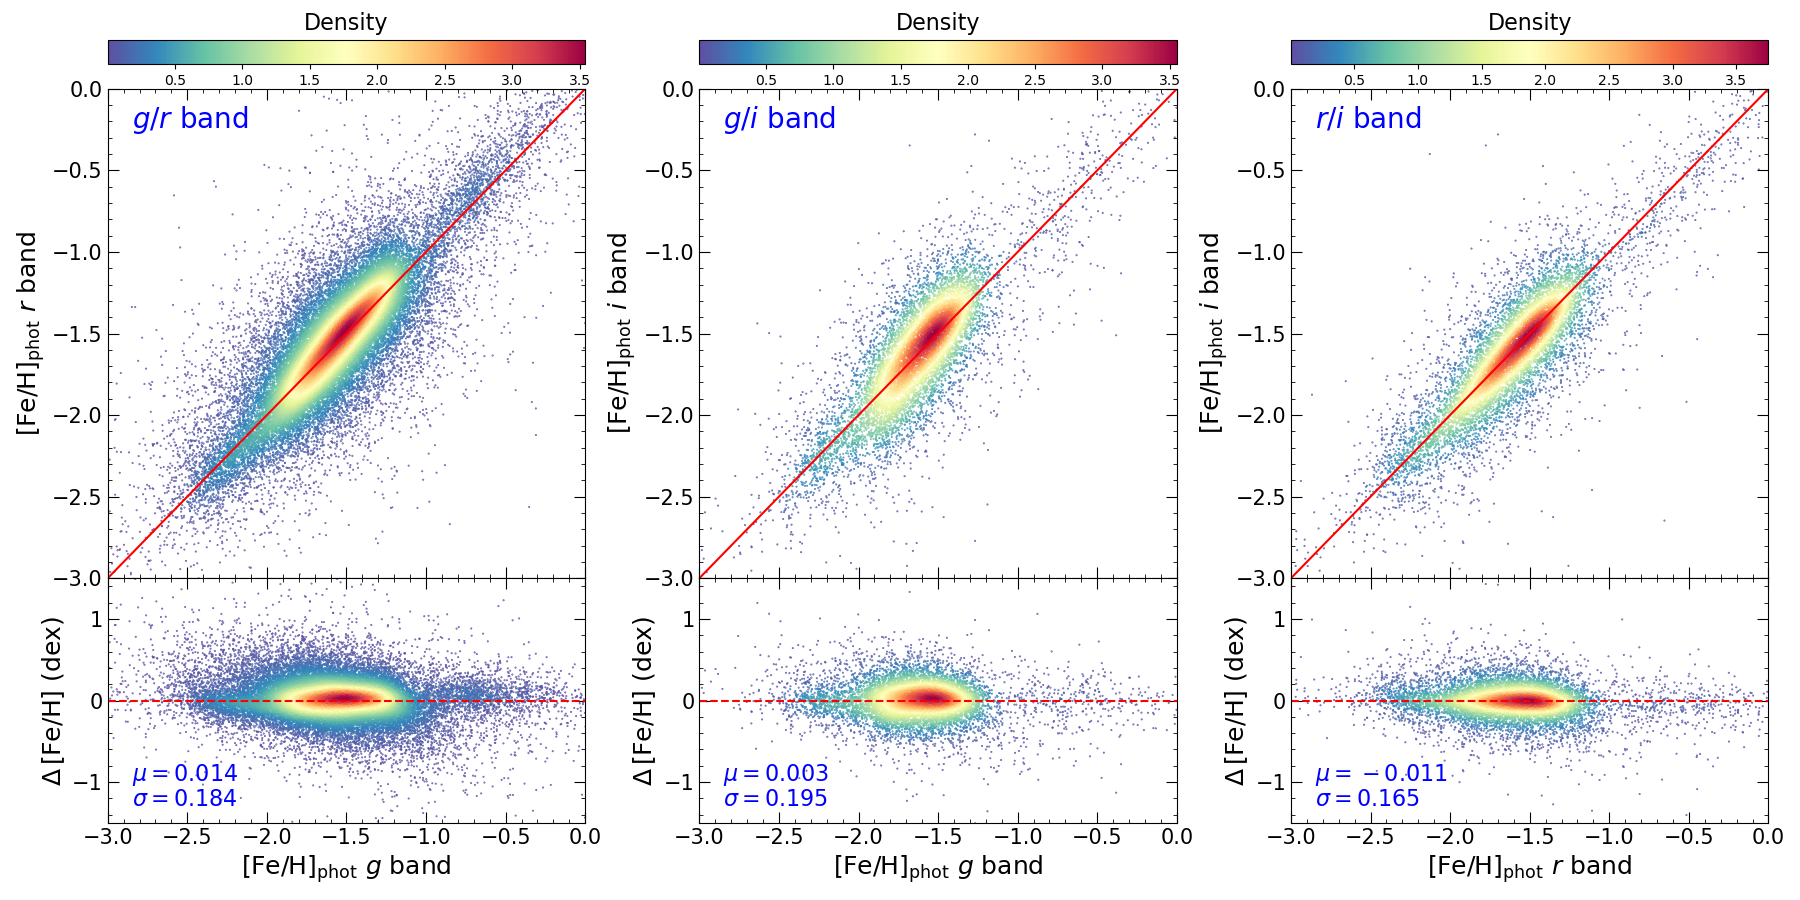
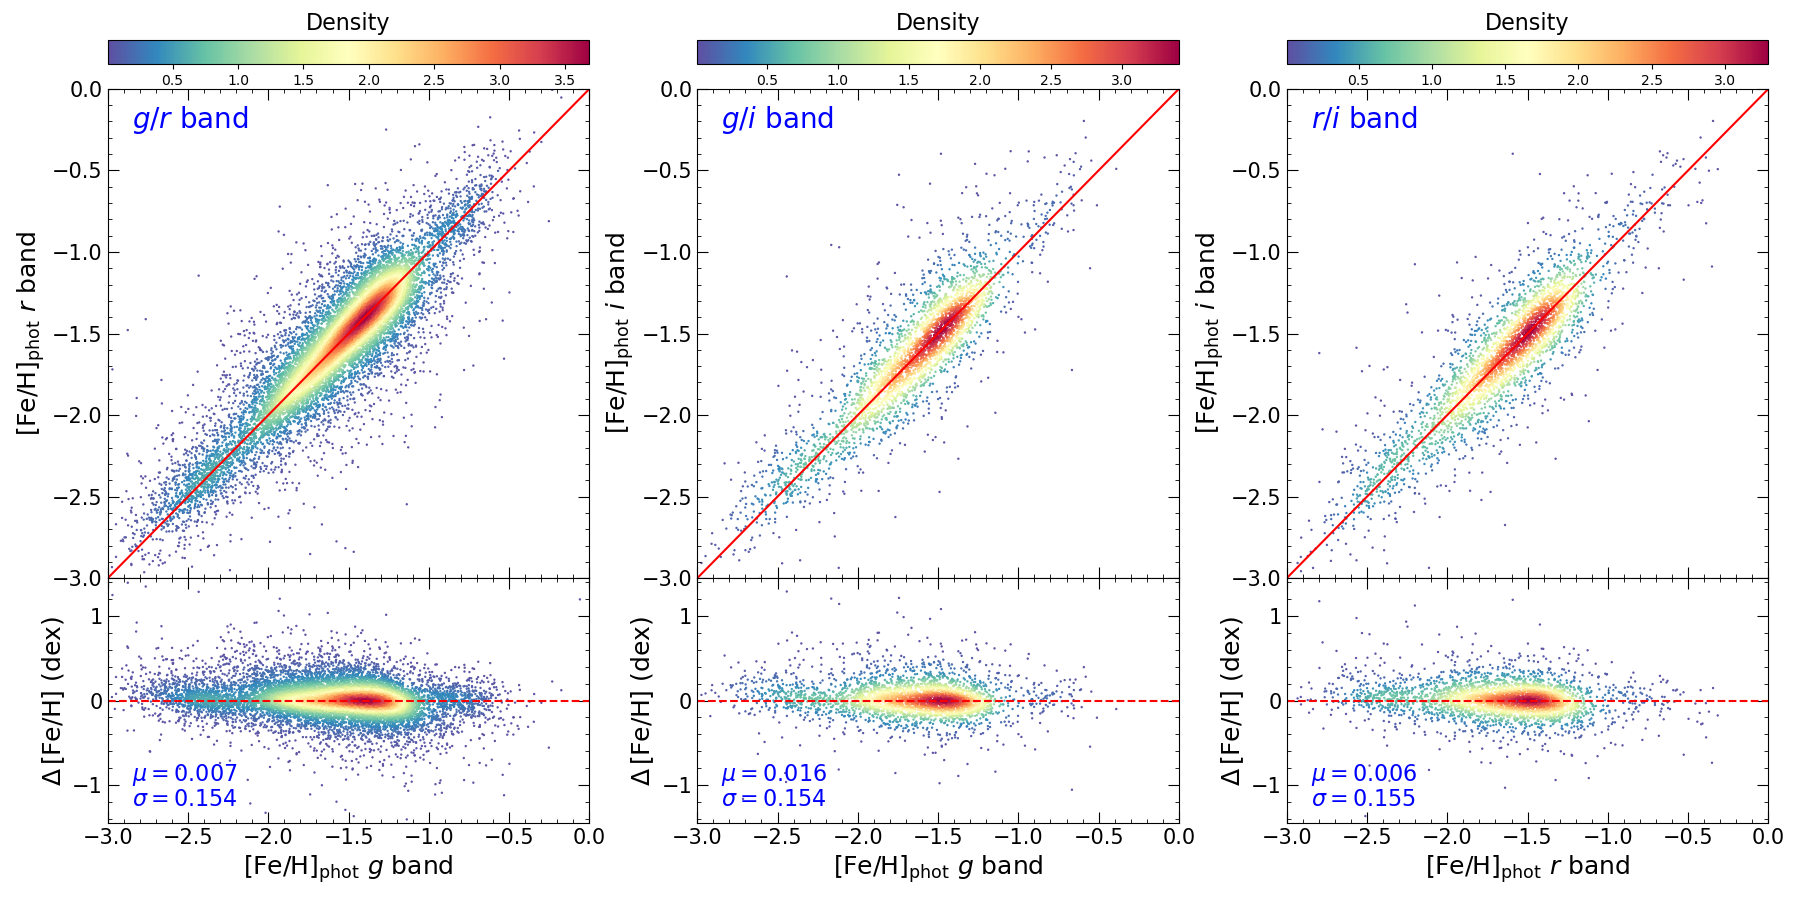
Using the established relations, we calculated the photometric metallicities for the ZTF_RRL_ALL sample across the -bands. We conducted internal comparisons of [Fe/H] values from the three bands, as illustrated in Appendix Figure A.3 (RRab) and Figure A.4 (RRc). Given the slight deviations across bands, we utilized a weighted average approach to ascertain the metallicity ([Fe/H]_weig_TW), with weights determined by the inverse square of the uncertainty in metal abundance for each band. This uncertainty stems from both random errors in the Fourier parameters and fitting-coefficient errors, estimated via 1000 Monte Carlo (MC) simulations, as well as methodological errors across bands. Ultimately, we estimated metallicities for 73,795 RRLs (52,571 RRab and 21,224 RRc stars), which is only one star less than the ZTF_RRL_ALL sample, due to the exclusion of abnormal values equal to zero.
| Band | NNini | |||||||
| RRab | ||||||||
| … | 0.228 | 2681/2768 | ||||||
| … | 0.210 | 2738/2844 | ||||||
| … | 0.234 | 1581/1624 | ||||||
| RRc | ||||||||
| 0.000 | 0.188 | 1051/1094 | ||||||
| 0.005 | 0.196 | 1070/1097 | ||||||
| 0.188 | 407/411 | |||||||
3.2. Distance
Utilizing precise distances from Gaia parallax measurements and photometric-metallicity estimates from this study, we calibrate the PMZ relation in the -bands using local RRLs. Additionally, we calibrate the PWZ relations, accounting for the significant effects of extinction, as described in Subsection 3.2.2.
3.2.1 The PMZ Relations
We select the calibration sample by cross-matching the ZTF_RRL_FIT sample with Gaia DR3 data, based on the following selection criteria:
-
•
The RRLs must exhibit parallaxes greater than 0.2 mas (about 5 kpc), and have relative parallax errors less than 10%
-
•
The RRLs, whether of type RRab or RRc, must be located in high-latitude regions with , and the value of must be less than 0.1 mag according to Schlegel et al. (1998, hereafter SFD98)
-
•
The errors of the photometric metallicities from the -band ([Fe/H]_r_err_TW) must be less than 0.25 dex and 0.29 dex for RRab and RRc stars, respectively
The first two criteria ensure accurate determination of absolute magnitudes in the -bands by accounting for the precision of the distance and extinction measurements. The third criterion ensures a reliable photometric-metallicity estimate. Notably, we use -band data for the metallicity-error criterion, intentionally forgoing a multi-band weighted average. This approach ensures that lower-quality sample stars are excluded, while higher-quality ones, even if represented in fewer bands, are retained, as the multi-band weighted average error is generally smaller than the single-band error. Finally, we select 343 RRab and 173 RRc stars for the calibration exercise, hereafter referred to as the ZTF_RRL_FIT_DIS1 sample.
Prior to carrying out the calibration, we estimate the distances to these sample stars using the corrected Gaia DR3 parallaxes (Lindegren et al. 2021). These distances were derived employing the Bayesian method provided by Huang et al. (2021). Subsequently, the absolute magnitudes in the -bands for the ZTF_RRL_FIT_DIS1 sample were calculated using these distances, the mean apparent magnitudes (), and the extinction corrections from SFD98. To ensure sample quality, we set stringent error limits on the absolute magnitudes for both RRab and RRc stars. Specifically, we restricted the errors, which include contributions from distance and mean magnitude, to be less than 0.13 for the - and -bands. For the -band, the error limits were set to 0.15 for RRab stars and 0.18 for RRc stars. The remaining sample was then used to calibrate the PMZ linear relation:
| (4) |
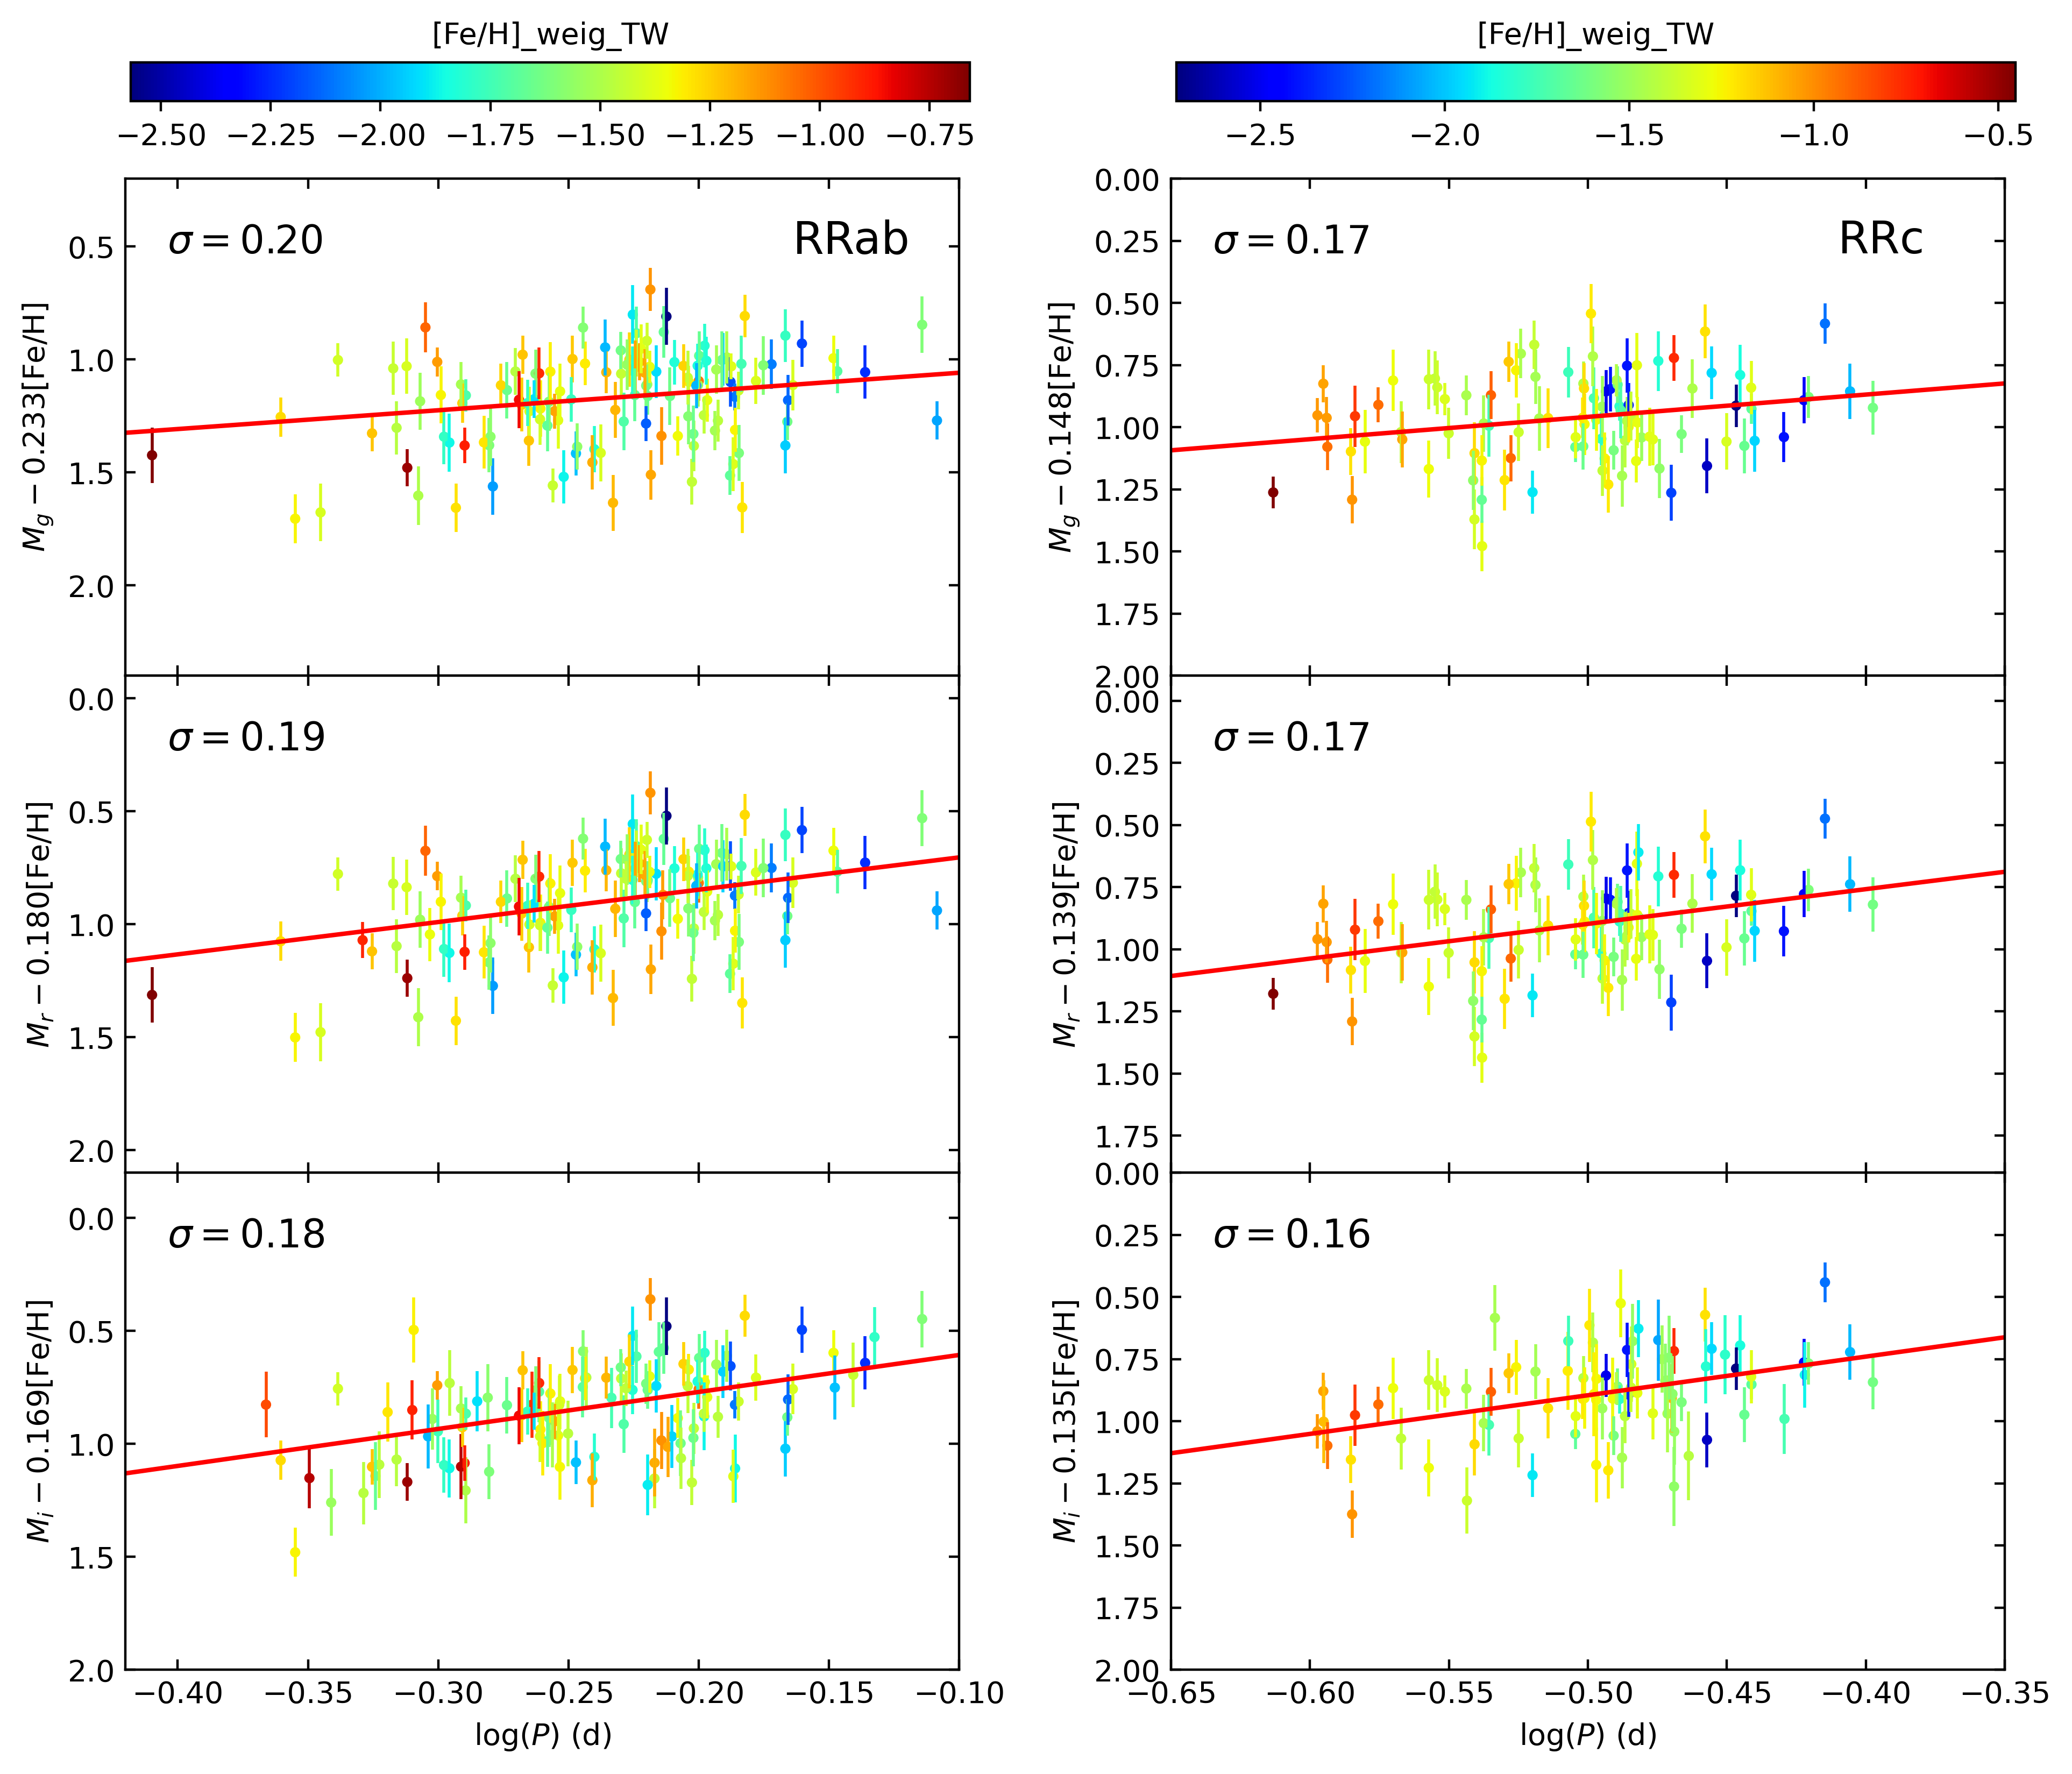
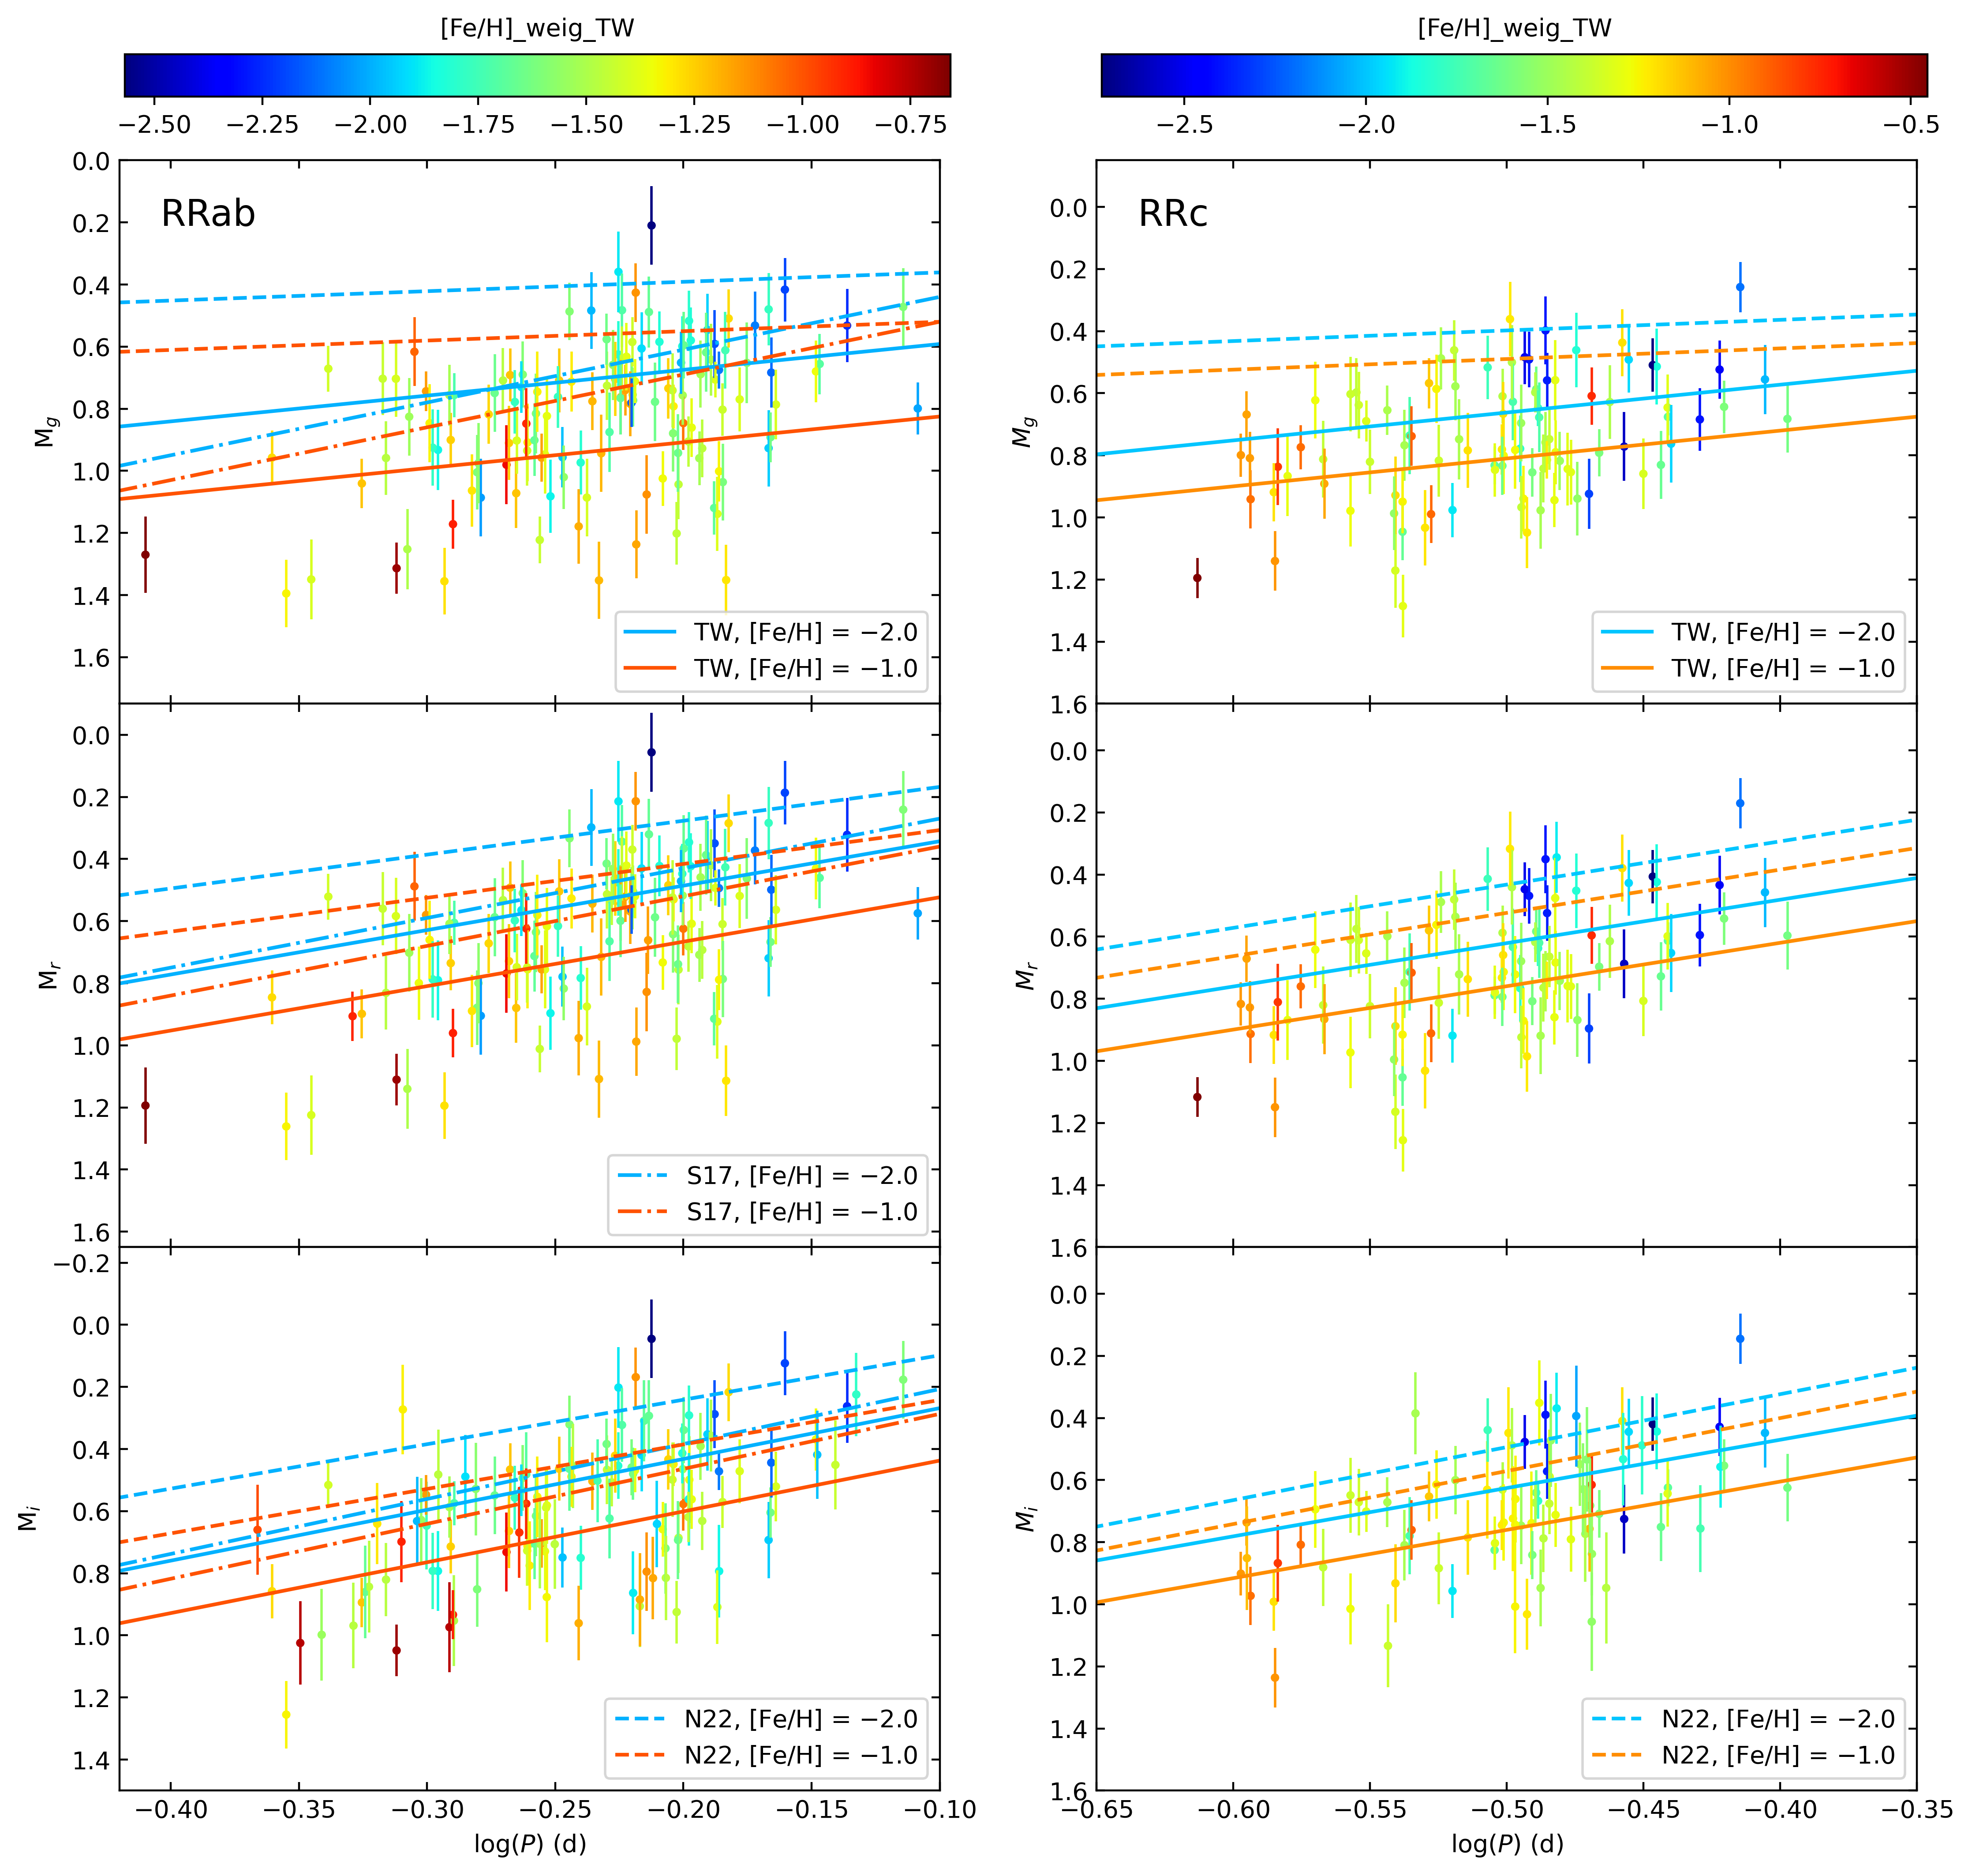
where is the logarithm of the pulsation period calculated as described above, and [Fe/H] is the photometric-metallicity estimate determined in Section 3.1. The resulting fit coefficients , , , and the number of sample stars used for calibration N in the -bands are listed in Table 3. The fits are shown in Figure 4, with the left panel for type RRab stars, and the right panel for type RRc stars.
| Nfit | |||||
| RRab | |||||
| 0.197 | 141 | ||||
| 0.189 | 145 | ||||
| 0.177 | 128 | ||||
| 0.215 | 136 | ||||
| 0.183 | 147 | ||||
| 0.190 | 152 | ||||
| RRc | |||||
| 0.170 | 99 | ||||
| 0.167 | 100 | ||||
| 0.162 | 88 | ||||
| 0.221 | 103 | ||||
| 0.172 | 96 | ||||
| 0.189 | 98 | ||||
Overall, the fits depicted in Figure 4 align with expectations based on prior observations and theoretical works (e.g., Muraveva et al. 2015; Braga et al. 2015; Sesar et al. 2017). Specifically, as the bandpass shifts towards redder wavelengths, the fit reveals an increased dependency on the period term (indicated by a larger ), a decreased reliance on metallicity (reflected in a smaller ), and a tighter PMZ relationship (indicated by a smaller ). Moreover, the RRc relation in the same band is tighter than that for RRab stars, suggesting that distance calibration relationships using RRc stars may be more precise, as discussed by Li et al. (2023). Further detailed validation concerning relative distance errors is explored in Section 4.
We also compare our results with published PMZ relations in the -bands, noting that there is relatively less research in the ZTF bands compared to others. The main previous research for comparison includes studies by Sesar et al. (2017, hereafter S17) and Ngeow et al. (2022, hereafter N22). S17 calibrated the relations using 55 RRab stars from five GCs in the PS1 photometric system, which is also used for ZTF data. N22 calibrated relations for both RRab and RRc stars, utilizing ZTF data similar to ours, focusing on 755 RRL GC members with metallicities ranging from [Fe/H] = 2.4 to 0.9. Building on these comparisons, we further analyze the dependencies on the period and metallicity terms.
To facilitate a clear comparison of slopes of the period term, we present the fitted PMZ relations at [Fe/H] = 2.0 and 1.0 in Figure 5. A distinct slope disagreement is evident in the -band between our work and S17 (2.5 for RRab), and N22 (2 and 1.4 for RRab and RRc stars, respectively), with our coefficient falling midway between them. N22 discussed the reason for the disagreement between their work and S17; in the case of a relatively consistent performance in the - and -bands, they suggest that the most likely reason is the Bayesian inference method used by S17, which employs a uniform prior for the -band period term rather than a Gaussian prior for the - and -bands.
Better confirmation comes from the agreement in the slope of the period term between S17 and our work in the - and -bands, indicating a possible susceptibility of the slope to the choice of priors. This may explain the difference in the slope of the period term for the -band among the three approaches. With the exception of the -band, the slopes of the period term exhibit better agreement with S17 for RRab stars, and are consistent with N22 for RRc stars, despite the lack of calibration from S17. Furthermore, the dependence of the metallicity term is discernible in the PMZ relations at fixed periods, as manifested by the vertical separation between lines representing different [Fe/H] levels in Figure 5. Generally, our relation shows a milder metallicity dependence than S17, which has a weak dependence, and is slightly larger than N22 (1.3 for RRab stars and 1.4 for RRc stars, on average), possibly due to the difference of the metallicity distribution.
Based on the newly constructed PMZ relations, we estimate the distances for the entire sample. For high-latitude regions with , we adopt the SFD98 map for extinction correction. To maximize the sample of available distance parameters, particularly for RRab stars within regions where , we utilize the converted absorption (AG) provided by Clementini et al. (2023, hereafter C23). These values are adjusted from the Gaia -band to the -bands according to the extinction law provided by Wang & Chen (2019). We then derived the distances for a subset of the ZTF_RRL_ALL sample with extinction values in the three bands. The uncertainty of the distances arises from two components: one is the random errors calculated through 1000 MC simulations, accounting for the uncertainty of the fit coefficients, the errors of photometric-metallicity, a fixed uncertainty of 0.05 mag for , and the absorption errors provided by C23 for some type RRab stars; the other is the methodological errors, reflected in the scatter of the PMZ relation across different bands.
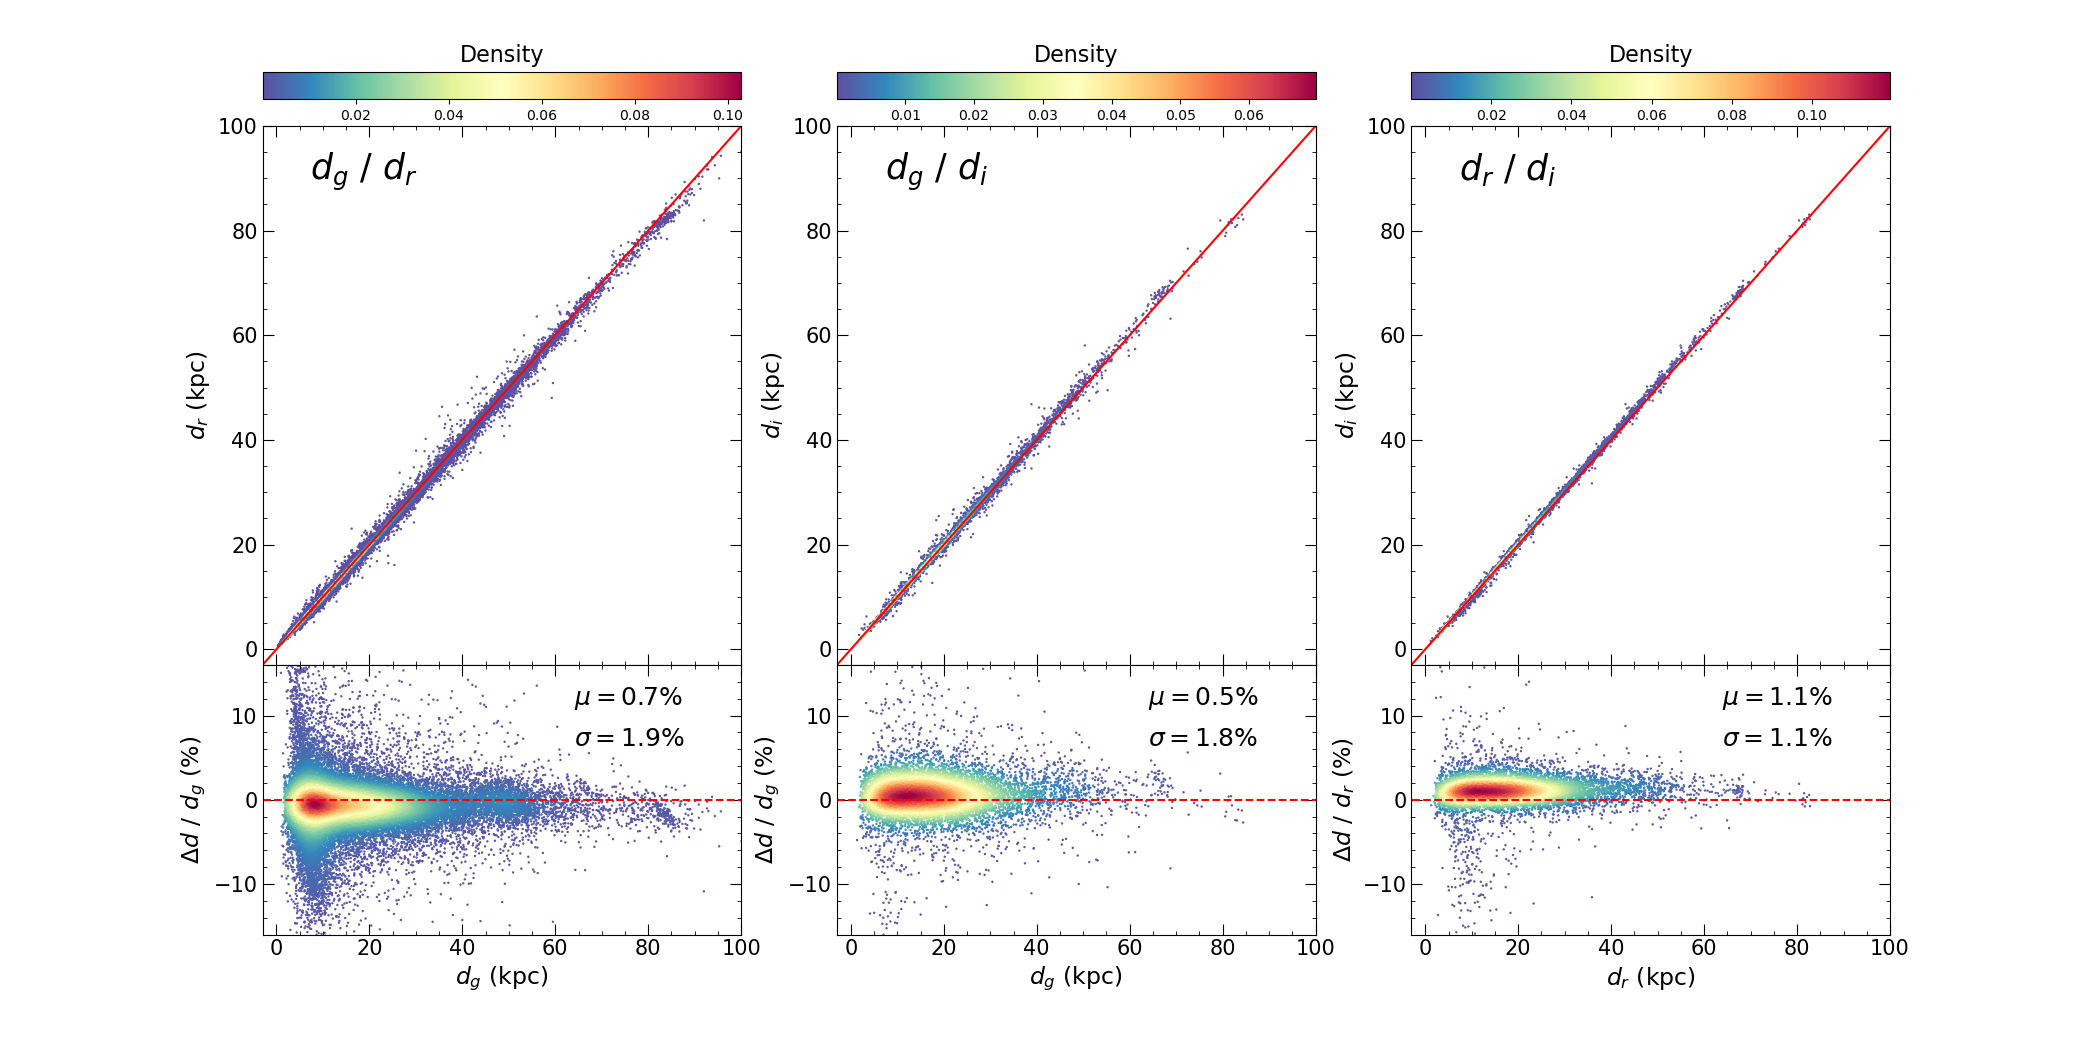
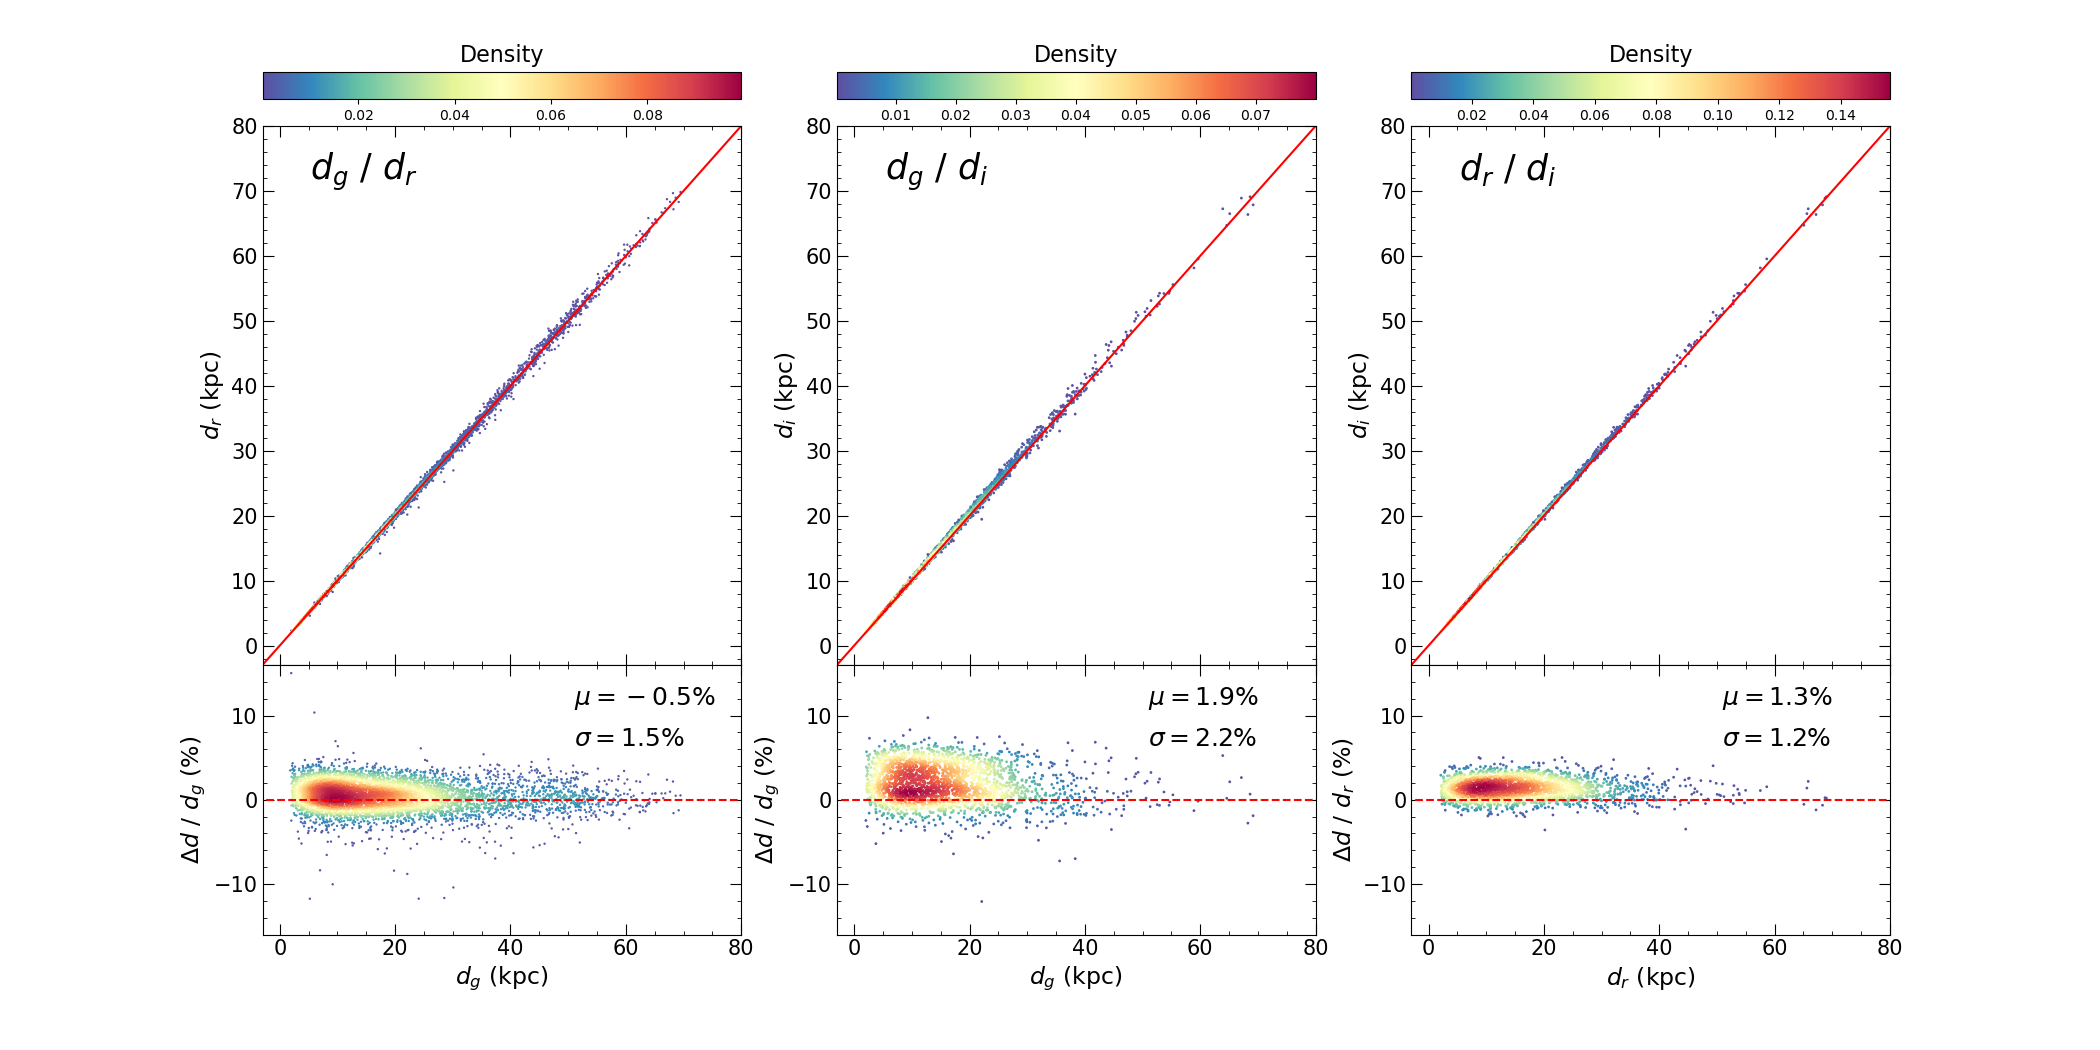
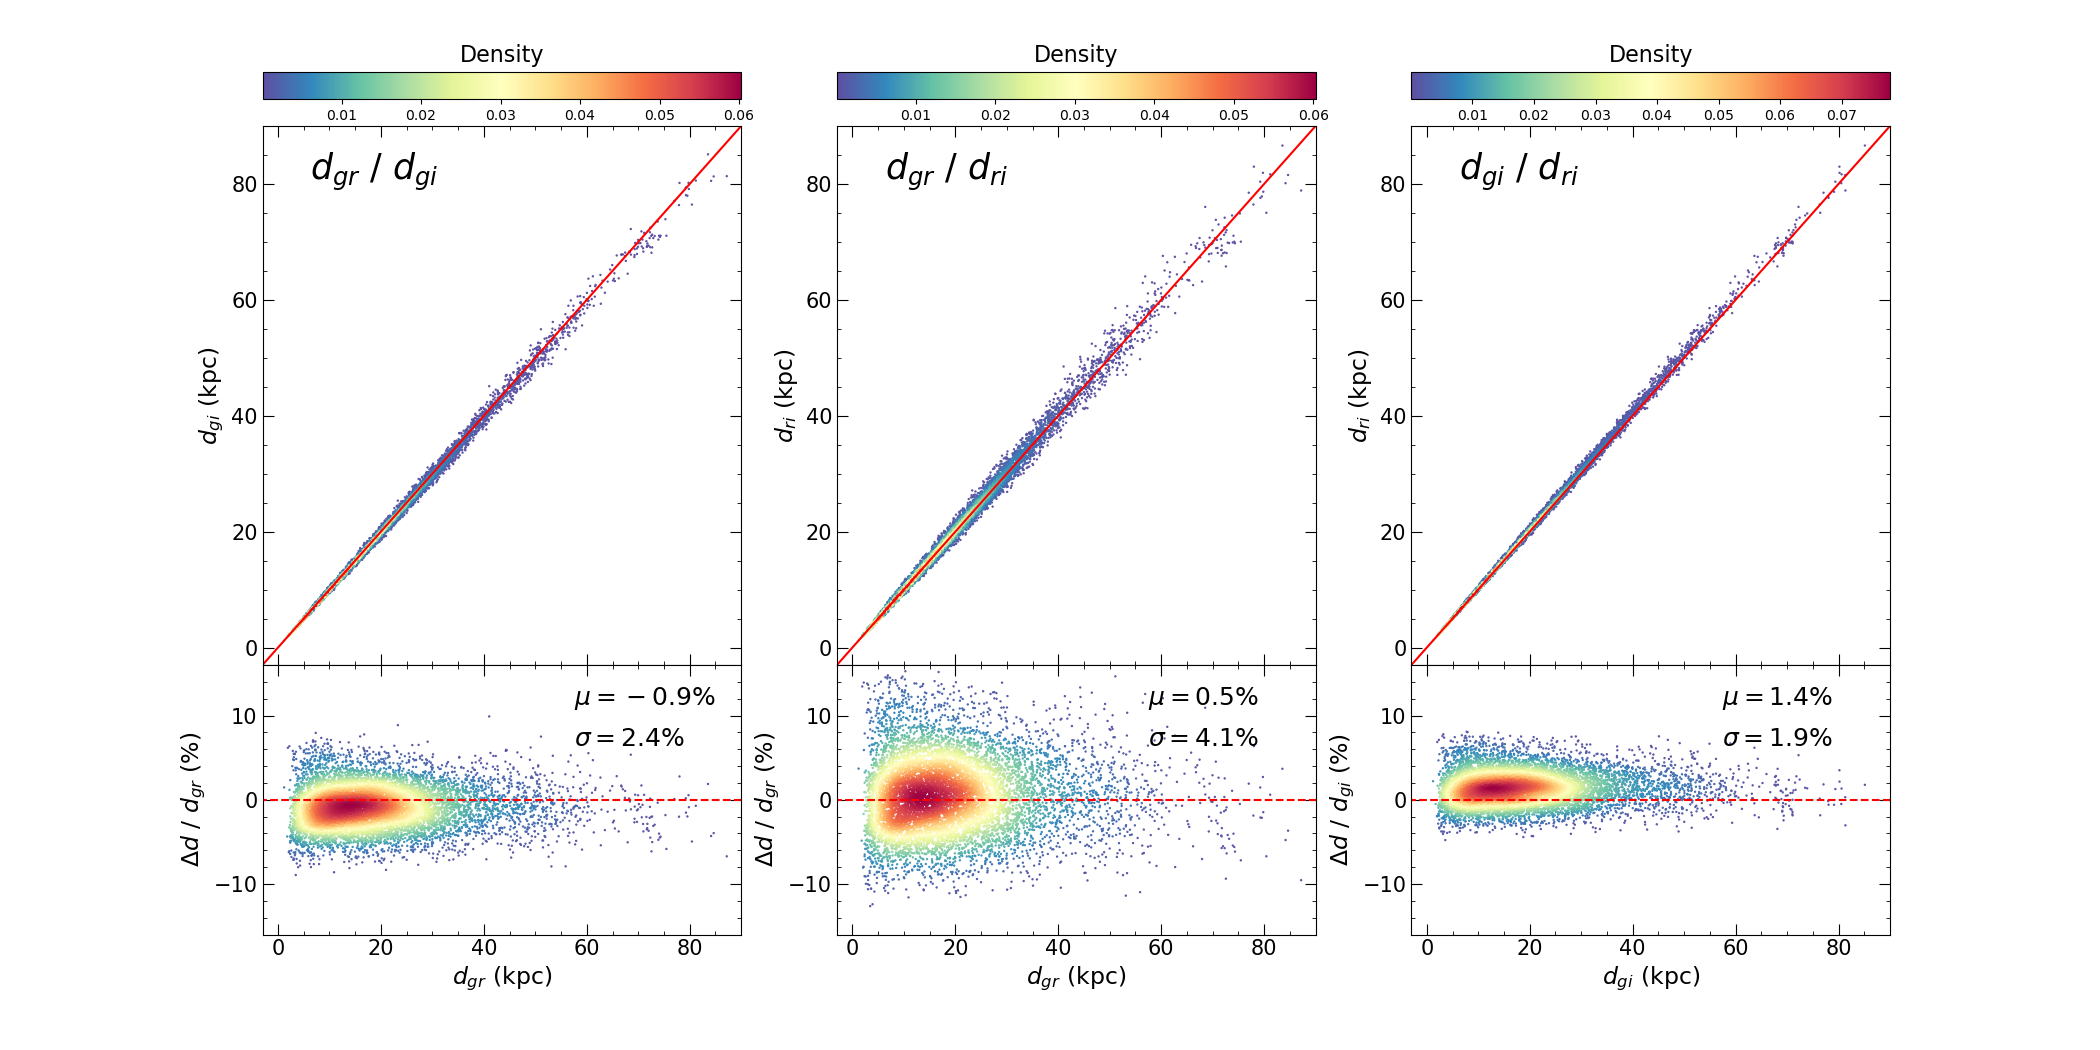
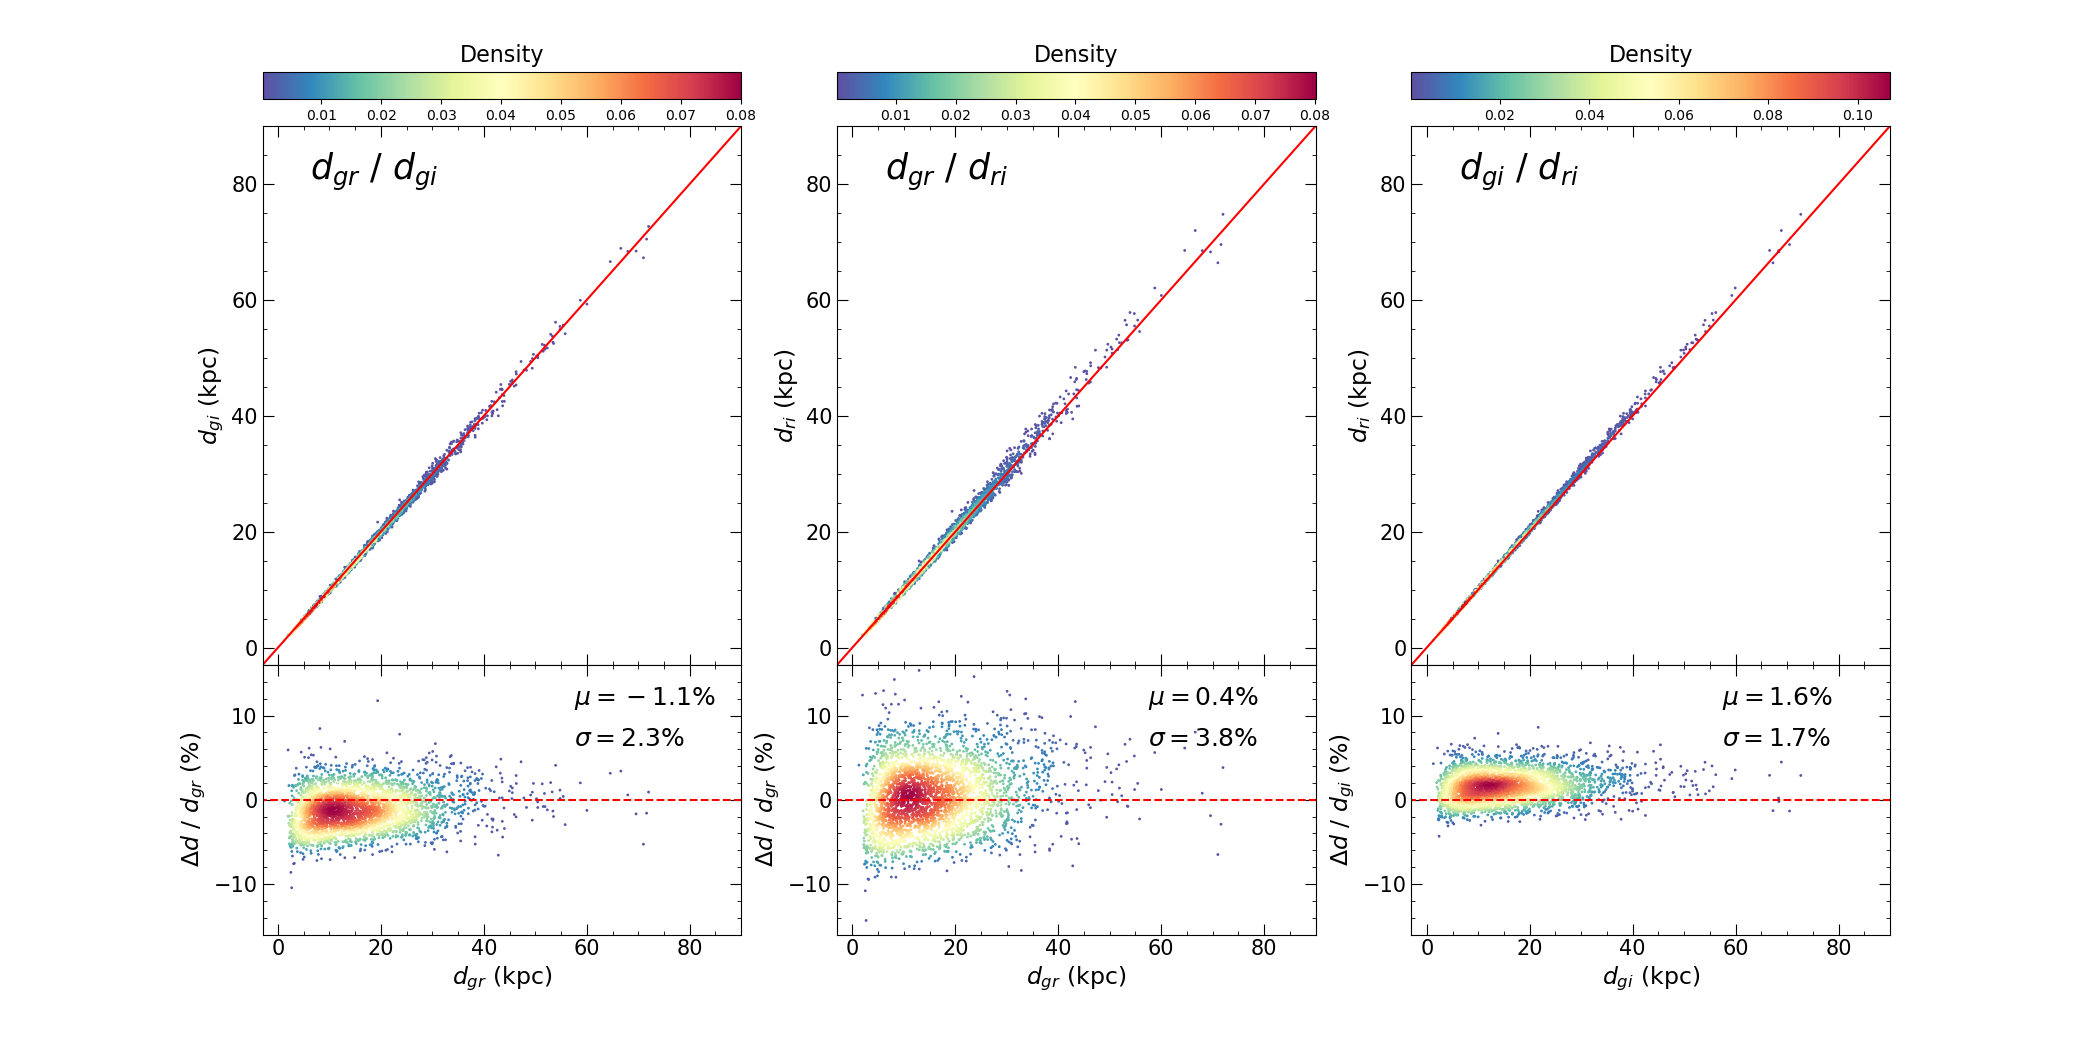
One sample may yield multiple values from the relations across different bands. Consequently, we conducted internal comparisons, similar to those for metallicity calculations, as illustrated in Appendix Figures A.5 and A.6 for RRab and RRc stars, respectively. Notably, Figure A.5, particularly the vs panel, reveals local higher dispersion. Our analysis suggests that this small but significant subset is attributed to the use of AG from C23. Given that these sample stars are characterized by high extinction values (A 1 mag), they may be associated with greater errors. Additionally, for both RRab and RRc stars, the -band distances consistently exhibit a larger offset relative to other bands. Despite this, the overall sample’s acceptable agreement leads us to adopt a weighted average method, analogous to that for metallicity, where weights are determined by the inverse square of the distance uncertainty per band. Ultimately, we estimate distances for 56,593 RRLs in the entire sample: 49,505 RRab and 7088 RRc stars. This final sample size is significantly different from the ZTF_RRL_ALL sample, particularly for RRc stars, due to the limited availability of extinction values.
3.2.2 The PWZ Relations
Estimates of distance from PMZ relations are often affected by extinction, making it challenging to achieve precise measurements for samples with significant extinction-related deviations. In an attempt to enhance precision, we utilize the formally extinction-free Wesenheit magnitude to construct the PWZ relation, focusing on sample stars with photometric data in at least two bands. In this work, the Wesenheit magnitude are defined as:
where the relative coefficients calculated adopted the Galactic extinction law derived by Wang & Chen (2019).
For the calibration of the PWZ relation, we construct our sample by cross-matching the ZTF_RRL_FIT sample with Gaia DR3 data, akin to our approach for the PMZ relations, and apply the following selection criteria:
-
•
The RRLs must contain photometric data in at least two bands
-
•
The RRLs must exhibit parallaxes greater than 0.2 mas (about 5 kpc), and have relative parallax errors less than 10%
-
•
The errors of the photometric metallicities from the -band ([Fe/H]_r_err_TW) must be less than 0.23 dex and 0.27 dex for RRab and RRc stars, respectively
The first criterion ensures the accessibility of the Wesenheit magnitude, while the second and third criteria are designed to enhance the precision of the measurements. The noteworthy effect of the third criterion is discussed further in Section 3.2.1. Here, we adopt smaller limit values, due to the relatively large numbers of sample stars that meet the remaining criteria. Finally, we selected 719 RRab and 349 RRc stars for the calibration, hereafter referred to as the ZTF_RRL_FIT_DIS2 sample.
We determined the absolute Wesenheit magnitudes for these sample stars using the distances derived from the Bayesian method (Huang et al. 2021) and the mean apparent magnitudes in two bands, as mentioned previously. To ensure the reliability of our results, we imposed error limits on the absolute magnitudes, which account for uncertainties in distance and mean magnitude measurements. Specifically, we required these errors to be less than 0.10 mag for the -band, and 0.15 mag for the - and -bands, for both RRab and RRc stars. After applying these criteria, we selected the remaining sample stars to calibrate the PWZ linear relation:
| (5) |
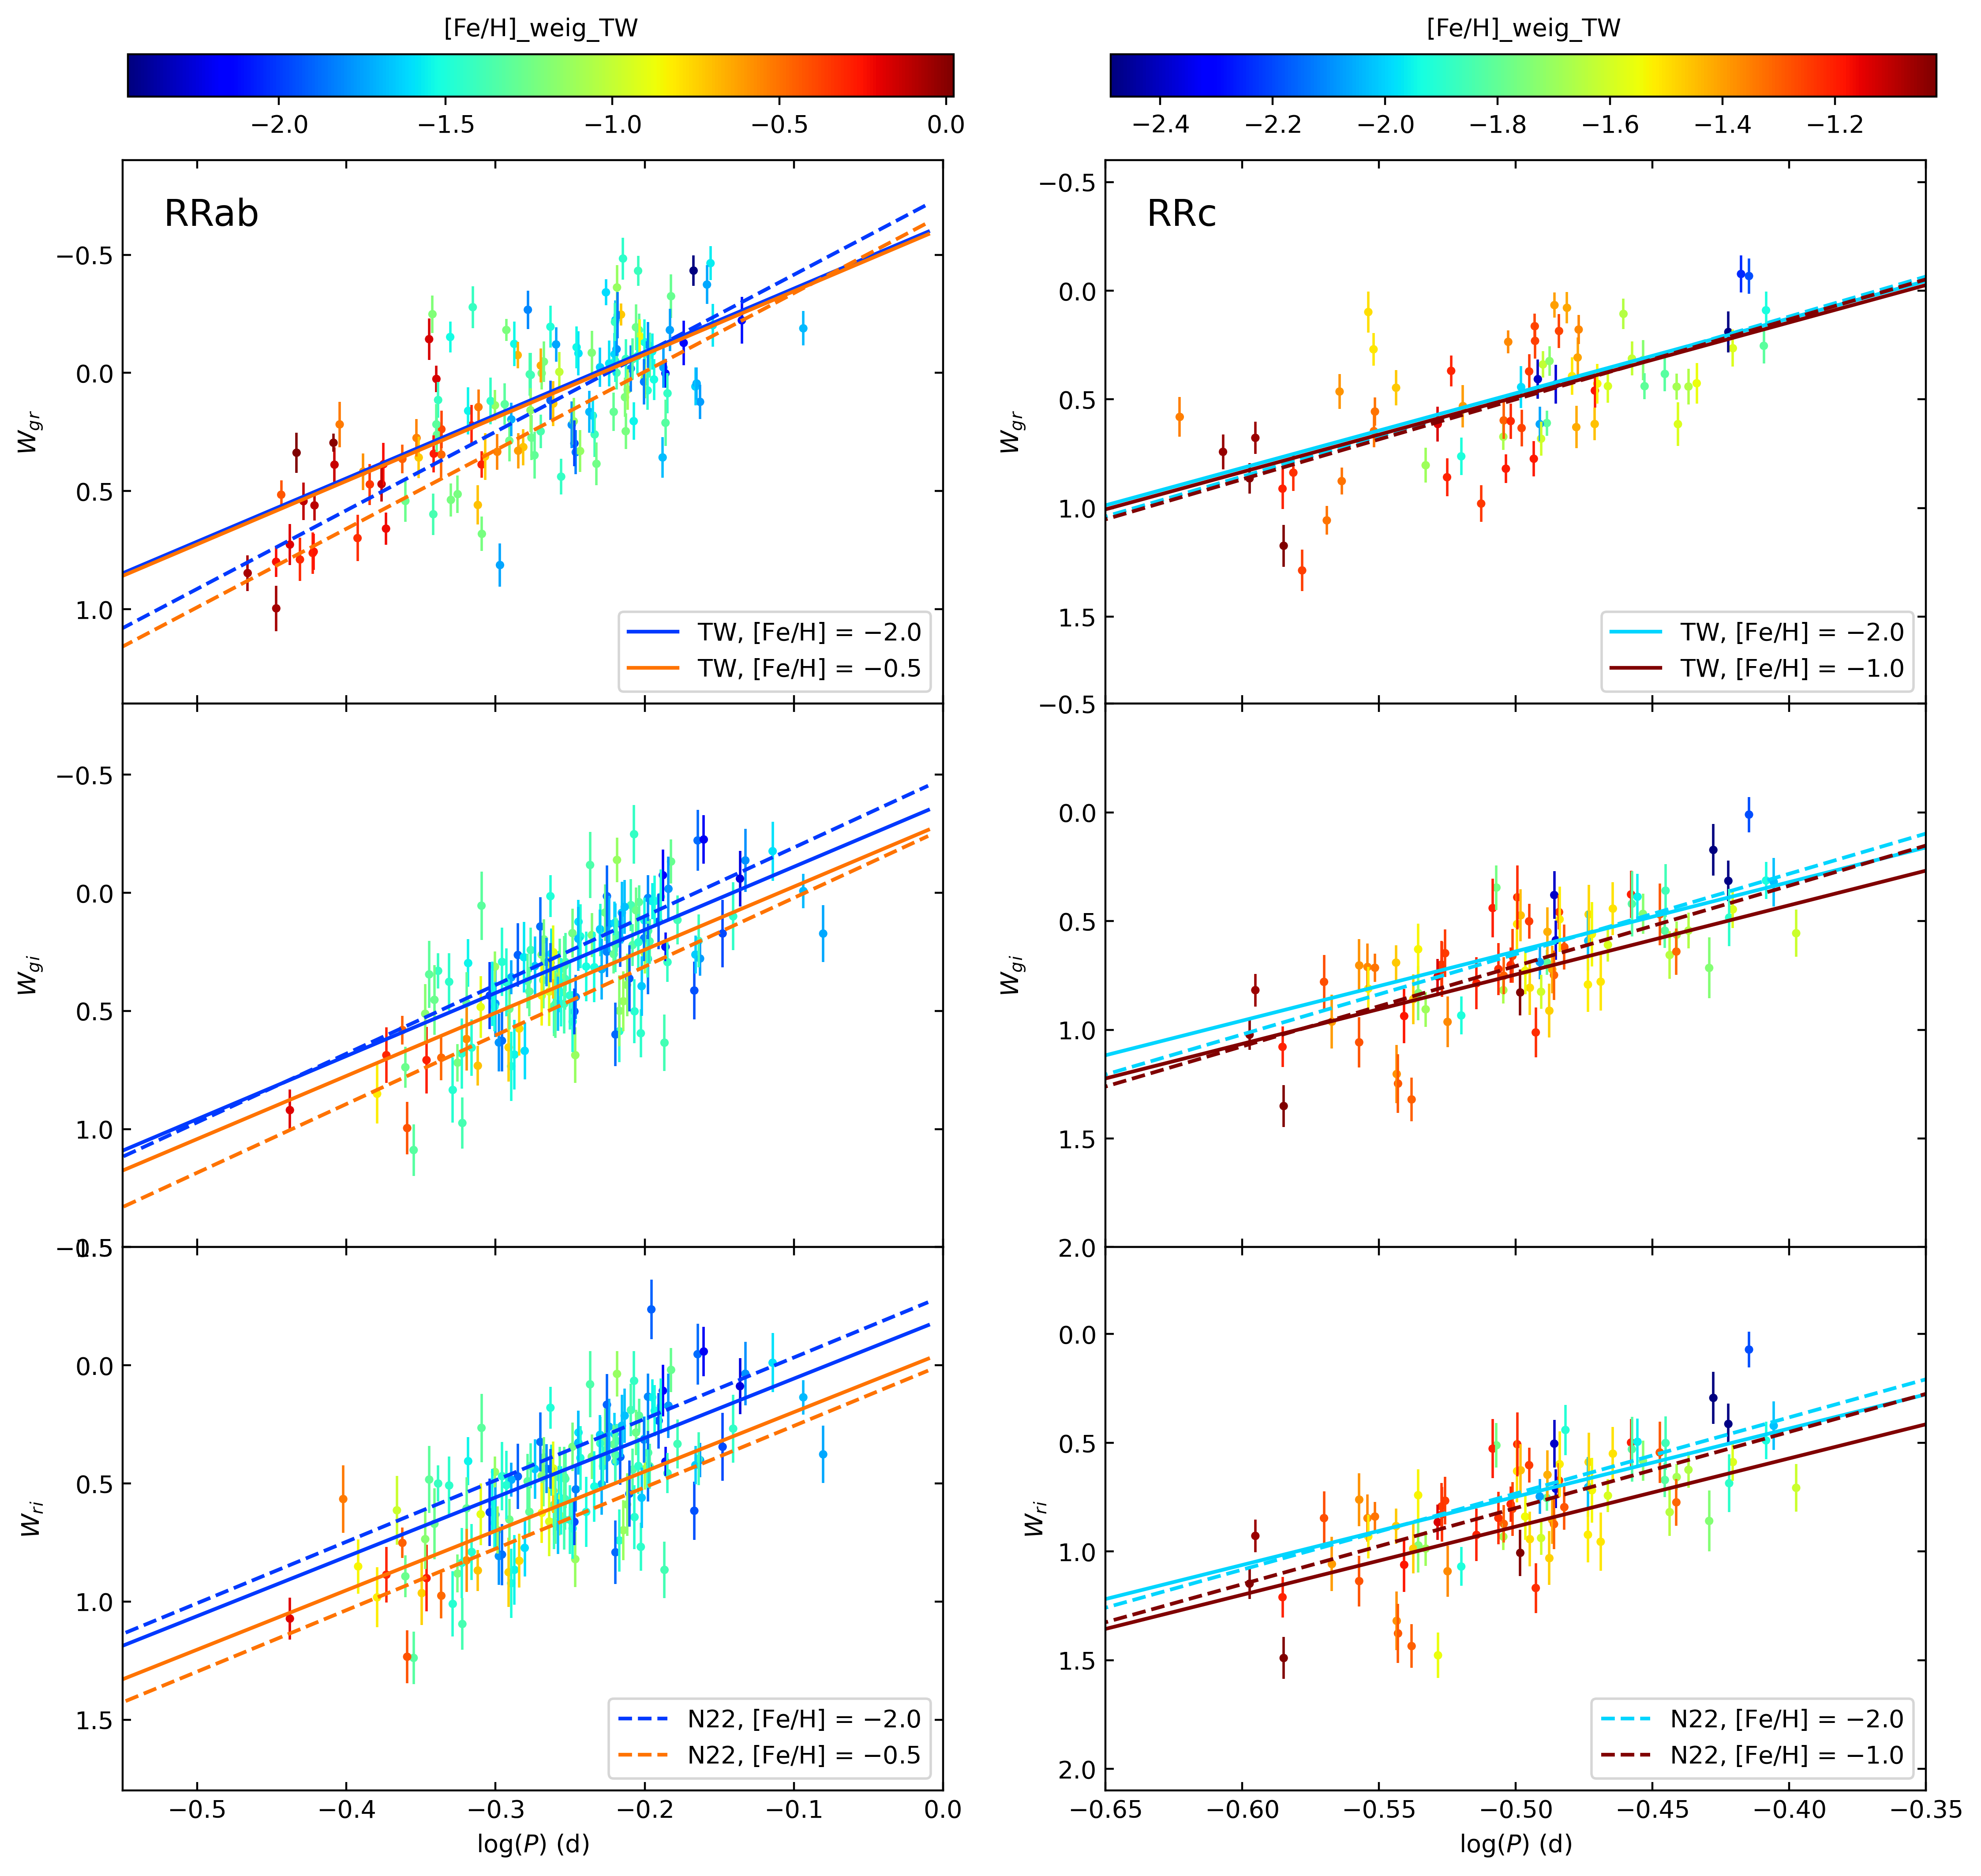
where the variables are defined as in Section 3.2.1. The resulting fit coefficients , , , and the number of sample stars used for calibration N in the -bands are listed in Table 3. The fits are shown in Figure 6; the left column of panels is for type RRab stars, while the right column of panels if for type RRc stars.
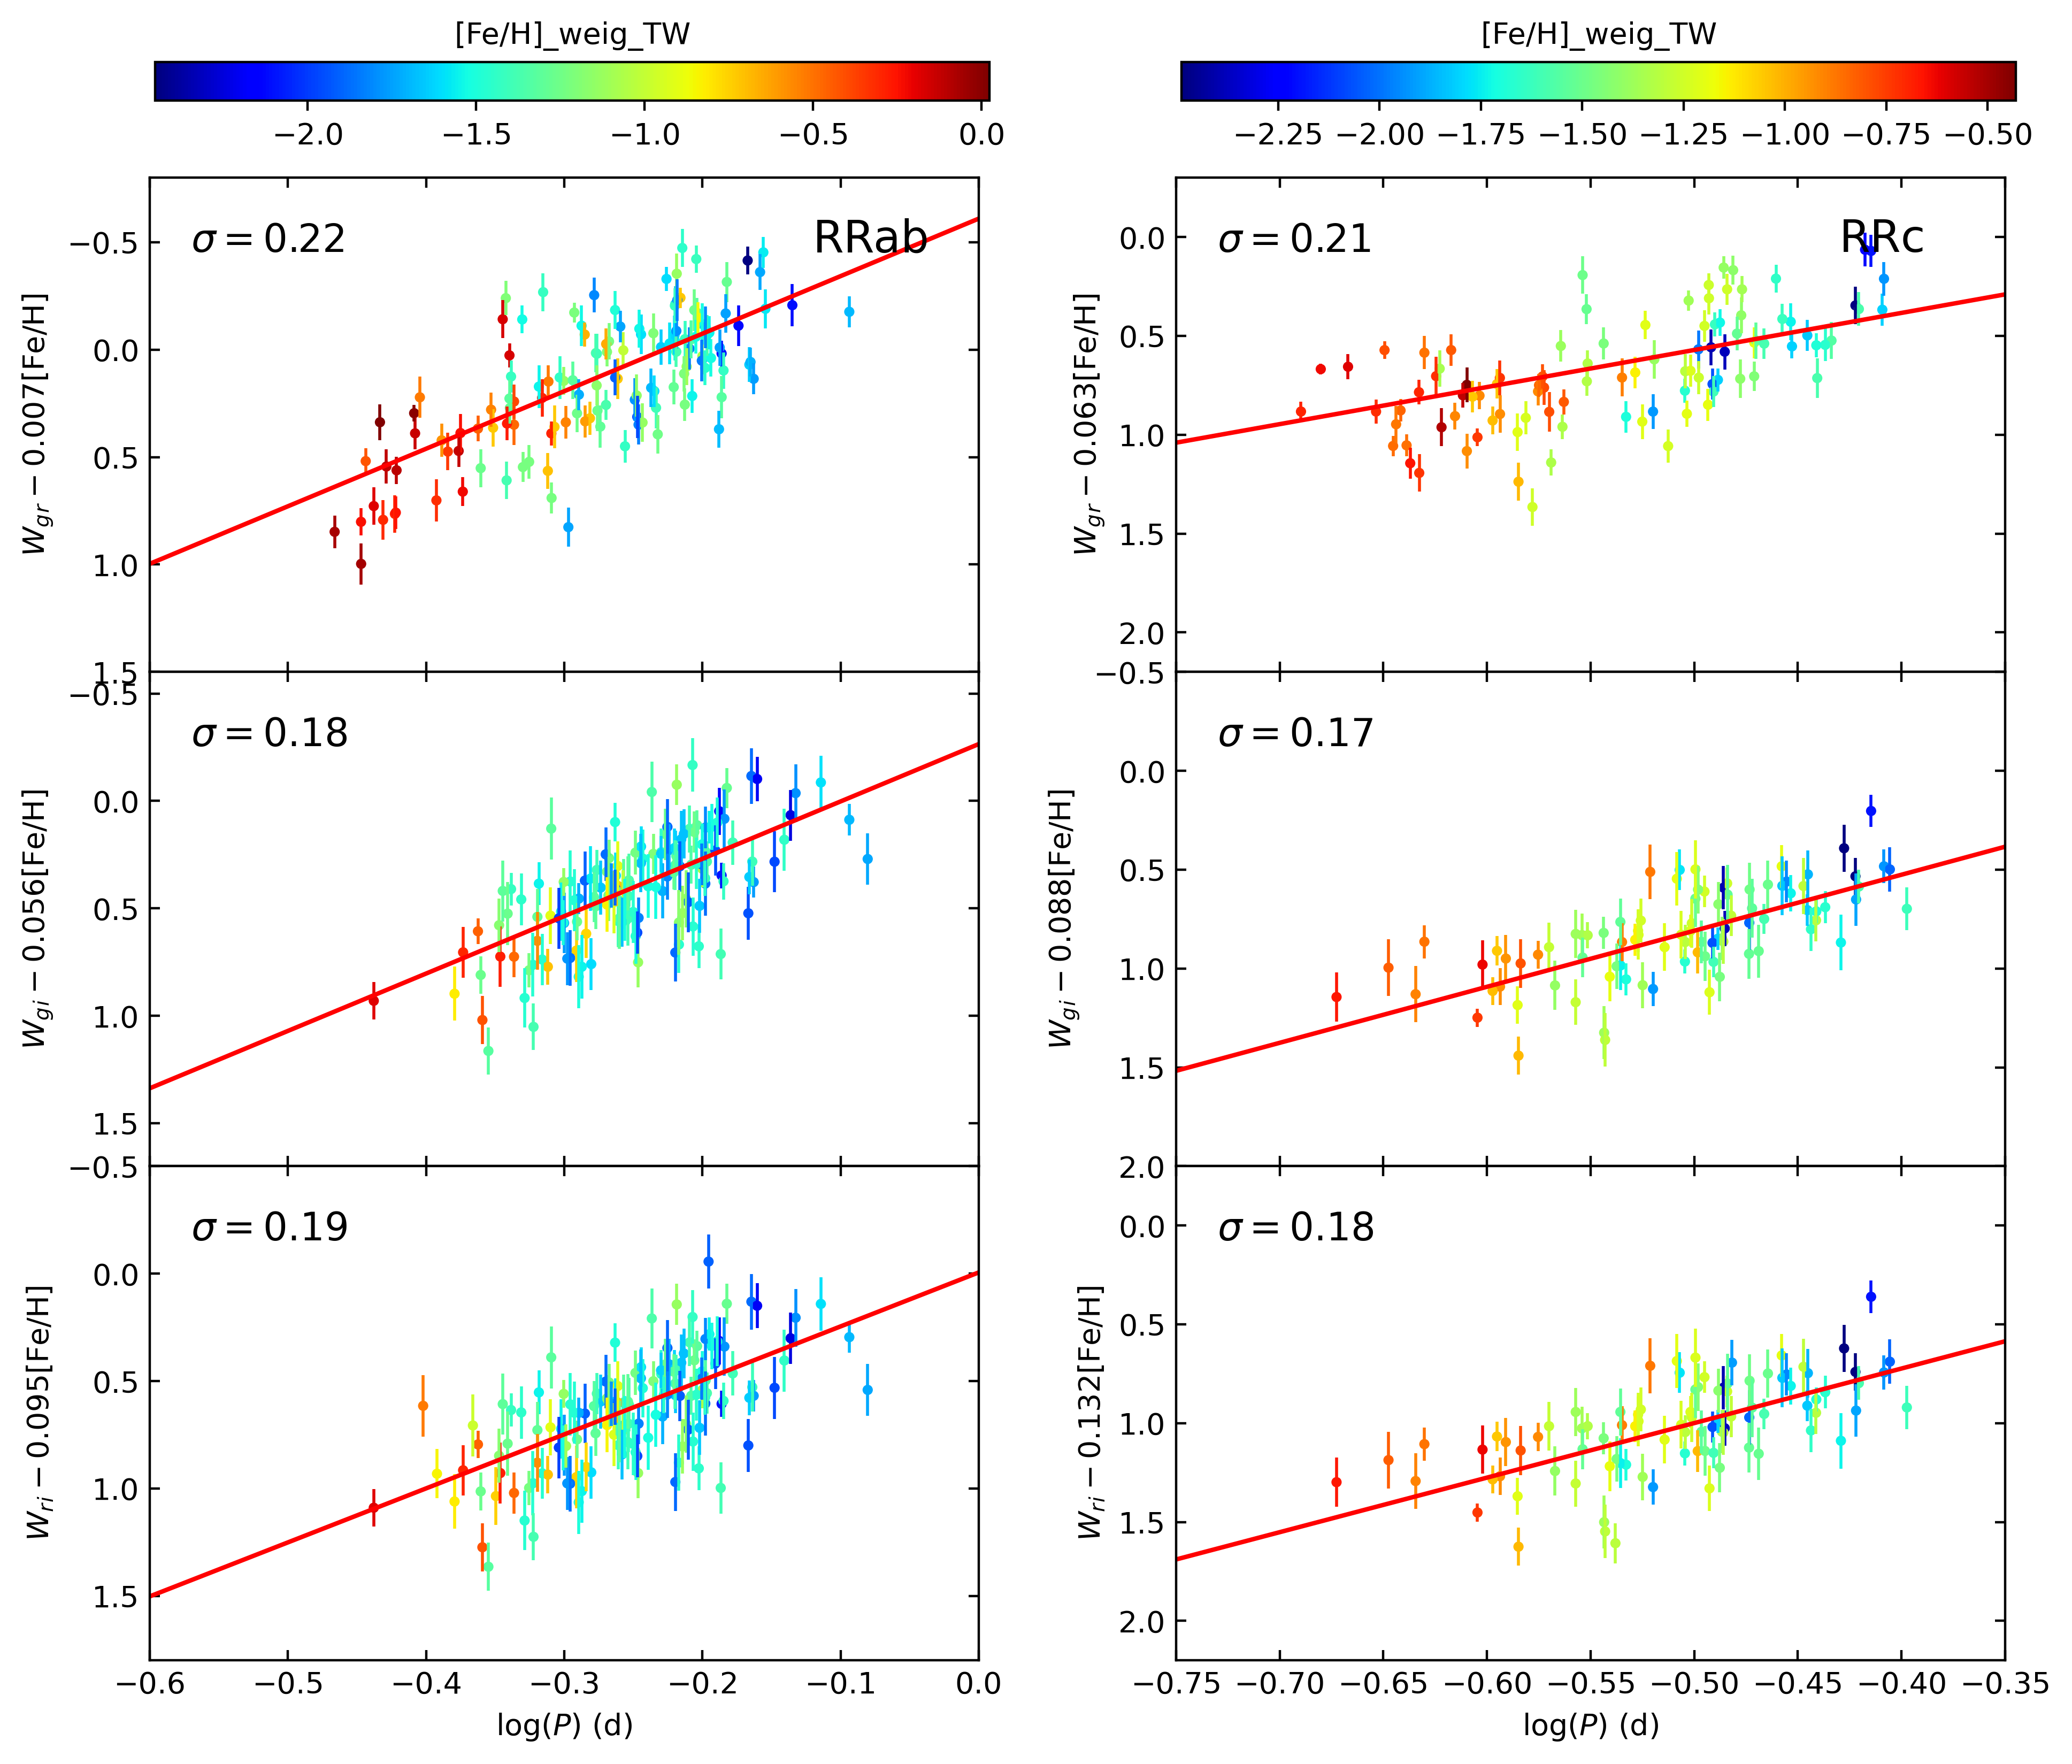
A notably shallow slope for RRc stars is evident, particularly in the -band pair, as shown in Figure 6. The primary reason for this phenomenon is that the of the metal-rich ([Fe/H] 1) sample stars is unexpectedly smaller than anticipated. Upon examining the light curves in the - and -bands, and the distance calculation process, we suspect that these metal-rich RRc sample may exhibit different PWgrZ relationships. However, separate calibration for this subset is not robust due to the limited sample size and relatively low precision of the metallicity measurements.
Thus, we re-calibrate the PWZ relation for RRc stars with metallicities lower than [Fe/H] = , and list the results in Table 3. We then compare our fitting results with the recent study by N22, as illustrated in Figure 7. The fixed [Fe/H] values are set to 2 and 0.5 for RRab stars, and 2 and 1 for RRc stars. The clear agreement between the two studies in terms of both period and metallicity is evident, especially for the PWgrZ relation of RRc stars after re-calibration. Moreover, our analysis indicates an even weaker dependence on metallicity, approaching zero in for RRab stars, despite a higher scatter compared to Wesenheit magnitudes that include the -band. This result is consistent with the theoretical work by Muraveva et al. (2015, hereafter M15), who also noted a weak metal dependency in the PWZ relations for and . The consistency between our results and M15’s work may be due to the significant overlap between the ZTF -bands transmission curves and those of the filters. Additionally, the trend in the coefficients for the period and metallicity terms across different Wesenheit functions in our PWZ relations also aligns with M15’s theoretical predictions.
Utilizing this newly established PWZ relation, we estimate distances for our final sample. Due to the construction of the Wesenheit magnitude, which requires data from at least two bands, we can only derive distances for a subset of the ZTF_RRL_ALL sample. The distance uncertainties stem from two primary sources: (1) random errors estimated through 1000 MC simulations, which account for uncertainties in fit coefficients, photometric-metallicity, and apparent Wesenheit magnitude errors across the two bands used, and (2) methodological errors, evident from the scatter among various PWZ relations.
One sample can yield multiple distance estimates from different band relations. Therefore, Figures A.7 and A.8 depict the internal comparisons across different bands for RRab and RRc stars, respectively. These comparisons reveal that both RRab and RRc stars exhibit acceptable agreements in terms of offsets and dispersions. Consequently, we provided reference distances using a weighted average method, similar to that employed in the PMZ relations. In total, we estimate distances for 64,156 RRLs in the ZTF_RRL_ALLsample: 46,185 RRab and 17,971 RRc stars. Only sample stars with photometric data from a single band have not had distances determined.
4. Validation of Metallicity and Distance Estimates
In this section, the photometric-metallicity and distance estimates based on our newly constructed relations are compared to other estimates from the literature, and tests of the accuracy of these relations using GCs member stars are carried out.
4.1. Validation with Recent Research
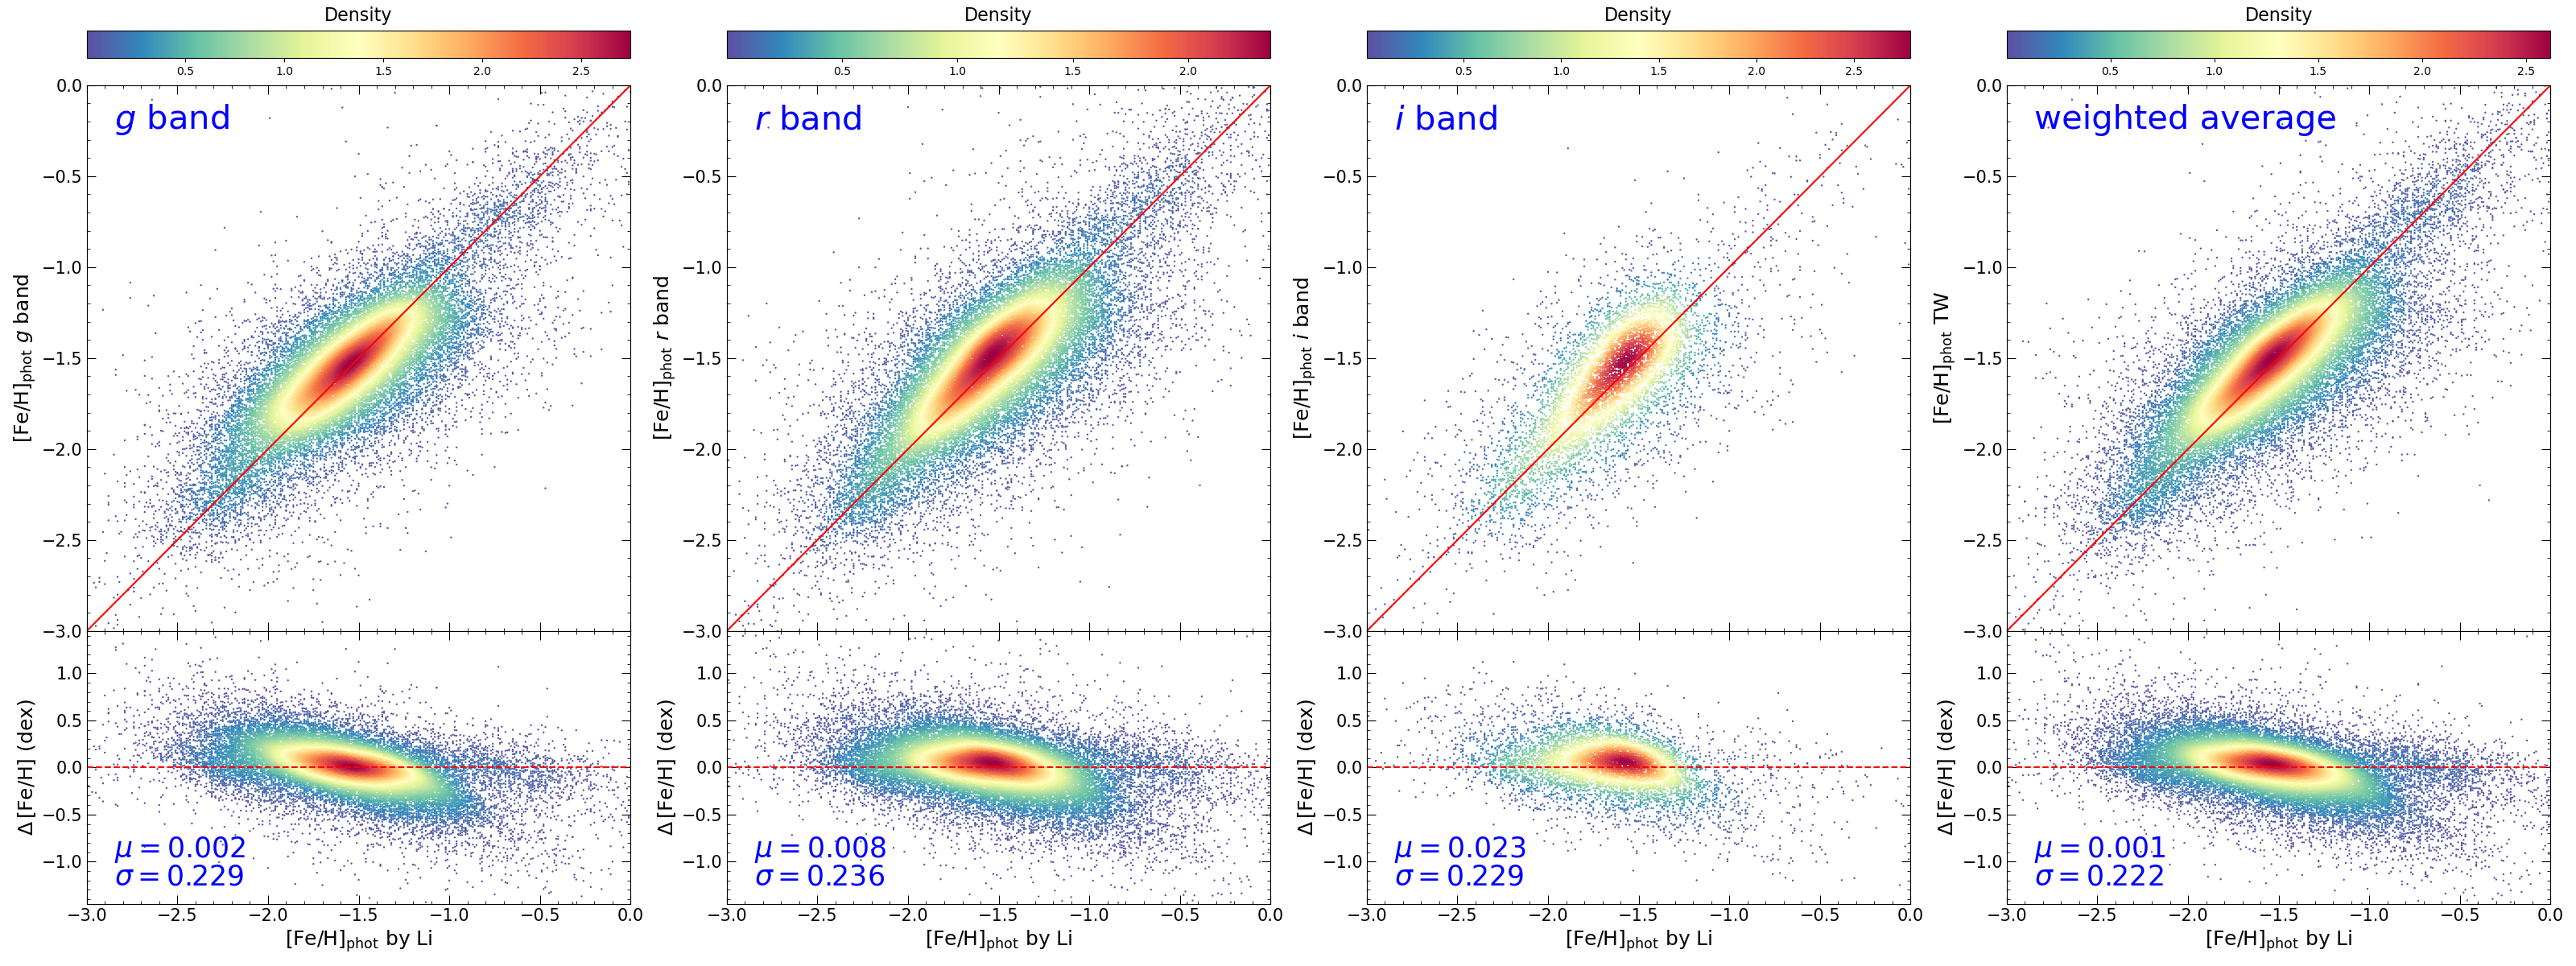
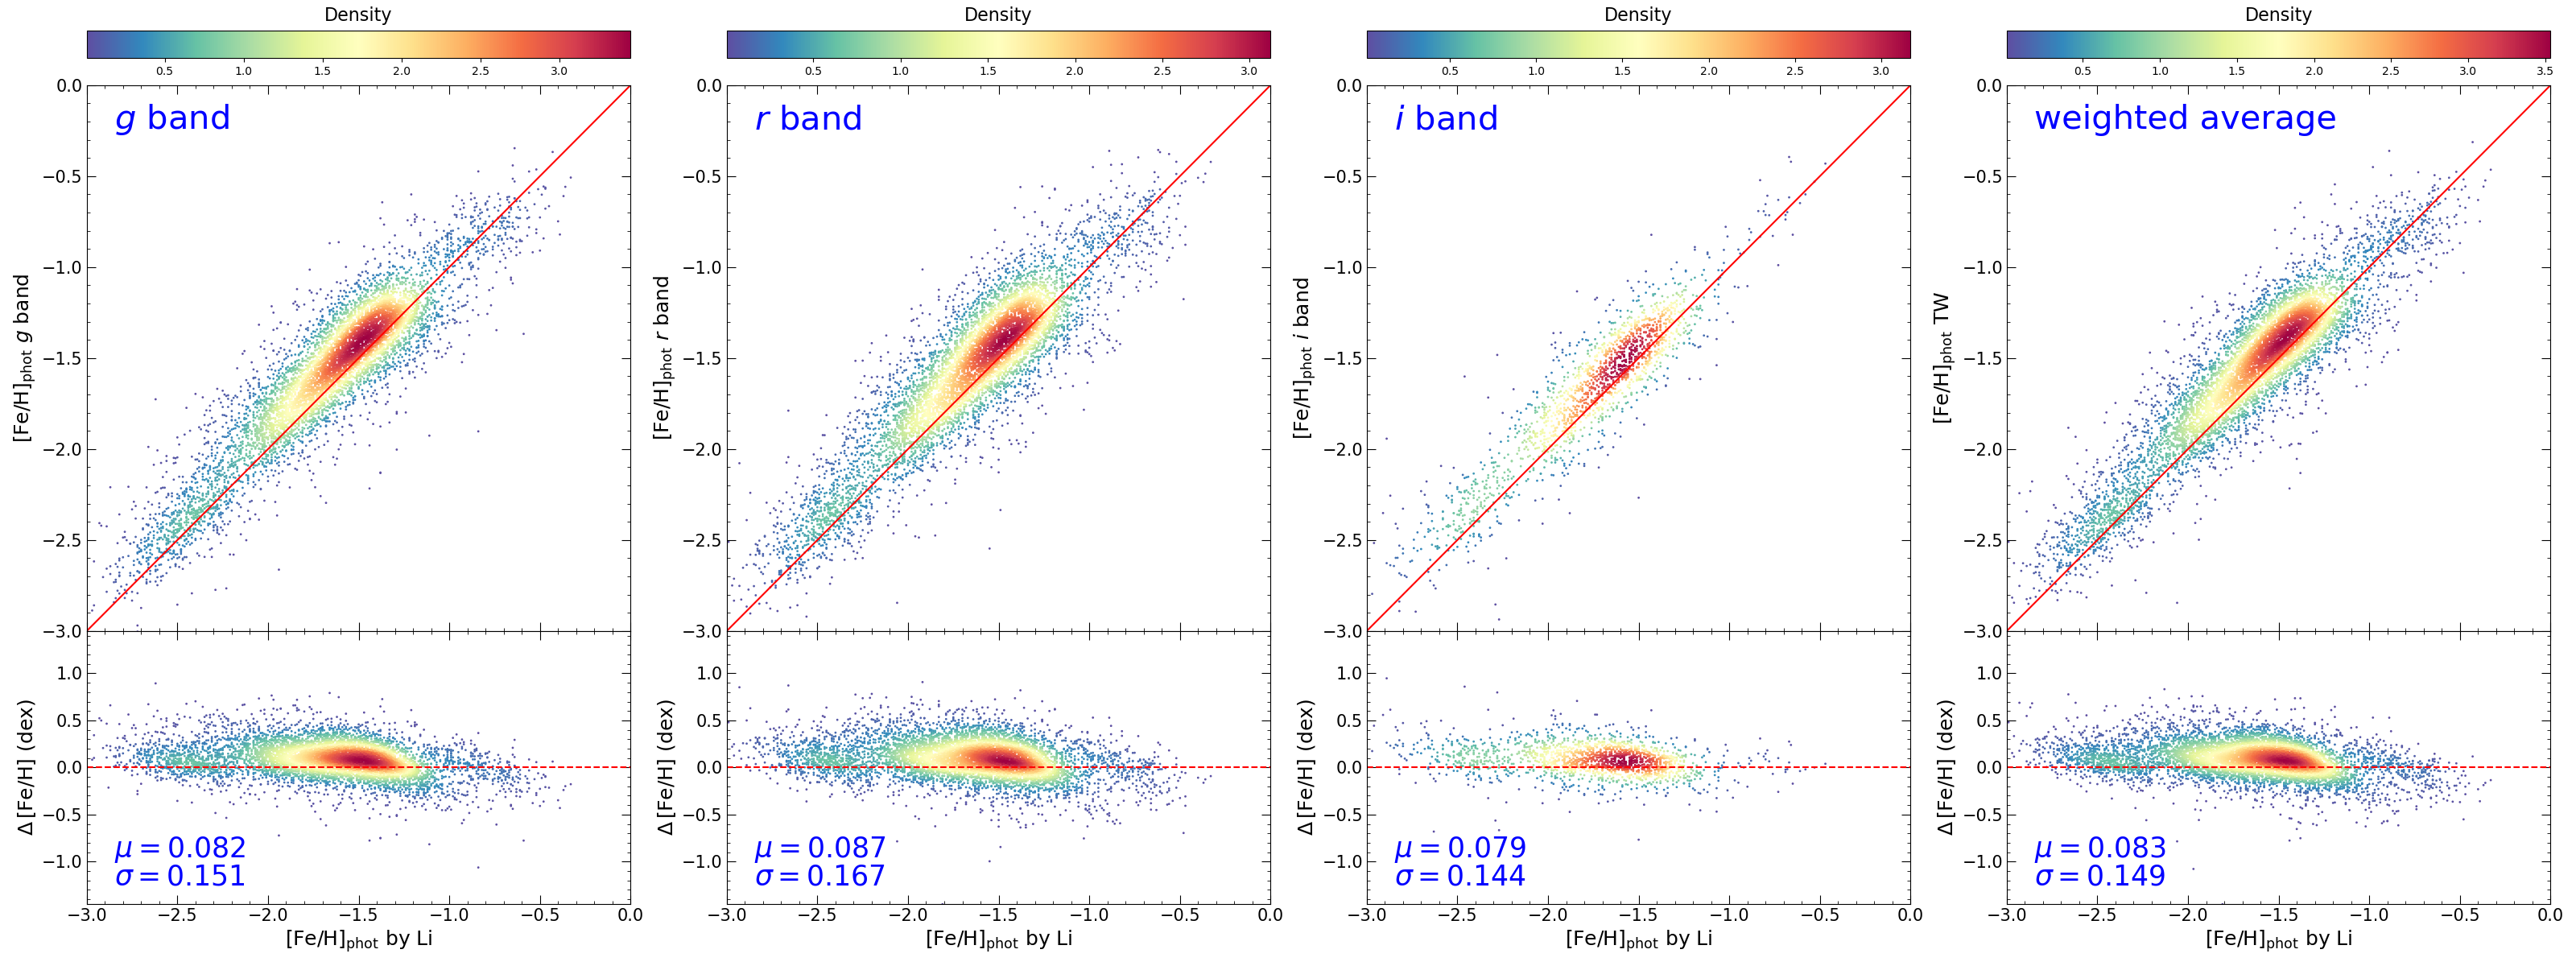
Recently, Li23 presented photometric-metallicity and distance estimates for over 130,000 RRLs using newly calibrated photometric-metallicity and M[Fe/H] relations, based on Gaia DR3 data. For metallicity estimates, they compared their results with those from other photometric studies, such as Dékány & Grebel (2022), showing an acceptable agreement when considering the differences in metallicity scales. Their results also align well with the high-resolution spectroscopic sample. Therefore, we compared our metallicity estimates with theirs, as shown in Appendix Figures A.9 (RRab) and A.10 (RRc), using 2-D density maps similar to those in our previous internal comparison figures. Here, we also present results based on single-band relations, in addition to weighted average values, for validation across different bands. Overall, our work exhibits good agreement with Li23, with small offsets and acceptable scatter of 0.24 and 0.17 dex, the maximum values in four comparisons for RRab and RRc stars, respectively. Specifically, a 0.9 dex offset is found for the RRc stars, which modifies the systematic bias in Li23 when compared with GC members, as discussed in the next section. The slight tilts observed for RRab and RRc stars, notably on the metal-rich side, is mainly attributed to differences in boundary value selection during the calibration of the relationship, due to varying sample sizes.
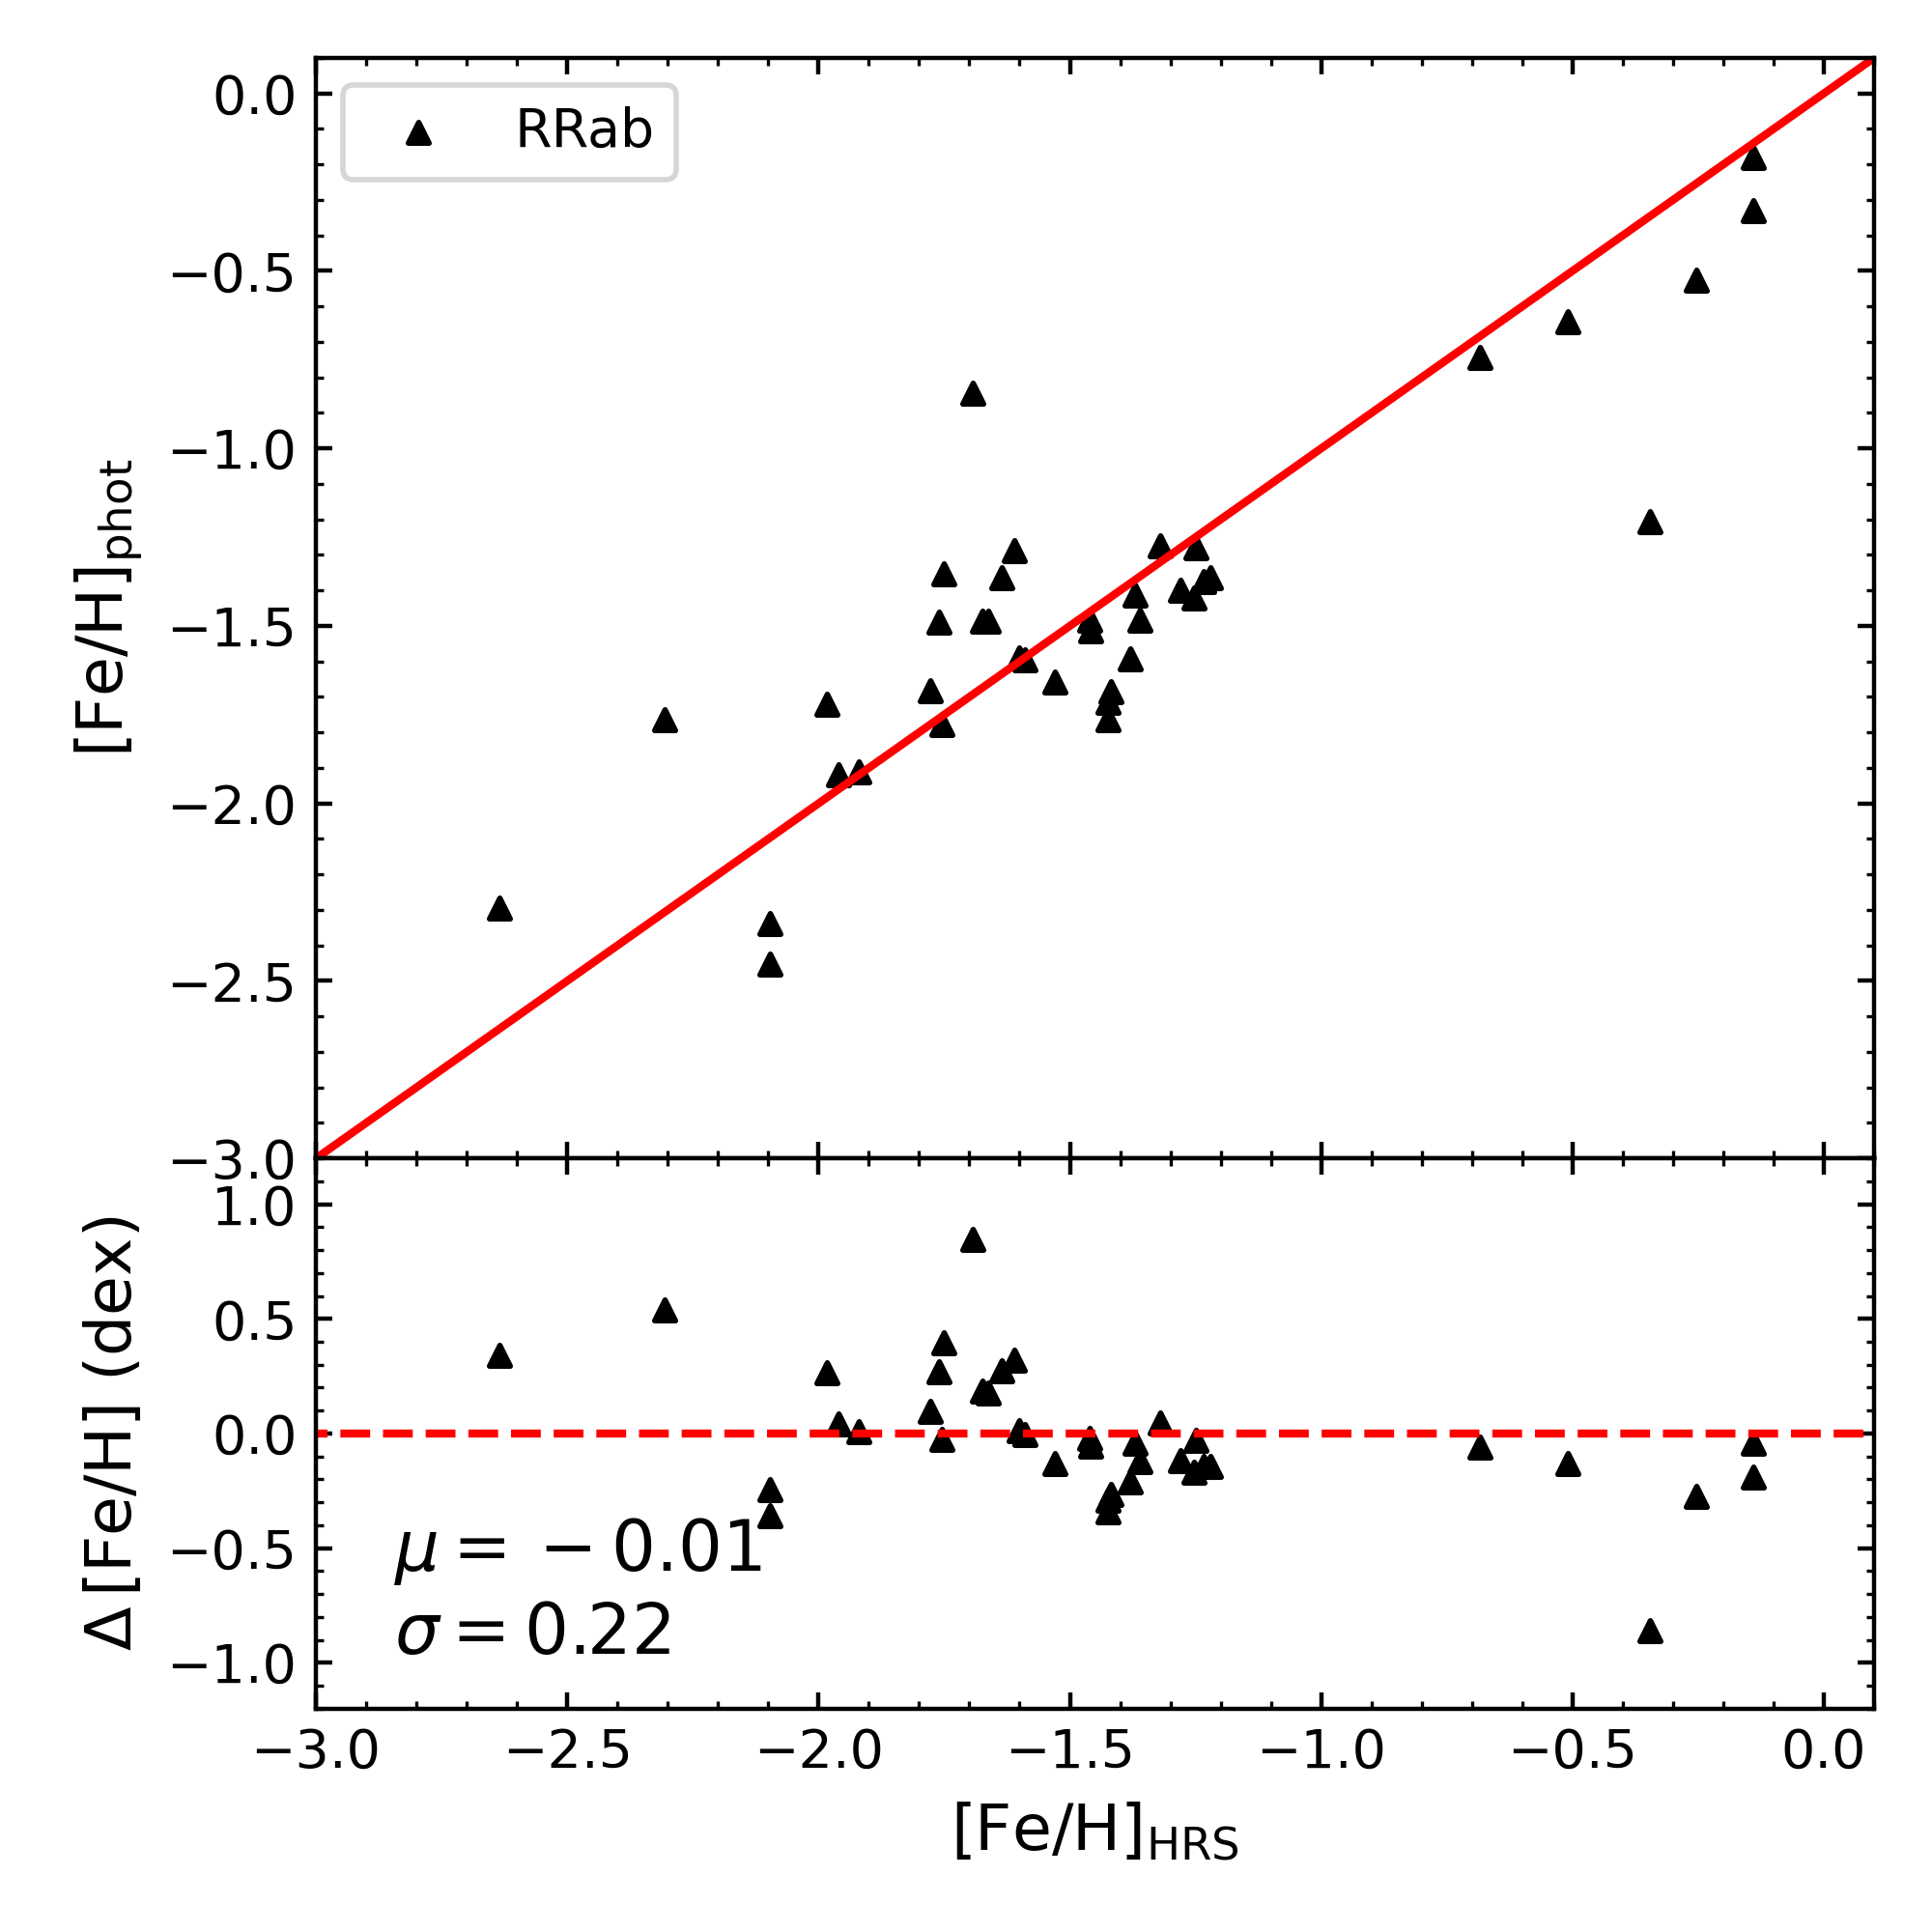
We now assess the accuracy of our photometric-metallicity estimates using the high-resolution spectroscopic sample. Dékány et al. (2021) integrated 183 RRab and 49 RRc stars with calibrated, same-scale metallicity measurements from high-resolution spectroscopy, covering the range from [Fe/H ] = 3.1 to +0.2, providing the most comprehensive high-resolution spectroscopic sample to date. Cross-matching with this sample, we identified 39 common RRab stars, but fewer than 10 common RRc stars with large errors due to the limited total number of RRc sample stars. To ensure the credibility of our comparison, we conducted the comparison only for RRab stars, as shown in Figure 8. For type RRab stars, the metallicities from this work are in excellent agreement with those from high-resolution spectroscopy, with a tiny offset of 0.01 dex and a dispersion of 0.22 dex.
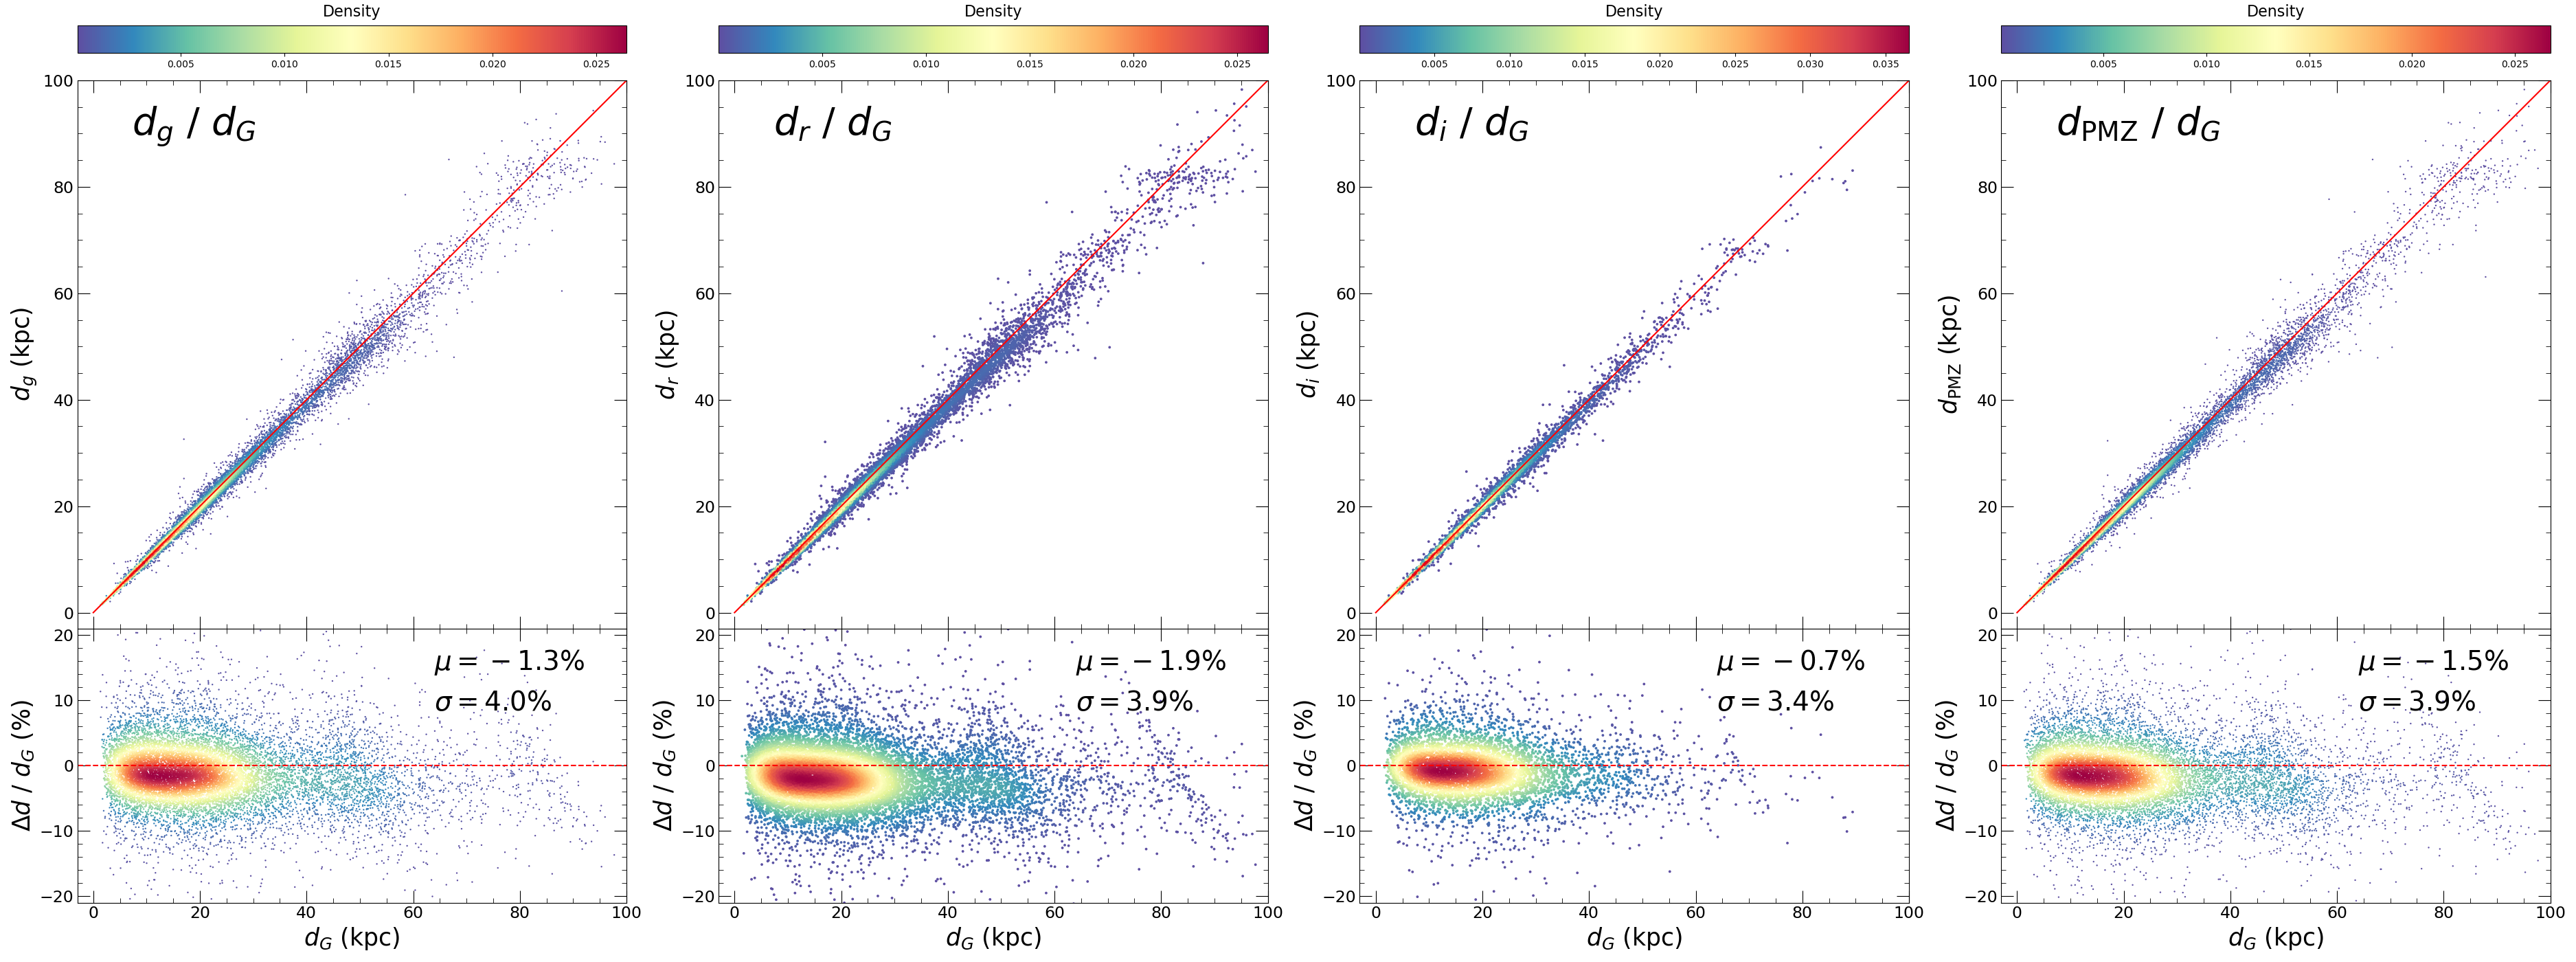
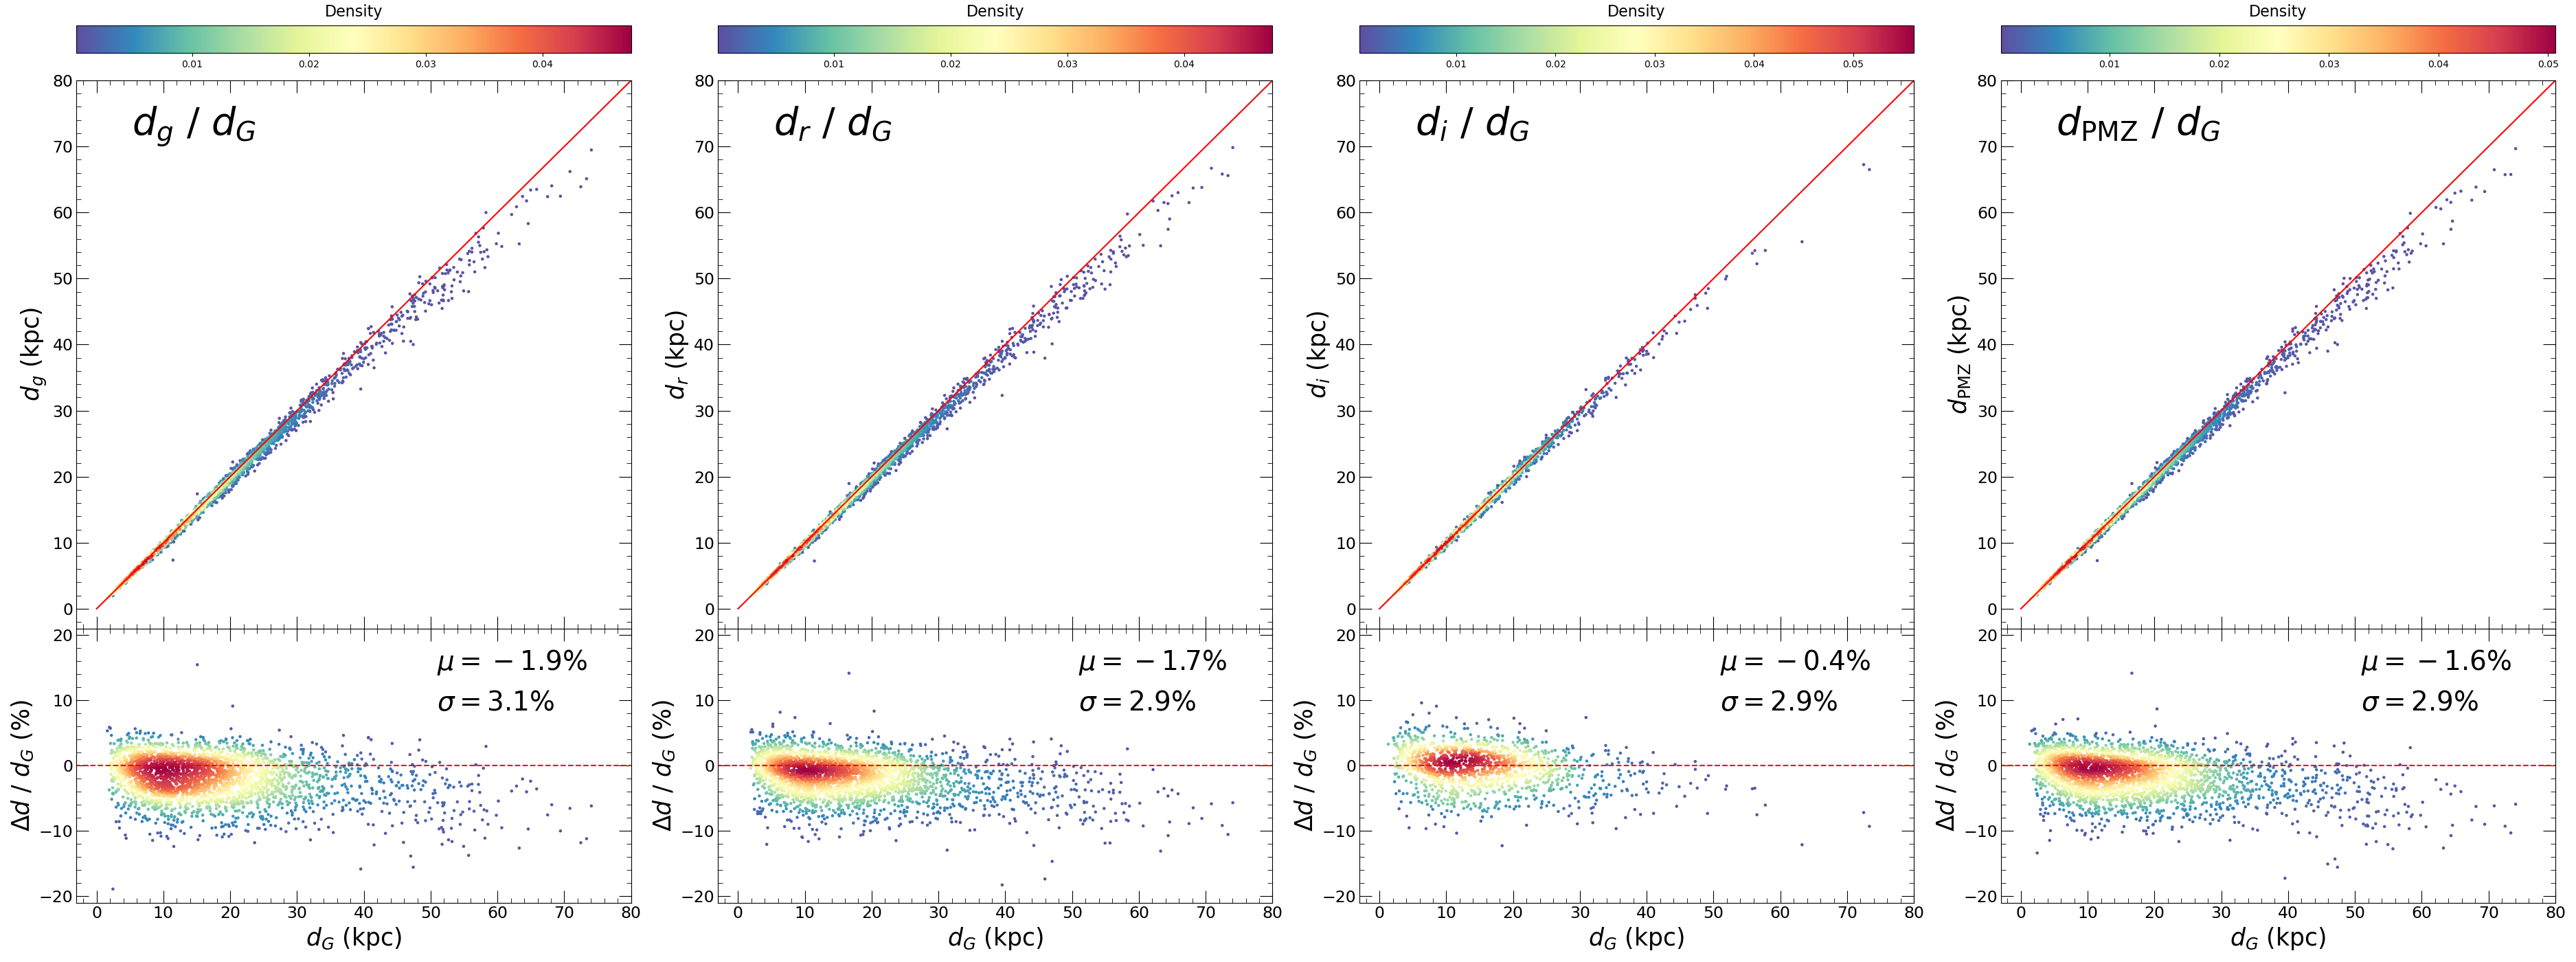
In addition to validating metallicity, we also present comparisons of distance estimates derived from the PMZ and PWZ relations with those of Li23. Appendix Figures A.11 and A.12 compare our PMZ-based results against Li23’s findings for RRab and RRc stars, respectively. Figure A.11, which excludes sample stars using AG from C23, shows that our results align closely with Li23, with a minor offset and an acceptable level of scatter, as seen in the residual plots. The concordance is even more pronounced for RRc stars.
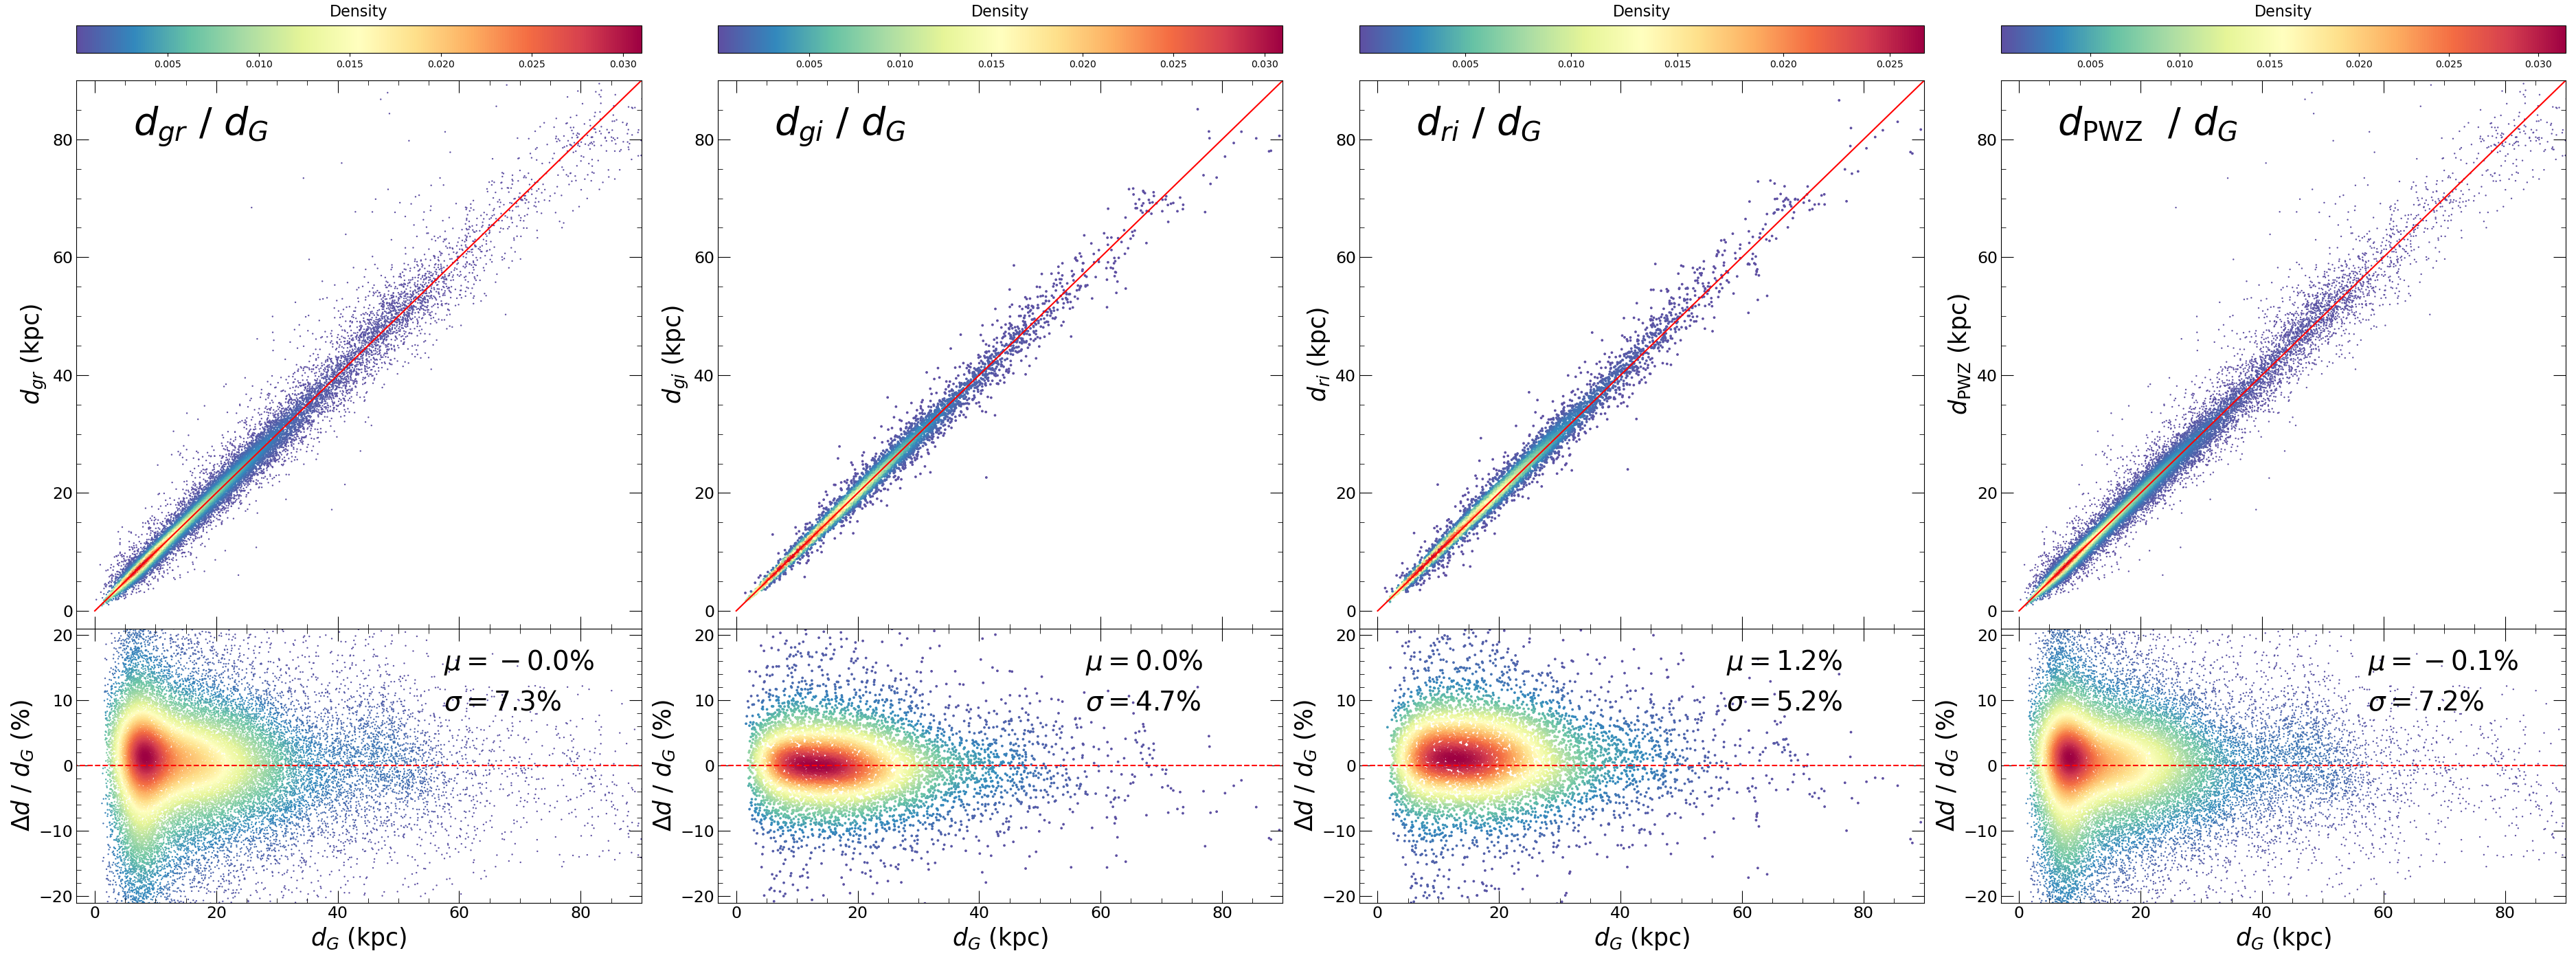
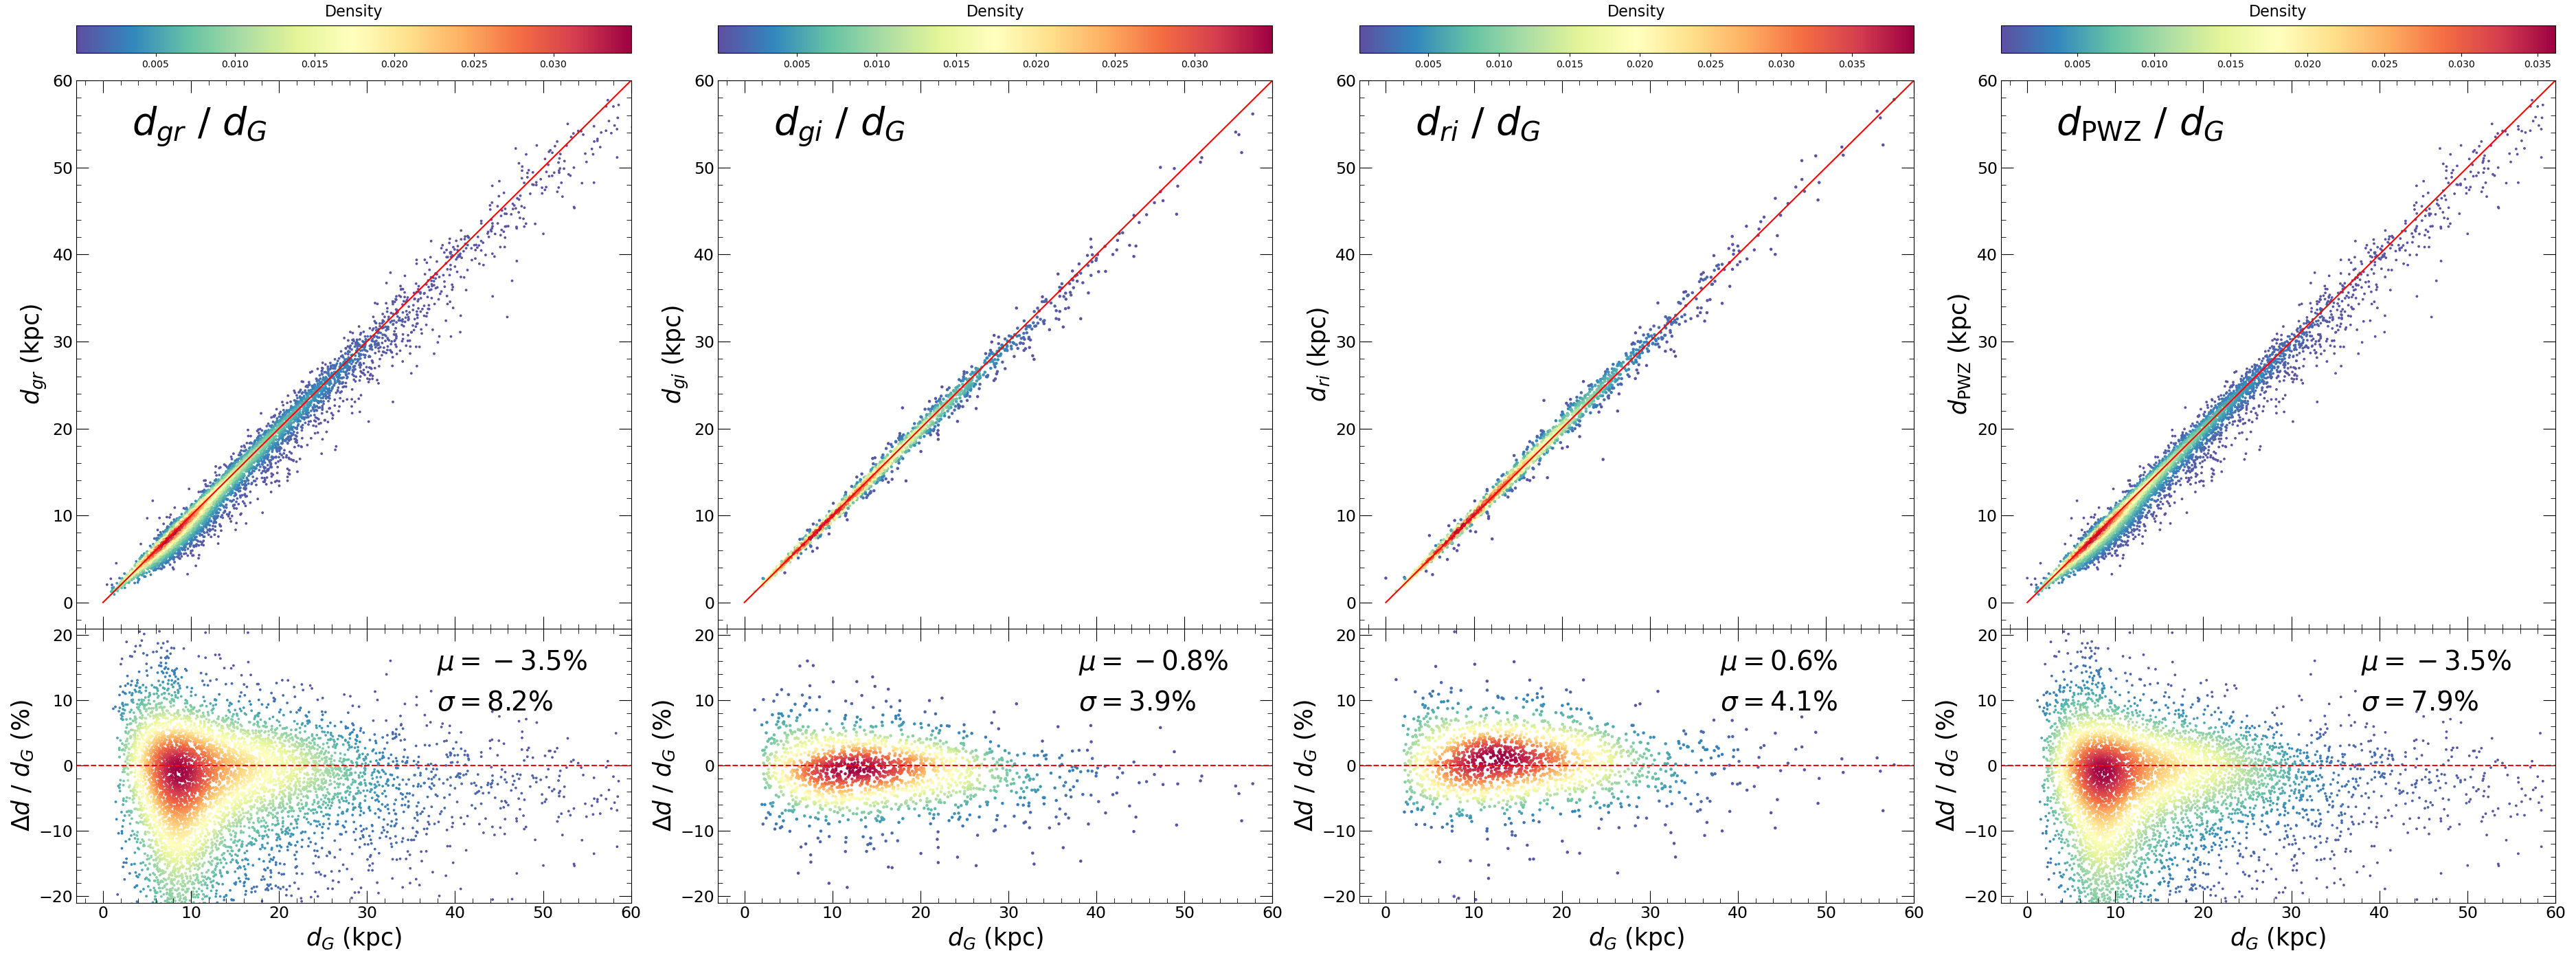
Appendix Figures A.13 and A.14 compare our PWZ-based results against Li23’s findings for RRab and RRc stars, respectively. Significant scatter in the Wgr-bands are noted, for both RRab and RRc stars, especially for sample stars with distances between 8 and 11 kpc. For further analysis, we divided these sample into two categories: ‘normal’ and ‘strange’, based on their scatter levels relative to more distant sample stars. We then examined their positions in the Galactic coordinate system. Upon analysis, we found that the ‘normal’ sample stars had a similar sky distribution to the total sample, while the ‘strange’ sample stars were predominantly concentrated near the Galactic center, specifically within the regions where and .
The consistent performance across all bands for the distance estimates, coupled with the high-extinction environment of these sample stars, suggests that the dispersion is largely attributable to differing extinction sources. In the high-extinction region, the distances () for RRab stars from Li23 utilized the AG values derived from the empirical relation of C23, which considers the period, amplitude of the -band, and two observational apparent magnitudes. This method showed a two-sided scatter when compared to our results. For RRc stars, the using the AG derived from the SFD98 map exhibited a one-sided scatter compared to our estimates. However, in these comparison, both the empirical relation and the SFD98 map are subject to uncertainties due to the high-extinction environment. Our reliance on Wesenheit magnitudes is constrained by the assumed universal reddening law and the precision of the mean magnitudes, potentially leading to biases due to high-extinction environments. Consequently, it is difficult to judge the accuracy of these sample stars’ distances or to assess which method is more reliable. However, aside from a few ( 5%) outliers, the overall comparison of the remaining sample stars demonstrates good consistency.
Considering the two concurrent distance estimates for each sample based on the PMZ and PWZ relations, we compare them using common sample stars, as illustrated in Figure 9. Note that potential low-quality sample stars and RRab stars with are excluded from the comparison, to more accurately reflect the differences between the two calibration methods. A mild negative offset is clearly observed for when compared with , indicating generally lower distance estimates. Meanwhile, a mild scatter in the also suggests that the differences may primarily be related to extinction values. Therefore, we provide both distance values, and give priority to one after validations with globular clusters, as discussed below.
4.2. Validation with GCs
GCs member stars typically share similar metallicities due to a common formation history. Thus, we utilize RRLs from GCs to verify the accuracy of our newly calibrated photometric-metallicity and distance relations. Our test samples are sourced from two parts: the primary portion consists of member stars from the ZTF_RRL_FIT sample, while the supplementary portion comes from the catalog of N22’s work.
For the primary portion, we apply selection criteria similar to those of Li23 to 157 GCs from Harris (2010, hereafter H10). We use the proper motions and their uncertainties for each GC from Vasiliev & Baumgardt (2021, hereafter BV21). The criteria include:
-
•
The angular distance to the GC center must be less than 15 half-light radii
-
•
The proper motions must satisfy and
For the supplementary portion, we selected sample stars not flagged with ‘ACR’ from Table 3 of N22, and re-evaluated those not previously labeled using our previously discussed method. In total, we obtained 417 sample stars, comprising 272 RRab and 145 RRc stars. To ensure confident validation of GCs, a quota of at least five RRab or three RRc stars is necessary for selecting members of each cluster. Then, the mean metallicity and distance, along with their uncertainties, are calculated for each GC.
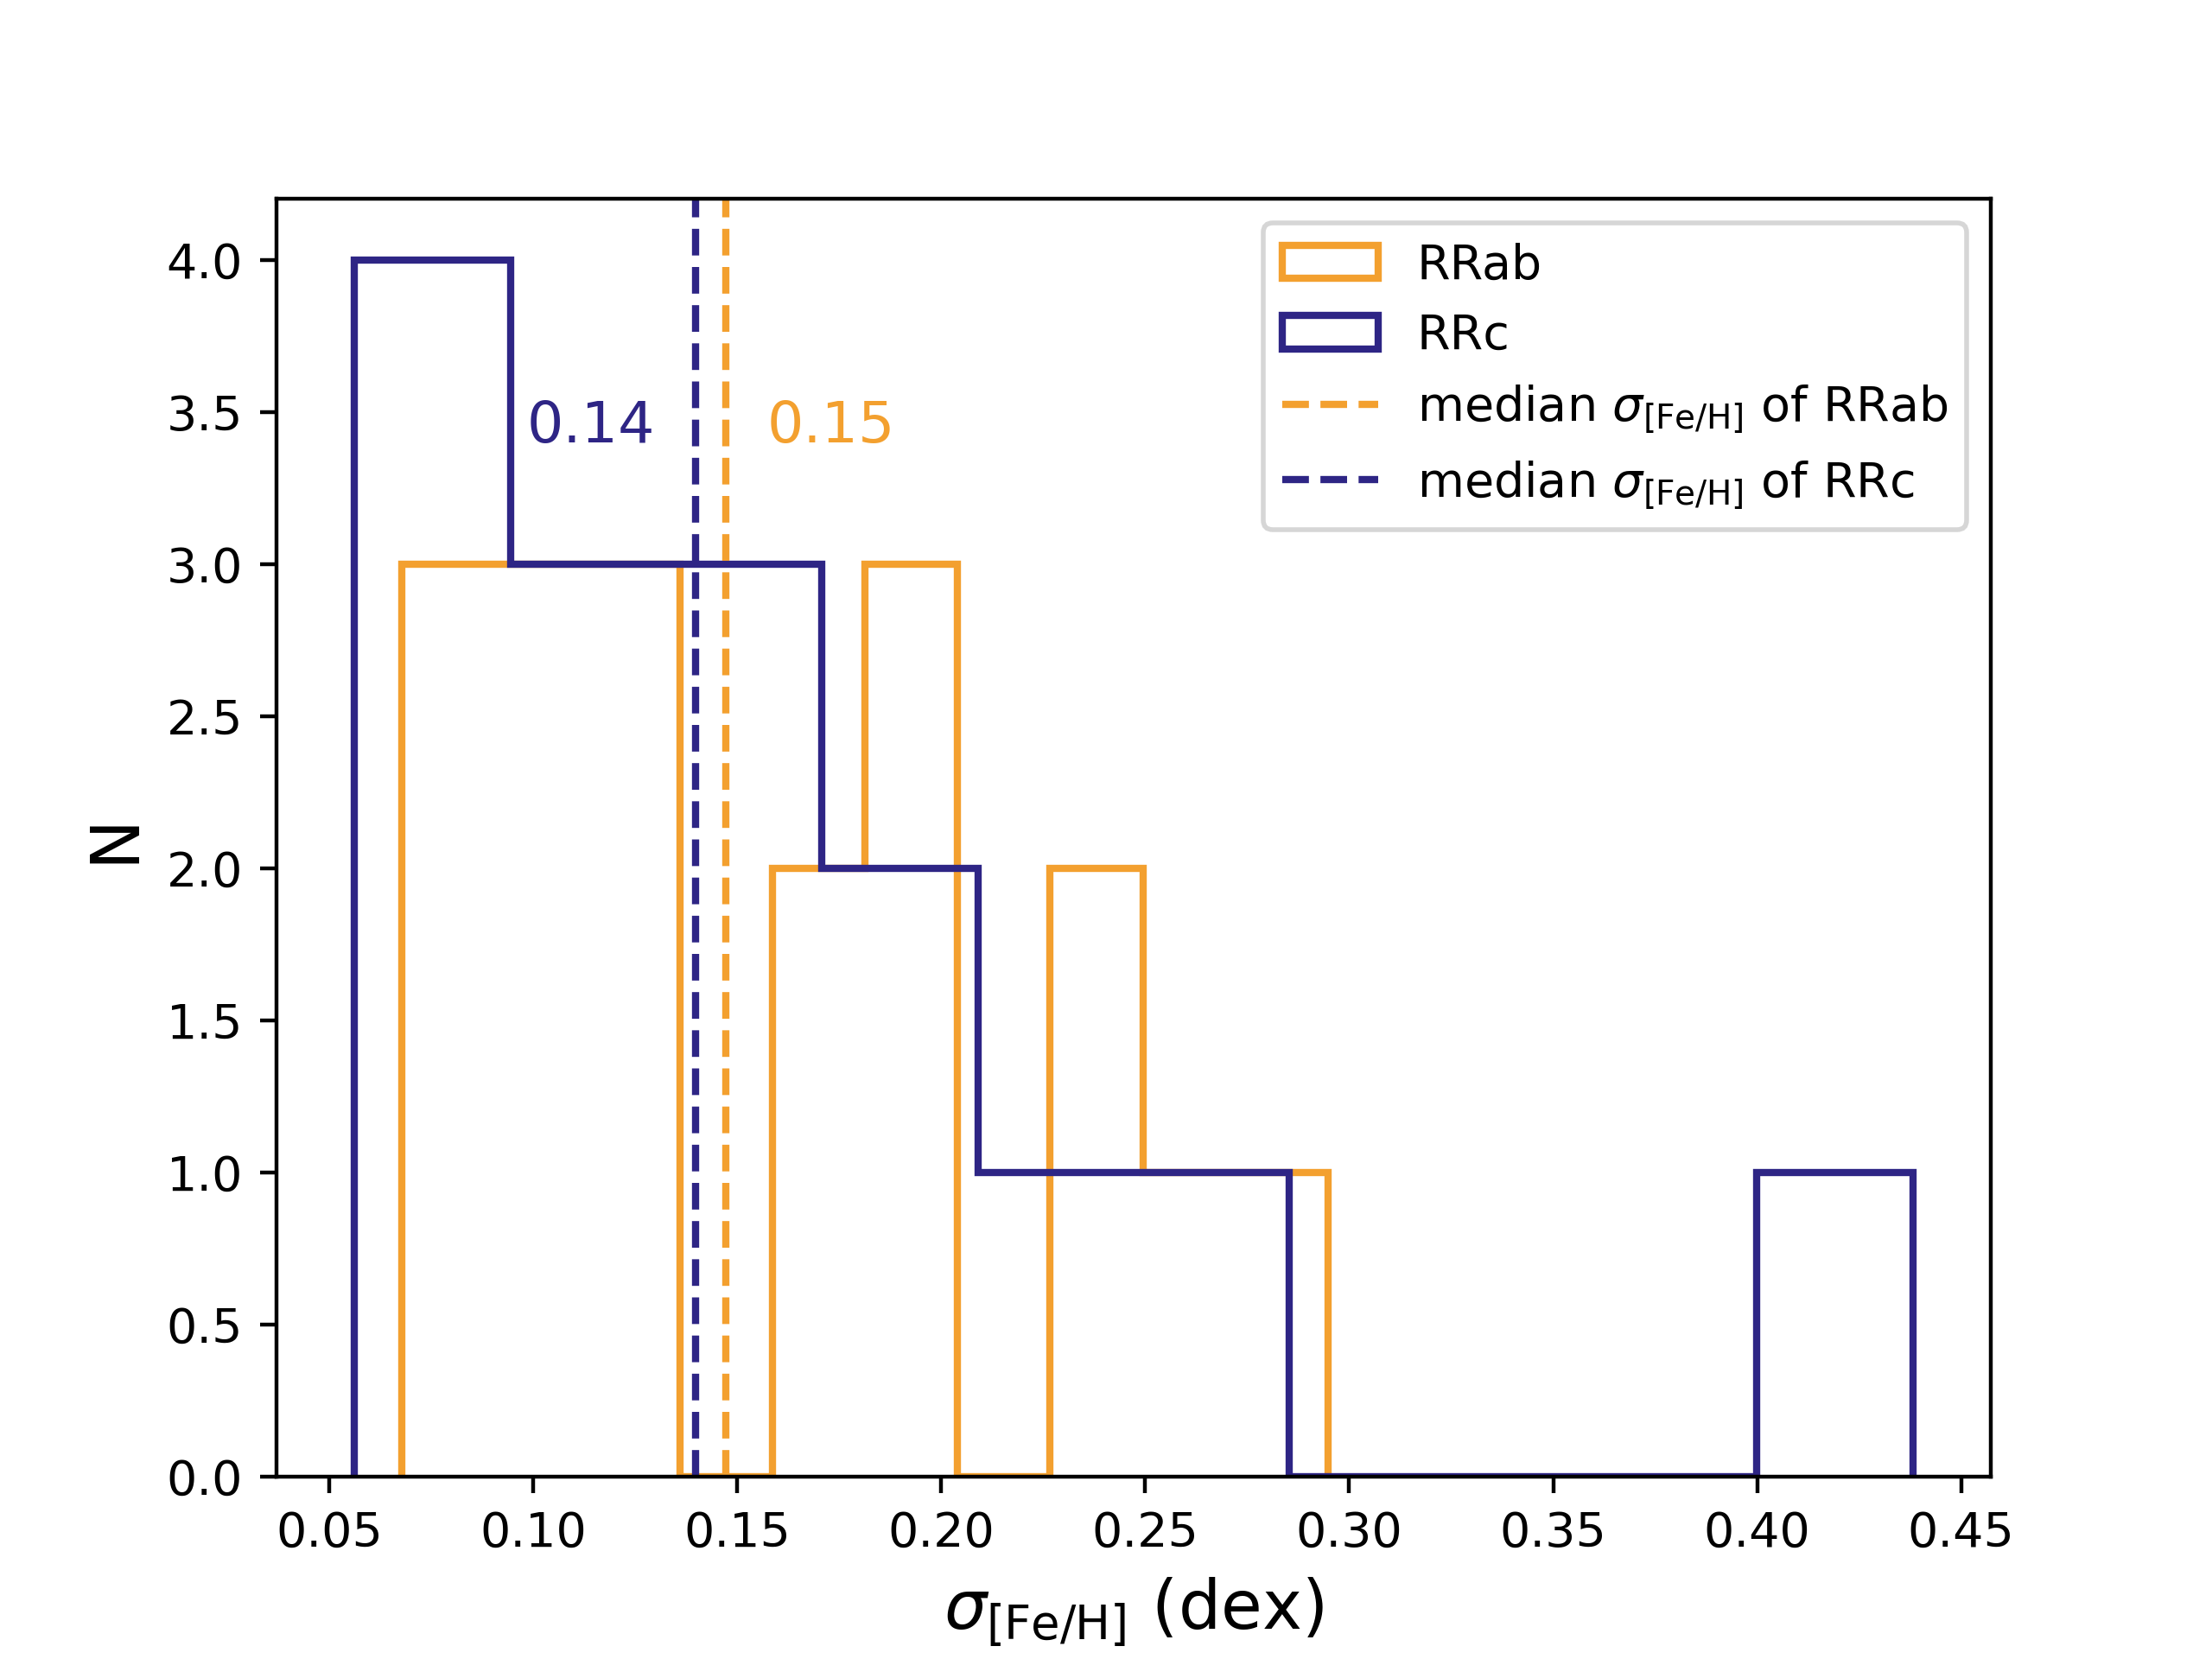
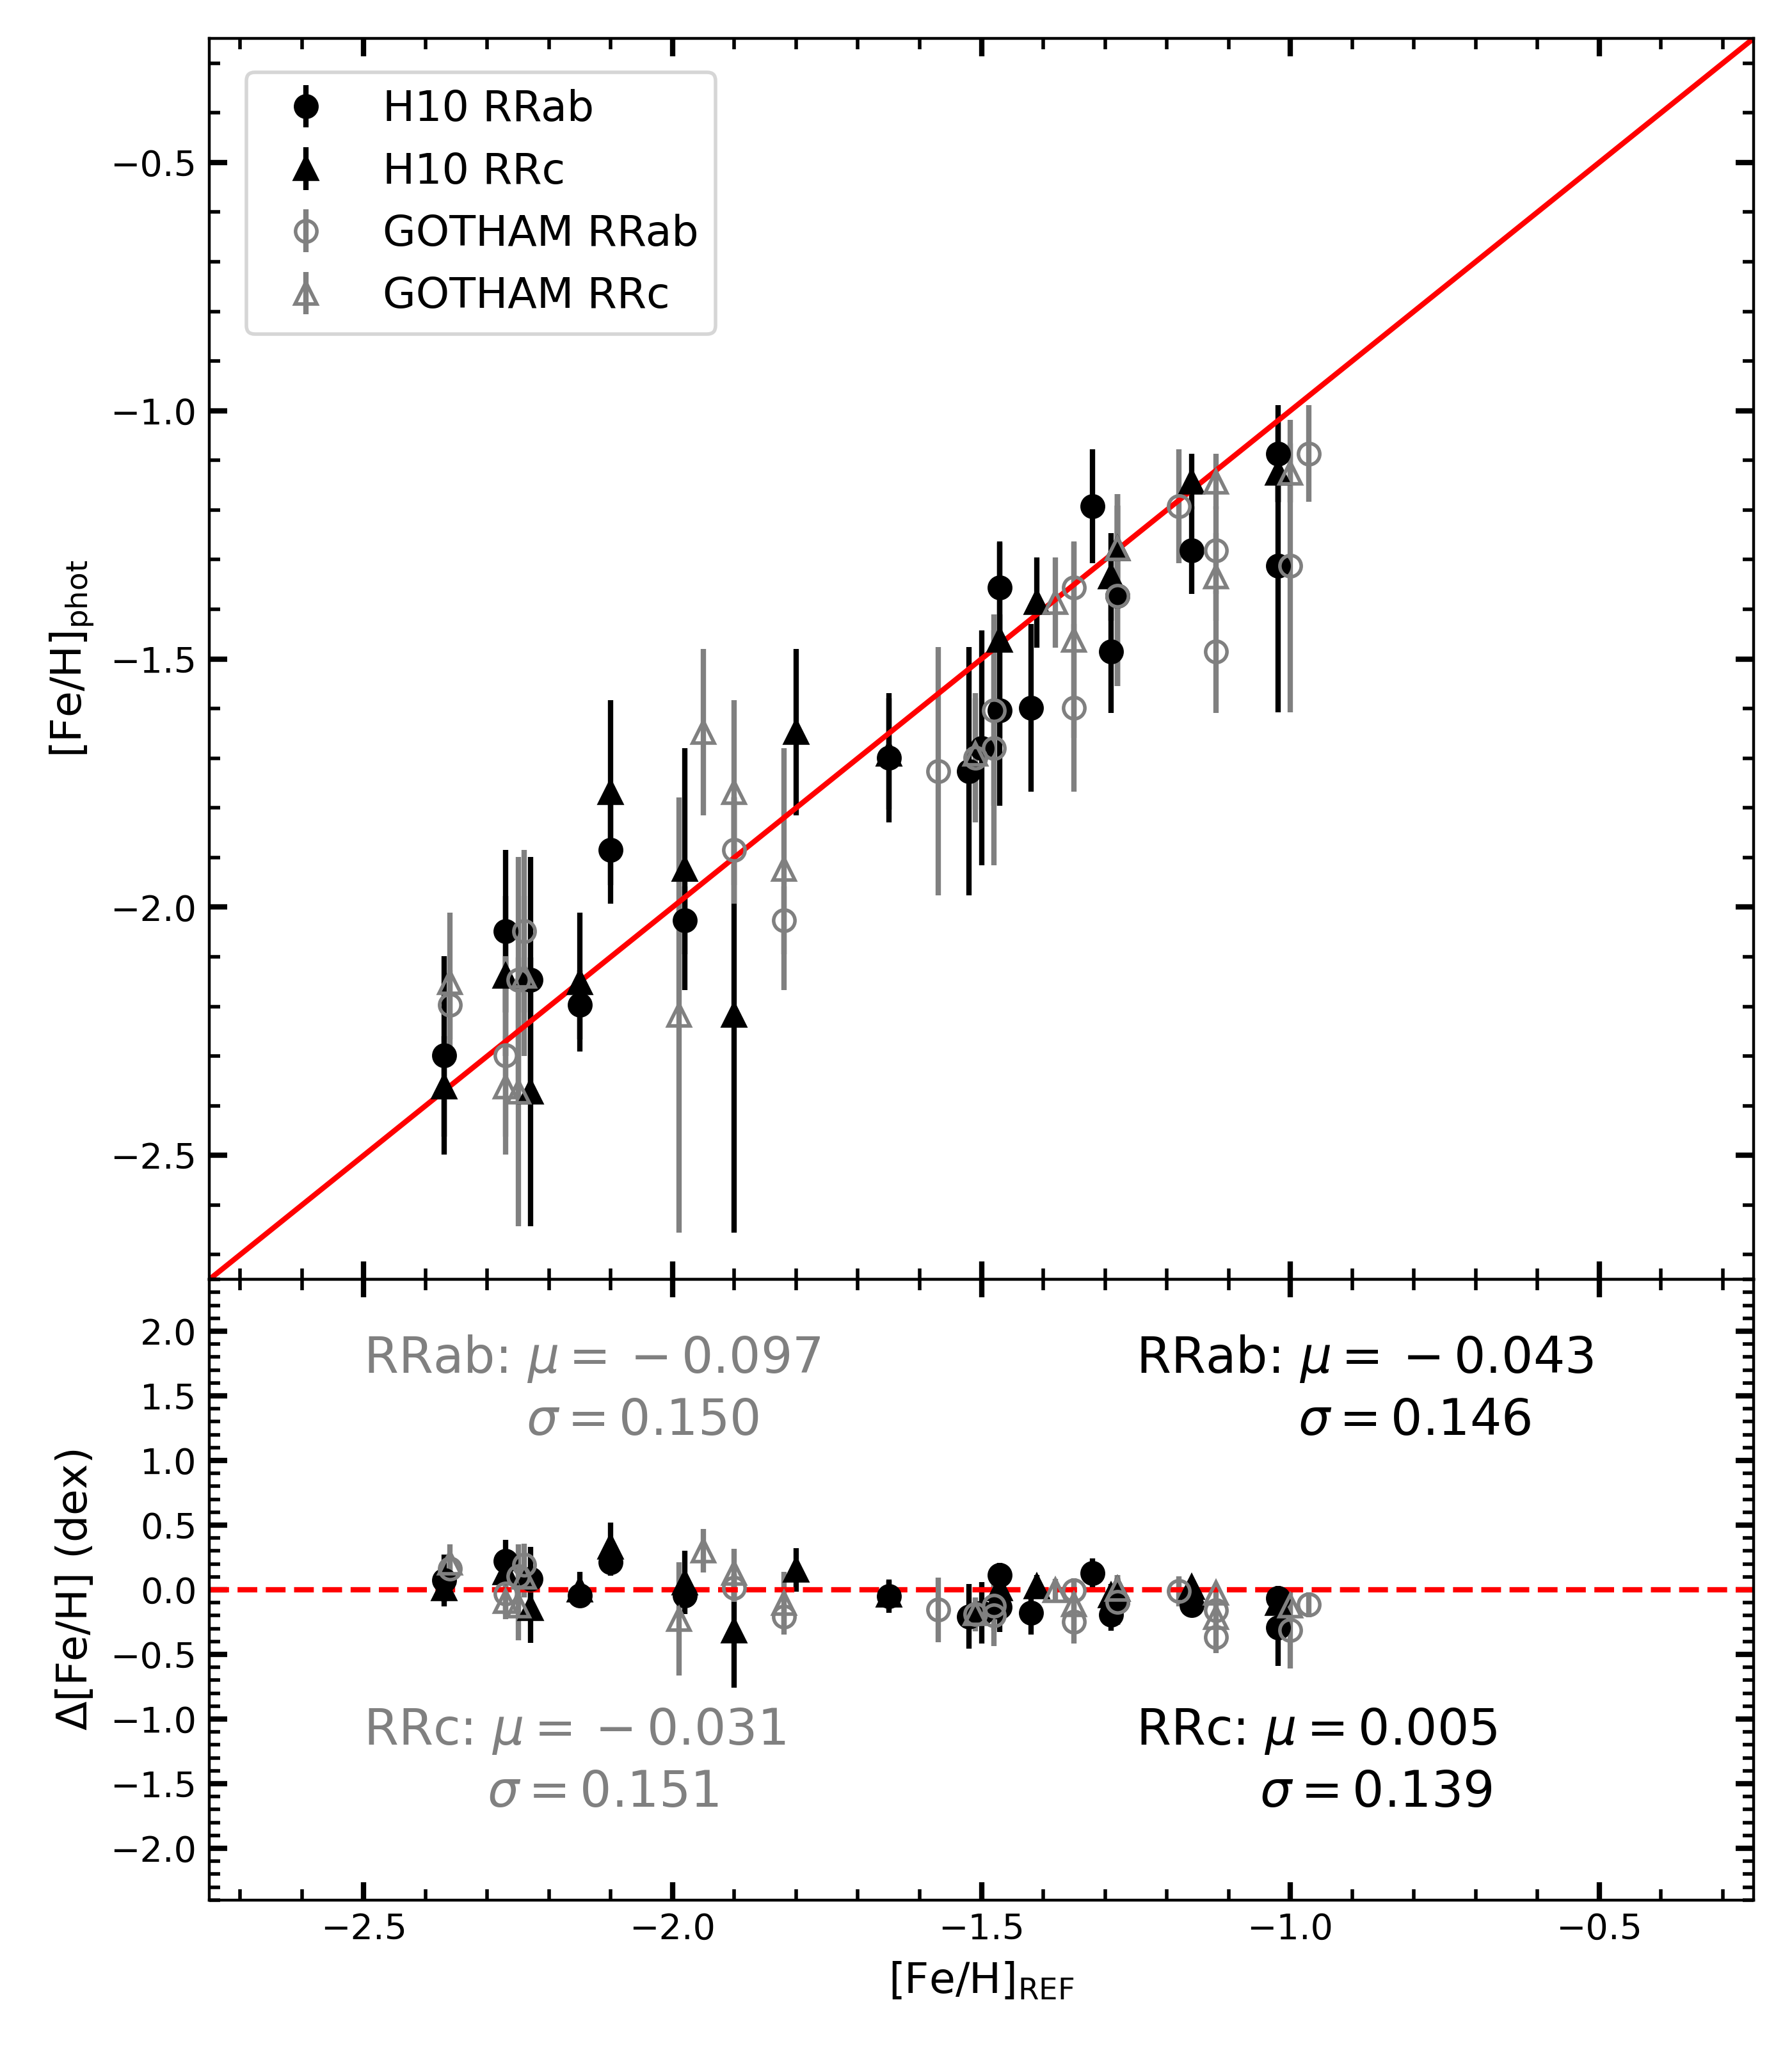
As shown in Figure 10, the typical uncertainties in metallicity ([Fe/H]_wei_TW) in this study are 0.15 dex for RRab stars in 18 GCs and 0.14 dex for RRc stars in 15 GCs. Table 4 lists the mean and uncertainty of the metallicity estimates, the member numbers used for calibration for each GC, as well as referenced metallicities from H10 and the GlObular clusTer Homogeneous Abundances Measurements (GOTHAM) survey (Dias et al. 2015, 2016a, 2016b; Vásquez et al. 2018). Our photometric-metallicity estimates, compared with referenced works, are shown in Figure 11. Our results closely match those of H10, with a small offset of 0.04 dex and a scatter of 0.15 dex for RRab stars, and a negligible offset of 0.005 dex and a scatter of 0.14 dex for RRc stars. In contrast, Li23 reports larger offsets of 0.09 and 0.12 dex, and larger scatters of 0.15 and 0.16 dex for RRab and RRc stars, respectively. Our performance is even superior to Li23 when compared with H10.
| Name | [Fe/H]H10 | [Fe/H]GOTHAM | [Fe/H]TW | N[Fe/H] | NPMZ | NPWZ | ||||
|---|---|---|---|---|---|---|---|---|---|---|
| (kpc) | (kpc) | (kpc) | (kpc) | |||||||
| RRab | ||||||||||
| NGC 4590 | 10 | 10 | 10 | |||||||
| NGC 5024 | 17 | 17 | 16 | |||||||
| NGC 5053 | 5 | 5 | 5 | |||||||
| NGC 5272 | 21 | 21 | 16 | |||||||
| NGC 5466 | 11 | 11 | 11 | |||||||
| NGC 5904 | 27 | 27 | 27 | |||||||
| NGC 6121 | 5 | 5 | – | – | ||||||
| NGC 6171 | 8 | 8 | 5 | |||||||
| NGC 6229 | 11 | 11 | 11 | |||||||
| NGC 6402 | 13 | 13 | 12 | |||||||
| NGC 6426 | 7 | 7 | 7 | |||||||
| NGC 6626 | 5 | 5 | 5 | |||||||
| NGC 6712 | 6 | 6 | 6 | |||||||
| NGC 6934 | 29 | 29 | 24 | |||||||
| NGC 6981 | 20 | 20 | 19 | |||||||
| NGC 7006 | 13 | 13 | 12 | |||||||
| NGC 7078 | 10 | 10 | 10 | |||||||
| NGC 7089 | 5 | 5 | – | – | ||||||
| RRc | ||||||||||
| NGC 4147 | 4 | 4 | 4 | |||||||
| NGC 4590 | 17 | 17 | 16 | |||||||
| NGC 5024 | 10 | 10 | 9 | |||||||
| NGC 5053 | 4 | 4 | 4 | |||||||
| NGC 5466 | 5 | 5 | 5 | |||||||
| NGC 5897 | 4 | 4 | – | – | ||||||
| NGC 5904 | 12 | 12 | 9 | |||||||
| NGC 6121 | 4 | 4 | 4 | |||||||
| NGC 6171 | 6 | 6 | 6 | |||||||
| NGC 6229 | 5 | 5 | 5 | |||||||
| NGC 6402 | 9 | 9 | 8 | |||||||
| NGC 6426 | 4 | 4 | 4 | |||||||
| NGC 7078 | 14 | 14 | 14 | |||||||
| NGC 7089 | 5 | 5 | 4 | |||||||
| Pal 5 | 8 | 8 | 8 | |||||||
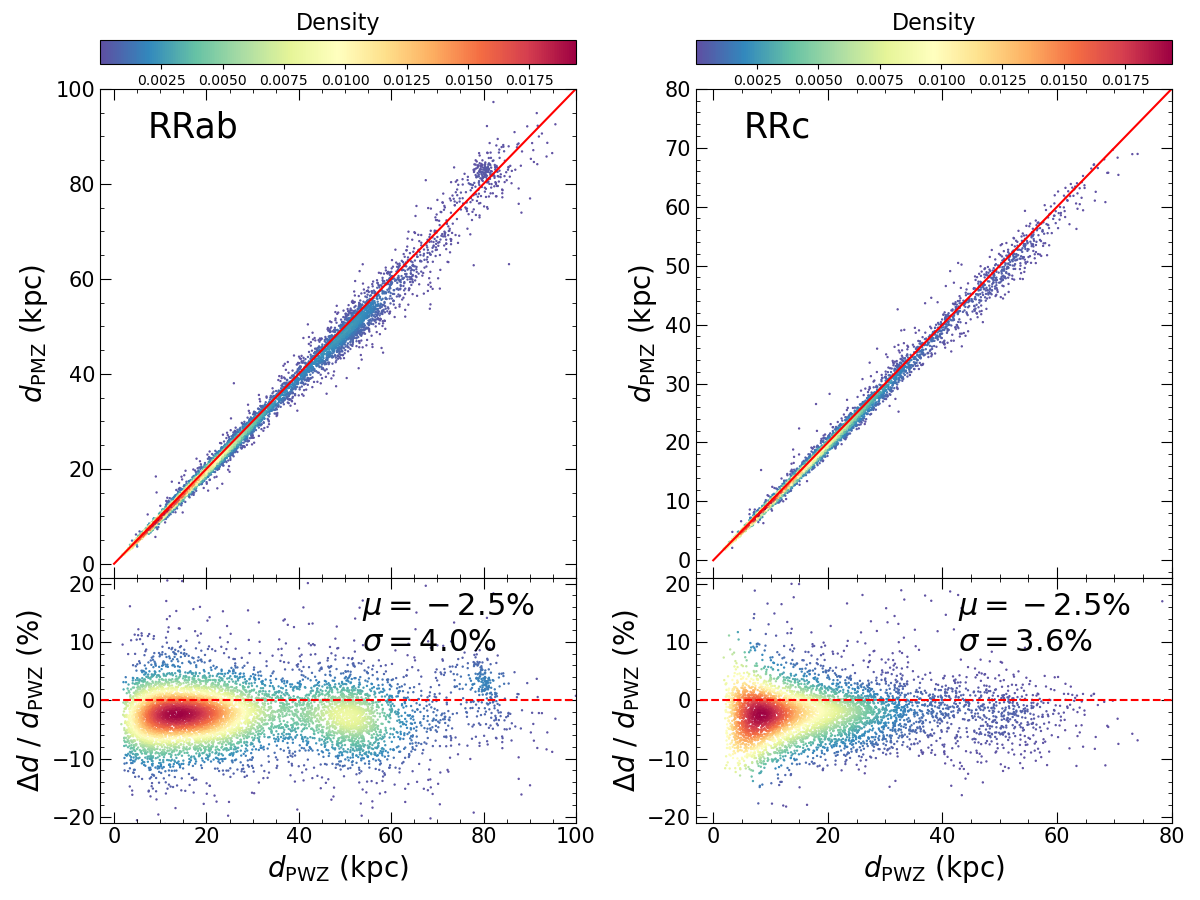
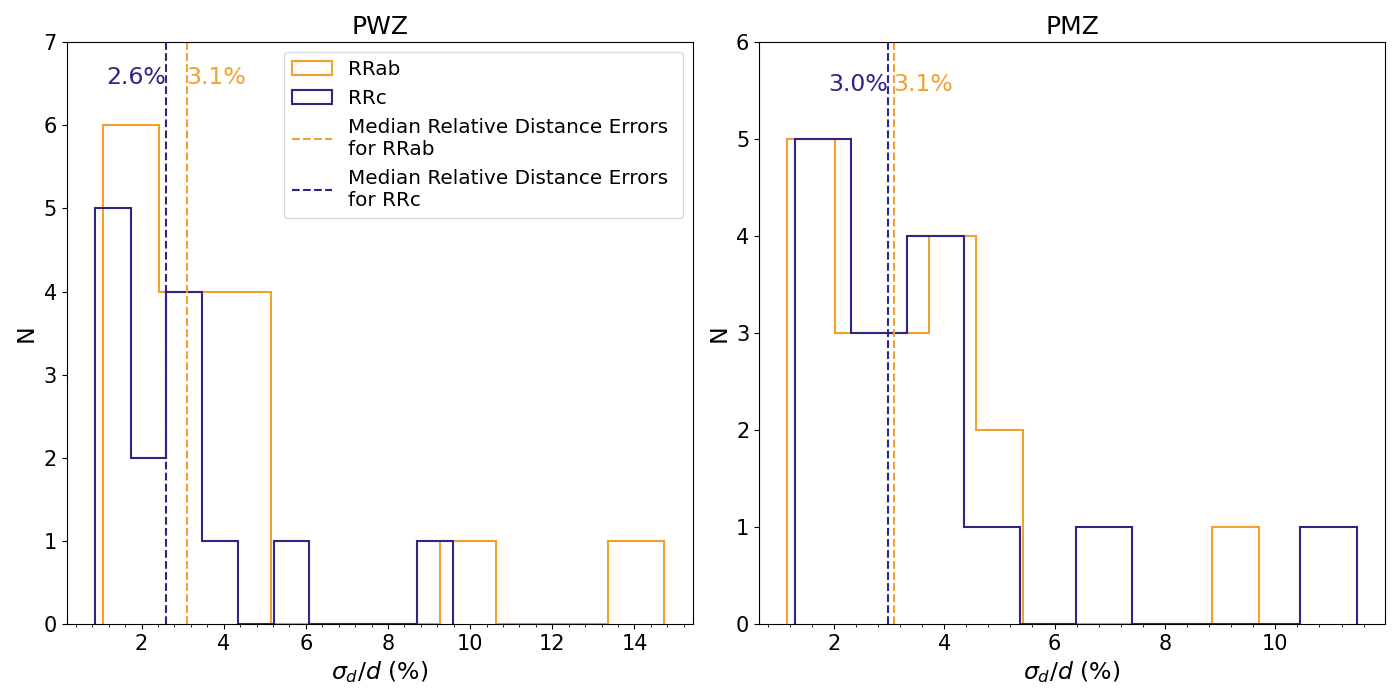
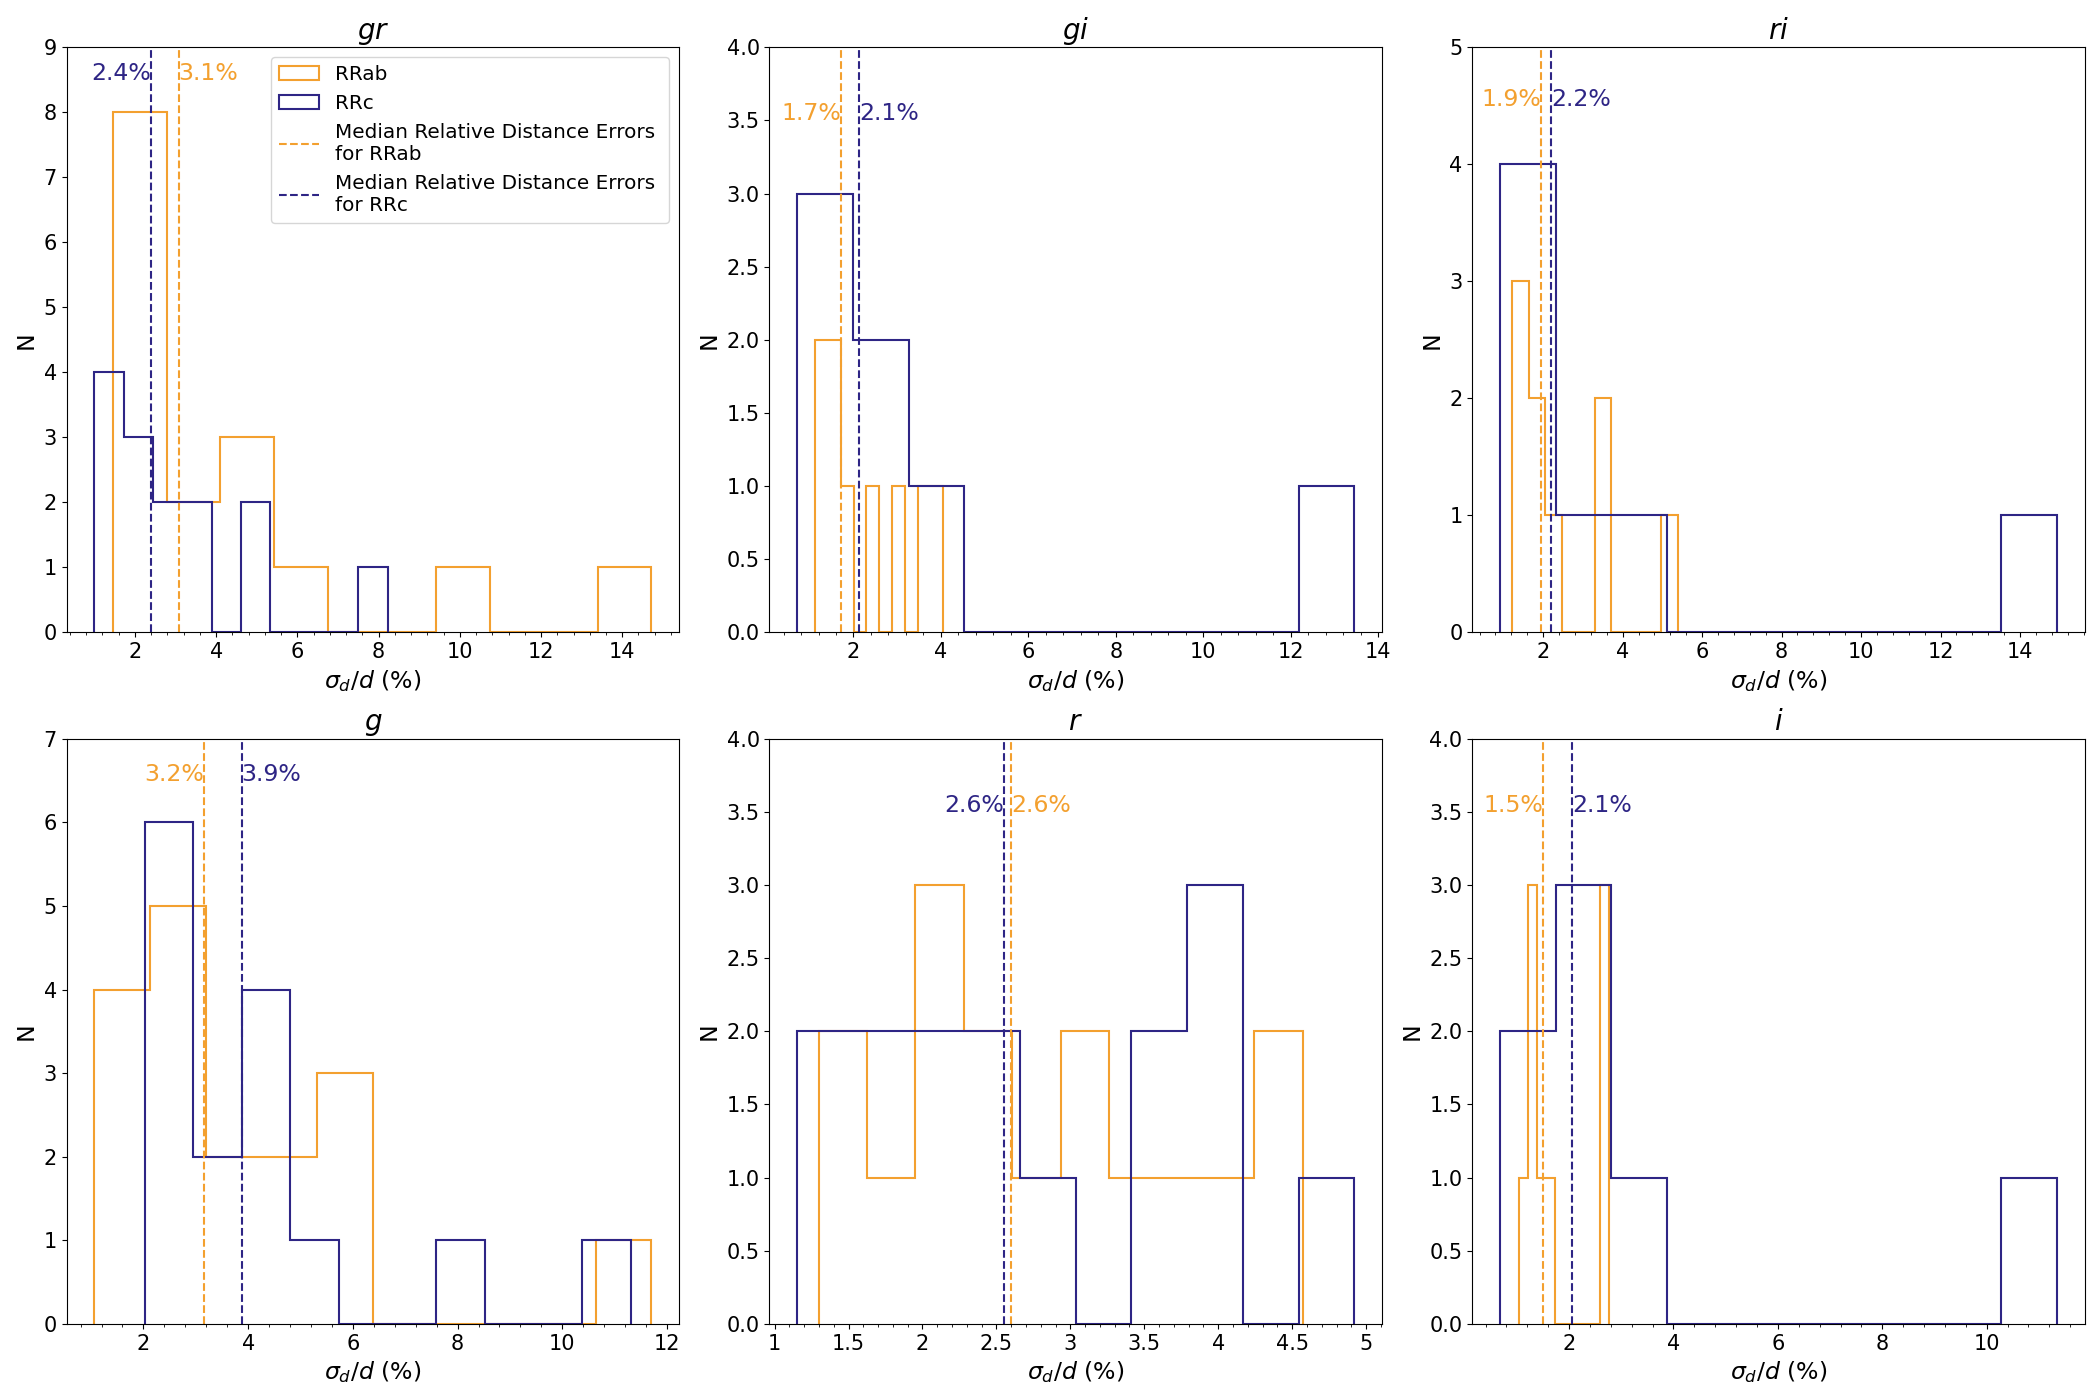
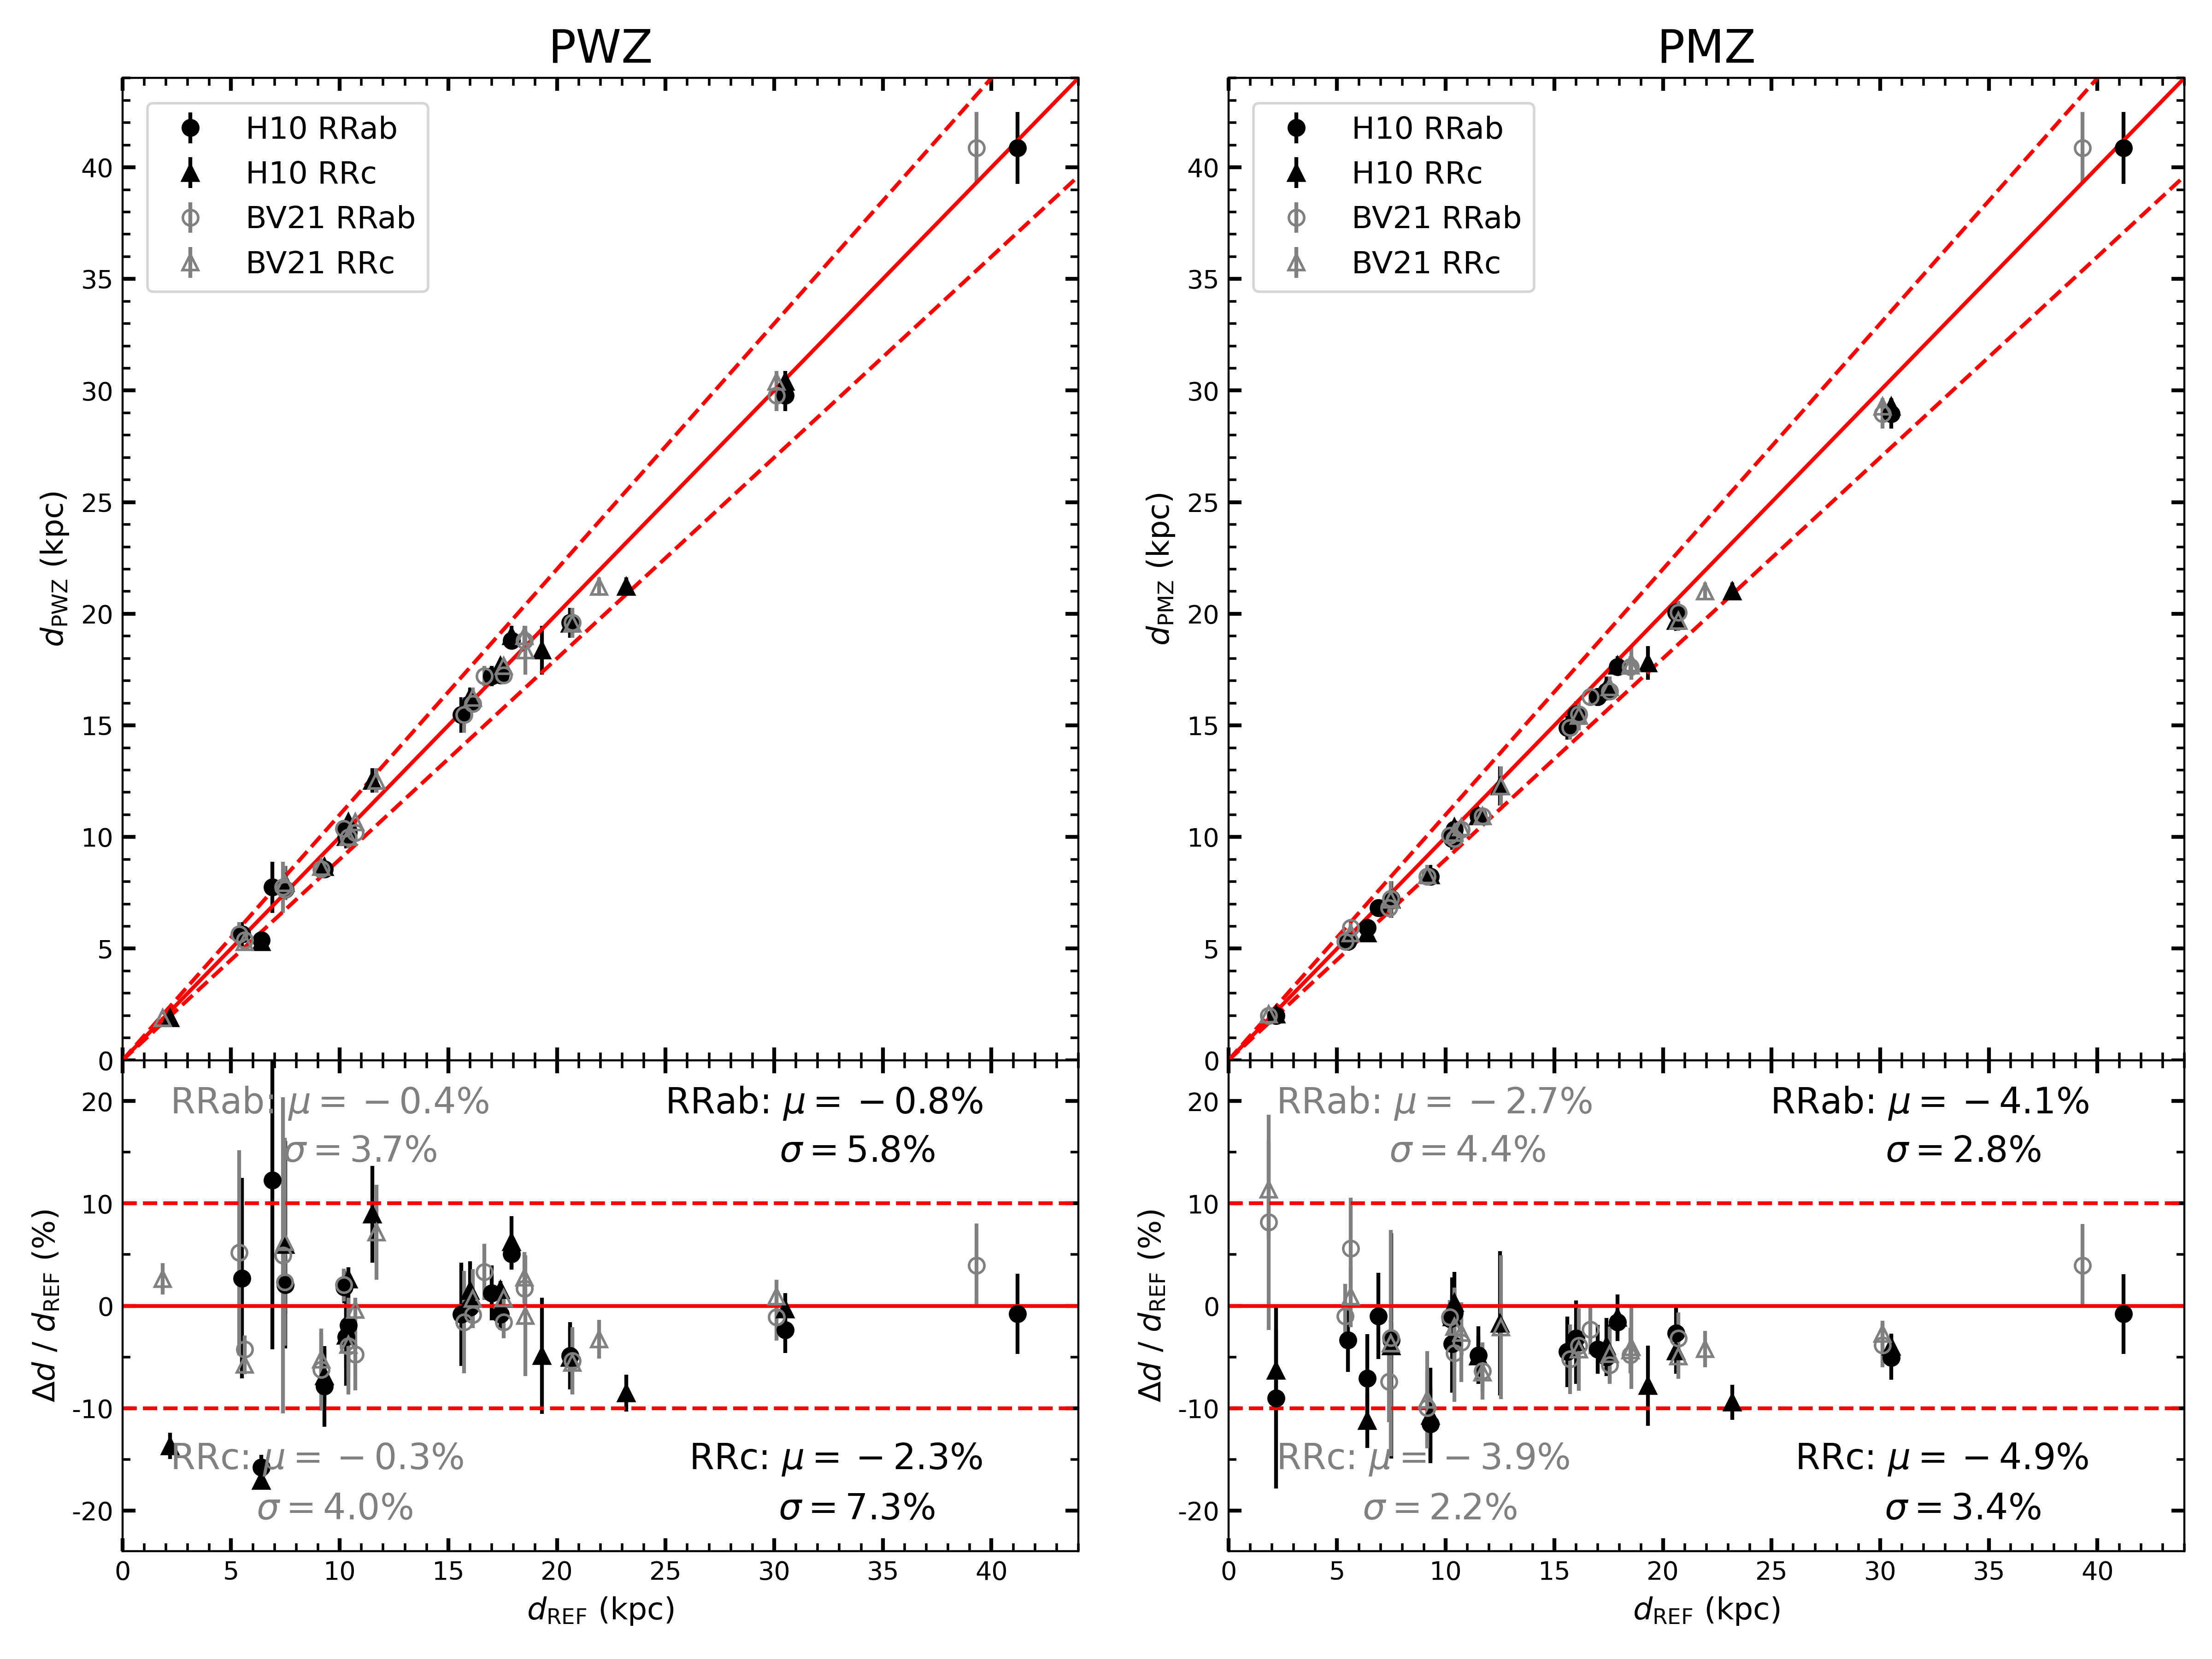
For the distance validation, we assessed the accuracy of the weighted average distances derived from the PMZ and PWZ relations, as shown in Figure 12. Using the PMZ relation, we validated the distances for 18 GCs for RRab and 15 GCs for RRc stars. The relative distance errors for RRab and RRc stars were mostly within 6% and 8%, with median errors of 3.1% and 3.0%. With the PWZ relation, we validated the distances for 16 GCs for RRab and 14 GCs for RRc stars. The relative distance errors for RRab and RRc stars were mostly within 10% and 6%, with median errors of 3.1% and 2.6%, respectively. Additional results for single-band or band-pair relations are shown in Appendix Figure A.15. The calculated distance are listed in Table 4, and summarized in Table 5.
|
Distance |
(%)a | Nb |
|---|---|---|
| 3.2 /3.9 | 17 /15 | |
| 2.6 /2.6 | 16 /15 | |
| 1.5 /2.1 | 9 /7 | |
| 3.1 /2.4 | 16 /14 | |
| 1.7 /2.1 | 9 /7 | |
| 1.9 /2.2 | 9 /7 | |
| 3.1 /3.0 | 18/15 | |
| 3.1 /2.6 | 16/14 |
-
a
Relative-distance errors are shown, with left values for RRab stars and right values for RRc stars.
-
b
Number of GCs used for distance-accuracy validation, with left values for RRab stars and right values for RRc stars.
-
c
Weighted average distances based on PMZ relations across the -bands.
-
d
Weighted average distances based on PWZ relations across -, -, and -band pairs.
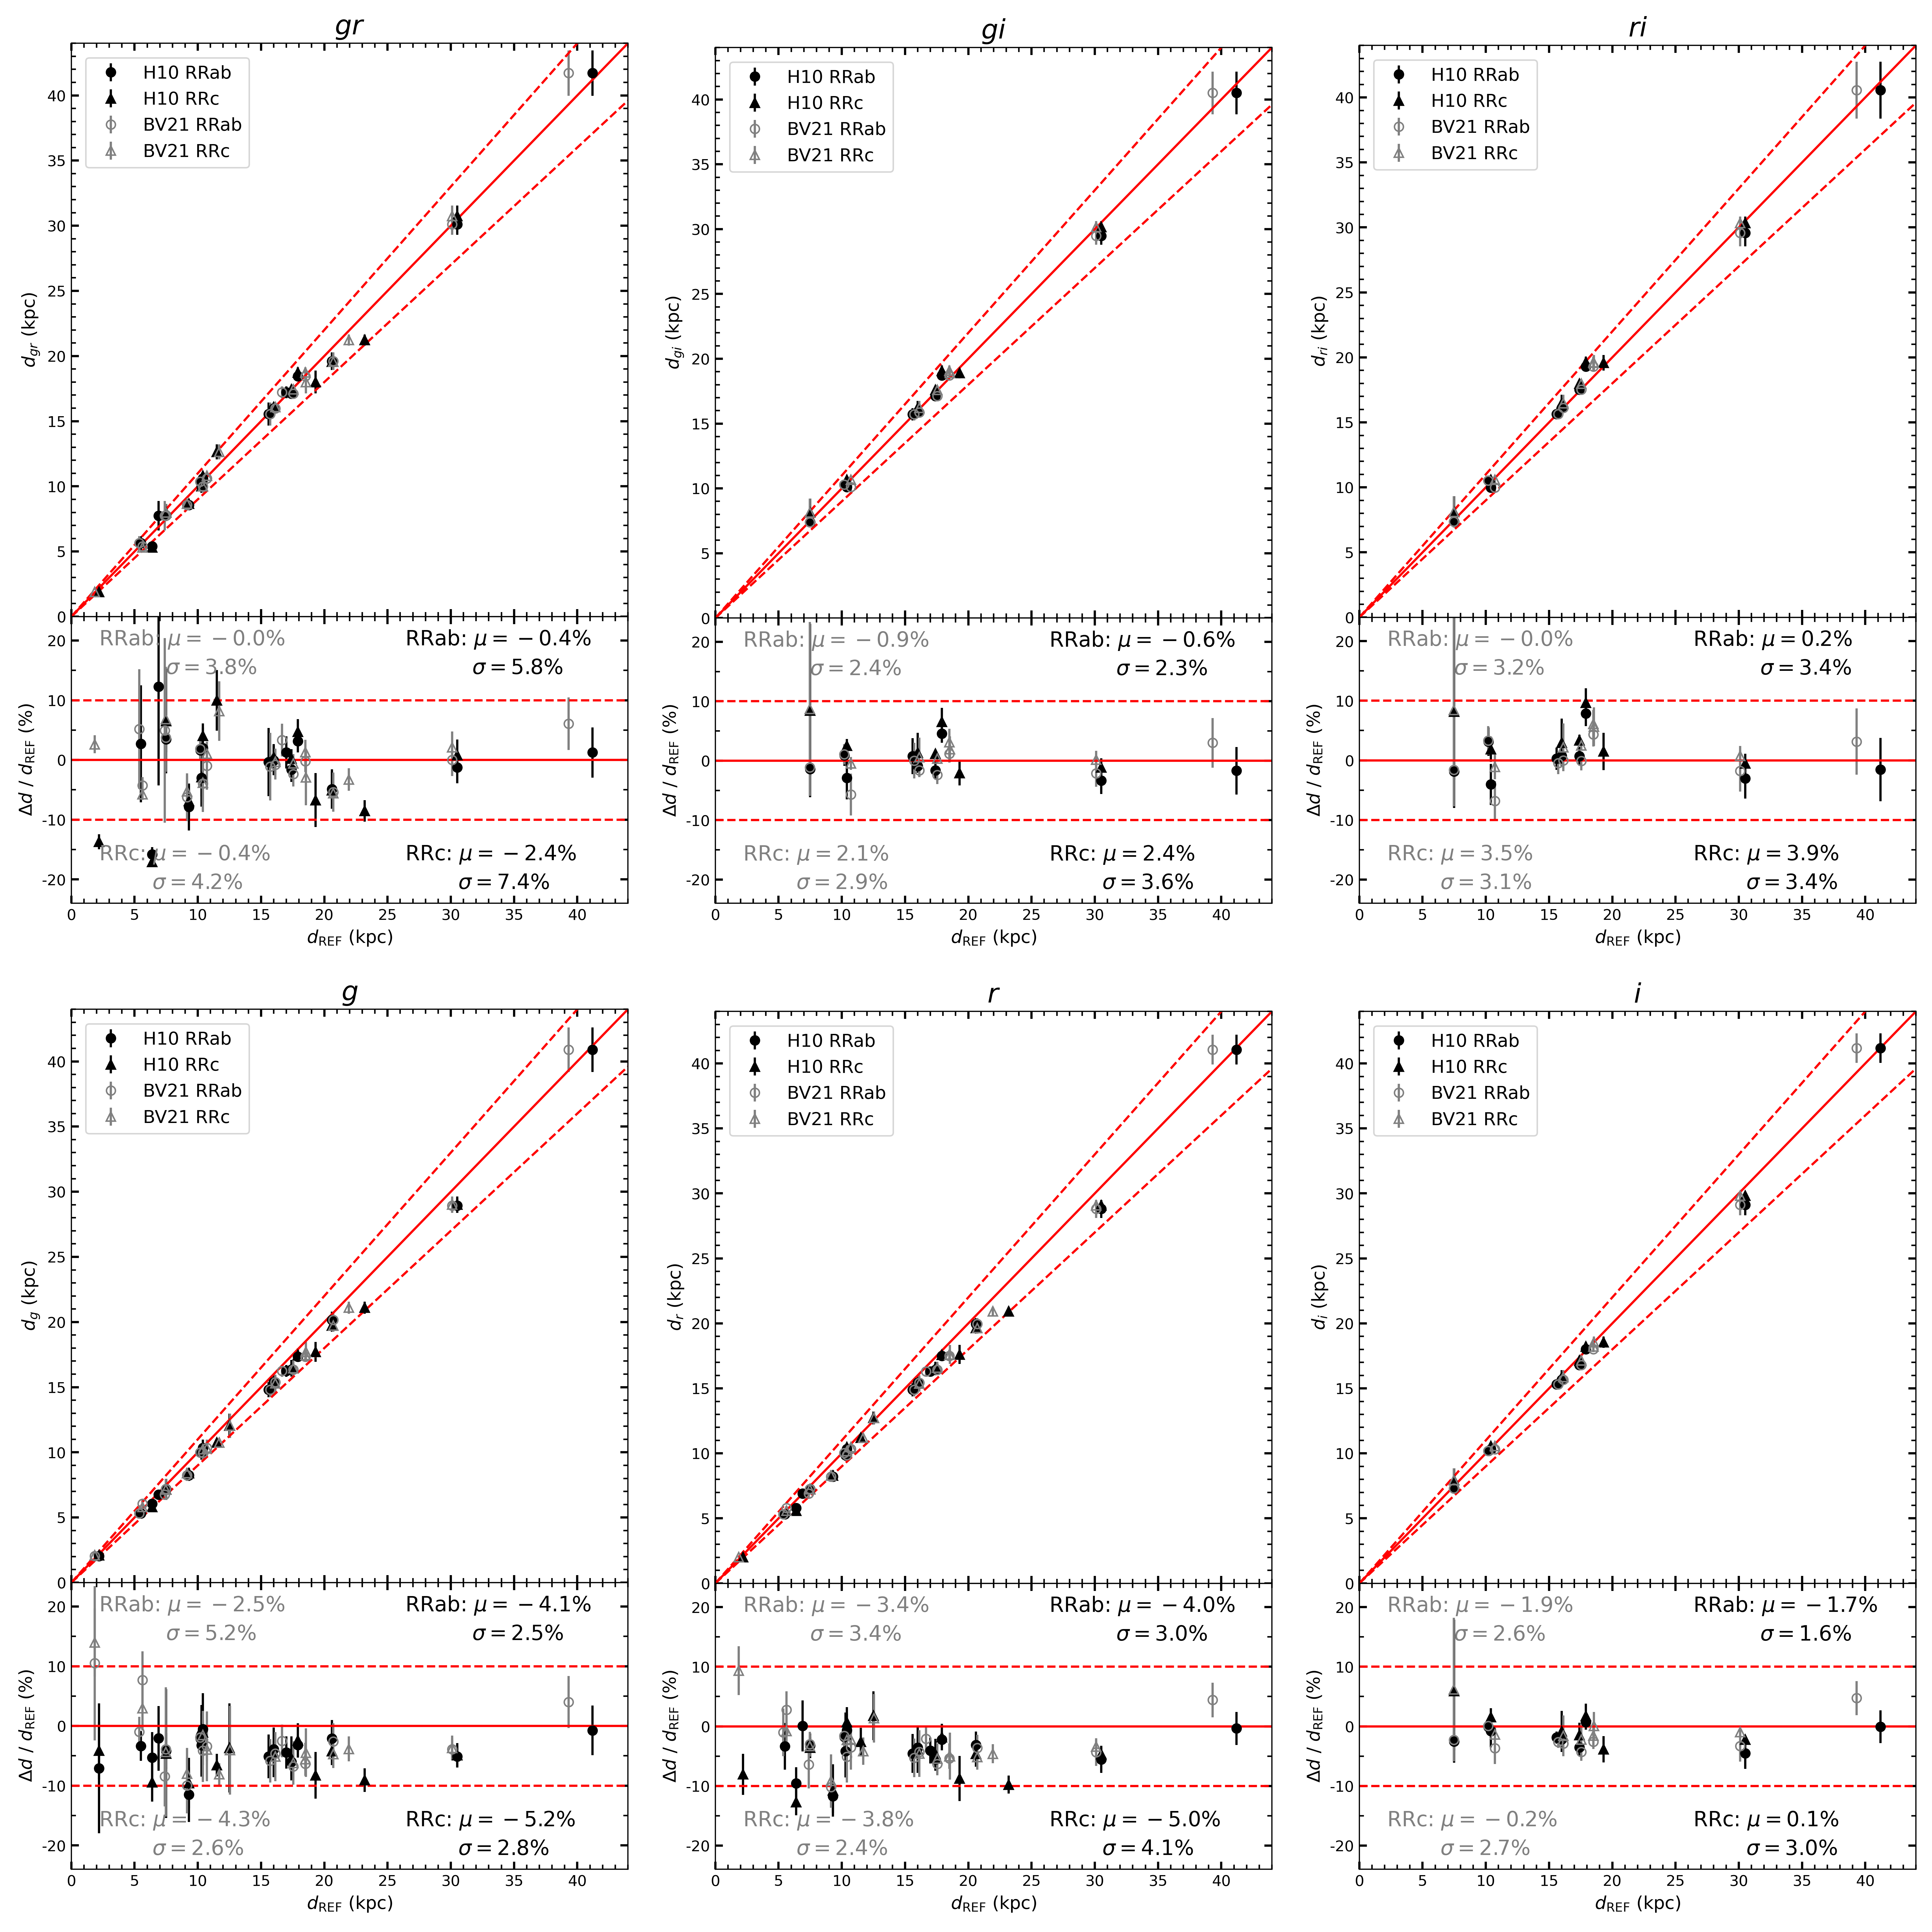
We also compared our distances with those of BV21 and H10, as shown in Appendix Figure A.16. The distances used from BV21 represent the mean of uniform scale distances derived from multiple independent measurements. In contrast, H10’s distances are primarily based on the mean magnitude of the horizontal branch of GCs provided by the references. Based on the mean offsets and scatters of relative distance differences, our derived distances for GCs exhibit better agreement with BV21 than with H10. This is particularly true for the PWZ relations, which demonstrate negligible mean offsets of 0.4% for RRab and 0.3% for RRc stars, along with small scatters of 3.7% and 4.0%, respectively. Similar scatters are observed in the PMZ relations, but mild overall offsets are evident, with 2.7% for RRab and 3.9% for RRc stars. Considering the small values of GCs, this suggests that the PMZ relation may have systematic offsets during its calibration process. Therefore, the recommended choice for distance estimates is to use values calculated from PWZ relations for sample stars that have two distinct distance estimates. Similarly, additional comparisons for single-band or band-pair relations are shown in Appendix Figure A.17.
5. Final Catalog
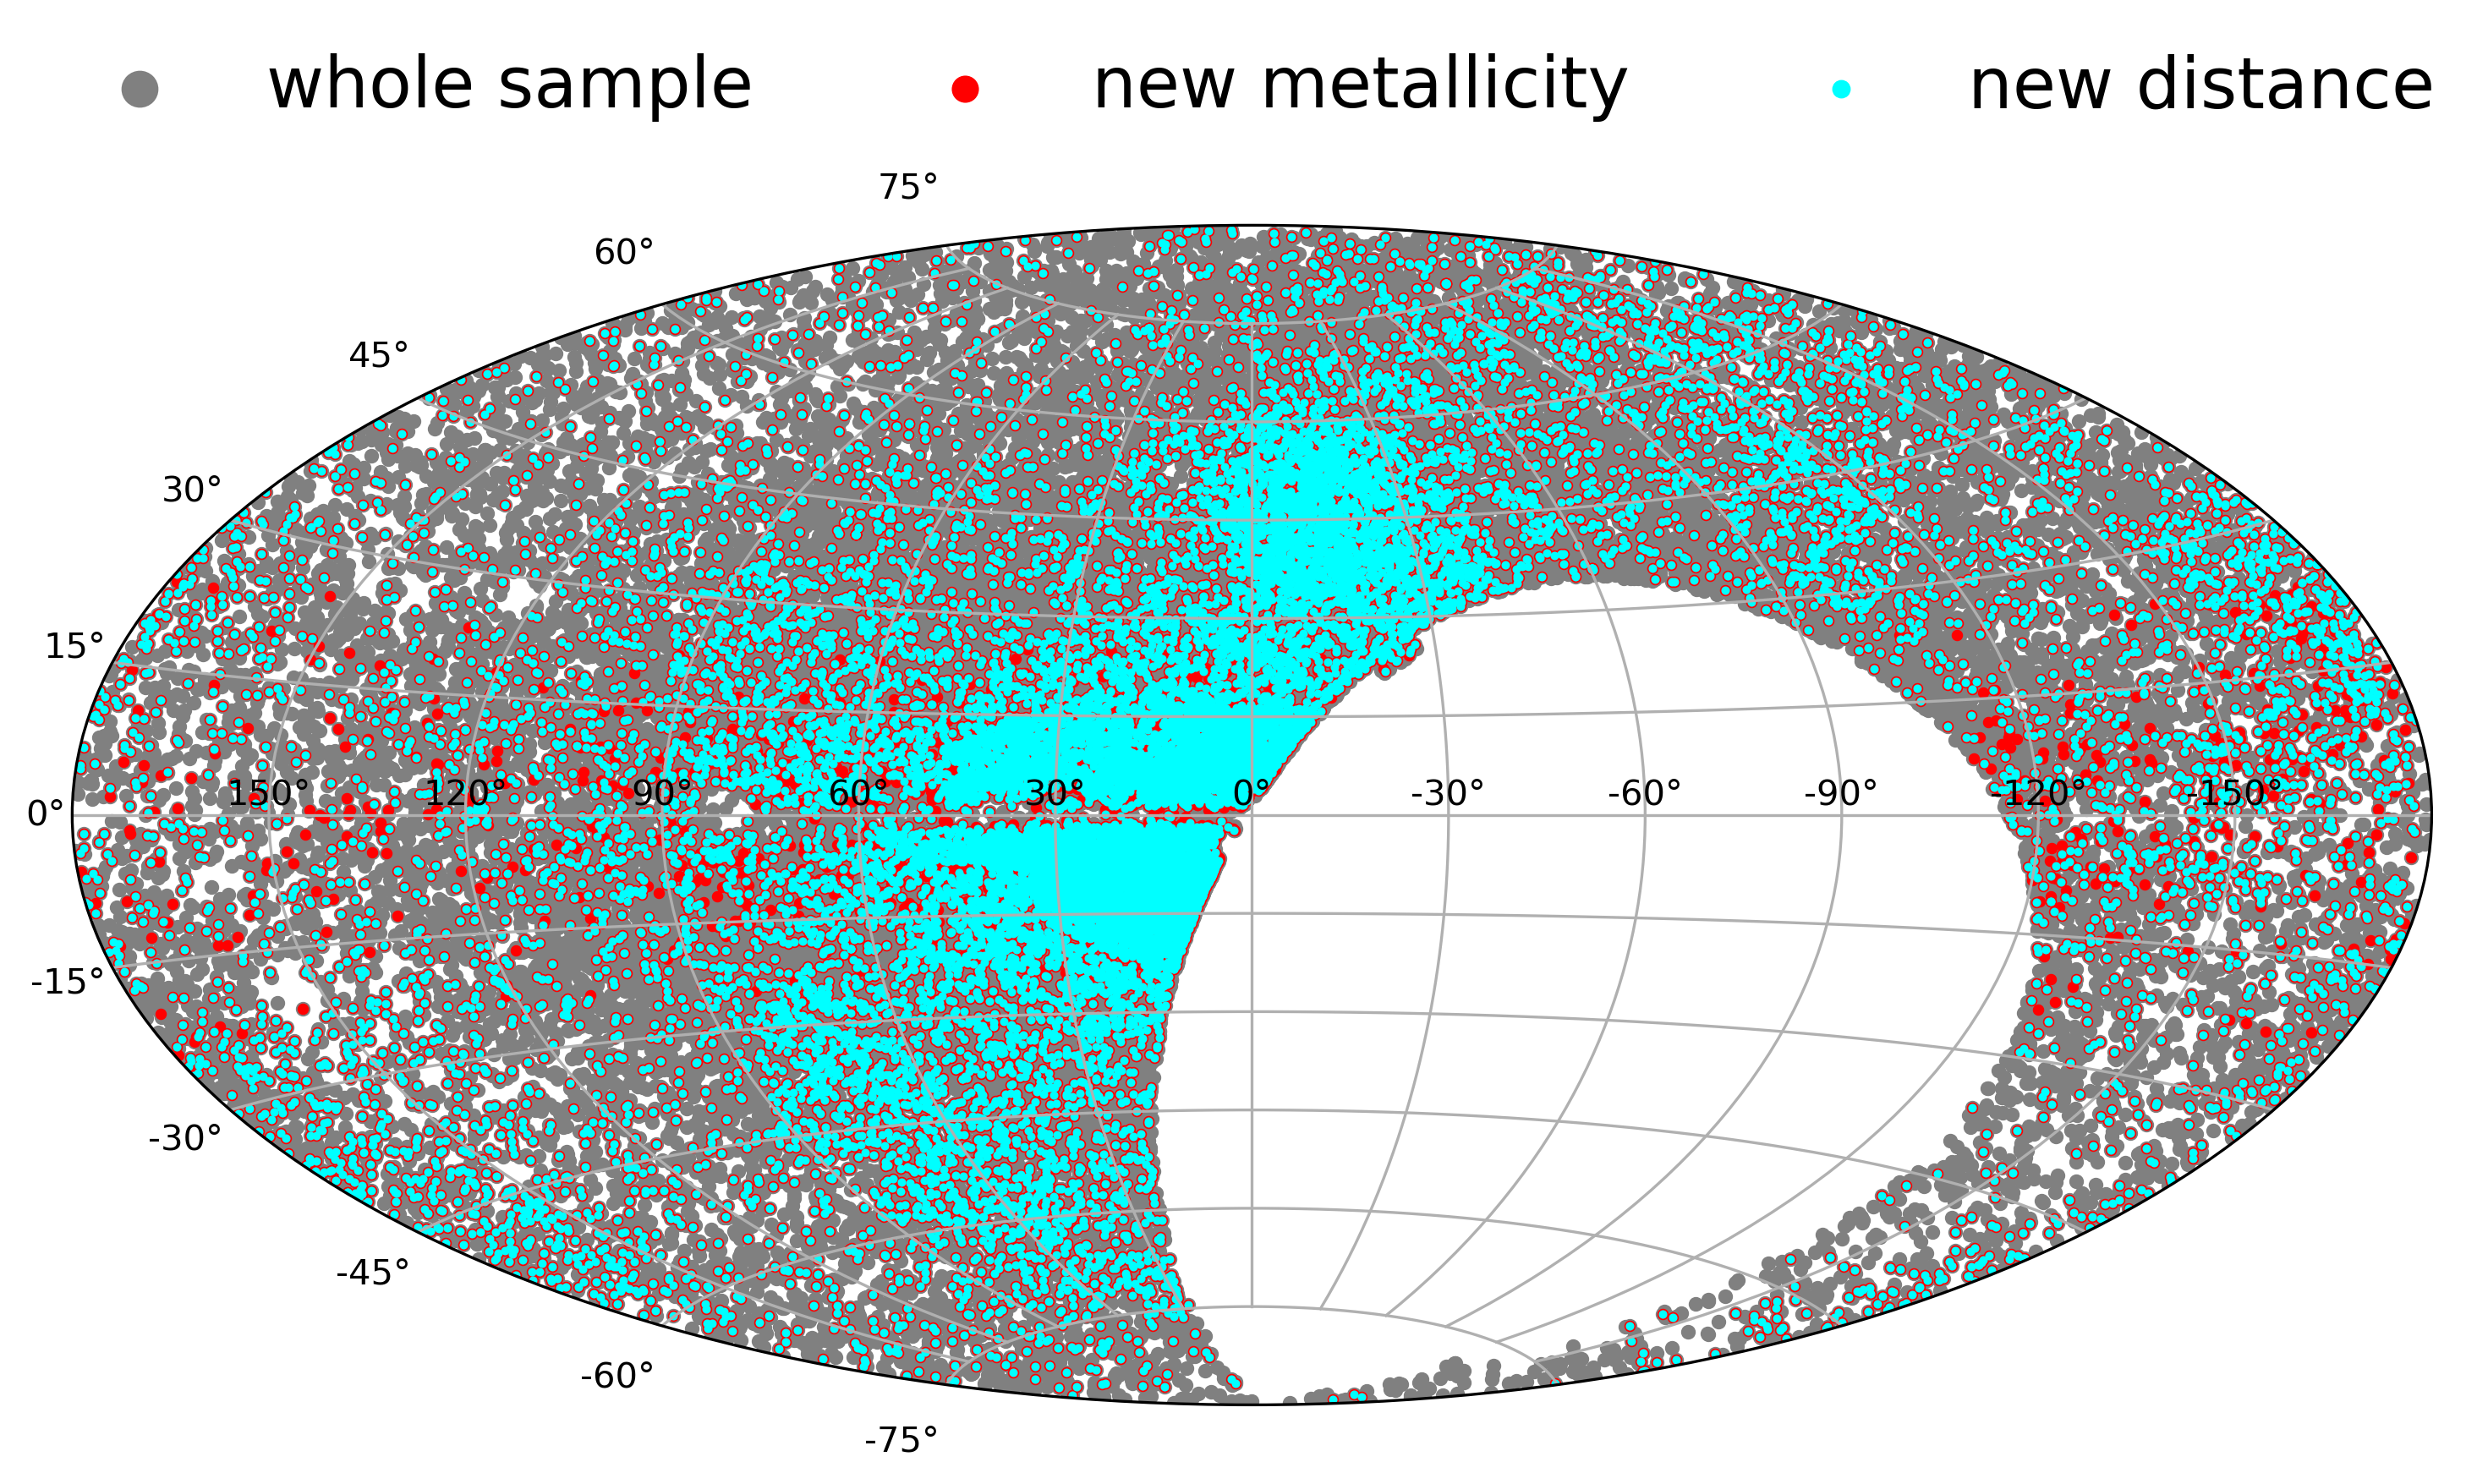
Our final catalog includes the ZTF_RRL_ALL sample, comprising 73,795 sample stars (52,571 RRab and 21,224 RRc stars) with photometric-metallicity estimates from the newly calibrated and relations. Over 95% of the sample stars (70,560 in total; 52,050 RRab stars and 18,510 RRc stars) have accurate distance measurements from our PMZ/PWZ relations. By cross-matching with Li23’s work, we derived 25,439 sample stars (34% of the total sample) that filled in the metallicity parameters and 22,937 sample stars (33% of the total sample) that filled in the distance parameters. The sky distribution of the entire sample, as well as those with initially derived metallicity and distance, is shown in Figure 13.
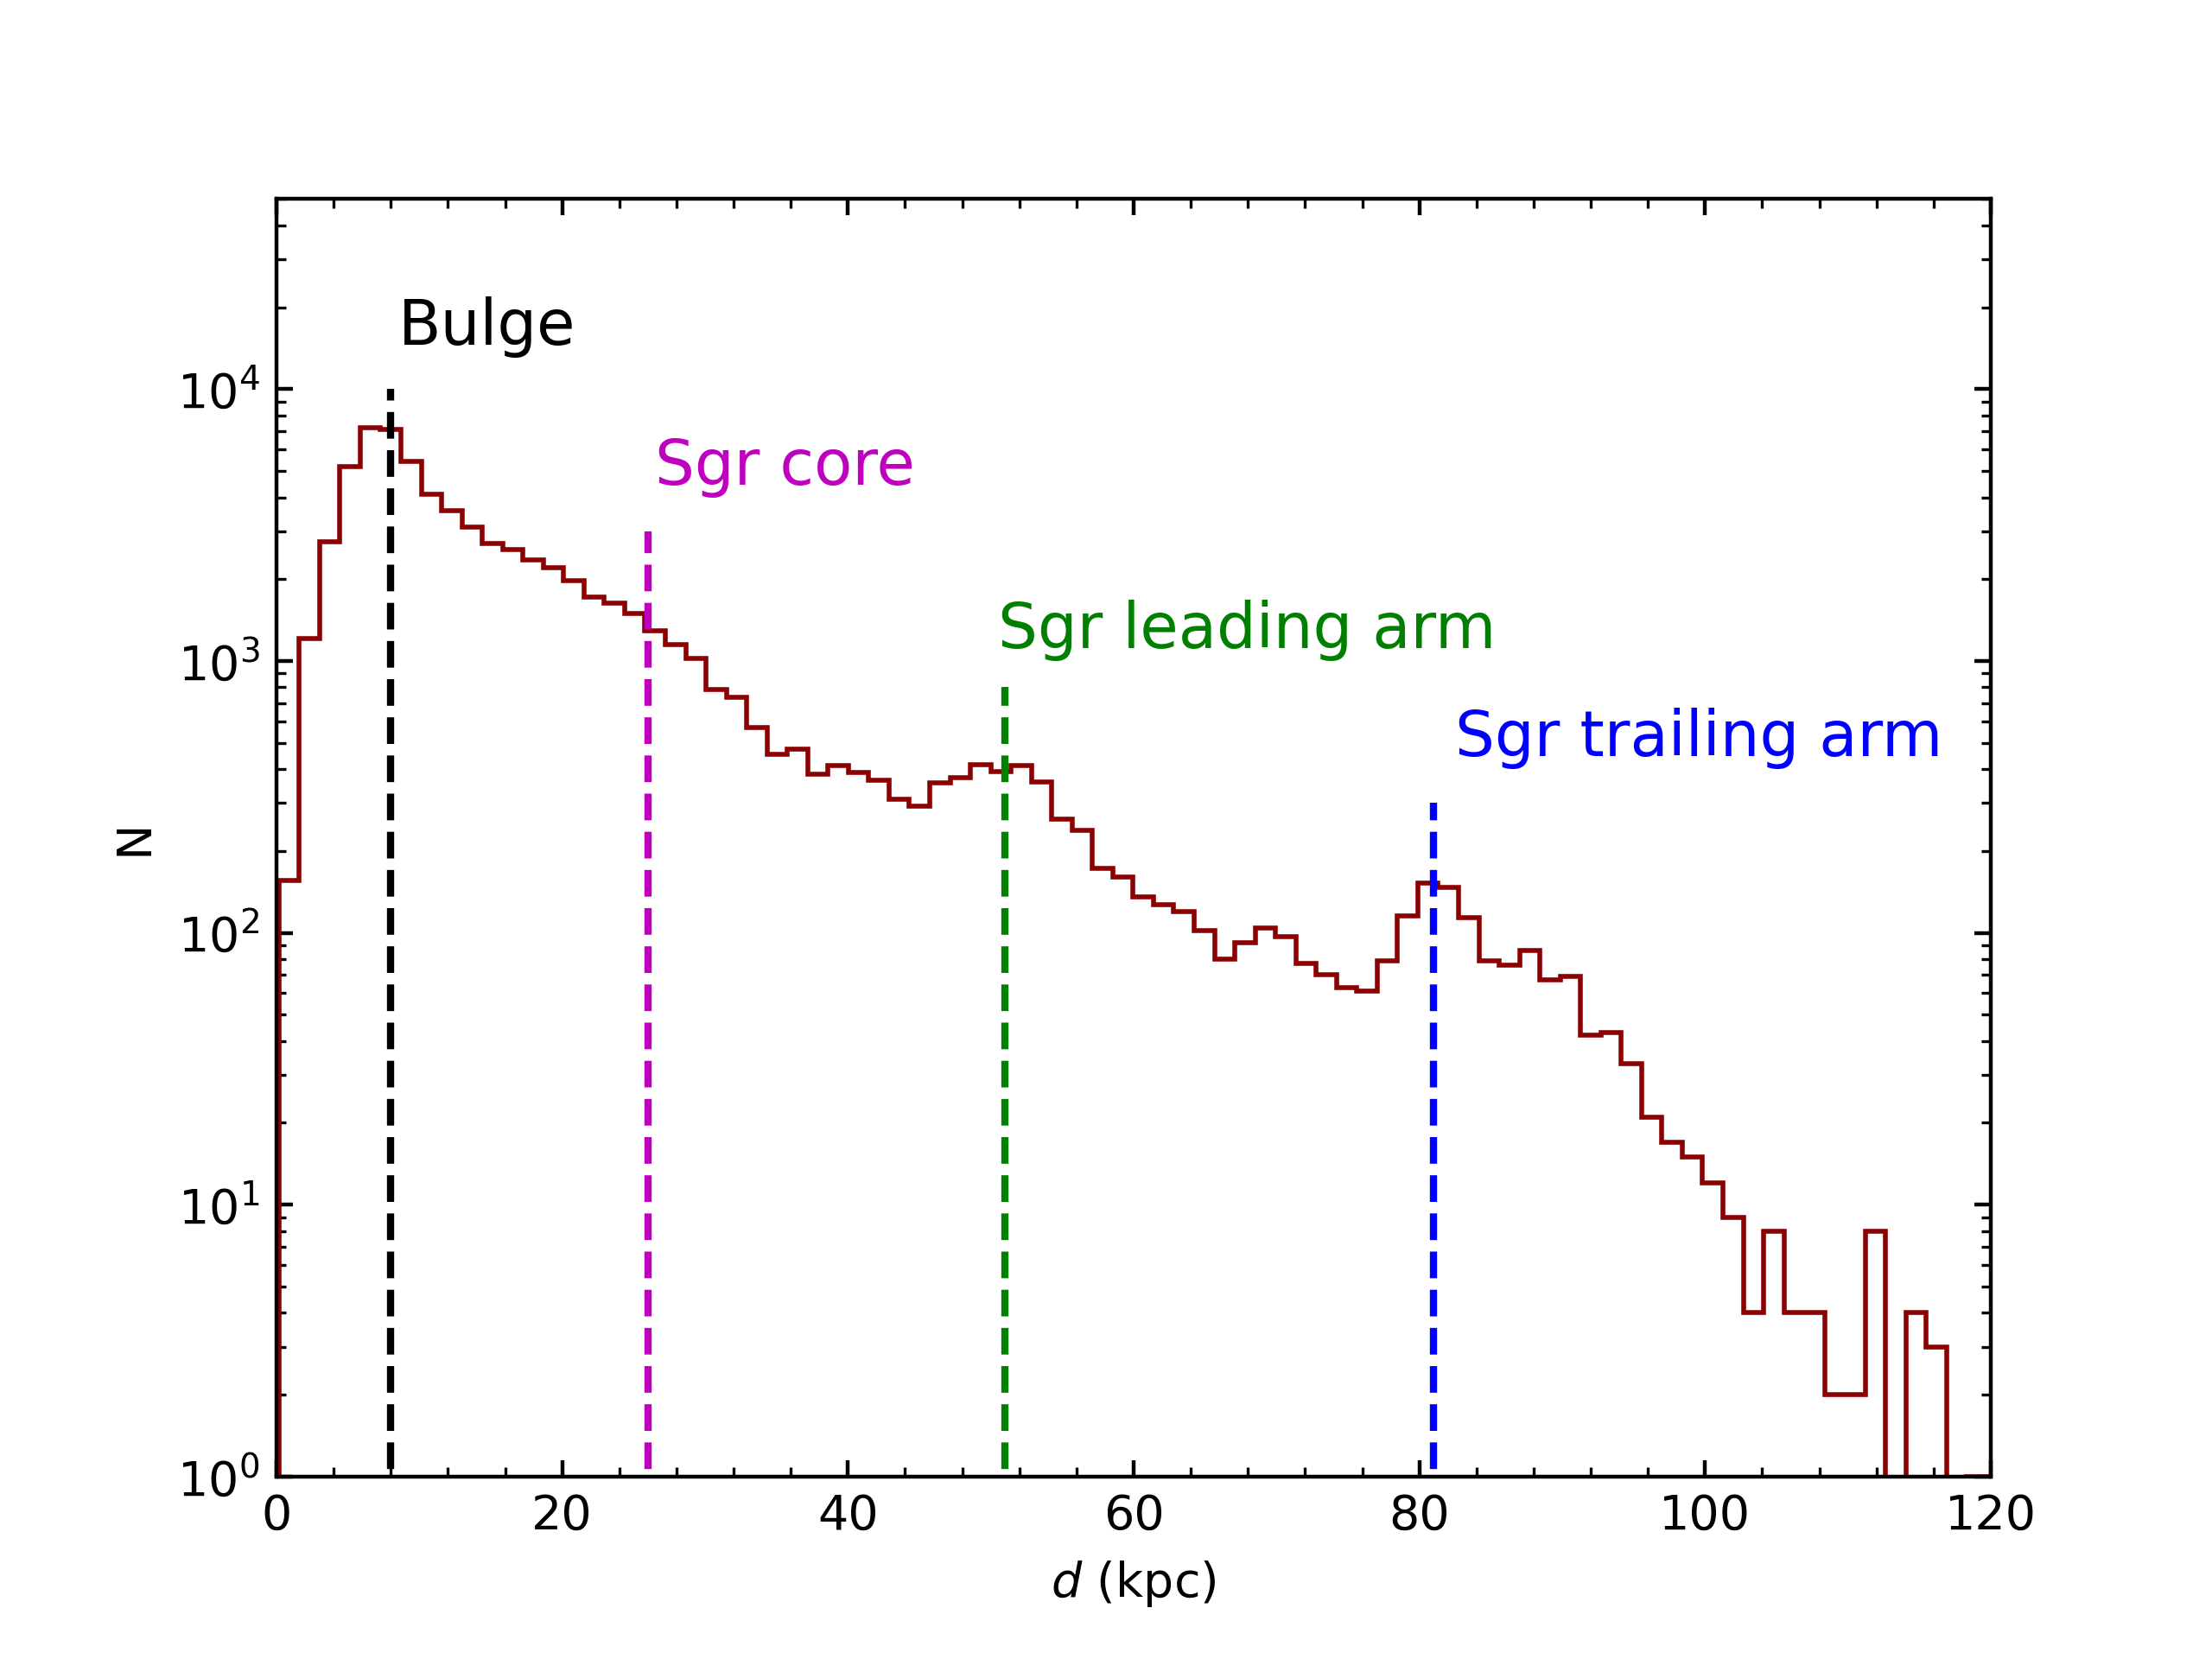
The distance distribution of our final sample extends to over 100 kpc, with four prominent peaks visible as a function of heliocentric distances, as shown in Figure 14. The peak at 8 kpc corresponds to the Galactic bulge, the peaks at 26, 51, and 81 kpc correspond to distinct segments of the Sagittarius core, leading arm and trailing arm (Purcell et al. 2011; Fardal et al. 2019; Ramos et al. 2022; Sun et al. 2024). The relatively large increment in sample size and acceptable accuracy of physical parameters will facilitate a more in-depth understanding of our Galaxy’s structure, as well as its chemical and kinematic properties. Our final catalog, presented in Table B.2, outlines the column names that are part of the online sample catalog. This catalog is also accessible on Zenodo22210.5281/zenodo.14561442.
6. Summary
In this work, we have selected 73,796 relatively high-quality ZTF RR Lyrae stars from multiple catalogs, including those from Gaia, ZTF, ASAS-SN, and PS1. Utilizing re-calculated periods and Fourier parameters from sample stars in the -bands, we established and relations in the ZTF photometric system for RRab and RRc stars, respectively, benefiting from the spectral sample of 2,875 RRab and 1,182 RRc stars provided by L20. After validation across different bands, we found strong internal consistency, and derived photometric-metallicity estimates for 73,795 RRLs (34% derived for the first time, compared with Li23), using a weighted average method. External comparisons with Li23 and the high-resolution spectroscopic sample exhibit no significant offsets, with typical precisions of 0.15 dex and 0.14 dex for RRab and RRc stars, respectively, after validation using GCs members.
Using hundreds of local bright RRLs with metallicity estimates from this work and accurate distance estimates from Gaia parallaxes, we have re-calibrated the PMZ and PWZ relations in the -bands. Given the good agreement observed in internal comparisons, we subsequently applied the weighted average method to both relations. Subsequently, we derived distance estimates for 56,593 RRLs using the PMZ relation and 64,156 RRLs using the PWZ relation. The results of our calibration and external validation are summarized as follows:
1. For the calibration of the PMZ relations in the -bands, the change in the fitted coefficients with wavelength follows a similar trend as in previous works. However, the slope of the period term in the -band differs significantly from two reference works, while the - and -bands are more consistent. A possible explanation is the different prior settings for the period-term coefficient, which may be more sensitive during the fitting process.
2. In the section on the calibration of the PWZ relations, we unexpectedly find a small Wgr for metal-rich RRc sample stars. After excluding these stars, the fitting results exhibit good agreement with N22, and the trend in the coefficients for the period and metallicity terms across different Wesenheit functions aligns with the theoretical work of M15.
3. When compared with the Li23 distance estimates, the PMZ relations exhibit minor offsets and small scatters for in both RRab and RRc stars. The PWZ relations show similar offsets and acceptable scatter when excluding the ‘strange’ sample stars.
4. In cluster validations, the typical relative errors of the weighted average distance from the PMZ relation are 3.1% and 3.0% for RRab and RRc stars, respectively, and 3.1% and 2.6% from the PWZ relation, respectively. Compared to the distances provided by BV21, the PWZ relation shows better agreement, and is recommended as the preferred choice. With the upcoming release of Gaia DR4, it is anticipated that calibrating a larger sample of nearby field stars will help to improve the systematic bias in the PMZ relation.
Ultimately, by integrating distance estimates from both PMZ and PWZ relations, we obtained estimates for 70,560 RRLs, including 22,937 previously unmeasured in Gaia DR3. As future time-domain surveys, such as LSST and SiTian, emerge, we anticipate the discovery of more RRLs and the derivation of precise physical parameters, significantly enhancing our understanding of the Galaxy and universe.
Acknowledgements
We appreciate the anonymous referee’s valuable comments, which helped us improve the paper. This work acknowledges support from the National Natural Science Foundation of China (NSFC) for grants Nos. 12090041, 12422303, and 12090040, the support by National Key R&D Program of China (Grant No. 2023YFA1608303) and the China Manned Space Project with No. CMS-CSST-2021-A08. This work is supported by the Strategic Priority Research Program of the Chinese Academy of Sciences (grant Nos. XDB0550100, XDB0550000, and XDB0550103). G.C.L. acknowledges support from the Hubei Provincial Natural Science Foundation with grant no. 2023AFB577, and the National Science Foundation of China (NSFC) with grant no. U1731108. T.C.B. acknowledges partial support for this work from grant PHY 14-30152; Physics Frontier Center/JINA Center for the Evolution of the Elements (JINA-CEE), and OISE-1927130: The International Research Network for Nuclear Astrophysics (IReNA), awarded by the US National Science Foundation.
This publication is based on observations obtained with the Samuel Oschin Telescope 48-inch and the 60-inch Telescope at the Palomar Observatory as part of the Zwicky Transient Facility project. ZTF is supported by the National Science Foundation under Grants No. AST-1440341 and AST-2034437 and a collaboration including current partners Caltech, IPAC, the Oskar Klein Center at Stockholm University, the University of Maryland, University of California, Berkeley , the University of Wisconsin at Milwaukee, University of Warwick, Ruhr University, Cornell University, Northwestern University and Drexel University. Operations are conducted by COO, IPAC, and UW.
Guoshoujing Telescope (the Large Sky Area Multi-Object Fiber Spectroscopic Telescope LAMOST) is a National Major Scientific Project built by the Chinese Academy of Sciences. Funding for the project has been provided by the National Development and Reform Commission. LAMOST is operated and managed by the National Astronomical Observatories, Chinese Academy of Sciences.
Appendix A Figures
Appendix B Tables
| Column | Unit | Description | |
|---|---|---|---|
| 1 | IDa | … | A unique object id for the cataloged RRLs |
| 2 | SourceIDb | … | Gaia DR3 source_id |
| 3 | RAdeg | degree | Right ascension |
| 4 | DECdeg | degree | Declination |
| 5 | GLdeg | degree | Galactic longitude |
| 6 | GBdeg | degree | Galactic latitude |
| 7 | BestP | d | Average period from light curve in multiple bands |
| 8 | Nep-gri | … | Amount of the photometric data actually used in Fourier analysis in -band |
| 9 | Totamp-gri | mag | , total amplitude of the light curve in -band |
| 10 | A1-gri | mag | , first Fourier amplitudes in -band |
| 11 | e_A1-gri | mag | Uncertainty of the first Fourier amplitudes in -band |
| 12 | A2-gri | mag | , second Fourier amplitudes in -band |
| 13 | e_A2-gri | mag | Uncertainty of the second Fourier amplitudes in -band |
| 14 | A3-gri | mag | , third Fourier amplitudes in -band |
| 15 | e_A3-gri | mag | Uncertainty of the third Fourier amplitudes in -band |
| 16 | R21-gri | … | Ratio of the and in -band |
| 17 | e_R21-gri | … | Uncertainty of the ratio of the and in -band |
| 18 | R31-gri | … | Ratio of the and in -band |
| 19 | e_R31-gri | … | Uncertainty of the ratio of the and in -band |
| 20 | Phi1-gri | rad | , first Fourier phases in -band |
| 21 | e_Phi1-gri | rad | Uncertainty of the first Fourier phases in -band |
| 22 | Phi2-gri | rad | , second Fourier phases in -band |
| 23 | e_Phi2-gri | rad | Uncertainty of the second Fourier phases in -band |
| 24 | Phi3-gri | rad | , third Fourier phases in -band |
| 25 | e_Phi3-gri | rad | Uncertainty of the the second Fourier phases in -band |
| 26 | Phi21-gri | rad | Phase difference between and in -band |
| 27 | e_Phi21-gri | rad | Uncertainty of the phase difference between and in -band |
| 28 | Phi31-gri | rad | Phase difference between and in -band |
| 29 | e_Phi31-gri | rad | Uncertainty of the phase difference between and in -band |
| 30 | Meanmag-gri | mag | m0, mean magnitude in -band |
| 31 | e_Meanmag-gri | mag | Uncertainty of the mean magnitude in -band |
| 32 | Phcov-gri | … | Phase coverage in -band phase-folded light curves |
| 33 | SNR-gri | … | Fit quality indicator in -bandc |
| 34 | Rstdev-gri | mag | The standard deviation of residuals for fitting light curves in -band |
| 35 | Flagd | … | Light curve flags with ‘A’, ‘C’, ‘D’ |
| 36 | Type | … | Type of RR Lyrae star, ‘RRab’ or ‘RRc’ |
-
a
These ids are from the original catalogs.
-
b
Within a 3 arcsecond radius, only a few sample stars from the Gaia DR3 main catalog did not find matches; these unmatched sample stars are set to 0.
-
c
Calculated as
-
d
Caution should be exercised when using metallicity and distance parameters for potential low-quality sample stars. It is recommended to verify the light curves in different bands before relying on these values.
(The full table is available in its entirety in machine-readable form.)
| Column | Unit | Description | |
|---|---|---|---|
| 1 | IDa | … | A unique object id for the cataloged RRLs |
| 2 | SourceIDb | … | Gaia DR3 source_id |
| 3 | RAdeg | degree | Right ascension |
| 4 | DECdeg | degree | Declination |
| 5 | GLdeg | degree | Galactic longitude |
| 6 | GBdeg | degree | Galactic latitude |
| 7 | [Fe/H]-gri | … | Photometric-metallicity in -band |
| 8 | e_[Fe/H]-gri | … | Uncertainty of the photometric-metallicity in -band |
| 7 | [Fe/H] | … | Weighted average photometric-metallicity estimates from P-Fourier Params-[Fe/H] relations in -bands |
| 8 | e_[Fe/H] | … | Uncertainty of the weighted average photometric-metallicity |
| 9 | Ag / Ar / Ai | mag | Extinction values in -band |
| 10 | e_Ag / e_Ar / e_Ai | mag | Uncertainty of the extinction values in -band |
| 11 | M-gri | mag | Absolute magnitude in -band |
| 12 | e_M-gri | mag | Uncertainty of the absolute magnitude in -band |
| 13 | Dist-gri | kpc | Distance from PMZ relation in -band |
| 14 | e_Dist-gri | kpc | Uncertainty of the distance from PMZ relation in -band |
| 15 | Dist-PMZ | kpc | Weighted average distance from PMZ relation in -bands |
| 16 | e_Dist-PMZ | kpc | Uncertainty of the weighted average distance from PMZ relation in -bands |
| 17 | W-gr / W-gi / W-ri | mag | Wesenheit absolute magnitude in , , and -band pair |
| 18 | e_W-gr / e_W-gi / e_W-ri | mag | Uncertainty of wesenheit absolute magnitude in , , and -band pair |
| 19 | Dist-gr / Dist-gi / Dist-ri | kpc | Distance from PWZ relation in , , and -band pair |
| 20 | e_Dist-gr / e_Dist-gi / e_Dist-ri | kpc | Uncertainty of the distance from PWZ relation in , , and -band pair |
| 21 | Dist-PWZ | kpc | Weighted average distance from PWZ relation in -, -, and -band pairs |
| 22 | e_Dist-PWZ | kpc | Uncertainty of the weighted average distance from PWZ relation in -, -, and -band pairs |
| 23 | Flagc | … | Light curve flags with ‘A’, ‘C’, ‘D’ |
| 24 | Type | … | Type of the RR Lyrae stars,‘RRab’ or ‘RRc’ |
-
a
These ids are from the original catalogs.
-
b
Within a 3 arcsecond radius, only a few sample stars from the Gaia DR3 main catalog did not find matches; these unmatched sample stars are set to 0.
-
c
Caution should be exercised when using metallicity and distance parameters for potential low-quality sample stars. It is recommended to verify the light curves in different bands before relying on these values.
(The full table is available in its entirety in machine-readable form.)
References
- Ablimit et al. (2022) Ablimit, I., Zhao, G., Teklimakan, U., Shi, J.-R., & Abdusalam, K. 2022, ApJS, 258, 20
- Arp (1955) Arp, H. C. 1955, AJ, 60, 317
- Bellm & Kulkarni (2017) Bellm, E., & Kulkarni, S. 2017, Nature Astronomy, 1, 0071
- Bhardwaj (2022) Bhardwaj, A. 2022, Universe, 8, 122
- Bhardwaj et al. (2021a) Bhardwaj, A., Rejkuba, M., Sloan, G., Marconi, M., & Yang, S.-C. 2021a, The Astrophysical Journal, 922, 20
- Bhardwaj et al. (2021b) Bhardwaj, A., Rejkuba, M., de Grijs, R., et al. 2021b, The Astrophysical Journal, 909, 200
- Bobrick et al. (2024) Bobrick, A., Iorio, G., Belokurov, V., et al. 2024, MNRAS, 527, 12196
- Bono et al. (2003) Bono, G., Caputo, F., Castellani, V., et al. 2003, Monthly Notices of the Royal Astronomical Society, 344, 1097
- Braga et al. (2015) Braga, V. F., Dall’Ora, M., Bono, G., et al. 2015, The Astrophysical Journal, 799, 165
- Butler (1975) Butler, D. 1975, ApJ, 200, 68
- Cabrera Garcia et al. (2024) Cabrera Garcia, J., Beers, T. C., Huang, Y., et al. 2024, MNRAS, 527, 8973
- Caputo et al. (2000) Caputo, F., Castellani, V., Marconi, M., & Ripepi, V. 2000, Monthly Notices of the Royal Astronomical Society, 316, 819
- Catelan et al. (2004) Catelan, M., Pritzl, B. J., & Smith, H. A. 2004, The Astrophysical Journal Supplement Series, 154, 633
- Chen et al. (2020) Chen, X., Wang, S., Deng, L., et al. 2020, The Astrophysical Journal Supplement Series, 249, 18
- Cheung et al. (2021) Cheung, S.-H., Villar, V. A., Chan, H.-S., & Ho, S. 2021, Research Notes of the American Astronomical Society, 5, 282
- Christy et al. (2023) Christy, C., Jayasinghe, T., Stanek, K., et al. 2023, Monthly Notices of the Royal Astronomical Society, 519, 5271
- Clement et al. (1993) Clement, C. M., Ferance, S., & Simon, N. R. 1993, ApJ, 412, 183
- Clement et al. (1992) Clement, C. M., Jankulak, M., & Simon, N. R. 1992, ApJ, 395, 192
- Clementini et al. (2019) Clementini, G., Ripepi, V., Molinaro, R., et al. 2019, Astronomy & Astrophysics, 622, A60
- Clementini et al. (2023) Clementini, G., Ripepi, V., Garofalo, A., et al. 2023, Astronomy & Astrophysics, 674, A18
- Dekany (2022) Dekany, I. 2022, idekany/lcfit: A python package for the regression of periodic time series, doi:10.5281/zenodo.6576222
- Dékány & Grebel (2022) Dékány, I., & Grebel, E. K. 2022, The Astrophysical Journal Supplement Series, 261, 33
- Dékány et al. (2021) Dékány, I., Grebel, E. K., & Pojmański, G. 2021, The Astrophysical Journal, 920, 33
- Dias et al. (2016a) Dias, B., Barbuy, B., Saviane, I., et al. 2016a, Astronomy & Astrophysics, 590, A9
- Dias et al. (2016b) Dias, B., Saviane, I., Barbuy, B., et al. 2016b
- Dias et al. (2015) Dias, B., Barbuy, B., Saviane, I., et al. 2015, Astronomy & Astrophysics, 573, A13
- Fardal et al. (2019) Fardal, M. A., van der Marel, R. P., Law, D. R., et al. 2019, Monthly Notices of the Royal Astronomical Society, 483, 4724
- Ferraz-Mello (1981) Ferraz-Mello, S. 1981, AJ, 86, 619
- Feuillet et al. (2022) Feuillet, D. K., Feltzing, S., Sahlholdt, C., & Bensby, T. 2022, ApJ, 934, 21
- Garofalo et al. (2022) Garofalo, A., Delgado, H. E., Sarro, L. M., et al. 2022, MNRAS, 513, 788
- Gilligan et al. (2021) Gilligan, C. K., Chaboyer, B., Marengo, M., et al. 2021, Monthly Notices of the Royal Astronomical Society, 503, 4719
- Hajdu et al. (2018) Hajdu, G., Dékány, I., Catelan, M., Grebel, E. K., & Jurcsik, J. 2018, The Astrophysical Journal, 857, 55
- Harris (2010) Harris, W. E. 2010, arXiv preprint arXiv:1012.3224
- Huang & Koposov (2022) Huang, K.-W., & Koposov, S. E. 2022, Monthly Notices of the Royal Astronomical Society, 510, 3575
- Huang et al. (2021) Huang, Y., Li, Q., Zhang, H., et al. 2021, The Astrophysical Journal Letters, 907, L42
- Iorio & Belokurov (2019) Iorio, G., & Belokurov, V. 2019, MNRAS, 482, 3868
- Jacyszyn-Dobrzeniecka et al. (2017) Jacyszyn-Dobrzeniecka, A. M., Skowron, D. M., Mróz, P., et al. 2017, Acta Astron., 67, 1
- Jayasinghe et al. (2021) Jayasinghe, T., Kochanek, C., Stanek, K., et al. 2021, Monthly Notices of the Royal Astronomical Society, 503, 200
- Jurcsik & Hajdu (2023) Jurcsik, J., & Hajdu, G. 2023, MNRAS, 525, 3486
- Jurcsik & Kovács (1996) Jurcsik, J., & Kovács, G. 1996, Astronomy and Astrophysics, v. 312, p. 111-120, 312, 111
- Karczmarek et al. (2017) Karczmarek, P., Wiktorowicz, G., Iłkiewicz, K., et al. 2017, MNRAS, 466, 2842
- Kovács & Zsoldos (1995) Kovács, G., & Zsoldos, E. 1995, Astronomy and Astrophysics 293L, L57-L60 (1995), 293
- Layden (1994) Layden, A. C. 1994, AJ, 108, 1016
- Li et al. (2023) Li, X.-Y., Huang, Y., Liu, G.-C., Beers, T. C., & Zhang, H.-W. 2023, The Astrophysical Journal, 944, 88
- Lindegren et al. (2021) Lindegren, L., Bastian, U., Biermann, M., et al. 2021, Astronomy & Astrophysics, 649, A4
- Liu et al. (2022) Liu, G., Huang, Y., Bird, S. A., et al. 2022, MNRAS, 517, 2787
- Liu et al. (2020) Liu, G.-C., Huang, Y., Zhang, H.-W., et al. 2020, The Astrophysical Journal Supplement Series, 247, 68
- Lomb (1976) Lomb, N. R. 1976, Astrophysics and space science, 39, 447
- Madore (1982) Madore, B. F. 1982, ApJ, 253, 575
- Madore & Freedman (1991) Madore, B. F., & Freedman, W. L. 1991, PASP, 103, 933
- Masci et al. (2018) Masci, F. J., Laher, R. R., Rusholme, B., et al. 2018, Publications of the Astronomical Society of the Pacific, 131, 018003
- Mateu & Vivas (2018) Mateu, C., & Vivas, A. K. 2018, MNRAS, 479, 211
- Monti et al. (2024) Monti, L., Muraveva, T., Clementini, G., & Garofalo, A. 2024, Sensors, 24, 5203
- Mowlavi et al. (2023) Mowlavi, N., Holl, B., Lecoeur-Taïbi, I., et al. 2023, Astronomy & Astrophysics, 674, A16
- Mullen et al. (2023) Mullen, J. P., Marengo, M., Martínez-Vázquez, C. E., et al. 2023, The Astrophysical Journal, 945, 83
- Muraveva et al. (2018) Muraveva, T., Delgado, H. E., Clementini, G., Sarro, L. M., & Garofalo, A. 2018, Monthly Notices of the Royal Astronomical Society, 481, 1195
- Muraveva et al. (2024) Muraveva, T., Giannetti, A., Clementini, G., Garofalo, A., & Monti, L. 2024, MNRAS, arXiv:2407.05815
- Muraveva et al. (2015) Muraveva, T., Palmer, M., Clementini, G., et al. 2015, The Astrophysical Journal, 807, 127
- Neeley et al. (2019) Neeley, J. R., Marengo, M., Freedman, W. L., et al. 2019, MNRAS, 490, 4254
- Nemec et al. (2013) Nemec, J. M., Cohen, J. G., Ripepi, V., et al. 2013, The Astrophysical Journal, 773, 181
- Ngeow et al. (2016) Ngeow, C.-C., Yu, P.-C., Bellm, E., et al. 2016, The Astrophysical Journal Supplement Series, 227, 30
- Ngeow et al. (2022) Ngeow, C.-C., Bhardwaj, A., Dekany, R., et al. 2022, The Astronomical Journal, 163, 239
- Olivares Carvajal et al. (2024) Olivares Carvajal, J., Zoccali, M., De Leo, M., et al. 2024, A&A, 687, A312
- Oosterhoff (1939) Oosterhoff, P. T. 1939, The Observatory, 62, 104
- Pancino et al. (2015) Pancino, E., Britavskiy, N., Romano, D., et al. 2015, Monthly Notices of the Royal Astronomical Society, 447, 2404
- Pietrukowicz et al. (2015) Pietrukowicz, P., Kozłowski, S., Skowron, J., et al. 2015, ApJ, 811, 113
- Preston (1959) Preston, G. W. 1959, ApJ, 130, 507
- Preston (1959) Preston, G. W. 1959, Astrophysical Journal, vol. 130, p. 507, 130, 507
- Purcell et al. (2011) Purcell, C. W., Bullock, J. S., Tollerud, E. J., Rocha, M., & Chakrabarti, S. 2011, Nature, 477, 301
- Ramos et al. (2022) Ramos, P., Antoja, T., Yuan, Z., et al. 2022, Astronomy & Astrophysics, 666, A64
- Rockosi et al. (2022) Rockosi, C. M., Lee, Y. S., Morrison, H. L., et al. 2022, ApJS, 259, 60
- Scargle (1982) Scargle, J. D. 1982, Astrophysical Journal, Part 1, vol. 263, Dec. 15, 1982, p. 835-853., 263, 835
- Schlegel et al. (1998) Schlegel, D. J., Finkbeiner, D. P., & Davis, M. 1998, The Astrophysical Journal, 500, 525
- Sesar et al. (2017) Sesar, B., Hernitschek, N., Mitrović, S., et al. 2017, The Astronomical Journal, 153, 204
- Skrutskie et al. (2006) Skrutskie, M. F., Cutri, R. M., Stiening, R., et al. 2006, AJ, 131, 1163
- Smolec (2005) Smolec, R. 2005, Acta Astron., 55, 59
- Sneden et al. (2011) Sneden, C., Preston, G. W., et al. 2011, The Astrophysical Journal Supplement Series, 197, 29
- Soszyński et al. (2016a) Soszyński, I., Udalski, A., Szymański, M. K., et al. 2016a, Acta Astron., 66, 131
- Soszyński et al. (2016b) Soszyński, I., Pawlak, M., Pietrukowicz, P., et al. 2016b, Acta Astron., 66, 405
- Soszyński et al. (2019) Soszyński, I., Udalski, A., Wrona, M., et al. 2019, Acta Astron., 69, 321
- Sun et al. (2024) Sun, S., Wang, F., Zhang, H., et al. 2024, arXiv e-prints, arXiv:2411.13122
- Vasiliev & Baumgardt (2021) Vasiliev, E., & Baumgardt, H. 2021, Monthly Notices of the Royal Astronomical Society, 505, 5978
- Vásquez et al. (2018) Vásquez, S., Saviane, I., Held, E. V., et al. 2018, Astronomy & Astrophysics, 619, A13
- Vivas et al. (2017) Vivas, A. K., Saha, A., Olsen, K., et al. 2017, The Astronomical Journal, 154, 85
- Walker & Terndrup (1991) Walker, A. R., & Terndrup, D. M. 1991, ApJ, 378, 119
- Wang et al. (2022) Wang, F., Zhang, H. W., Xue, X. X., et al. 2022, MNRAS, 513, 1958
- Wang et al. (2024) Wang, J., Shi, J., Fu, J., Zong, W., & Li, C. 2024, ApJS, 272, 31
- Wang & Chen (2019) Wang, S., & Chen, X. 2019, The Astrophysical Journal, 877, 116
- Wolf et al. (2018) Wolf, C., Onken, C. A., Luvaul, L. C., et al. 2018, PASA, 35, e010
- Yanny et al. (2009) Yanny, B., Rockosi, C., Newberg, H. J., et al. 2009, The Astronomical Journal, 137, 4377
- Ye et al. (2024) Ye, D., Du, C., Deng, M., et al. 2024, MNRAS, 532, 2584
- York et al. (2000) York, D. G., Adelman, J., Anderson Jr, J. E., et al. 2000, The Astronomical Journal, 120, 1579
- Zechmeister & Kürster (2009) Zechmeister, M., & Kürster, M. 2009, A&A, 496, 577
- Zgirski et al. (2023) Zgirski, B., Pietrzyński, G., Górski, M., et al. 2023, ApJ, 951, 114
- Zhang et al. (2023) Zhang, S., Liu, G., Huang, Y., et al. 2023, MNRAS, 525, 5915