[a]Christine Davies
Muon g-2
Abstract
The story of the anomalous magnetic moment of the muon, , has been a long and absorbing read, with several unexpected plot twists. The theme: is new physics visible in or not? is clearly an important one. As we head towards what may be the final chapters, the pace of the narrative has quickened and lattice QCD is providing a critical new perspective on some of the key characters. I will review the story so far, focussing on recent episodes but (spoiler alert) depending on your point of view, it may not be heading to a happy ending.
1 Introduction
The muon has electric charge and spin and hence a magnetic moment. This is related to its spin by
| (1) |
The -factor would be 2 in a purely quantum-mechanical world. However, quantum field theory provides a rich vacuum structure with a sea of virtual particles. As the muon spins, its magnetic moment probes the vacuum and this increases the value of by about 0.1%. The anomalous magnetic moment, or simply ‘anomaly’, is defined as
| (2) |


The leading contribution to comes at from QED (see Figure 1), but there are many higher-order pieces. The task of the theorist is to calculate them all. A discrepancy between calculated in the Standard Model (SM) and that determined in experiment would constitute a discovery of new physics. A possible new physics diagram is shown on the right of Figure 1.
is being determined experimentally by the Muon g-2 collaboration at Fermilab to an astonishing level of precision. In August 2023 the collaboration released an update [1] based on data runs 1–3 which gave an experimental world average with an accuracy of 0.19ppm. The experiment is in fact done anti-muons, spin-polarised and circulating in a storage ring with a perpendicular magnetic field. Since the decay weakly (to ) their spin direction can be measured from that in which the high-energy positrons are emitted. The precession of the spin is then compared to that of its linear momentum. The precession frequency difference is directly proportional to , avoiding the need to measure the ‘2’ in the numerator of Eq. (2) and making high precision feasible. A final result is expected in 2025 from runs 1–6, improving statistical uncertainties by a further factor of 3 and the total uncertainty by 30%.
The current experimental value can be compared to that expected in the Standard Model, as given in the 2020 Theory White Paper (WP20) [2]:
| (3) |
The difference between these two numbers, would constitute a discovery, except that it has become clear since 2020 that the QCD contributions need more work. The relative size of contributions from different sectors of the SM, as taken from WP20 (and adding up to the given in Eq. (1)) are:
| (4) |
These numbers show that the QCD contribution is the second largest, much larger than that from EW effects. This is because the corrections to come from low energies, around , and the EW gauge bosons are very heavy. The QED and EW contributions can be calculated accurately in perturbation theory. The QCD contribution can not and so it gives almost the entire theory uncertainty. Lattice QCD then has a key role to play in clarifying what that contribution is.
2 QCD contributions to
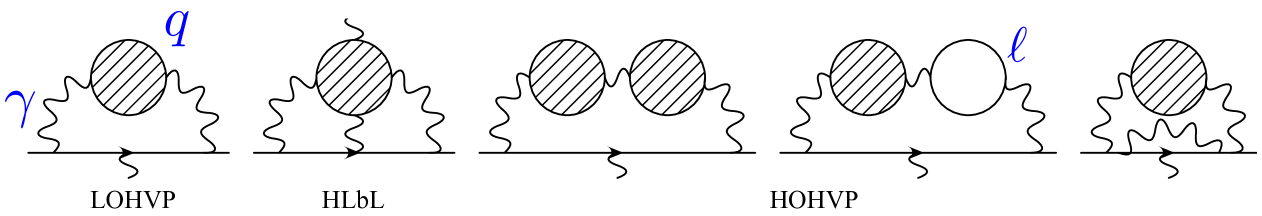
The leading (in powers of ) QCD contribution is that on the left of Figure 2, known as the LOHVP, which appears at . The remaining four diagrams are and consequently give a much smaller contribution. The total for each of the HOHVP and HLbL collections of diagrams is about a factor of 70 smaller than the LOHVP [2]. There are additional versions of these diagrams that are even smaller (but are included in the total in [2]). The HOHVP contribution is negative and almost cancels that of the HLbL. The total QCD contribution is then dominated by that of the LOHVP. For a theory uncertainty of (i.e. in the same ballpark as the experiment) we need a 0.5% uncertainty on the LOHVP calculation. The HOHVP result inherits a similar relative uncertainty whilst being much smaller, so its uncertainty is not problematic. The HLbL diagram is hard to pin down and so historically it has had a large relative uncertainty. If this can be reduced to then its uncertainty will be small compared to that of the LOHVP.
Here we will largely concentrate on the calculation of the LOHVP contribution; that contribution is clearly critical to providing an accurate theoretical result for in the SM. There are two approaches to calculating the LOHVP, illustrated in Figure 3. The ‘data-driven’ approach that makes use of experimental data for has historically been the most accurate and this gave the value quoted in WP20 [2] and Eq. (1). The lattice QCD calculation required is that of simple 2-point vector-vector correlation functions for different quark flavours but it has proved very hard to achieve the accuracy needed.
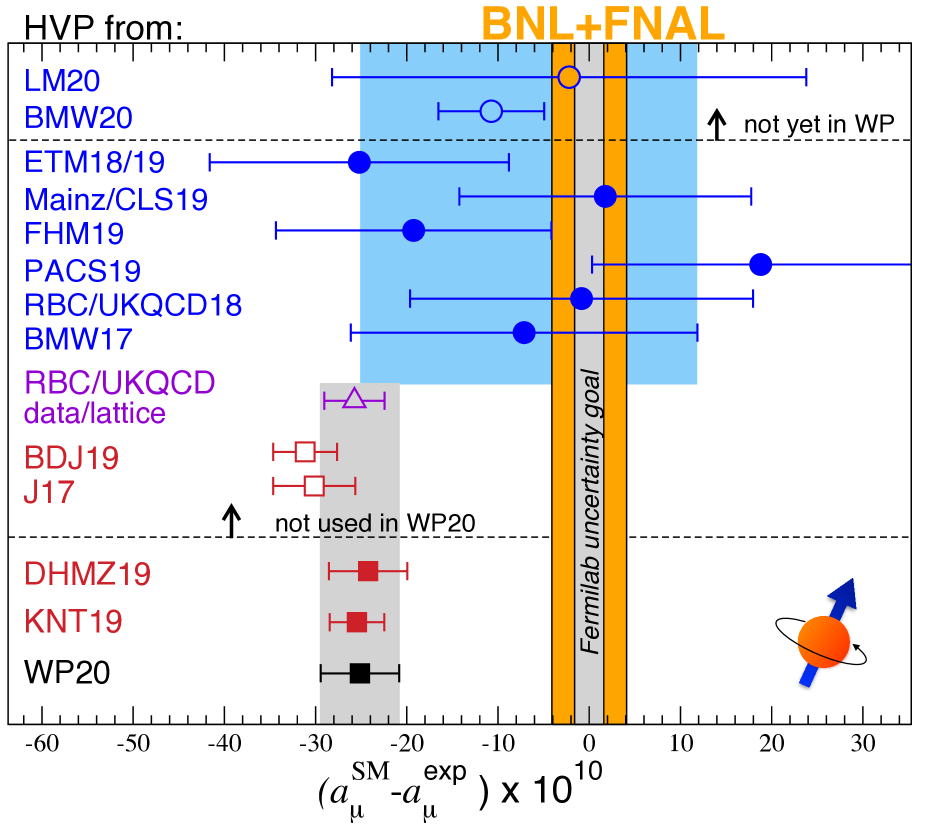
The situation in early 2022 was summarised by the Snowmass review [4], Figure 4. This shows the impact of the value of the LOHVP contribution on the comparison of between theory and experiment. The significant tension of Eq. (1) between experiment (orange band) and theory (grey band), using the WP20 LOHVP value based on data-driven results, is evident. The WP20 LOHVP value had a 0.6% uncertainty. Note that the size of the tension, , is of the LOHVP. The lattice QCD values available at that time mostly had uncertainties at the 2% level and the WP20 lattice average, given by the blue band, was unable to provide the resolution needed to weigh in on the issue. The BMW20 result [14], not included in the WP20 lattice average, was the first complete lattice QCD calculation of the LOHVP and has a 0.8% uncertainty. The tension that it shows with the data-driven LOHVP values, and less than tension with experiment, was intriguing. It demonstrates that the question of whether the data-driven and lattice QCD values for the LOHVP agree is critical to forming a conclusion on the evidence for new physics in .
3 Windows on the lattice LOHVP calculation
As shown in Fig. 3 the lattice QCD calculation of the LOHVP requires a straightforward determination of 2-point vector-vector correlation functions at zero spatial momentum, i.e. the calculation that would be done to determine vector meson masses. We must also determine quark-line disconnected correlation functions along with QED and isospin-breaking effects. As usual results are needed at multiple values of the lattice spacing for a continuum limit to be taken. Given an appropriate correlation function, , the contribution to the LOHVP is given by
| (5) |
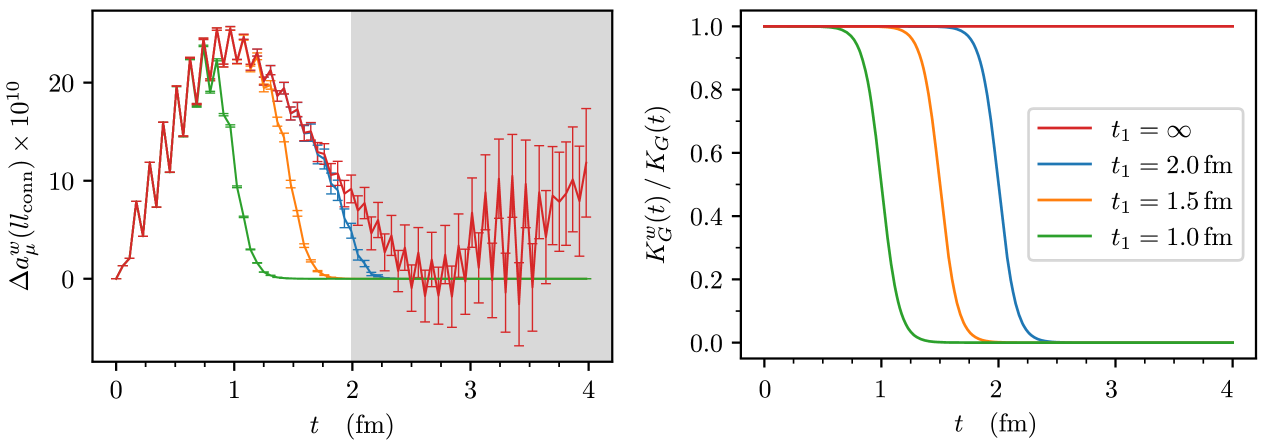
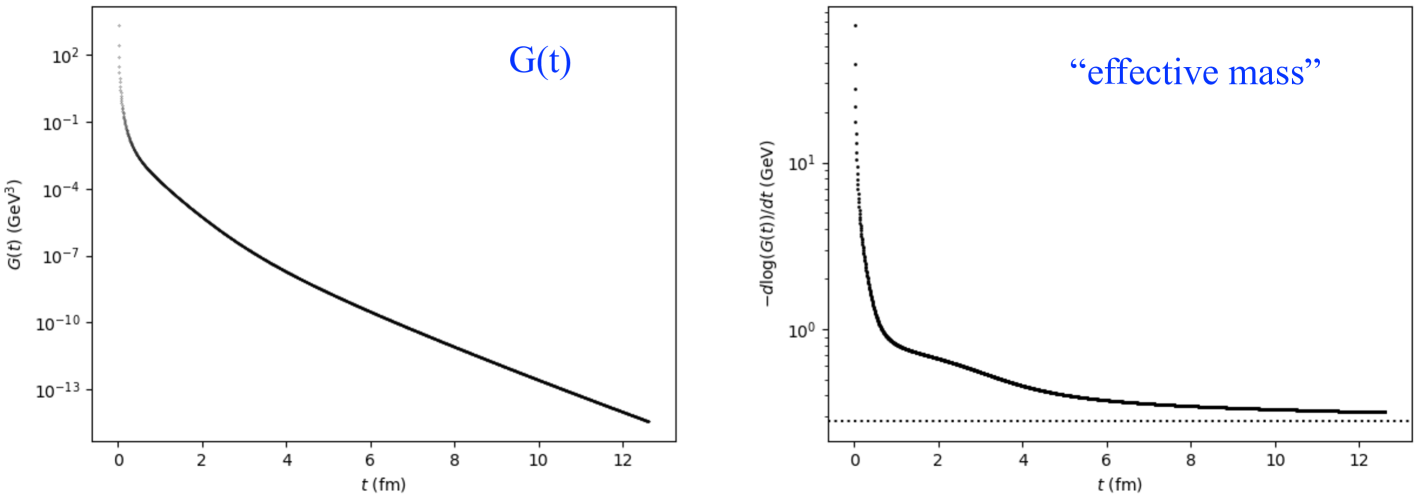
Here and is a kernel function [16, 17] which vanishes at , and rises up from that value as falls. The product for quark-connected correlators then has a humped structure with the position of the peak of the hump depending on the quark flavour. This is illustrated in Figure 5 for the connected light quark () correlator in red calculated with Highly Improved Staggered quarks [18]. Heavier quark contributions () peak at smaller . The size of the contribution from each quark flavour then depends on the effective range over which we need to sum for Eq. (5) as well as the quark electric charge, which appears squared in .
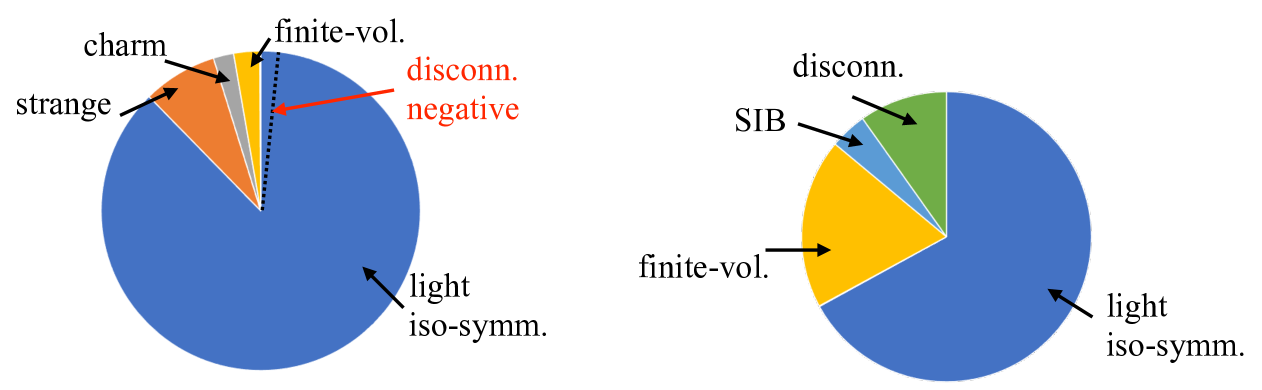
The relative sizes of the different flavour contributions are shown in the left-hand pie chart of Figure 6, with numbers taken from BMW20 [14]. We see that by far the largest contribution () comes from up and down quarks, with strange (partly because of ) and charm (because of its mass) having much smaller contributions. The quark-line disconnected contribution (from ) is negative and has about the same magnitude as the charm contribution. The finite-volume correction is also sizeable (for a lattice of spatial size 6.272 fm used as the reference in this case). Contributions from QED and isospin-breaking as well as quarks are too small to be visible (but still need to be calculated, of course). The right-hand pie shows the contributions to the variance, again dominated by the light-quark connected contribution. The uncertainty from the finite-volume corrections is significant, however.
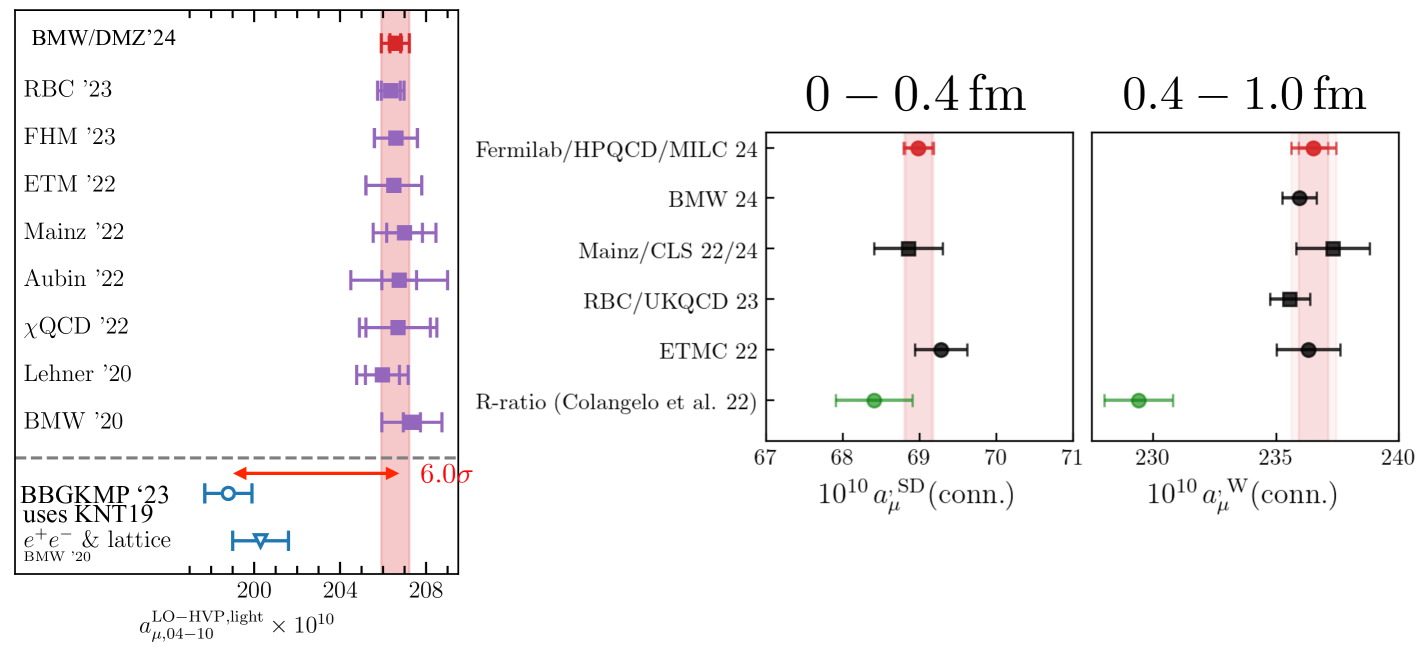
Right: a comparison of lattice QCD results for the complete contribution to the LOHVP in the short-distance (0–0.4 fm) and intermediate distance windows. The figure is from Fermilab/HPQCD/MILC (FHM) and the top filled red circles and pink bands are their results from [27] with uncertainties of 0.3% ad 0.4% respectively. The other lattice results [22, 23, 24, 19] are in good agreement. Results from the pre-CMD3 data-driven analysis [28] are shown as filled green circles. There is significant tension () with lattice QCD for the intermediate-distance window. When the CMD3 data for is substituted for the older data in the KNT19 dataset the partial LOHVP values increase; for the short-distance window to 69.1 and for the intermediate-distance window to 235.6 (using numbers from [29]). These numbers are in better agreement with the lattice QCD results. This substitution of CMD-3 data also removes the tension between lattice QCD and data-driven results in the light-quark connected case [26].
An accurate LOHVP calculation then requires good control of uncertainties from the light-quark connected correlators. As is well-known, vector meson correlators have an exponentially falling signal/noise ratio at large times because of the gap between the vector meson mass (in the signal) and the pseudoscalar mass (controlling the noise). This affects the light meson correlation function more than that for or because the gap, to , is larger. The integrand of Eq. (5) also extends to larger times for the light correlator because the exponential decay of G(t) is not so rapid and this exacerbates the statistical noise issue. The growth of statistical noise at large time is clearly visible in the red points in the left-hand plot of Figure 5. Another important issue for the light-quark case, especially at physical light quark masses, is that of finite-volume corrections. These arise from the fact that the light vector correlator has contributions, which become increasingly important at large time. S. Kuberski reviewed these sources of uncertainty and mitigation strategies for them at Lattice2023 [30].
As we saw in Figure 4, lattice QCD calculations were struggling to have an impact because of these uncertainties. It was suggested [17, 8] that imposing a time-window on the lattice correlators to remove the problematic large time region where statistical and systematic uncertainties are largest would enable a more focussed comparison of lattice results for part of the LOHVP. Figure 5 shows examples of such windows given by the function
| (6) |
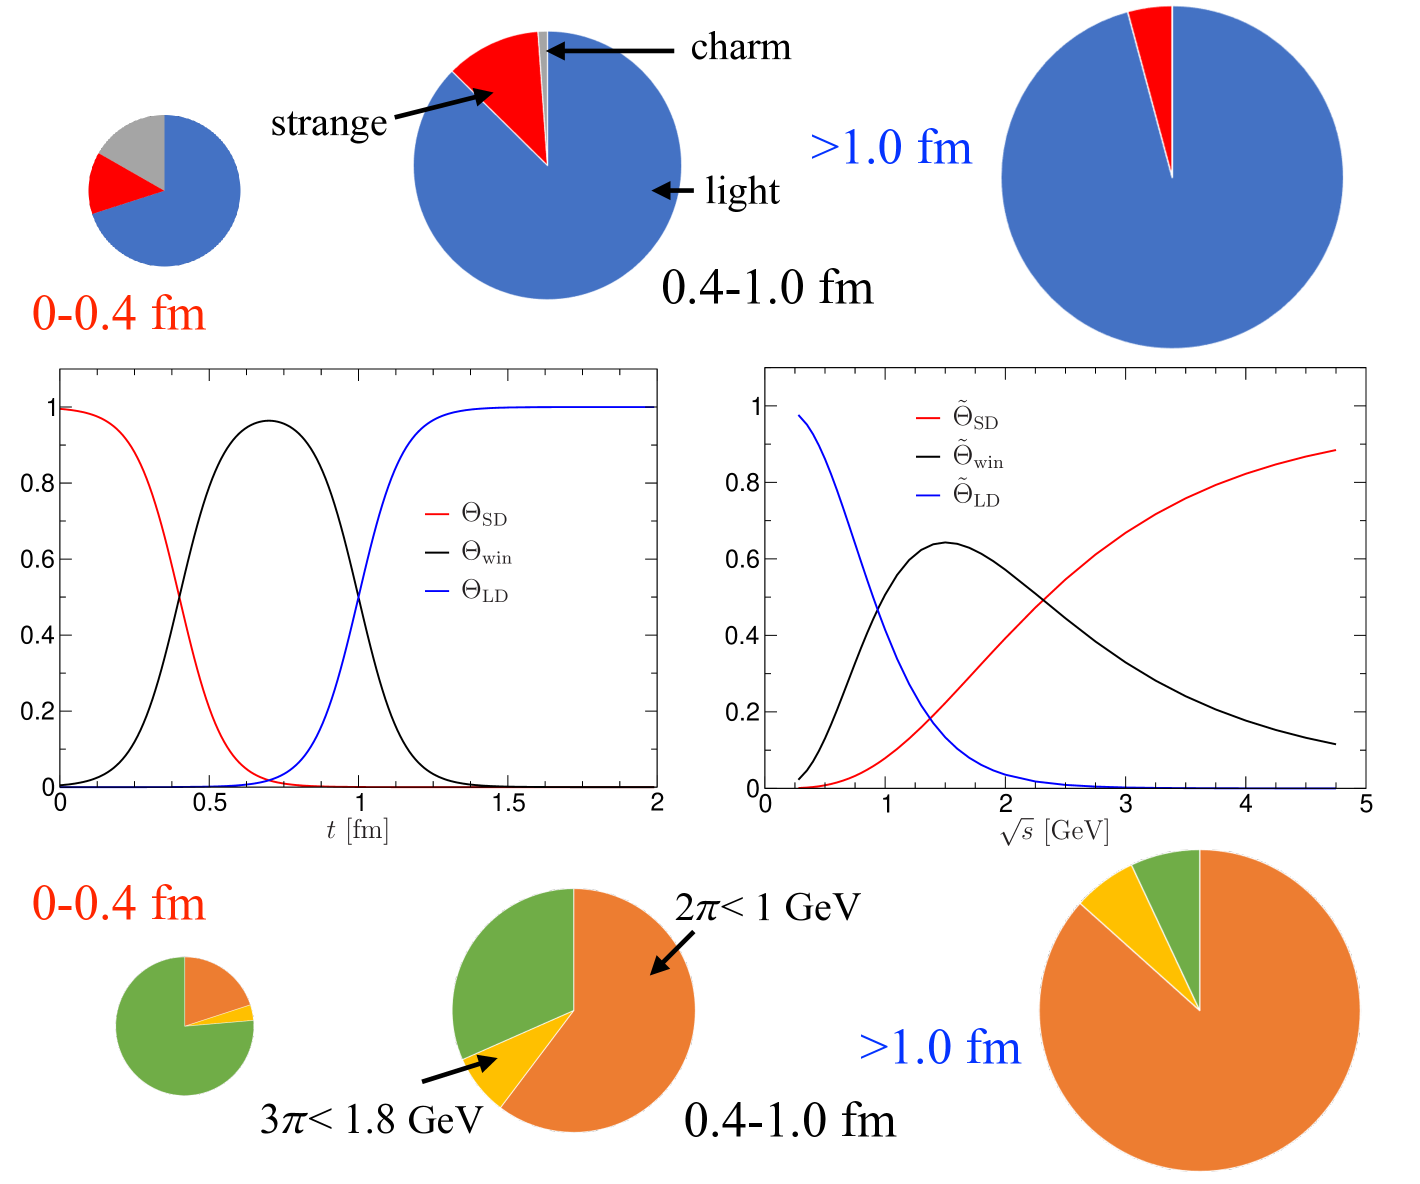
This cuts out time values above with a rounded edge set by , taken to be 0.15 fm. The left-hand plot shows the impact this has on the integrand and it can easily be seen that the partial LOHVP results will be much more precise. The standard windows that have been generally adopted use adaptions of this function to divide the time region into three: the short-distance window from 0–0.4 fm, the intermediate-distance window from 0.4–1.0 fm and the long-distance window above 1.0 fm (see Figure 10, which also shows in the upper pie charts the flavour breakdown of each window). The windowed results can simply be added together to obtain the total.
Figure 7 shows lattice results for the intermediate-distance window from light-quark connected correlators only (on the left) and the complete contribution for the short-distance and intermediate-distance windows (on the right). We notice immediately how much more impressive they are than the lattice results in Figure 4. There is striking agreement on results for the intermediate window from multiple different lattice groups using different quark formalisms with uncertainties at the level of 1% or below. Note that it is standard practice now to ‘blind’ results until the analysis is finalised to remove any bias from ‘knowing’ the answer. In fact these results constitute one of the best tests of full lattice QCD that has been done.
4 Windows on the data-driven LOHVP calculation
We now have accurate lattice QCD results for the partial LOHVP and we turn to a brief discussion of the data-driven approach with which we need to compare them. This was reviewed at Lattice 2023 by A. Keshavarzi. The method takes experimental data for as a function of centre-of-mass energy, , and integrates
| (7) |
is the bare cross-section with all hadron final states and final-state radiation included. Data from many experiments must be collated and averaged, taking correlations into account. At low values of (below 2 GeV) data for exclusive final states are used, above this inclusive data, and at very high energies, QCD perturbation theory. Figure 8 shows a map of the low data, which is emphasised by the kernel function. 75% of the LOHVP result comes from below 0.9 GeV [6].
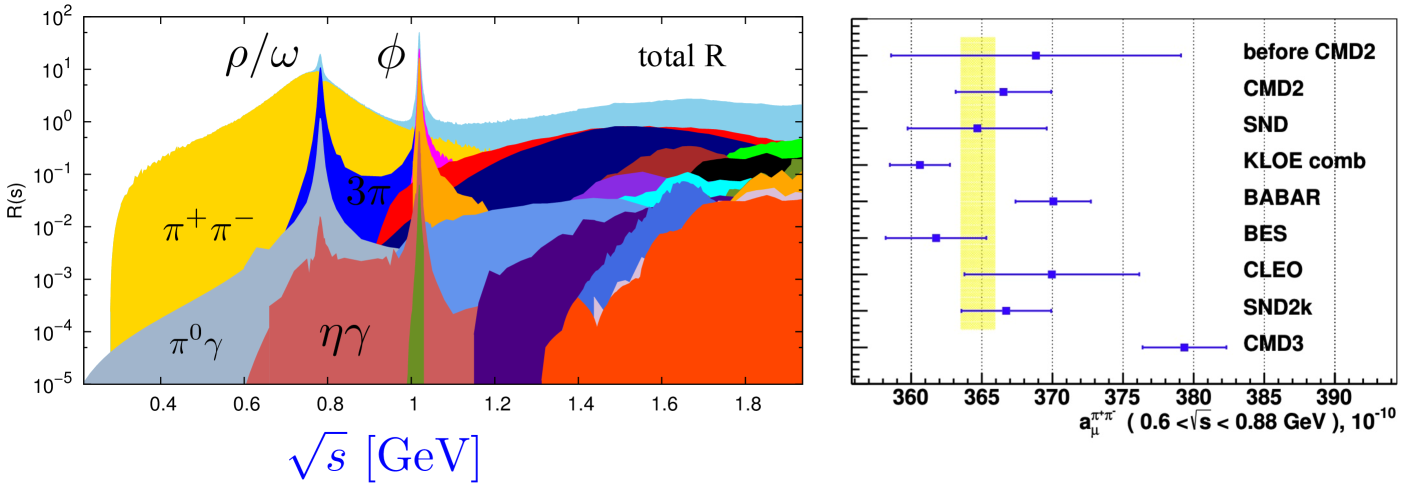
The cross-section measurements can be made in two different ways, either by a direct ‘energy scan’ at a fixed (but variable) colliding beam energy (e.g. SND, CMD-3, KEDR) or by ‘radiative return’ in which the beam energy does not change, but (tagged) initial-state photon radiation changes the collision energy (e.g. BaBar, BES III, KLOE). The tension between experimental results has to be taken into account and for WP20 [2] a key issue was the tension between KLOE and BaBar for below 1 GeV, a major contribution to the LOHVP. The two data-driven analyses that were combined for WP20 were from DHMZ19 [5] and KNT19 [6], as shown in Figure 4. The latter dataset is publically available and has been widely used.
More recently, 2023 results from CMD-3 [31, 32] for have caused consternation by being higher than previous values and increasing the tension in this channel to the point where it is hard to see how to take an average (right-hand plot of Figure 8). Further analysis will be needed to resolve this situation and work is underway; new results with improved statistics are expected from BaBar and KLOE, among others, in the near future. It has been suggested [44] that further attention should be paid to decay to hadrons via a virtual . It is possible to select final-states from this decay that correspond to the vector piece of the current and this differs only from the QED current by an isospin rotation. The isospin corrections are complicated, however, and this mode was not used in WP20. There is an opportunity here for lattice QCD to make input; see the talk at this conference by M. Bruno.
It is straightforward to compare lattice QCD and data-driven results in detail because the data-driven results can be converted from energy- to time-space using a Laplace transform [17].
| (8) |
where and is the ratio of to . Figure 9 shows this transformation of the KNT19 dataset. Given a from we can apply the time-window functions in exactly the same way as was done for the lattice QCD results. Note that the partial LOHVP results are physical, so a disagreement between the lattice and data-driven values in any window is just as worrying as for the full LOHVP.
Figure 10 shows the mapping of the short-distance, intermediate-distance and long-distance time windows into their equivalents in space. As might be expected, the short-distance time window has a larger contribution from higher values and the long-distance time window is completely dominated by . The lower pie charts show the varying makeup of the different time-windows in terms of 3 different hadronic channels covering different regions of [28].
We can now compare results for different time-windows between lattice QCD and data-driven approaches. This is shown in Figure 7. The left-hand plot has results for the 0.4–1.0 fm windows from light-quark connected (lqc) correlators only and the right-hand plot shows 0–0.4 fm and 0.4–1.0 fm windows for the complete LOHVP calculation. The data-driven results can be compared directly to the complete LOHVP lattice results in the right-hand plot and the values shown come from experimental data used in WP20. The lattice QCD results for 0.4–1.0 fm are clearly 3–4% larger, with tension at the level. No tension is evident for the 0–0.4 fm window. This points to an issue in the data at relatively low energy, following the lower pie charts of Figure 10. That this must be seriously considered is shown by the following fact. If the WP20 dataset (KNT19) is modified so that CMD-3 data is substituted for the low-energy cross-section then larger values for the windowed LOHVP are obtained that agree with the lattice QCD results. The plot on the left of Figure 7 shows the same feature for the lqc case. Here the data-driven comparison is not as straightforward since other flavours and disconnected contributions must be ‘removed’ from the data [45]. When this is done, a disagreement is seen with the BMW/DMZ24 lattice results [19], with the same picture echoed by the earlier lattice QCD calculations. When CMD-3 data is substituted, agreement is seen [26]. The long-distance window ( 1.0 fm) will be discussed in the next Section.
5 Update on the full LOHVP lattice results
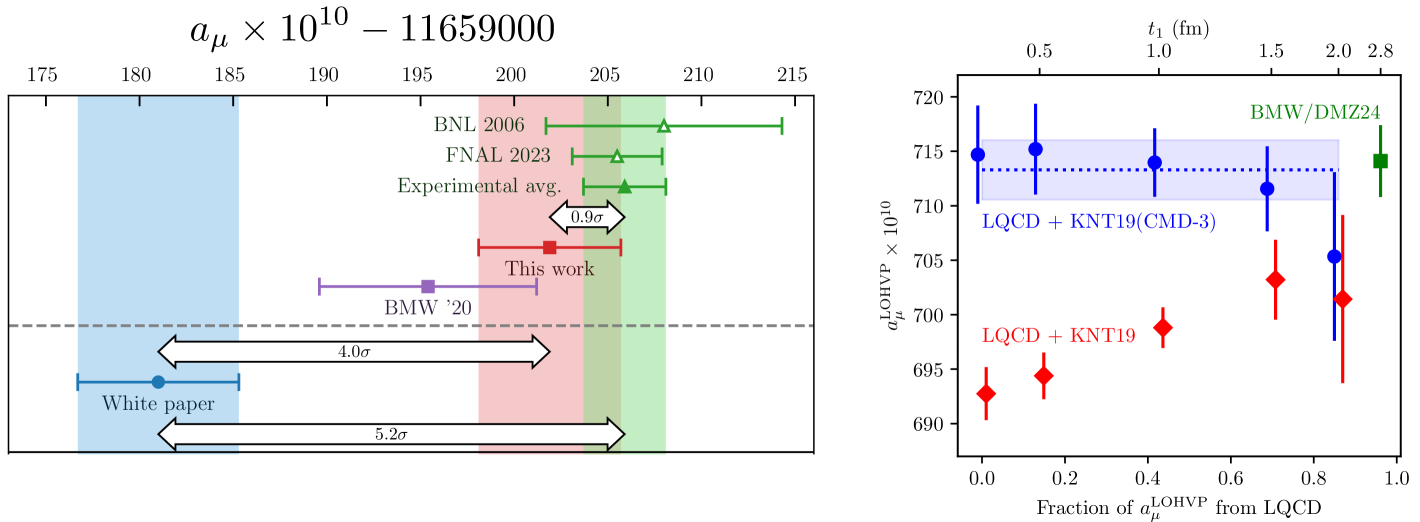
Just before the Lattice2024 conference the BMW/DMZ collaboration released a new result for the full LOHVP [19] of , 3% higher than the WP20 value of Eq. (1) and with a 0.5% uncertainty. The picture that this gives when compared to the experimental result (taking all other contributions from WP20 [2]) is shown on the left in Figure 11. It supports a ‘no new physics in ’ scenario. BMW/DMZ24 improves the uncertainty over the BMW20 result [14] by adding additional lattice data from a finer ensemble but also by using a 0–2.8 fm window for the lattice data and adding a value from data-driven results for 2.8– fm. This latter move reduces statistical errors and finite-volume corrections (and hence uncertainties) for the lattice data. The downside is that it then includes a small, but not negligible, contribution ( 3.9%) based on data that have been called into question (see Figures 7 and 8). How much should we worry about this? This was a very lively topic of conversation at the Lattice2024 conference.
The question calls for a more systematic study of the hybrid approach (combining lattice QCD and data-driven results) for determining the full LOHVP. This is done in [29] by adding lattice QCD results for a time-window from 0– with data-driven results from –, as a function of . As well as giving a total LOHVP, this method tests the consistency between lattice QCD and data-driven results; if they are consistent you should not be able to see the ‘join’ at and should get the same result independent of . This exercise is shown in the right-hand plot of Figure 11 using Fermilab/HPQCD/MILC lattice data from 2019 [11]. We see that a flat total is only obtained when CMD-3 data is substituted in KNT19, and this is backed up by a fully correlated fit to a constant (dashed blue line and band on the plot). The resulting total LOHVP in this case agrees with that from BMW/DMZ24.
Much better results could be obtained in this approach using newer lattice data and it has the potential to provide a more accurate total LOHVP than either lattice or data-driven results on their own (as Figure 11 indicates). The argument that data-driven results should now be completely discarded seems an unnecessarily extreme one. As we have seen, lattice QCD numbers provide strong support for the CMD-3 data. In the absence of an understanding of the difference with earlier data, however, a systematic uncertainty that takes into account this difference might be reasonable. A key point for the hybrid approach is that for values that are large, but still accessible on the lattice with good statistical accuracy, the difference in the total between using KNT19 and using KNT19(CMD-3) is small compared to the total uncertainty (at least for current lattice results). For fm, the difference is only .
Other collaborations discussed their pure lattice QCD results for the light-quark connected contribution to the long-distance window and hence, combining with the other windows, the full lqc piece of the LOHVP. The RBC/UKQCD collaboration unblinded their results for the lattice conference and they were presented by C. Lehner [46]; the Mainz/CLS [47] and Fermilab/HPQD/MILC [48] results were unblinded soon after. ETMC will also have a result shortly; in the meantime they have updated their and results [49].
The long-distance window is the hardest, with the largest lattice statistical and systematic uncertainties, as discussed in Section 3. The new lattice results have uncertainties at the level of 1.0% which represents a big improvement on what has previously been possible. The results are shown on the left of Figure 12. There is some spread/tension in the values, reflecting the difficulty of calculating in this window. More work may be needed to understand this. All of the values are above the data-driven result determined using KNT19 and correcting for other flavour contributions.
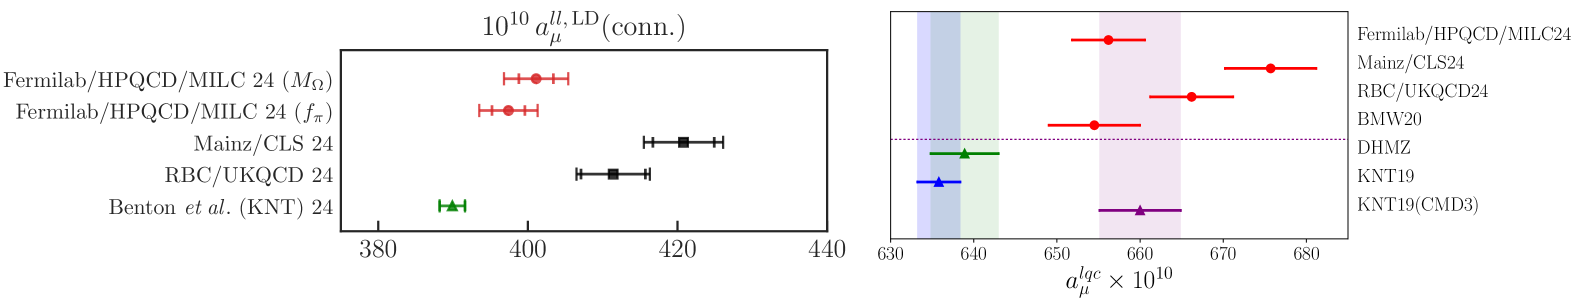
On the right is a comparison of the full light-quark connected contribution when each collaboration adds the long-distance (Fermilab/HPQCD/MILC use their value) to the short-distance and intermediate-distance windows. Also shown is the value from BMW20 [14] (connected light contribution +10/9 of the finite-volume correction, splitting this between connected and disconnected in the ratio of the contributions [51]). Below the dotted line are three data-driven results from [50]: the green point and band use DHMZ, the blue use KNT19 and the purple point KNT19(CMD3).
The right-hand plot of Figure 12 shows the light-quark connected contribution integrated over the full time range for the three lattice results from the left-hand plot as well as the BMW20 result. The same tensions visible in the left-hand plot are still there. The coloured bands correspond to data-driven values and it is clear that the best agreement with lattice QCD results is for the dataset in which CMD3 data has been substituted in the KNT19 dataset, agreeing with the narrative we have seen from other results.
The Mainz/CLS collaboration combine their long-distance window with their previous results, including for other flavours and QED and isospin-breaking effects, to quote a new value for the total LOHVP of [47], slightly higher than the BMW/DMZ24 value of [19] but also giving an value consistent with the experimental average,
As remarked earlier, these lattice LOHVP numbers are significantly larger than the data-driven values included in WP20. At the time that the similarly large LOHVP result from BMW20 appeared [14], there were worries that this would imply, through their common dependence on the hadronic vacuum polarisation function, a larger hadronic contribution to the running of that would conflict with values of from electroweak precision fits. However, because of the different energy-sensitivity in the two calculations this does not happen [14, 52] and shifts are within the level of uncertainty on . This is true also if CMD3 data is substituted in the KNT19 dataset [53]. MuonE@CERN [54] is an experiment that aims to map out the running of using scattering and determine its hadronic component to better than 0.5%, then also weighing in on the LOHVP contribution to . Test runs have begun but the full apparatus is due to be installed after the long–shutdown from 2026-29.
Given that the HOHVP contributions (see Section 2) use the same QCD input as the LOHVP but sum to a total () that is 1.2% of the size, the issues with the LOHVP will have little impact there. We now turn to the other important QCD contribution that must be pinned down: the hadronic light-by-light. This was reviewed at Lattice2023 by A. Gerardin.
6 The HLbL contribution
As for the LOHVP, there are two methods to determine the HLbL contribution. However in this case the data-driven, dispersive approach is less direct and the calculation must be broken down into multiple pieces. The contribution can instead be calculated directly in lattice QCD. It is an enormously complicated calculation but, following the pioneering work of RBC/UKQCD and Mainz/CLS, it is now tractable. The two approaches give a consistent picture and WP20 [2] combined the results [55, 56, 57, 58, 59, 60, 61, 62, 63, 64, 65, 66, 67, 68] to quote a value of .
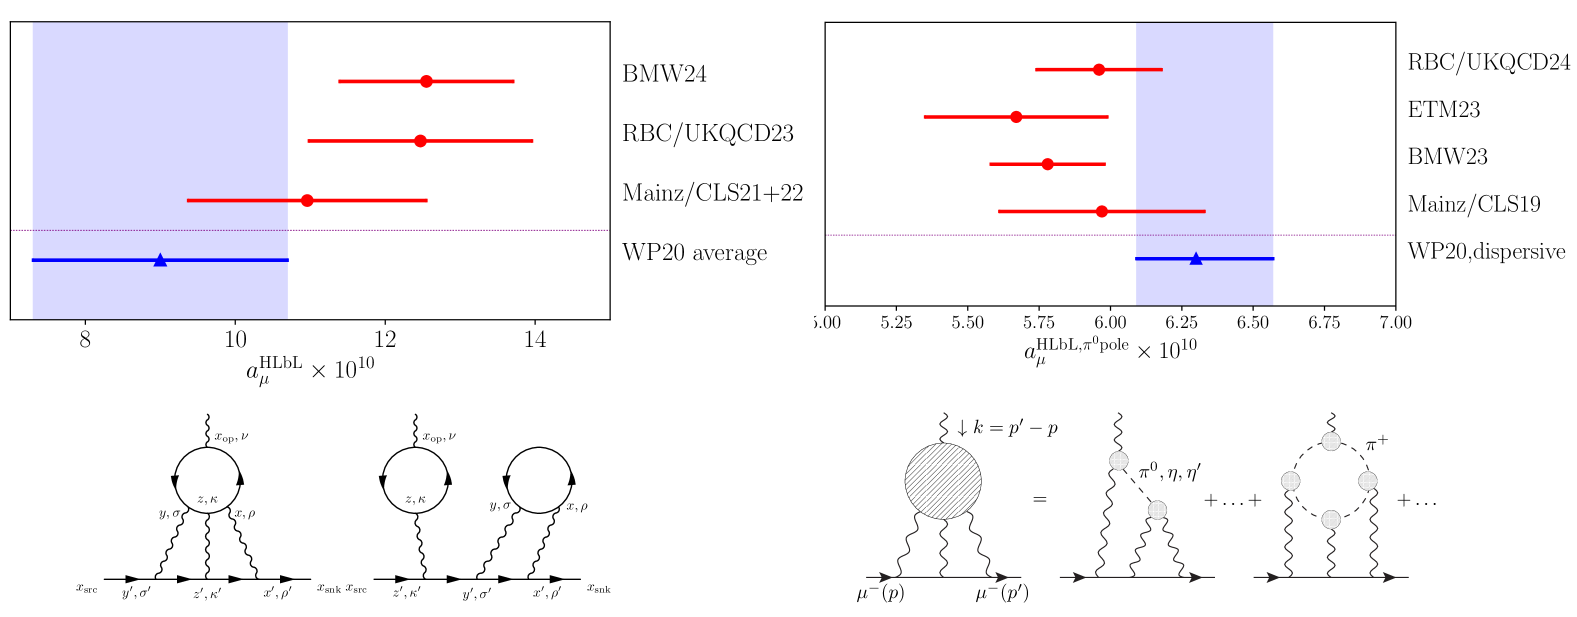
The right-hand plot compares lattice results for the -pole piece of the HLbL contribution. This is the largest single piece, as motivated by the diagram below. The lattice results in red are from 4 different quark formalisms [59, 73, 74, 75] and are compared to the WP20 value for this piece, within the dispersive framework, shown in blue.
The direct lattice calculation involves a 4-point correlation function that must be evaluated for light, and quarks, along with quark-line disconnected pieces. Figure 13 shows the current status of the lattice results on the left with a diagram below showing the connected and leading disconnected contributions. At this conference a new result was presented by C. Zimmermann for the BMW collaboration using staggered quarks [72]. This agrees well with earlier results from RBC/UKQCD [71] and Mainz/CLS [69, 70] using different formalisms, as shown in Figure 13. Preliminary results for the ETM collaboration using twisted-mass quarks were also shown at the conference by N. Kalntis [76].
Figure 13 shows that the post-WP20 lattice results have central values slightly higher than the WP20 value and somewhat smaller uncertainty at around 10%. This probably indicates that the HLbL contribution is slightly larger than the WP20 value, but only by a very small shift, . This is around the size of the uncertainty of the LOHVP contribution discussed in Section 5. Hence any change of this size will have minimal impact on the total SM value for . This is very reassuring to know, and lattice QCD is the only way to provide this level of certainty about the numbers in such a direct way.
The dispersive approach to the HLbL builds that contribution from low-energy single meson exchange plus loops with charged pions and kaons, followed by perturbation theory when all momenta are large (see the diagram on the right of Figure 13). The meson exchanges that dominate are those of the light pseudoscalars, , and , but there are also contributions from heavier scalar, axial-vector and tensor mesons. The pseudoscalar-meson-pole contributions, which are numerically the most important, can be written in terms of transition form factors, . These are experimentally accessible for different regions from two-photon collisions (at colliders), Dalitz decay (), and [2]. A test of the values at . comes from comparing to experiment.
The transition form factors can also be calculated in lattice QCD. The pole contribution has now been determined by four collaborations using different quark actions; a new result from RBC/UKQCD was presented at the conference by Tian Lin [75] and it agrees well with the earlier values as shown on the right in Figure 13. The lattice results agree reasonably well with the WP20 value for this piece, shown by the blue band, although they are all on the low side of it. The BMW23 calculation [73] includes also the and contributions, obtaining a total for the pseudoscalar poles of to be compared to from WP20. The lattice QCD results therefore provide significant validation of the pseudoscalar pole contributions in this dispersive framework. Although these are the largest, they are not the only contribution; there are more pieces, of size , and they have varying signs. There is nothing, however, to suggest any major disagreement between the direct lattice results and the dispersive approach for the HLbL contribution and this gives significant added confidence in theorists’ ability to determine this.
7 Conclusions
We have seen huge progress on lattice QCD results for the QCD contributions to since the 2020 Theory White Paper [2]. The lattice is now pinning down the largest such contribution, the LOHVP. Accurate results have been demonstrated for time-windowed pieces, with impressive agreement for the 0.4–1.0 fm window from many independent calculations with different quark actions (Figure 7). This is a major achievement for the lattice. There are also now several lattice results for the full light-quark connected contribution (Figure 12) and two new values for the complete LOHVP (Section 5). There has been continuing important lattice progress on the HLbL contribution to (Section 6), without raising any surprises.
The lattice values for the LOHVP, in contrast, call into question the data-driven numbers included in WP20 using the experimental data available at that time. There is significant disagreement between the lattice and WP20 data-driven results, particularly for the 0.4–1.0 fm window. This is shown very graphically when lattice and data-driven results are combined (Figure 11, right). Instead the lattice QCD results show a clear preference for the CMD3 data over earlier experimental results for this channel. It is critical that the differences within the experimental data should be understood; it is to be hoped that the new experimental analyses underway will shed light on this.
Lattice QCD results for the partial and full LOHVP all now point towards an LOHVP contribution to which is 3–4% larger than that given in WP20. This implies an SM value which is much closer to that seen in experiment, with the conclusion that there is much less new physics visible in than we had hoped, and perhaps none. There is still a lot to be done before we can arrive firmly at that conclusion. We need multiple lattice QCD values for the full LOHVP aiming at 0.5% precision from different groups using blinded analyses. This is well underway. Some improvements are still needed to reach this accuracy from a purely lattice calculation and a hybrid approach combining lattice QCD with data-driven values for the large-time tail should be considered.
Looking ahead, the final result for from the Muon g-2 experiment is expected in Spring 2025, preceded by a new Theory White Paper. A further measurement of is planned at J-PARC@KEK [77] using a very different technique with a compact magnetic ring and low-momentum . Data-taking should start in 2028 with 2 years of running needed to reach a result with the uncertainty of Muon g-2.
Acknowledgements
I am grateful to the organisers for giving me the opportunity to review this topic. I have had a lot of useful input from A. Keshavarzi and P. Lepage and also benefitted from discussions with A. El-Khadra, F. Erben, M. Garofolo, D. Giusti, M. Golterman, Luchang Jin, N. Kalntis, A. Kotov, A. Kronfeld, S. Kuberski, S. Lahert, C. Lehner, Tian Lin, C. McNeile, L. Parato, T. Teubner, U. Wenger and C. Zimmermann. This has been a most interesting and enjoyable conference and I thank all the participants for that.
References
- [1] Muon collaboration, Measurement of the Positive Muon Anomalous Magnetic Moment to 0.20 ppm, Phys. Rev. Lett. 131 (2023) 161802 [2308.06230].
- [2] T. Aoyama et al., The anomalous magnetic moment of the muon in the Standard Model, Phys. Rept. 887 (2020) 1 [2006.04822].
- [3] T. Blum, M. Hayakawa and T. Izubuchi, Hadronic corrections to the muon anomalous magnetic moment from lattice QCD, PoS LATTICE2012 (2012) 022 [1301.2607].
- [4] G. Colangelo et al., Prospects for precise predictions of in the Standard Model, 2203.15810.
- [5] M. Davier, A. Hoecker, B. Malaescu and Z. Zhang, A new evaluation of the hadronic vacuum polarisation contributions to the muon anomalous magnetic moment and to , Eur. Phys. J. C80 (2020) 241 [1908.00921].
- [6] A. Keshavarzi, D. Nomura and T. Teubner, The of charged leptons, and the hyperfine splitting of muonium, Phys. Rev. D101 (2020) 014029 [1911.00367].
- [7] Budapest-Marseille-Wuppertal collaboration, Hadronic vacuum polarization contribution to the anomalous magnetic moments of leptons from first principles, Phys. Rev. Lett. 121 (2018) 022002 [1711.04980].
- [8] RBC, UKQCD collaboration, Calculation of the hadronic vacuum polarization contribution to the muon anomalous magnetic moment, Phys. Rev. Lett. 121 (2018) 022003 [1801.07224].
- [9] D. Giusti, V. Lubicz, G. Martinelli, F. Sanfilippo and S. Simula, Electromagnetic and strong isospin-breaking corrections to the muon from Lattice QCD+QED, Phys. Rev. D 99 (2019) 114502 [1901.10462].
- [10] PACS collaboration, Hadronic vacuum polarization contribution to the muon with 2+1 flavor lattice QCD on a larger than (10 fm lattice at the physical point, Phys. Rev. D 100 (2019) 034517 [1902.00885].
- [11] Fermilab Lattice, HPQCD, MILC collaboration, Hadronic-vacuum-polarization contribution to the muon’s anomalous magnetic moment from four-flavor lattice QCD, Phys. Rev. D 101 (2020) 034512 [1902.04223].
- [12] A. Gérardin, M. Cè, G. von Hippel, B. Hörz, H.B. Meyer, D. Mohler et al., The leading hadronic contribution to from lattice QCD with flavours of O() improved Wilson quarks, Phys. Rev. D 100 (2019) 014510 [1904.03120].
- [13] D. Giusti and S. Simula, Lepton anomalous magnetic moments in Lattice QCD+QED, PoS LATTICE2019 (2019) 104 [1910.03874].
- [14] S. Borsanyi et al., Leading hadronic contribution to the muon magnetic moment from lattice QCD, Nature 593 (2021) 51 [2002.12347].
- [15] C. Lehner and A.S. Meyer, Consistency of hadronic vacuum polarization between lattice QCD and the R-ratio, Phys. Rev. D 101 (2020) 074515 [2003.04177].
- [16] T. Blum, Lattice calculation of the lowest order hadronic contribution to the muon anomalous magnetic moment, Phys. Rev. Lett. 91 (2003) 052001 [hep-lat/0212018].
- [17] D. Bernecker and H.B. Meyer, Vector Correlators in Lattice QCD: Methods and applications, Eur. Phys. J. A 47 (2011) 148 [1107.4388].
- [18] Fermilab Lattice, MILC, HPQCD collaboration, Windows on the hadronic vacuum polarization contribution to the muon anomalous magnetic moment, Phys. Rev. D 106 (2022) 074509 [2207.04765].
- [19] A. Boccaletti et al., High precision calculation of the hadronic vacuum polarisation contribution to the muon anomaly, 2407.10913.
- [20] QCD collaboration, Muon g-2 with overlap valence fermions, Phys. Rev. D 107 (2023) 034513 [2204.01280].
- [21] C. Aubin, T. Blum, M. Golterman and S. Peris, Muon anomalous magnetic moment with staggered fermions: Is the lattice spacing small enough?, Phys. Rev. D 106 (2022) 054503 [2204.12256].
- [22] M. Cè et al., Window observable for the hadronic vacuum polarization contribution to the muon g-2 from lattice QCD, Phys. Rev. D 106 (2022) 114502 [2206.06582].
- [23] Extended Twisted Mass collaboration, Lattice calculation of the short and intermediate time-distance hadronic vacuum polarization contributions to the muon magnetic moment using twisted-mass fermions, Phys. Rev. D 107 (2023) 074506 [2206.15084].
- [24] RBC, UKQCD collaboration, Update of Euclidean windows of the hadronic vacuum polarization, Phys. Rev. D 108 (2023) 054507 [2301.08696].
- [25] Fermilab Lattice, HPQCD, MILC collaboration, Light-quark connected intermediate-window contributions to the muon g-2 hadronic vacuum polarization from lattice QCD, Phys. Rev. D 107 (2023) 114514 [2301.08274].
- [26] G. Benton, D. Boito, M. Golterman, A. Keshavarzi, K. Maltman and S. Peris, Data-driven estimates for light-quark-connected and strange-plus-disconnected hadronic g-2 window quantities, Phys. Rev. D 109 (2024) 036010 [2311.09523].
- [27] Fermilab Lattice, HPQCD, MILC collaboration, Hadronic vacuum polarization for the muon from lattice QCD: Complete short and intermediate windows, 2411.09656.
- [28] G. Colangelo, A.X. El-Khadra, M. Hoferichter, A. Keshavarzi, C. Lehner, P. Stoffer et al., Data-driven evaluations of Euclidean windows to scrutinize hadronic vacuum polarization, Phys. Lett. B 833 (2022) 137313 [2205.12963].
- [29] C.T.H. Davies, A.S. Kronfeld, G.P. Lepage, C. McNeile and R.S. Van de Water, Utility of a hybrid approach to the hadronic vacuum polarization contribution to the muon anomalous magnetic moment, Phys. Rev. D 111 (2025) 014513 [2410.23832].
- [30] S. Kuberski, Muon : Lattice calculations of the hadronic vacuum polarization, PoS LATTICE2023 (2024) 125 [2312.13753].
- [31] CMD-3 collaboration, Measurement of the e+e-→+- cross section from threshold to 1.2 GeV with the CMD-3 detector, Phys. Rev. D 109 (2024) 112002 [2302.08834].
- [32] CMD-3 collaboration, Measurement of the Pion Form Factor with CMD-3 Detector and its Implication to the Hadronic Contribution to Muon (g-2), Phys. Rev. Lett. 132 (2024) 231903 [2309.12910].
- [33] CMD-2 collaboration, Reanalysis of hadronic cross-section measurements at CMD-2, Phys. Lett. B578 (2004) 285 [hep-ex/0308008].
- [34] CMD-2 collaboration, Measurement of the pion form-factor in the range 1.04-GeV to 1.38-GeV with the CMD-2 detector, JETP Lett. 82 (2005) 743 [hep-ex/0603021].
- [35] CMD-2 collaboration, Measurement of the e+ e- —> pi+ pi- cross section with the CMD-2 detector in the 370 - 520-MeV c.m. energy range, JETP Lett. 84 (2006) 413 [hep-ex/0610016].
- [36] CMD-2 collaboration, High-statistics measurement of the pion form factor in the rho-meson energy range with the CMD-2 detector, Phys. Lett. B648 (2007) 28 [hep-ex/0610021].
- [37] SND collaboration, Update of the e+ e- —> pi+ pi- cross-section measured by SND detector in the energy region 400-MeV < s**(1/2) < file1000-MeV, J. Exp. Theor. Phys. 103 (2006) 380 [hep-ex/0605013].
- [38] KLOE collaboration, Measurement of and the dipion contribution to the muon anomaly with the KLOE detector, Phys. Lett. B670 (2009) 285 [0809.3950].
- [39] KLOE collaboration, Measurement of from threshold to 0.85 GeV2 using Initial State Radiation with the KLOE detector, Phys. Lett. B700 (2011) 102 [1006.5313].
- [40] KLOE collaboration, Precision measurement of and determination of the contribution to the muon anomaly with the KLOE detector, Phys. Lett. B720 (2013) 336 [1212.4524].
- [41] KLOE-2 collaboration, Combination of KLOE measurements and determination of in the energy range GeV2, JHEP 03 (2018) 173 [1711.03085].
- [42] BABAR collaboration, Precise Measurement of the Cross Section with the Initial-State Radiation Method at BABAR, Phys. Rev. D86 (2012) 032013 [1205.2228].
- [43] BESIII collaboration, Measurement of the cross section between 600 and 900 MeV using initial state radiation, Phys. Lett. B753 (2016) 629 [1507.08188].
- [44] M. Davier, A. Hoecker, A.-M. Lutz, B. Malaescu and Z. Zhang, Tensions in measurements: the new landscape of data-driven hadronic vacuum polarization predictions for the muon , Eur. Phys. J. C 84 (2024) 721 [2312.02053].
- [45] G. Benton, D. Boito, M. Golterman, A. Keshavarzi, K. Maltman and S. Peris, Data-Driven Determination of the Light-Quark Connected Component of the Intermediate-Window Contribution to the Muon g-2, Phys. Rev. Lett. 131 (2023) 251803 [2306.16808].
- [46] RBC, UKQCD collaboration, The long-distance window of the hadronic vacuum polarization for the muon g-2, 2410.20590.
- [47] D. Djukanovic, G. von Hippel, S. Kuberski, H.B. Meyer, N. Miller, K. Ottnad et al., The hadronic vacuum polarization contribution to the muon at long distances, 2411.07969.
- [48] Fermilab Lattice, HPQCD, MILC collaboration, Hadronic vacuum polarization for the muon from lattice QCD: Long-distance and full light-quark connected contribution, 2412.18491.
- [49] Extended Twisted Mass Collaboration (ETMC) collaboration, Strange and charm quark contributions to the muon anomalous magnetic moment in lattice QCD with twisted-mass fermions, 2411.08852.
- [50] G. Benton, D. Boito, M. Golterman, A. Keshavarzi, K. Maltman and S. Peris, Data-driven results for light-quark connected and strange-plus-disconnected hadronic g2 short- and long-distance windows, Phys. Rev. D 111 (2025) 034018 [2411.06637].
- [51] B. Chakraborty, C.T.H. Davies, J. Koponen, G.P. Lepage, M.J. Peardon and S.M. Ryan, Estimate of the hadronic vacuum polarization disconnected contribution to the anomalous magnetic moment of the muon from lattice QCD, Phys. Rev. D 93 (2016) 074509 [1512.03270].
- [52] M. Cè, A. Gérardin, G. von Hippel, H.B. Meyer, K. Miura, K. Ottnad et al., The hadronic running of the electromagnetic coupling and the electroweak mixing angle from lattice QCD, JHEP 08 (2022) 220 [2203.08676].
- [53] L. Di Luzio, A. Keshavarzi, A. Masiero and P. Paradisi, Model-Independent Tests of the Hadronic Vacuum Polarization Contribution to the Muon g-2, Phys. Rev. Lett. 134 (2025) 011902 [2408.01123].
- [54] MUonE collaboration, Measuring the leading hadronic contribution to the muon g-2 via scattering, Eur. Phys. J. C 77 (2017) 139 [1609.08987].
- [55] K. Melnikov and A. Vainshtein, Hadronic light-by-light scattering contribution to the muon anomalous magnetic moment revisited, Phys. Rev. D70 (2004) 113006 [hep-ph/0312226].
- [56] P. Masjuan and P. Sánchez-Puertas, Pseudoscalar-pole contribution to the : a rational approach, Phys. Rev. D95 (2017) 054026 [1701.05829].
- [57] G. Colangelo, M. Hoferichter, M. Procura and P. Stoffer, Dispersion relation for hadronic light-by-light scattering: two-pion contributions, JHEP 04 (2017) 161 [1702.07347].
- [58] M. Hoferichter, B.-L. Hoid, B. Kubis, S. Leupold and S.P. Schneider, Dispersion relation for hadronic light-by-light scattering: pion pole, JHEP 10 (2018) 141 [1808.04823].
- [59] A. Gérardin, H.B. Meyer and A. Nyffeler, Lattice calculation of the pion transition form factor with Wilson quarks, Phys. Rev. D100 (2019) 034520 [1903.09471].
- [60] J. Bijnens, N. Hermansson-Truedsson and A. Rodríguez-Sánchez, Short-distance constraints for the HLbL contribution to the muon anomalous magnetic moment, Phys. Lett. B798 (2019) 134994 [1908.03331].
- [61] G. Colangelo, F. Hagelstein, M. Hoferichter, L. Laub and P. Stoffer, Longitudinal short-distance constraints for the hadronic light-by-light contribution to with large- Regge models, JHEP 03 (2020) 101 [1910.13432].
- [62] V. Pauk and M. Vanderhaeghen, Single meson contributions to the muon‘s anomalous magnetic moment, Eur. Phys. J. C74 (2014) 3008 [1401.0832].
- [63] I. Danilkin and M. Vanderhaeghen, Light-by-light scattering sum rules in light of new data, Phys. Rev. D95 (2017) 014019 [1611.04646].
- [64] F. Jegerlehner, The Anomalous Magnetic Moment of the Muon, Springer Tracts Mod. Phys. 274 (2017) 1.
- [65] M. Knecht, S. Narison, A. Rabemananjara and D. Rabetiarivony, Scalar meson contributions to from hadronic light-by-light scattering, Phys. Lett. B787 (2018) 111 [1808.03848].
- [66] G. Eichmann, C.S. Fischer and R. Williams, Kaon-box contribution to the anomalous magnetic moment of the muon, Phys. Rev. D101 (2020) 054015 [1910.06795].
- [67] P. Roig and P. Sánchez-Puertas, Axial-vector exchange contribution to the hadronic light-by-light piece of the muon anomalous magnetic moment, Phys. Rev. D101 (2020) 074019 [1910.02881].
- [68] T. Blum, N. Christ, M. Hayakawa, T. Izubuchi, L. Jin, C. Jung et al., The hadronic light-by-light scattering contribution to the muon anomalous magnetic moment from lattice QCD, Phys. Rev. Lett. 124 (2020) 132002 [1911.08123].
- [69] E.-H. Chao, R.J. Hudspith, A. Gérardin, J.R. Green, H.B. Meyer and K. Ottnad, Hadronic light-by-light contribution to from lattice QCD: a complete calculation, Eur. Phys. J. C 81 (2021) 651 [2104.02632].
- [70] E.-H. Chao, R.J. Hudspith, A. Gérardin, J.R. Green and H.B. Meyer, The charm-quark contribution to light-by-light scattering in the muon from lattice QCD, Eur. Phys. J. C 82 (2022) 664 [2204.08844].
- [71] RBC, UKQCD collaboration, Hadronic light-by-light contribution to the muon anomaly from lattice QCD with infinite volume QED at physical pion mass, Phys. Rev. D 111 (2025) 014501 [2304.04423].
- [72] Z. Fodor, A. Gerardin, L. Lellouch, K.K. Szabo, B.C. Toth and C. Zimmermann, Hadronic light-by-light scattering contribution to the anomalous magnetic moment of the muon at the physical pion mass, 2411.11719.
- [73] A. Gérardin, W.E.A. Verplanke, G. Wang, Z. Fodor, J.N. Guenther, L. Lellouch et al., Lattice calculation of the , and transition form factors and the hadronic light-by-light contribution to the muon , 2305.04570.
- [74] Extended Twisted Mass collaboration, Pion transition form factor from twisted-mass lattice QCD and the hadronic light-by-light 0-pole contribution to the muon g-2, Phys. Rev. D 108 (2023) 094514 [2308.12458].
- [75] T. Lin, M. Bruno, X. Feng, L.-C. Jin, C. Lehner, C. Liu et al., Lattice QCD calculation of the -pole contribution to the hadronic light-by-light scattering in the anomalous magnetic moment of the muon, 2411.06349.
- [76] N. Kalntis, G. Kanwar, M. Petschlies, S. Romiti and U. Wenger, Hadronic light-by-light contribution to the muon g-2 using twisted-mass fermions, PoS LATTICE2024 (2025) 228 [2412.12320].
- [77] M. Abe et al., A New Approach for Measuring the Muon Anomalous Magnetic Moment and Electric Dipole Moment, PTEP 2019 (2019) 053C02 [1901.03047].