Computational Analysis of Degradation Modeling in Blind Panoramic Image Quality Assessment
Abstract.
Blind panoramic image quality assessment (BPIQA) has recently brought new challenge to the visual quality community, due to the complex interaction between immersive content and human behavior. Although many efforts have been made to advance BPIQA from both conducting psychophysical experiments and designing performance-driven objective algorithms, limited content and few samples in those closed sets inevitably would result in shaky conclusions, thereby hindering the development of BPIQA, we refer to it as the easy-database issue. In this paper, we present a sufficient computational analysis of degradation modeling in BPIQA to thoroughly explore the easy-database issue, where we carefully design three types of experiments via investigating the gap between BPIQA and blind image quality assessment (BIQA), the necessity of specific design in BPIQA models, and the generalization ability of BPIQA models. From extensive experiments, we find that easy databases narrow the gap between the performance of BPIQA and BIQA models, which is unconducive to the development of BPIQA. And the easy databases make the BPIQA models be closed to saturation, therefore the effectiveness of the associated specific designs can not be well verified. Besides, the BPIQA models trained on our recently proposed databases with complicated degradation show better generalization ability. Thus, we believe that much more efforts are highly desired to put into BPIQA from both subjective viewpoint and objective viewpoint.
1. Introduction
Panoramic image (also called omnidirectional image or 360∘ image) is able to capture 360 range visual content and provides an immersive experience, which differs substantially from 2D planar image. Accordingly, the interaction between omnidirectional content and users makes the modeling of actual users’ viewing behavior in an immersive environment much more complex than planar images, as well as for other relevant tasks, e.g., panoramic image quality assessment (PIQA). Image quality assessment (IQA) has been a basic and classic research topic in the image processing community, which has thrived in a diverse direction in recent years. R&R-Net (Ma et al., 2021) focuses on addressing catastrophic forgetting in cross-task blind IQA by introducing a scalable incremental learning framework (Ma et al., 2023). LIQE (Zhang et al., 2023b) enhances the evaluation ability with the help of multitask learning strategy. DGQA (Li et al., 2024) is dedicated to bridging the gap between synthetic and authentic images. IQA also gained much attention from both academia and industry due to its wide applications in algorithm improvement (Fang et al., 2021) and system optimization (Siekkinen et al., 2018; Le et al., 2021). Compared to other long-standing research topics, i.e., quality assessment of various contents, including general 2D planar image, underwater image (Hou et al., 2023), computer graphics image (Zhang et al., 2023a), stereoscopic image (Fang et al., 2019; Yan et al., 2020b), synthesized image (Yan et al., 2020a), algorithm-generated image (Fang et al., 2020a), 3D point cloud (Zhou et al., pear), etc., PIQA shows particular features in quality degradation modeling, i.e., the internal geometric characteristic of panoramic images and external diverse human viewing behaviors.
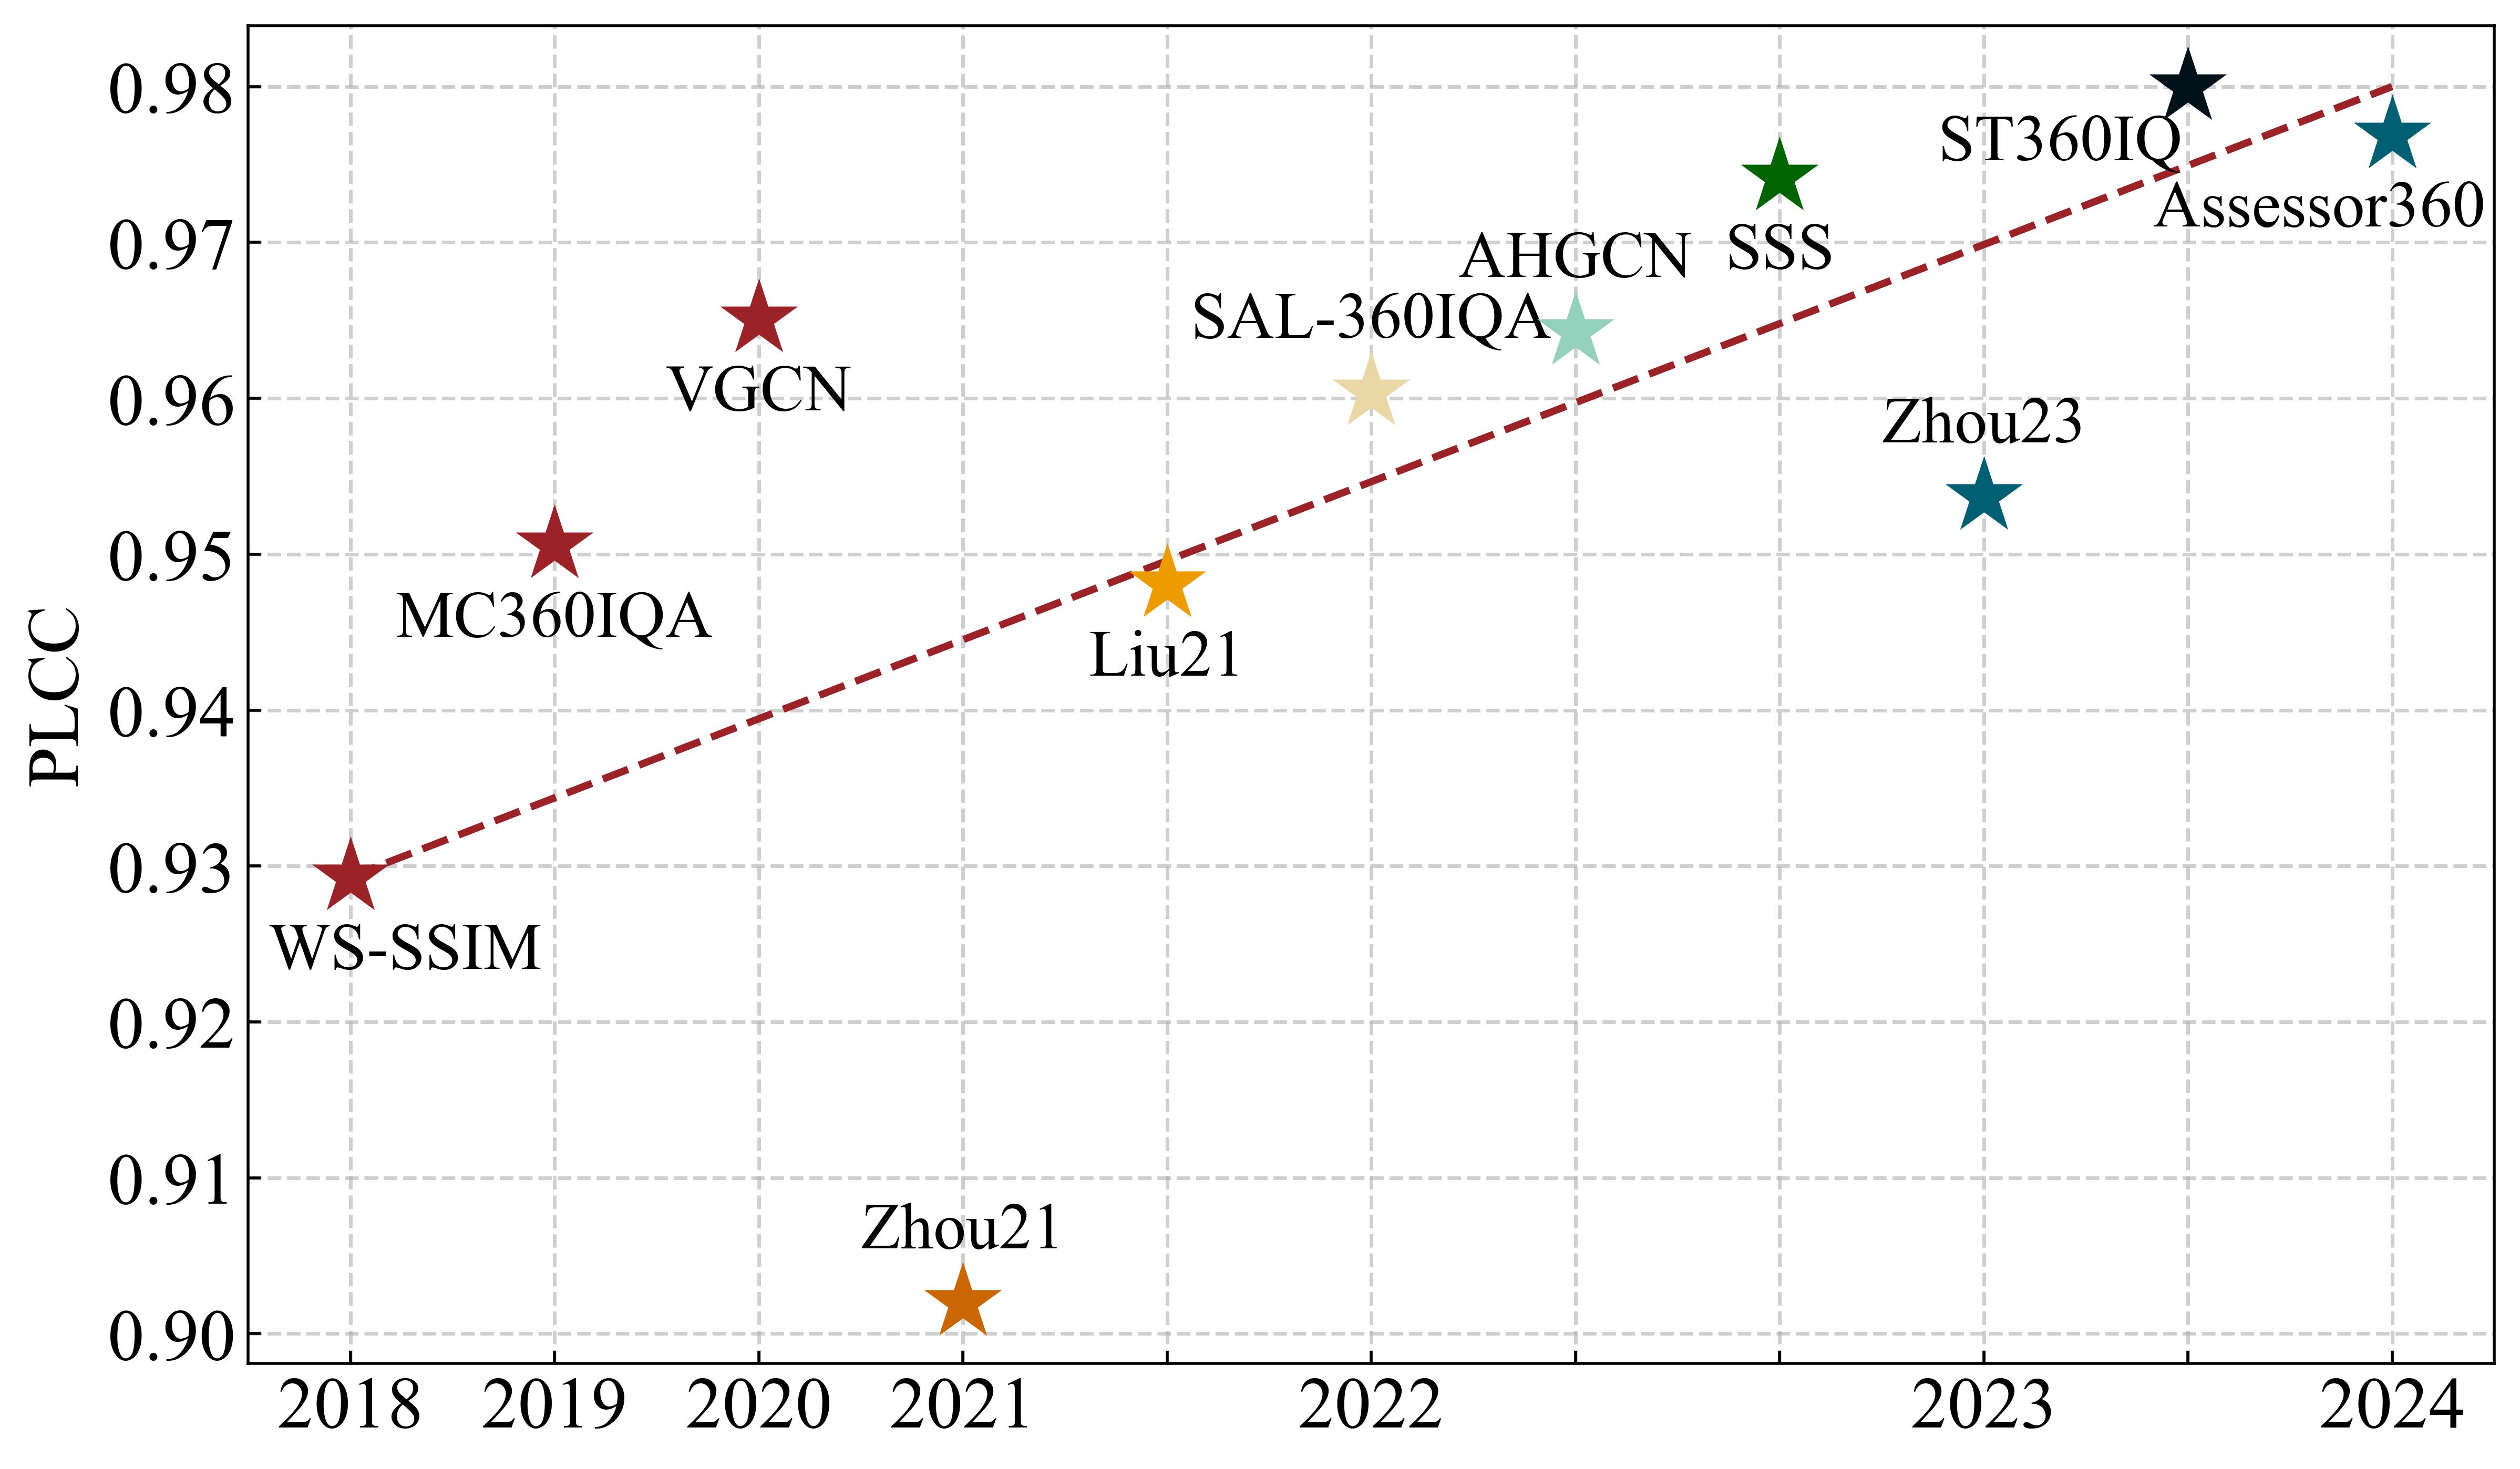
A straightforward methodology to design PIQA models is to modify widely used full-reference (FR) IQA (FR-IQA) models such as peak signal-to-noise ratio (PSNR) and SSIM (Wang et al., 2004) by considering the aforementioned internal and external features, e.g., WS-PSNR (Sun et al., 2017) and WS-SSIM (Zhou et al., 2018), however, they show sub-optimal performance due to their limited quality representation ability and the complexity of modeling human viewing behaviors. Another approach is converting panoramic images into videos by extracting consecutive viewports (Sui et al., 2021), achieving quality prediction through video quality assessment (VQA) models while using data compression strategy (Yan et al., 2024b) to improve process efficiency. In the past few years, PIQA has gained significant development by integrating the characteristics of the human visual system (HVS) and advanced architectures in designing quality degradation modeling modules, especially those deep learning based blind PIQA (BPIQA) models (which can be deployed without access to reference images, and thus more practical in real applications). As shown in Fig. 1, the recently proposed PIQA models, i.e., ST360IQ (Tofighi et al., 2023) and Assessor360 (Wu et al., 2023), largely surpass these models proposed several years ago, and approximate to 0.98 in terms of pearson linear correlation coefficient on the CVIQ database (Sun et al., 2018). Note that this situation also exists on other public PIQA databases. From those public results, it seems that the performance of current state-of-the-art PIQA models has been saturated, and thus only leaves limited room for improvement. Actually, as this regard, the core issue, i.e., data, has been overlooked. As shown in Tab. 1, one of the largest so far public databases contains only slightly more than one thousand panoramic images, which is very sparse in the whole panoramic image space. Compared to those public IQA databases (Ma et al., 2016; Fang et al., 2020b), these public PIQA databases (except the JUFE-10K and OIQ-10K databases (Yan et al., pteda, ptedb)) also suffer from single image content and simple degradation situation. This embarrassing fact is in stark contrast to the data-hungry characteristic of deep learning models, i.e., the limited number of data brings high-risk over-fitting problem and therefore reduces the credibility of the comparison results on those public PIQA databases. Besides, the repetitive training on these closed sets would easily lead to data leakage. By considering this, we argue that the real development status should be overshadowed by the shortage of large-scale public PIQA databases.
| Database | # Year | # Images | Resolution | Degradation | Distortion Type | Distortion Level |
| CVIQ (Sun et al., 2018) | 2018 | 544 | 4K | Homo | JPEG, AVC, HEVC | 11 |
| OIQA (Duan et al., 2018) | 2018 | 336 | 11K, 13K | Homo | JPEG, JP2K, GB, GN | 5 |
| MVAQD (Jiang et al., 2021) | 2021 | 315 | 4K12K | Homo | JPEG, JP2K, HEVC, WN, GB | 4 |
| IQA-ODI (Yang et al., 2021) | 2021 | 1,080 | 8K | Homo | JPEG, Projection | 4 |
| JUFE (Fang et al., 2022) | 2022 | 1,290 | 8K | Hetero | GB, GN, BD, ST | 3 |
| OSIQA (Duan et al., 2023) | 2023 | 300 | 6K | Hetero | ST, Projection | 4 |
| AIGCOIQA (Yang et al., 2024) | 2024 | 300 | 4K | AIGC | - | - |
| JUFE-10K (Yan et al., pteda) | 2024 | 10,320 | 8K | Hetero | GB, GN, BD, ST | 3 |
| OIQ-10K (Yan et al., ptedb) | 2024 | 10,000 | 0.8K20K | Homo, Hetero | JPEG, JP2K, JPEG XT, TM, AVC, HEVC, VP9, GB, GN, BD, ST, DS, AU | - |
Motivated by these studies regarding model evaluation (Yan et al., 2021; Fang et al., 2023; Sun et al., pear), in this paper, we aim to seek the truth of current status of BPIQA, and discuss the strengths and weaknesses of these BPIQA models to find potential directions for next-generation subjective databases and objective models. We start from the data issue in PIQA (a.k.a, the easy-database problem (Sun et al., pear)), it highlights that closed sets with limited content and few samples cannot fully realize the potential of BPIQA models, thereby hindering the development of BPIQA. Therefore, three perspectives to be investigated naturally arise: the gap between BPIQA and blind image quality assessment (BIQA), the necessity of specific design in BPIQA model, and the generalization ability of BPIQA models. For the first perspective, following the current mainstream design concept, i.e., extract viewports as models’ input like users’ viewing process, we use the (weighted) outputs of an IQA model on viewports as the quality prediction of the corresponding panoramic image. For the second perspective, we try to design a family of BPIQA models with only pure backbone network (i.e., without any specific designs like PIQA models), and compare them with current deep learning based BPIQA, BIQA and VQA models. For the third perspective, we examine it by cross-database validation, verifying whether the test BPIQA models overfit in the public PIQA databases and therefore show unreal prosperity.
In summary, our contributions are three folds:
-
•
We present the first computational analysis to uncover the truth of current development status of BPIQA, and point out the design direction of next-generation BPIQA models.
-
•
We take a close look at BPIQA (deep learning models) from three elaborate perspectives, including the gap between BPIQA and BIQA, the necessity of specific design in BPIQA models, and the generalization ability of BPIQA models.
-
•
We conduct detailed quantitative experiments and give qualitative analysis, where we find that some public PIQA databases seem to be relatively simple for these deep learning based BPIQA models, and much more efforts are desired to be put in the future.
2. Related Work
In this section, we first introduce objective BPIQA models, and then describe the studies regarding model evaluation.
2.1. Objective BPIQA Models
BPIQA is a non-trivial task since it can be deployed in real time dynamic bandwidth allocation (Liu et al., 2023a). Same to BIQA models, those hand-crafted features based BPIQA models (Liu et al., 2023b; Jiang et al., 2021) follow a general two-independent-step framework, including quality-sensitivity feature extraction by considering prior knowledge and quality regression by a shallow learning algorithm. Limited by the representation ability and learning capacity, those models have been gradually surpassed by deep learning based BPIQA models, which can be categorized into viewport-unaware BPIQA models (Xu et al., 2020; Sun et al., 2019; Zhou et al., 2021; Chai et al., 2021; Zhou et al., 2023) and viewport-aware BPIQA models (Fang et al., 2022; Yang et al., 2022b; Wu et al., 2023; Liu et al., 2024) (we omit deep learning based for clarity). Note that viewport-unaware means these models measure quality degradation of panoramic images without considering human browsing behavior (i.e., only a limited field of view can be seen by users at any single moment), and vice versa. Some of these viewport-unaware BPIQA models (Xu et al., 2020; Chai et al., 2021) accept the originally distorted panoramic image, e.g., in the format of equirectangular projection (ERP), as input. Xu et al. (Xu et al., 2020) built a spatial viewport graph to capture the dependency between local viewports and a global branch to predict the global quality of the entire panoramic image. Chai et al. (Chai et al., 2021) designed a three-channel network to simulate the complex interaction of monocular and binocular perception, and introduced deformable convolution to process non-uniform sampling distortion distributions. The others (Sun et al., 2019; Zhou et al., 2021, 2023) extract viewports from different directions, while also ignoring human behavior when browsing panoramic images.
As shown in our previous study (Sui et al., 2021), viewing conditions, including the starting point and the exploration time, have significant influence on users’ quality of experience. Considering this, Fang et al. (Fang et al., 2022) took an initial step to an end-to-end BPIQA model by injecting the ground-truth starting point (which is represented by its coordinates) and the exploration time to quality-aware feature representation. However, this model (Fang et al., 2022) is unfriendly when user’s viewing behavior is unknown. Liu et al. (Liu et al., 2024) recently extended this BPIQA model (Fang et al., 2022) by substituting the backbone with a more powerful encoder. Yang et al. (Yang et al., 2022b) designed a trajectory-guided BPIQA model, which is jointly optimized by head trajectory prediction and quality assessment. Wu et al. (Wu et al., 2023) proposed a recursive probability sampling method with the consideration of content and detailed information for generating viewport sequences, and input these sequences to the multi-scale feature aggregation module for capturing viewport-wise distortion and followed by a temporal modeling module for learning the viewport transition. Recently, Yan et al. (Yan et al., 2024a) introduced a multi-task auxiliary network framework designed to assess heterogeneously distorted panoramic images by emulating the parallel learning capabilities of the human brain.
To sum up, current BPIQA models achieve significant performance on the homogeneous PIQA databases (e.g., CVIQ and OIQA). However, most of them have not been tested on large-scale PIQA databases and overlooked heterogeneous distortions, which obscures the real development status of PIQA. In this work, we conduct extensive quantitative experiments, focusing on analyzing model performance across different databases to reveal the current state of PIQA development.
2.2. Model Evaluation
Instead of technically pursuing high-performance on those closed sets, these works regarding model evaluation aim to look back over what we have done in certain research topics and reflect on what should we do next. To this end, a natural and common way is to revisit the failure sources which make models get into trouble (Ma et al., 2020; Wang et al., 2020; Yan et al., 2021). Zhang et al. (Zhang et al., 2016) compared a top-performing single frame pedestrian detector with a human baseline, and identified both localisation and background-versus-foreground errors manually. Besides, the authors addressed these two types of errors by studying the impact of training annotation noise and convents for pedestrian detection, respectively. Kamann et al. (Kamann and Rother, 2020) exploited an extensive evaluation of the robustness of semantic segmentation against real-world corruptions. Other than corruptions (Kamann and Rother, 2020) or exposing failures (Ma et al., 2020; Wang et al., 2020; Yan et al., 2021), Recht et al. (Recht et al., 2019) found that the performance of ImageNet (Deng et al., 2009) classifiers drops range from 3% to 15% on two prominent benchmarks, i.e., CIFAR-10 and ImageNet. Speculated from the results, the drops are resulted from the models’ helplessness to generalize the slightly “harder” samples than that in original test sets.
The aforementioned studies are conducted in the scope of closed sets, which generally refer to the held-out test sets of the public databases. In (Wang and Simoncelli, 2008), Wang et al. proposed a novel model comparison method namely MAximum Discrepancy (MAD) competition from the perspective of “analysis by synthesis”, which only needs few samples. In the concept of MAD, the model who has stronger ability to falsify the other model is considered better. The pioneer MAD competition methodology, however, requires the compared models to be differentiable, and thus is hard to extend, e.g., comparing the non-differentiable models. Ma et al. (Ma et al., 2020) extended this work (Wang and Simoncelli, 2008) to an easily extensible methodology for comparing multiple computational models regardless of whether the compared models are differentiable or not. The concept of MAD competition has also been successfully adapted to IQA (Wang and Ma, 2021; Wang et al., 2021), image classification (Wang et al., 2020), and semantic segmentation (Yan et al., 2021).
Although numerous research studies have been conducted on model evaluation, such as IQA, image segmentation, and object detection, there has yet to be a similar systematic review in the PIQA domain. To address the potential shortcomings in existing PIQA research, we conduct a detailed study on PIQA by considering different model evaluation approaches.
3. The Generic BPIQA Framework
In this section, we describe the generic BPIQA framework, which includes a viewport generator for simulating human behavior, a viewport-wise feature extractor for capturing intra-viewport quality degradation, an inter-viewport interaction module for measuring their collective influence, and a quality regression module for mapping quality-sensitive features to global quality.
3.1. Viewport Generator
Given panoramic images , where denotes the -th panoramic image, and and denote its height and width, respectively. Firstly, viewports of -th panoramic image are selected by a sampling strategy:
| (1) |
where ; denotes the -th extracted viewport of the -th panoramic image, and , ; and denote the sampling operation and corresponding sampling trajectory, respectively. Instead of using default scanpath (Sui et al., 2021; Zhang and Liu, 2022) or predicting scanpath (Sui et al., 2023), we adopt a simple yet efficient way by considering that users are more likely to view the regions along the equator of panoramic image (Deng et al., 2021), which can be formulated as follows:
| (2) |
where is the sampling operation according to coordinate and field of view (FoV), FoV=/3; denotes the start point whose default value is 0, and denotes the longitude offset of the -th viewport of the -th panoramic image. In this paper, is set to 45° and eight viewports with size of 224224 are extracted.
3.2. Viewport-wise Feature Extractor
Similar to BIQA and VQA models, the feature extractor in BPIQA models takes a viewport v as input, and extracts corresponding quality-aware features x, which can be formulated as follows:
| (3) |
where denotes the extracted features, and , ; denotes the learnable parameters. Note that can be instantiated by any convolutional neural network (CNN), Transformer or their hybrid architecture. In practice, we remove the head layer and sequentially process the viewports through the network to obtain visual perceptual features. The impact of different types of feature extractors is discussed in Section 4.4.
3.3. Inter-viewport Interaction Module
This module aims to measure the collective influence of selected viewports on panoramic image quality, which plays a significant importance in mimicking users’ viewing behavior (Hands and Avons, 2001; Fang et al., 2022), and can be formulated as follows:
| (4) |
where denotes the merged quality features of -th panoramic image, and denote the dimension of and the number of viewports, respectively; ; and denote the interaction module and its parameters, respectively. Recurrent neural networks, similar to those used in VQA, are commonly employed to capture interaction dependencies between viewports during the viewing process, it can be formulated as follows:
| (5) |
where and represent the previous hidden state and the current hidden state, respectively; is the Sigmoid activation function, and is the bias. Note that the detailed analysis regarding its effectiveness will be given in Section 4.4.
3.4. Quality Regression Module
Finally, the quality score of -th panoramic image can be obtained by a quality regression operation:
| (6) |
where and denote the regression method and its parameters, respectively. In previous works, there are mainly two regression methods: integrated mapping and partial mapping, which will be discussed in Section 4.4. The former utilizes interaction modeling to fuse the features of different viewports from the same panoramic image, and then the quality score can be mapped by several fully connected (FC) layers. While in the latter one, the features of the -th viewport in the -th panoramic image are first mapped to a quality score:
| (7) |
where and denote the learnable projection layer and bias, respectively. Subsequently, these quality scores are then aggregated using average pooling:
| (8) |
4. Experiments
In this section, we first introduce the test PIQA databases. Then, we describe the experimental settings in detail, including the proposed BPIQA models and the evaluation criteria. Later, a quantitative analysis is conducted to explore the easy-database issue in BPIQA. Finally, we summarize the experimental results.
4.1. The Test PIQA Databases.
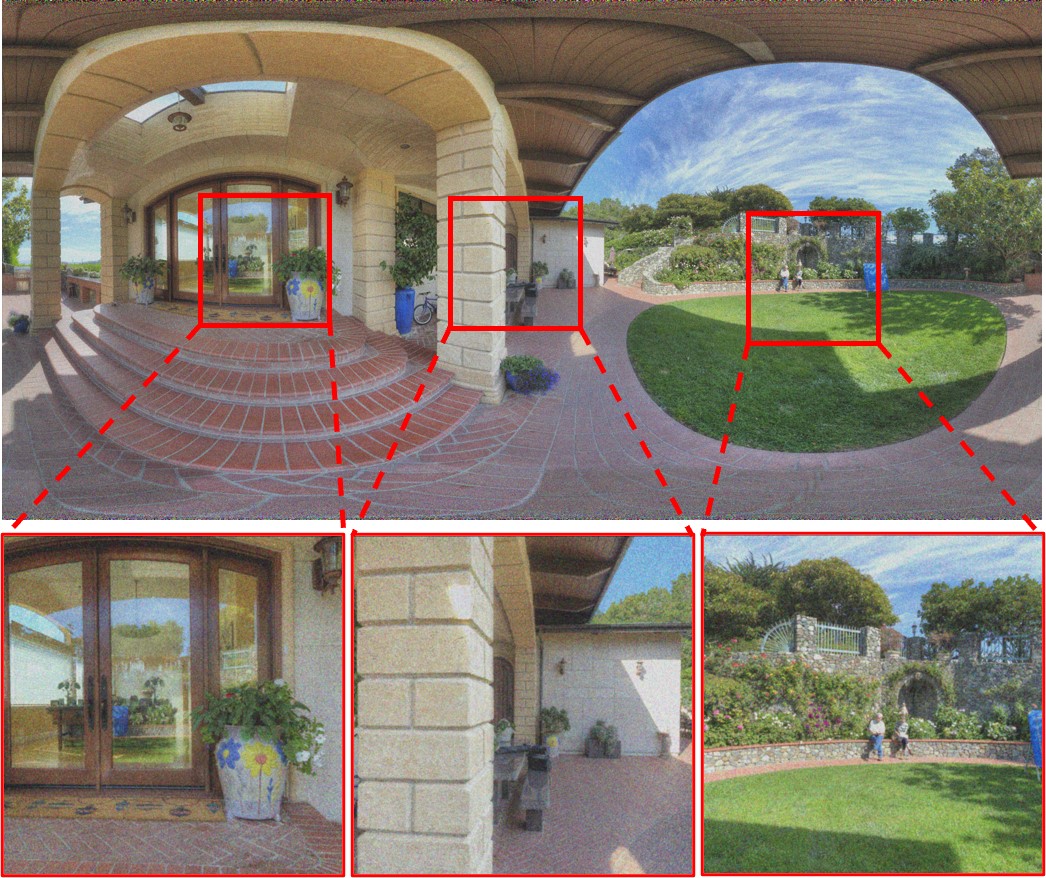
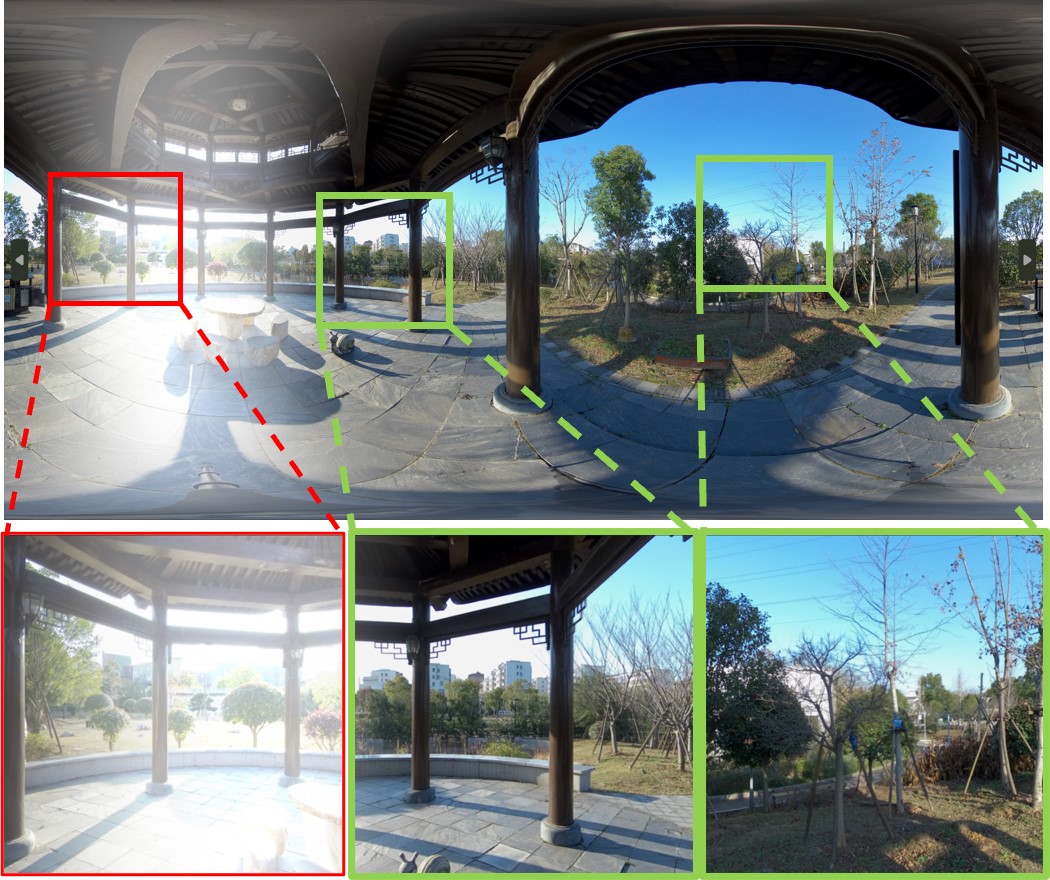
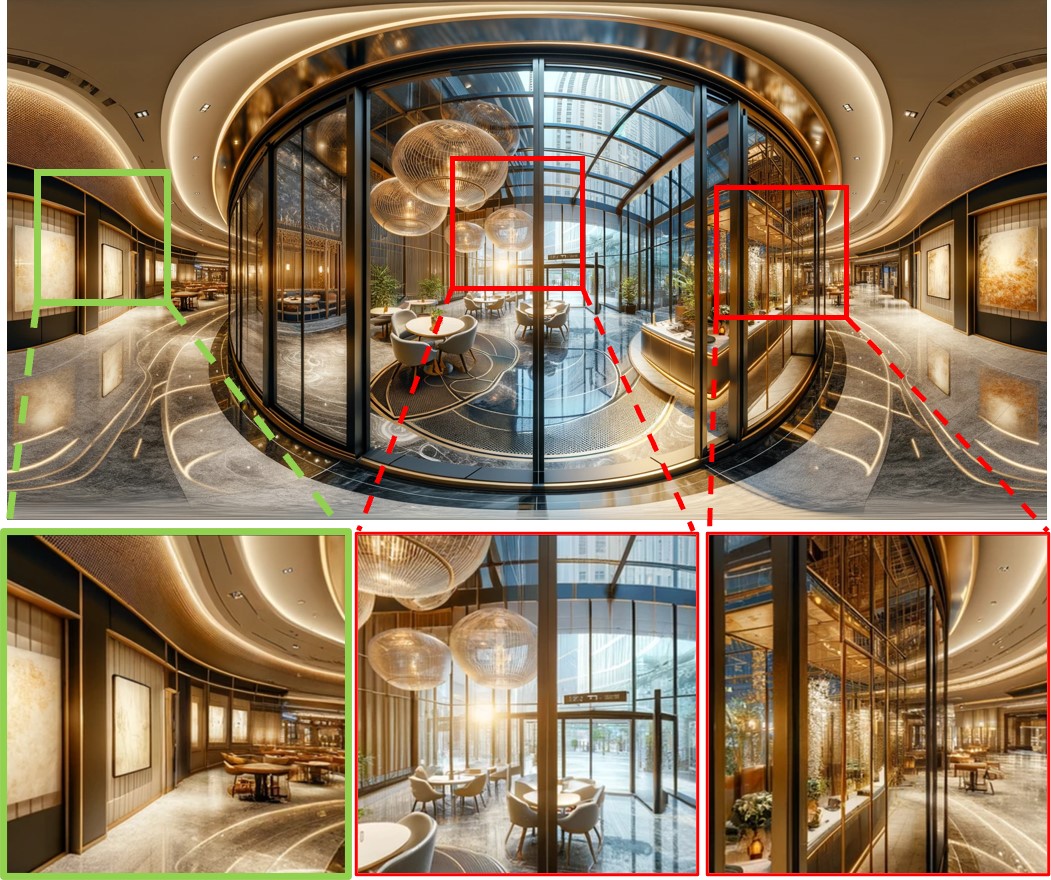
We conduct experiments on eight public PIQA databases, including CVIQ (Sun et al., 2018), OIQA (Duan et al., 2018), MVAQD (Jiang et al., 2021), IQA-ODI (Yang et al., 2021), OSIQA (Duan et al., 2023), OIQ-10K (Yan et al., ptedb), JUFE-10K (Yan et al., pteda), and AIGCOIQA (Yang et al., 2024). According to the distortion situation, these databases can be roughly categorized into three classes: homogeneous distortion, heterogeneous distortion, and generated distortion. As shown in Fig. 2, the panoramic image with homogeneous distortion exhibits similar visual quality in each region, the panoramic image with heterogeneous distortion exhibits varied perceptual quality in the viewing process, and the panoramic image with generated distortion could show unreasonable elements, e.g, suspended lights and wrong light reflection in Fig. 2 (c). Other details of these databases can refer to Tab. 1.
Note that although the source images in CVIQ contain diverse scenes, the distortion type and content (e.g. composition and colorfulness) are relatively monotonous, which may be insufficient to cover the full range of real-world scenarios. Similar to CVIQ, OIQA also contains limited content and a small number of samples, making it impossible to improve the database’s quality fundamentally. IQA-ODI focuses on the impairments of JPEG compression and map projection on panoramic images, where the projection patterns include cubemap projection format (CMP), cylindrical projection format (CPP), icosahedron projection format (ISP), and octahedron projection format (OHP). JUFE is the first large-scale database to study the heterogeneous distortion issue, where the disruption is randomly applied to one of the six lenses and then get the locally distorted panoramic images. OSIQA focuses on distortions caused by stitching and includes 300 distorted panoramic images generated from 12 original scenes. To study the unique distortions emerging in AI-generated panoramic images, AIGCOIQA generates 300 panoramic images by leveraging multiple AIGC models and employing 25 textual prompts, and all images have the same resolution of 4K. AIGCOIQA explores the perceptual quality of generated images from three perspectives: quality, comfortability, and correspondence. Each image contains latent generated distortion due to the inherent lack of realism in AIGC models. Compared to the JUFE database, JUFE-10K offers more samples, a richer variety of scenes, and more pronounced and diverse quality discontinuities. OIQ-10K is a large-scale database containing 10,000 panoramic images with both homogeneous distortion and heterogeneous distortion. To deal with the limited diversity in image content and distortion variation, OIQ-10K gathers panoramic images from existing PIQA databases and online websites, covering the vast majority of application scenarios. Four types of distortion range are taken into account, i.e., images without perceptibly distorted region, images with one distorted region, images with two distorted regions, and images with global distortion.
4.2. Experimental Settings
As described in Section 3, a basic BPIQA model requires four parts, including a viewport generator, a viewport-wise feature extractor, an inter-viewport interaction module, and a quality regression module. Naturally, BIQA and VQA models can serve as BPIQA models with minor modifications. The former ones could learn quality prior knowledge through pre-training on large-scale planar image quality databases such as KonIQ-10K (Hosu et al., 2020), and the latter ones could cope with users’ viewing behavior by utilizing a temporal module. To comprehensively revisit this filed, we test eight BIQA models, including HyperIQA (Su et al., 2020), LinearIQA (Li et al., 2020), UNIQUE (Zhang et al., 2021), CONTRIQUE (Madhusudana et al., 2022), MANIQA (Yang et al., 2022a), VCRNet (Pan et al., 2022), LIQE (Zhang et al., 2023b), and QualiCLIP (Agnolucci et al., 2024). All BIQA models take eight viewport images as input, and the viewport size is set to . To obtain the final predicted quality score, each model predicts the quality of each viewport and then averages all scores to a final score. These BIQA models are pre-trained on the KonIQ-10K (Hosu et al., 2020) (except that VCRNet is pre-trained on LIVE II (Sheikh et al., 2006), since its pre-trained weights on KonIQ-10K are unavailable). Three VQA models are taken into account to explore the effect of the temporal module in degradation modeling, including VSFA (Li et al., 2019), Transformer-VSFA (a variant of VSFA by substituting the backbone with the pure transformer (Vaswani et al., 2017)), and FAST-VQA (Wu et al., 2022). Since VQA models take consecutive frames as input, providing more frames as input is essential. Therefore, we extract 30 viewport images by applying the Equator (2) where is set to 12°, to serve as the input for the VQA models. Besides, we test three top-performing BPIQA models, including MC360IQA (Sun et al., 2019), Assessor360 (Wu et al., 2023) and OIQAND (Yan et al., pteda) to study the impact of the inter-viewport interaction module. To eliminate the design bias in existing BPIQA models, we additionally propose five BPIQA models using only pure backbone network as the baseline models, including ResNet-50-P (He et al., 2016), ResNet-152-P (He et al., 2016), Swin-v2-T-P (Liu et al., 2022a), Swin-v2-B-P (Liu et al., 2022a), and MaxViT-T-P (Tu et al., 2022) (‘-P’ denotes the variant for panoramic image). As described in Section 3, we replace the head layer of these general models with the FC layers to obtain the quality score of each viewport, and the average pooling is adopted to fuse local scores to the global score. The summary of these models is shown in Tab. 2.
| Model | # Year | Type | Input Type | Input Stream | Feature Extractor | Viewport Interaction | Quality Regressor |
| HyperIQA (Su et al., 2020) | 2020 | BIQA | Image | 8VPs | CNN | None | MLP |
| LinearIQA (Li et al., 2020) | 2020 | BIQA | Image | 8VPs | CNN | None | MLP |
| UNIQUE (Zhang et al., 2021) | 2021 | BIQA | Image | 8VPs | CNN | None | MLP |
| CONTRIQUE (Madhusudana et al., 2022) | 2022 | BIQA | Image | 8VPs | CNN | None | MLP |
| MANIQA (Yang et al., 2022a) | 2022 | BIQA | Image | 8VPs | Transformer | None | WP |
| VCRNet (Pan et al., 2022) | 2022 | BIQA | Image | 8VPs | CNN | None | MLP |
| LIQE (Zhang et al., 2023b) | 2023 | BIQA | Image&Text | 8VPs | Transformer | None | Probability |
| QualiCLIP (Agnolucci et al., 2024) | 2024 | BIQA | Image&Text | 8VPs | Transformer | None | Similarity |
| VSFA (Li et al., 2019) | 2019 | VQA | Video | 30VPs | CNN | GRU | WP |
| Transf-VSFA (Vaswani et al., 2017) | 2017 | VQA | Video | 30VPs | Transformer | GRU | WP |
| FAST-VQA (Wu et al., 2022) | 2020 | VQA | Video | 30VPs | Transformer | Video Swin-T | Conv3d&GAP |
| MC360IQA (Sun et al., 2019) | 2019 | BPIQA | Image | 8VPs | CNN | Integrated Mapping | MLP |
| Assessor360 (Wu et al., 2023) | 2024 | BPIQA | Image | 15VPs | Transformer | RSP&GRU | MLP |
| OIQAND (Yan et al., pteda) | 2024 | BPIQA | Image | 8VPs | Transformer | Viewports Vit | MLP |
| ResNet-50-P (He et al., 2016) | 2016 | BPIQA | Image | 8VPs | CNN | None | MLP |
| ResNet-152-P (He et al., 2016) | 2016 | BPIQA | Image | 8VPs | CNN | None | MLP |
| Swin-v2-T-P (Liu et al., 2022a) | 2022 | BPIQA | Image | 8VPs | Transformer | None | MLP |
| Swin-v2-B-P (Liu et al., 2022a) | 2022 | BPIQA | Image | 8VPs | Transformer | None | MLP |
| MaxViT-T-P (Tu et al., 2022) | 2022 | BPIQA | Image | 8VPs | Hybrid | None | MLP |
In experiments, we randomly split the panoramic images in each PIQA database into 80% and 20% for training and testing, respectively. Since each distorted image in the OSIQA database is associated with two MOS values (corresponding to different viewing angles), we use the average of the two MOS values as the overall quality of the image to optimize BPIQA models. The proposed five BPIQA models are pre-trained on the ImageNet (Russakovsky et al., 2015), and all experiments are implemented by the PyTorch framework (Paszke et al., 2017). In the training phase, these computational models are optimized by the Adam (Kingma and Ba, 2015) with an initial learning rate of and the cosine decay learning rate with the minimum learning rate of . The loss function is Norm-in-Norm loss (Li et al., 2020). The batch size and epochs are set to 16 and 50, respectively. Note that, for models other than those proposed, the training settings are kept consistent with those in the original papers to minimize the influence of other factors. In the cross-database validation, every image from the testing database is used. All experiments are conducted on an NVIDIA GeForce GTX 4090 machine.
4.3. Performance Evaluation Criteria
We employ Pearson’s linear correlation coefficient (PLCC) and Spearman’s rank order correlation coefficient (SRCC) as the criteria to evaluate these BIQA and BPIQA models. PLCC measures the accuracy of the prediction, and SRCC measures the consistency in monotonicity between the predicted and true scores, where a higher value denotes better performance. As suggested in (Sheikh et al., 2006), a five-parameter logistic function is applied before calculating PLCC.
4.4. Experimental Results and Quantitative Analysis
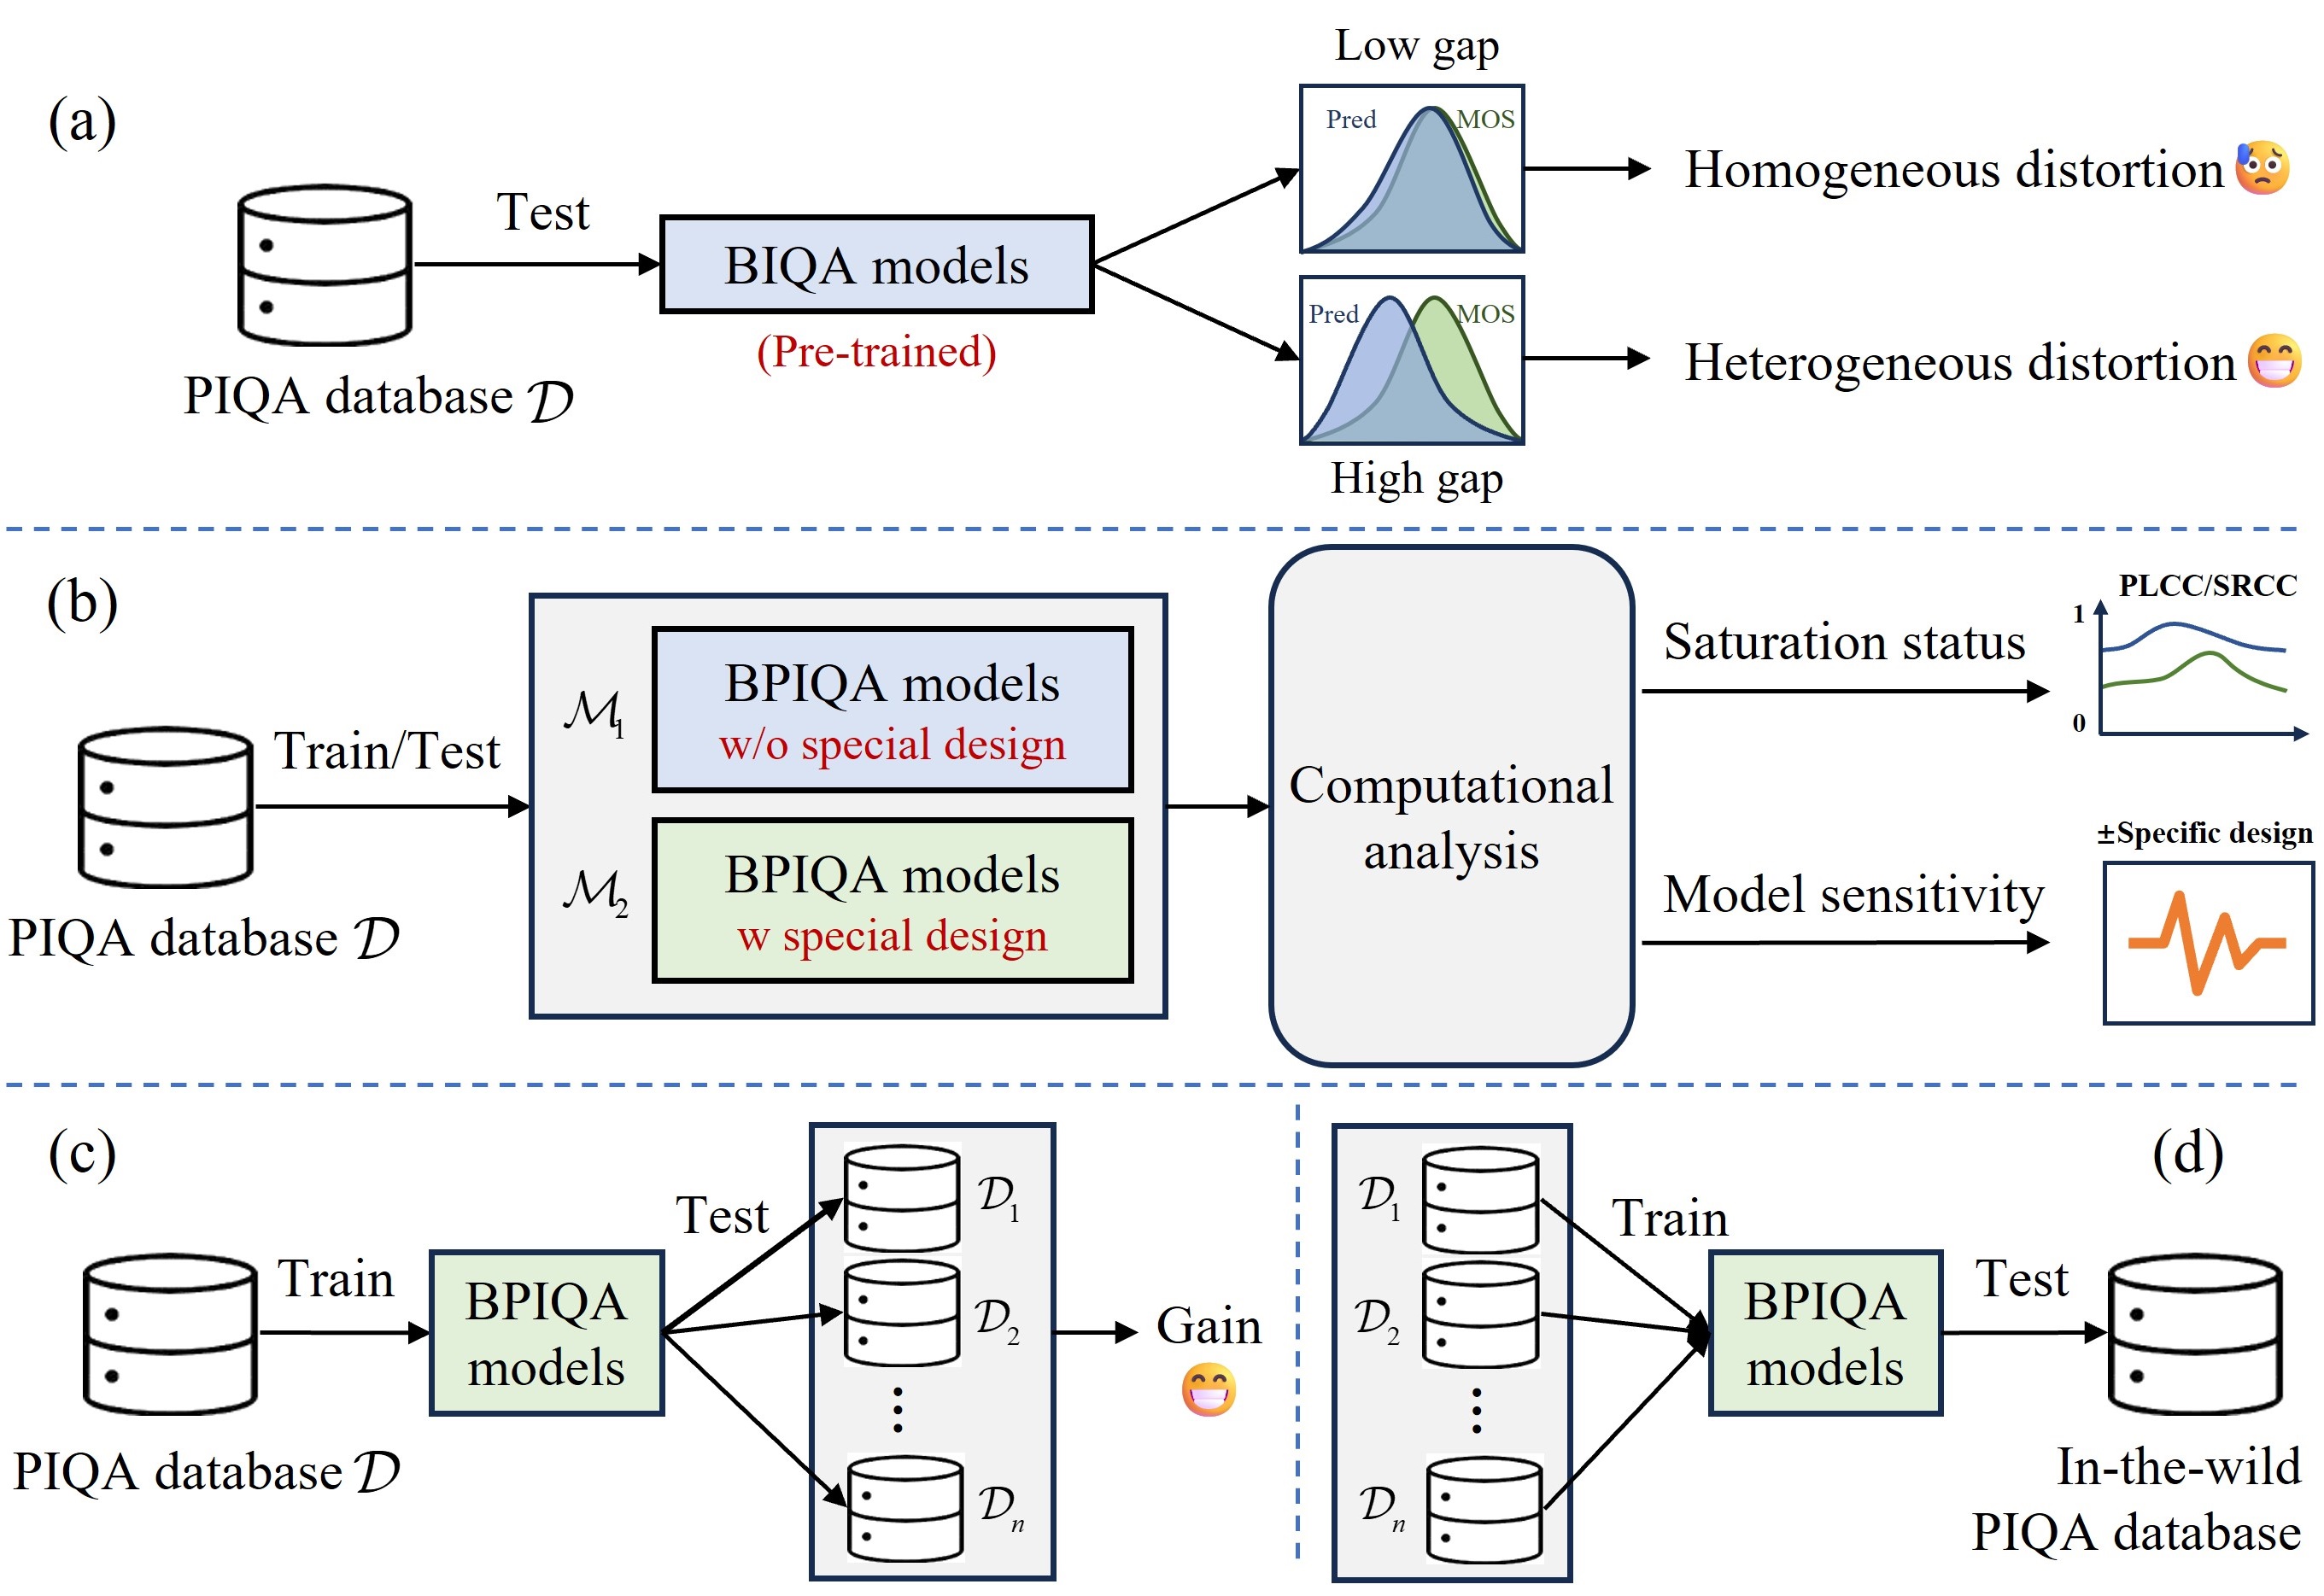
To investigate the easy-database issue thoroughly, we present an analysis framework, as shown in Fig. 3. Specifically, we first investigate the gap between BIQA and BPIQA by testing BIQA models on public PIQA databases, which provides a preliminary and rough judgment on whether the test database is conducive to the development of PIQA. To further study whether specific designs contribute to the development of PIQA, we examine the impact of various design elements on evaluation performance. Besides, we conduct experiments across multiple databases to explore how the test database enables BPIQA models to handle challenging samples. This involves a series of cross-database validations and a debiased evaluation. The detailed discussions are as follows.
| CVIQ (7) | OIQA (6) | MVAQD (5) | IQA-ODI (3) | OSIQA (1) | OIQ-10K (4) | JUFE-10K (2) | ||||||||
| Method | PLCC | SRCC | PLCC | SRCC | PLCC | SRCC | PLCC | SRCC | PLCC | SRCC | PLCC | SRCC | PLCC | SRCC |
| HyperIQA | 0.725 | 0.731 | 0.597 | 0.573 | 0.611 | 0.610 | 0.318 | 0.331 | 0.353 | 0.239 | 0.589 | 0.563 | 0.215 | 0.208 |
| Gap (0.917/0.906) | -20.9% | -19.3% | -34.9% | -36.8% | -33.4% | -32.7% | -65.3% | -63.5% | -61.5% | -73.6% | -35.8% | -37.9% | -76.6% | -77.0% |
| LinearityIQA | 0.747 | 0.744 | 0.672 | 0.664 | 0.660 | 0.649 | 0.453 | 0.406 | 0.358 | 0.202 | 0.620 | 0.598 | 0.300 | 0.294 |
| Gap (0.947/0.938) | -21.1% | -20.7% | -29.0% | -29.2% | -30.3% | -30.8% | -52.2% | -56.7% | -62.2% | -78.5% | -34.5% | -36.2% | -68.3% | -68.7% |
| UNIQUE | 0.834 | 0.785 | 0.762 | 0.737 | 0.581 | 0.551 | 0.536 | 0.409 | 0.247 | 0.180 | 0.572 | 0.549 | 0.290 | 0.278 |
| Gap (0.901/0.896) | -7.4% | -12.4% | -15.4% | -17.7% | -35.5% | -38.5% | -40.5% | -54.4% | -72.6% | -79.9% | -36.5% | -38.7% | -67.8% | -69.0% |
| CONTRIQUE | 0.722 | 0.720 | 0.315 | 0.183 | 0.636 | 0.546 | 0.749 | 0.674 | 0.128 | 0.091 | 0.551 | 0.524 | 0.269 | 0.244 |
| Gap (0.906/0.894) | -20.3% | -23.7% | -65.2% | -80.6% | -29.8% | -42.2% | -17.3% | -28.6% | -85.9% | -90.4% | -43.6% | -44.5% | -70.3% | -74.2% |
| MANIQA | 0.735 | 0.696 | 0.604 | 0.542 | 0.397 | 0.293 | 0.362 | 0.073 | 0.208 | 0.146 | 0.447 | 0.389 | 0.179 | 0.216 |
| Gap (0.946/0.944) | -22.3% | -26.3% | -36.2% | -42.6% | -58.0% | -69.0% | -61.7% | -92.3% | -78.0% | -84.5% | -52.7% | -58.8% | -81.1% | -77.1% |
| VCRNet | 0.708 | 0.690 | 0.622 | 0.592 | 0.544 | 0.517 | 0.317 | 0.286 | 0.121 | 0.120 | 0.505 | 0.473 | 0.230 | 0.211 |
| Gap (0.974/0.973) | -27.3% | -29.1% | -36.1% | -39.2% | -44.1% | -46.9% | -67.5% | -70.6% | -87.6% | -87.7% | -48.2% | -51.4% | -76.4% | -78.3% |
| LIQE | 0.850 | 0.793 | 0.763 | 0.745 | 0.500 | 0.434 | 0.769 | 0.602 | 0.201 | 0.128 | 0.575 | 0.553 | 0.380 | 0.364 |
| Gap (0.908/0.919) | -6.4% | -13.7% | -16.0% | -18.9% | -44.9% | -52.8% | -15.3% | -34.5% | -77.9% | -86.1% | -36.7% | -39.8% | -58.1% | -60.4% |
| QualiCLIP | 0.853 | 0.808 | 0.757 | 0.734 | 0.575 | 0.468 | 0.815 | 0.684 | 0.128 | 0.003 | 0.528 | 0.489 | 0.232 | 0.227 |
| Gap (-/-) | - | - | - | - | - | - | - | - | - | - | - | - | - | - |
| Mean Gap | -18.0 % | -20.7 % | -33.3 % | -37.9 % | -39.4 % | -44.7 % | -45.7 % | -57.2 % | -75.1 % | -82.9 % | -41.1 % | -43.9 % | -71.2 % | -72.1% |
Does there exist a gap between BIQA and BPIQA? As mentioned before, the panoramic image differs substantially from the 2D planar image in many aspects, suggesting that BIQA models are hard to substitute the BPIQA models to assess the perceptual quality of panoramic images. However, we argue that if a PIQA database suffers from the easy-database issue, it could narrow the gap between BIQA and BPIQA due to the lack of viewing characteristics of those panoramic images, and vice versa. As shown in Fig. 3 (a), we test a series of pre-trained BIQA models on the PIQA database for measuring this gap. Similar to the previous work (Sun et al., pear), the gap can be calculated by:
| (9) |
where and denote the original and new test performance, respectively. As a result, a high gap means that the panoramic images in this database are with heterogeneous distortion and the low gap indicates homogeneous distortion. To quantitatively describe this gap in each PIQA database, a test experiment is conducted and the results are shown in Tab. 3, where we have several significant observations. First, the CVIQ database has the smallest mean gap (nearly 0.2 in terms of PLCC and SRCC) especially UNIQUE and LIQE demonstrate transfer performance with only a slight decrease, indicating that the panoramic images in CVIQ are visually similar to 2D planar images. This similarity allows BIQA models to easily transfer their success directly to BPIQA. As a result, CVIQ fails to exhibit the features of panoramic images, leading to an apparent waste of the human labeling budget. Second, these BIQA models exhibit significant performance degradation on the JUFE-10K database, indicating that the heterogeneously distorted panoramic images in JUFE-10K confuse the BIQA models, and successfully create a gap between BIQA and BPIQA models. Besides, it encourages BPIQA models to introduce special designs to deal with this problem rather than simply modifying BIQA models. It is worth noting that the OSIQA database focuses on stitching distortions in panoramic images, arising from complex structural warping that significantly alters visual features and amplifies the gap between 2D planar images and panoramic images. The OSIQA database also considers the unique impact of viewing angles on perceived quality, further widening this gap. In addition, IQA-ODI also presents a significant challenge to these BIQA models, where the primary reason lies in the distortions introduced by four distinct projection patterns, a characteristic unique to panoramic images. Last but not least, from the experimental results on the CVIQ, OIQA, MVAQD and OIQ-10K databases, we can observe that as the types and levels of distortion increase, the challenges posed to BIQA models become greater. This indicates that diverse and abundant distortions contribute to enhancing the overall quality of a database, making it away from the easy-database issue. Likewise, we can intuitively assess the severity of the easy-database issue in the other four PIQA databases based on the mean gap. Consequently, we straightforwardly rank all PIQA databases as follows (from smallest to largest mean gap): CVIQ, OIQA, MVAQD, OIQ-10K, IQA-ODI, JUFE-10K, and OSIQA.
Whether the BPIQA models require those specific designs? Naively measuring the gap between BIQA and BPIQA based on the transfer performance of BIQA models provides a rough quality assessment of PIQA databases. To explore the inherent factors of the easy-database issue, we examine the relationship between model design and distortion samples by devising a family of simple models. The central concept is illustrated in Fig. 3 (b). For the target database , we first consider two types of models: and . Here, refers to the BPIQA models without specific design, which does not consider users’ viewing behavior and inter-viewport interaction for panoramic images, while denotes the BPIQA models with specific design(s) to enhance their ability to handle complex panoramic-specific distortions. Subsequently, we retrain all models and conduct a computational analysis based on their performance from saturation status and model sensitivity. The qualitative results of and are shown in Tab. 4, and the detailed discussions are as follows.
| CVIQ (7) | OIQA (6) | MVAQD (4) | IQA-ODI (5) | OSIQA (3) | OIQ-10K (2) | JUFE-10K (1) | |||||||||
| Method | Type | PLCC | SRCC | PLCC | SRCC | PLCC | SRCC | PLCC | SRCC | PLCC | SRCC | PLCC | SRCC | PLCC | SRCC |
| MC360IQA | 0.951 | 0.914 | 0.925 | 0.919 | 0.555 | 0.382 | 0.812 | 0.742 | 0.387 | 0.275 | 0.721 | 0.710 | 0.620 | 0.620 | |
| Assessor360 | 0.977 | 0.964 | 0.975 | 0.980 | 0.972 | 0.961 | 0.963 | 0.957 | 0.832 | 0.533 | 0.790 | 0.773 | 0.694 | 0.690 | |
| OIQAND | 0.976 | 0.967 | 0.938 | 0.937 | 0.924 | 0.903 | 0.965 | 0.927 | 0.864 | 0.821 | 0.755 | 0.740 | 0.800 | 0.800 | |
| VSFA | 0.965 | 0.953 | 0.963 | 0.961 | 0.924 | 0.932 | 0.940 | 0.930 | 0.801 | 0.742 | 0.379 | 0.365 | 0.793 | 0.810 | |
| Trans-VSFA | 0.965 | 0.949 | 0.960 | 0.953 | 0.921 | 0.919 | 0.956 | 0.929 | 0.856 | 0.704 | 0.112 | 0.068 | 0.764 | 0.737 | |
| FAST-VQA | 0.182 | 0.362 | 0.108 | 0.220 | 0.484 | 0.532 | 0.199 | 0.214 | 0.258 | 0.317 | 0.097 | 0.115 | 0.075 | 0.077 | |
| ResNet-50-P | 0.980 | 0.976 | 0.971 | 0.969 | 0.897 | 0.890 | 0.963 | 0.930 | 0.822 | 0.675 | 0.808 | 0.814 | 0.783 | 0.783 | |
| ResNet-152-P | 0.977 | 0.974 | 0.967 | 0.967 | 0.858 | 0.854 | 0.957 | 0.910 | 0.730 | 0.597 | 0.810 | 0.814 | 0.781 | 0.782 | |
| Swin-v2-T-P | 0.974 | 0.964 | 0.968 | 0.967 | 0.907 | 0.899 | 0.965 | 0.929 | 0.818 | 0.727 | 0.797 | 0.797 | 0.737 | 0.730 | |
| Swin-v2-B-P | 0.976 | 0.968 | 0.955 | 0.953 | 0.924 | 0.908 | 0.968 | 0.926 | 0.818 | 0.727 | 0.780 | 0.774 | 0.551 | 0.517 | |
| MaxViT-T-P | 0.984 | 0.980 | 0.952 | 0.953 | 0.944 | 0.936 | 0.967 | 0.923 | 0.814 | 0.665 | 0.808 | 0.808 | 0.771 | 0.770 | |
| HyperIQA | 0.973 | 0.960 | 0.970 | 0.968 | 0.822 | 0.817 | 0.929 | 0.887 | 0.717 | 0.820 | 0.802 | 0.805 | 0.763 | 0.763 | |
| MANIQA | 0.981 | 0.973 | 0.963 | 0.962 | 0.965 | 0.959 | 0.967 | 0.933 | 0.350 | 0.411 | 0.821 | 0.822 | 0.749 | 0.747 | |
| VCRNet | 0.830 | 0.866 | 0.880 | 0.884 | 0.843 | 0.862 | 0.738 | 0.819 | 0.307 | 0.356 | 0.803 | 0.751 | 0.737 | 0.712 | |
| QualiCLIP | 0.982 | 0.978 | 0.883 | 0.878 | 0.850 | 0.843 | 0.987 | 0.981 | 0.572 | 0.604 | 0.414 | 0.395 | 0.318 | 0.211 | |
Saturation status analysis. For the CVIQ and OIQA databases, most models achieve saturated performance (in terms of 0.96 in terms of PLCC and SRCC), with no significant difference in performance regardless of whether they have specific designs or not. This suggests that the samples in the two databases are relatively simple. In other words, adding fewer types of distortions to panoramic images makes it difficult to provide the model with sufficient learnable information. For MVAQD and IQA-ODI, the saturation condition is less severe and presents challenges for certain models, such as MC360IQA and HyperIQA. This could be attributed to the more primitive feature extractor (i.e., ResNet-50) used in these models, which hampers the degradation modeling of panoramic images due to its limited feature extraction capabilities. Note that MVAQD has one more distortion type than OIQA, while one less distortion level. However, MVAQD poses a greater challenge to models, which suggests that the variety of distortion types contributes more to model’s ability to learn distortion features than the number of distortion levels. Surprisingly, the OIQ-10K and JUFE-10K databases reveal the failure of most models, achieving an undersaturated status (nearly 0.8 in terms of PLCC and SRCC), and even causing certain models to fail, meaning that the samples in these two databases are troublesome. Clearly, this issue mainly arises from heterogeneous distortion. OIQ-10K contains both homogeneous and heterogeneous distortions, whereas JUFE-10K consists entirely of heterogeneous distortions. Besides, all three VQA models show less-promising performance on the OIQ-10K database, while two of them perform well on JUFE-10K. This suggests that VQA models may effectively handle temporal information in heterogeneously distorted images (arising from discontinuous viewing experiences) through spatiotemporal modules. However, they struggle when dealing with complex distortion scenarios simultaneously, as OIQ-10K includes a greater variety of distortion types and diverse resolutions. The images in the OSIQA database contain local distortions caused by stitching operations. Due to the small number of samples and the limited variety of distortions, the challenges posed to the model are not as significant as those in the first two databases. Eventually, we successfully demonstrate the truth of current status of BPIQA, i.e., there is still room to advance the BPIQA, rather than tend to perfection as revealed in Fig. 1.
Model sensitivity analysis. A database with the easy-database issue results in uniform model performance regardless of design. Conversely, a high-quality database requires specialized designs, making performance sensitive to these variations. Inspired by the previous work (Sun et al., pear), we explore the easy-database issue by quantitatively examining the impact of specific design by comparing with and . As shown in Tab. 4, the CVIQ demonstrates a similar performance across all models, suggesting that the distortions in this database are relatively less characterized. This is due to CVIQ having only one type of distortion (i.e., compressed distortion) and resolution, and the image content lacks distinctiveness. On the other hand, OIQA exhibits relatively mild symptoms, as it contains a greater variety of distortion types, resolutions, and visual content. Nevertheless, it implies that the basic feature extractor and quality regressor are sufficient to handle the simple distortions (i.e., few distortion types and levels) in the two databases. Due to differences in handling one of the distortion types on the CMP and the varying distortion situations in MVAQD, models need specialized designs to address this panoramic-specific distortion, which increases the model sensitivity. For example, MC360IQA predicts the perceptual quality of panoramic images by utilizing a FC to regress the features of six viewport images into a single score, i.e., the integrated mapping with basic operation. However, it neglects proper interaction modeling to address CMP-based distortion, resulting in severe performance degradation. Besides, we find that transformer-based and hybrid-based models are superior to CNN-based models as the feature extractor in this case, indicating the ability of global modeling in transformer is of great importance to address panoramic-specific distortion. Like MVAQD, samples in IQA-ODI have distortions added across multiple projection patterns, which facilitates the form of panoramic-specific distortion. However, the single distortion type limits the model’s ability to learn more about distortion, leading to similar results. For the OIQ-10K, it is obvious that the performance of is better than , a plausible explanation may be that the samples in OIQ-10K have both homogeneous distortion and heterogeneous distortion, which imposes higher demands on model design. However, inappropriate special designs can instead disrupt model predictions, revealing that there are still no reasonable models fundamentally capable of addressing both homogeneous and heterogeneous distortions simultaneously. JUFE-10K only contains samples with heterogeneous distortion, which compels models concentrate on proposing more specific designs to address the common discontinuity of experience (caused by local distortion) that is closed to temporal modeling problem. From the Tab. 4, we surprisingly observe that the VSFA (i.e., a VQA model) obtains the best results on JUFE-10K, revealing that VQA models could handle the heterogeneous distortion in BPIQA. In addition, we also find that QualiCLIP achieves worse results on heterogeneous distortion (i.e., OSIQA, OIQ-10K and JUFE-10K) than homogeneous distortion. The possible reason is that the textual features interfere with the model’s ability to learn heterogeneous distortions. On the contrary, OIQAND demonstrates promising performance on the three databases, which can be attributed to its specific viewport interaction approach. It enables OIQAND to adaptively adjust the weights of each viewport through the Viewports Vit module. Note that FAST-VQA performs poorly on most databases. This could be due to the sampling method in the model, which significantly reduces the visual features, thereby failing to provide sufficient information for training. Additionally, the quality regressor consists of 3D convolutional layer and the global average pooling (GAP) may not be suitable for BPIQA. Finally, we empirically rank all PIQA databases according to the saturation status (from mild to severe): JUFE-10K, OIQ-10K, OSIQA, MVAQD, IQA-ODI, OIQA, and CVIQ.
Does it empower BPIQA to deal with hard samples? A BPIQA model with outstanding generalization ability accurately assesses the perceptual quality of various in-the-wild panoramic images. However, due to its limited sample coverage, the PIQA database with easy-database issue cannot empower BPIQA models to handle hard samples in the real world and vice versa. From this perspective, as shown in Fig. 3 (c), we conduct a series of cross-validation experiments to explore the easy-database issue. Specifically, similar to work (Sun et al., pear), we quantitatively measure the ability of the target database to enhance the model’s generalization performance by calculating the gain between the performance on the training database and the performance on the testing database. The calculation of gain is the same as that of gap. Lower gain indicates more serious sample issues within the database.
CVIQ. The results are presented in Tab. 5. We observe that the performance of most BPIQA models dramatically drops when tested on other databases, suggesting that CVIQ may not fully equip models to handle challenging samples in different domains. However, it is worth noting that the results of testing on IQA-ODI are relatively impressive. This could be attributed to the CVIQ focus on compressed distortion in panoramic images, while IQA-ODI happens to only contain JPEG compression. This indicates that CVIQ does enable BPIQA models to handle samples with compressed distortion positively.
| OIQA | MVAQD | IQA-ODI | OSIQA | OIQ-10K | JUFE-10K | |||||||
| Method | PLCC | SRCC | PLCC | SRCC | PLCC | SRCC | PLCC | SRCC | PLCC | SRCC | PLCC | SRCC |
| MC360IQA | 0.424 | 0.386 | 0.229 | 0.163 | 0.812 | 0.658 | 0.106 | 0.132 | 0.347 | 0.279 | 0.031 | 0.028 |
| Gain | -55.4% | -57.8% | -75.9% | -82.2% | -14.6% | -28.0% | -88.9% | -85.6% | -63.5% | -69.5% | -96.7% | -96.9% |
| Assessor360 | 0.542 | 0.463 | 0.629 | 0.564 | 0.905 | 0.860 | 0.171 | 0.125 | 0.430 | 0.336 | 0.061 | 0.249 |
| Gain | -44.5% | -52.0% | -35.6% | -41.5% | -7.4% | -10.8% | -82.5% | -87.0% | -56.0% | -65.1% | -92.7% | -93.7% |
| OIQAND | 0.636 | 0.615 | 0.605 | 0.494 | 0.776 | 0.562 | 0.214 | 0.151 | 0.296 | 0.142 | 0.013 | 0.002 |
| Gain | -34.8% | -36.4% | -38.0% | -48.9% | -20.5% | -41.9% | -78.1% | -84.4% | -69.7% | -85.3% | -98.7% | -99.8% |
| ResNet-50-P | 0.679 | 0.662 | 0.385 | 0.356 | 0.824 | 0.712 | 0.225 | 0.292 | 0.327 | 0.250 | 0.064 | 0.051 |
| Gain | -30.7% | -32.2% | -60.7% | -63.5% | -15.9% | -27.0% | -77.0% | -70.1% | -66.6% | -74.4% | -93.5% | -94.8% |
| ResNet-152-P | 0.702 | 0.685 | 0.577 | 0.553 | 0.835 | 0.765 | 0.142 | 0.144 | 0.397 | 0.262 | 0.054 | 0.046 |
| Gain | -28.1% | -29.7% | -40.9% | -43.2% | -14.5% | -21.5% | -85.5% | -85.2% | -59.4% | -73.1% | -94.5% | -95.3% |
| Swin-v2-T-P | 0.792 | 0.780 | 0.792 | 0.736 | 0.878 | 0.796 | 0.013 | 0.025 | 0.438 | 0.331 | 0.167 | 0.149 |
| Gain | -18.7% | -19.1% | -18.7% | -23.7% | -9.9% | -17.4% | -98.7% | -97.4% | -55.0% | -65.7% | -82.9% | -84.5% |
| Swin-v2-B-P | 0.777 | 0.773 | 0.526 | 0.456 | 0.836 | 0.682 | 0.268 | 0.223 | 0.443 | 0.371 | 0.208 | 0.198 |
| Gain | -20.4% | -20.1% | -46.1% | -52.9% | -14.3% | -29.5% | -72.5% | -77.0% | -54.6% | -61.7% | -78.7% | -79.5% |
| MaxViT-T-P | 0.636 | 0.603 | 0.582 | 0.553 | 0.893 | 0.836 | 0.234 | 0.281 | 0.401 | 0.230 | 0.053 | 0.048 |
| Gain | -35.4% | -38.5% | -40.9% | -43.6% | -9.2% | -14.7% | -76.2% | -71.3% | -59.2% | -76.5% | -94.6% | -95.1% |
| Mean Gain | -33.5% | -35.7% | -44.6% | -49.9% | -13.3% | -23.9% | -82.4% | -82.2% | -60.5% | -71.4% | -91.5% | -92.5% |
OIQA. As shown in Tab. 6, the gain from testing on other databases increases when models are trained on OIQA compared to CVIQ, especially most models obtaining considerable generalization performance on the CVIQ. That is to say, OIQA empowers BPIQA models to effectively deal with the samples in CVIQ and yields more gain in the training process than CVIQ. This might be due to OIQA containing various distortion situations and plentiful content, despite the number of samples being less than CVIQ.
| CVIQ | MVAQD | IQA-ODI | OSIQA | OIQ-10K | JUFE-10K | |||||||
| Method | PLCC | SRCC | PLCC | SRCC | PLCC | SRCC | PLCC | SRCC | PLCC | SRCC | PLCC | SRCC |
| MC360IQA | 0.868 | 0.853 | 0.537 | 0.492 | 0.764 | 0.638 | 0.054 | 0.033 | 0.565 | 0.616 | 0.184 | 0.179 |
| Gain | -6.2% | -7.2% | -41.9% | -46.5% | -17.4% | -30.6% | -94.2% | -96.4% | -38.9% | -43.9% | -80.1% | -80.5% |
| Assessor360 | 0.893 | 0.853 | 0.660 | 0.642 | 0.915 | 0.873 | 0.242 | 0.325 | 0.510 | 0.348 | 0.041 | 0.034 |
| Gain | -8.4% | -13.0% | -32.3% | -34.5% | -6.2% | -10.9% | -75.2% | -66.8% | -47.7% | -64.5% | -95.8% | -96.5 % |
| OIQAND | 0.915 | 0.905 | 0.797 | 0.747 | 0.850 | 0.740 | 0.132 | 0.121 | 0.580 | 0.520 | 0.198 | 0.185 |
| Gain | -2.5% | -3.4% | -15.0% | -20.3% | -9.4% | -21.0% | -85.9% | -87.1% | -38.2% | -44.5% | -78.9% | -80.3% |
| ResNet-50-P | 0.921 | 0.901 | 0.700 | 0.651 | 0.788 | 0.621 | 0.129 | 0.070 | 0.621 | 0.489 | 0.164 | 0.146 |
| Gain | -5.1% | -7.0% | -27.9% | -32.8% | -18.8% | -35.9% | -86.7% | -92.8% | -43.5% | -49.5% | -83.1% | -84.9 % |
| ResNet-152-P | 0.938 | 0.931 | 0.708 | 0.695 | 0.823 | 0.710 | 0.226 | 0.060 | 0.580 | 0.535 | 0.210 | 0.196 |
| Gain | -3.0% | -3.7% | -26.8% | -28.1% | -14.9% | -26.6% | -76.6% | -93.8% | -40.0% | -44.7% | -78.3% | -79.7 |
| Swin-v2-T-P | 0.931 | 0.916 | 0.821 | 0.804 | 0.851 | 0.749 | 0.225 | 0.181 | 0.573 | 0.519 | 0.227 | 0.187 |
| Gain | -3.8% | -5.3% | -15.2% | -16.9% | -12.1% | -22.5% | -76.8% | -81.3% | -40.8% | -46.3% | -76.5% | -80.7 % |
| Swin-v2-B-P | 0.934 | 0.913 | 0.840 | 0.803 | 0.865 | 0.768 | 0.196 | 0.074 | 0.584 | 0.523 | 0.216 | 0.168 |
| Gain | -2.2% | -4.2% | -12.0% | -15.7% | -9.4% | -19.4% | -79.5% | -92.2% | -38.8% | -45.1% | -77.4% | -82.4 % |
| MaxViT-T-P | 0.922 | 0.902 | 0.663 | 0.657 | 0.810 | 0.718 | 0.144 | 0.096 | 0.559 | 0.505 | 0.107 | 0.097 |
| Gain | -3.2% | -5.4% | -30.4% | -31.1% | -14.9% | -24.7% | -84.9% | -89.9% | -41.3% | -47.0% | -88.8% | -89.8 % |
| Mean Gain | -4.3% | -6.1% | -25.2% | -28.2% | -12.9% | -24.0% | -82.5% | -87.5% | -41.1% | -48.2% | -82.4% | -84.4% |
MVAQD. We find that some BPIQA models achieve acceptable gains on CVIQ, OIQA, and IQA-ODI as seen in Tab. 7, such as the CNN-based ResNet-50-P, Transformer-based Swin-v2-T-P and its variant Swin-v2-B-P. One reasonable explanation is that MVAQD includes a rich array of distortion scenarios and resolutions, which is more consistent with the distorted panoramic images in the real world. Although MVAQD enables BPIQA models to handle samples with homogeneous distortion, it does not empower models to deal with samples exhibiting heterogeneous distortion, as evidenced by the results on OIQ-10K and JUFE-10K.
| CVIQ | OIQA | IQA-ODI | OSIQA | OIQ-10K | JUFE-10K | |||||||
| Method | PLCC | SRCC | PLCC | SRCC | PLCC | SRCC | PLCC | SRCC | PLCC | SRCC | PLCC | SRCC |
| MC360IQA | 0.116 | 0.123 | 0.131 | 0.127 | 0.102 | 0.114 | 0.032 | 0.018 | 0.119 | 0.112 | 0.097 | 0.085 |
| Gain | -79.1% | -67.8% | -76.4% | -66.8% | -81.6% | -70.2% | -94.2% | -95.3% | -78.6% | -70.7% | -82.5% | -77.7% |
| Assessor360 | 0.855 | 0.885 | 0.785 | 0.778 | 0.868 | 0.862 | 0.129 | 0.165 | 0.499 | 0.377 | 0.064 | 0.638 |
| Gain | -12.0% | -7.9% | -19.2% | -19.0% | -10.7% | -10.3% | -86.7% | -82.8% | -48.7% | -60.8% | -94.0% | -93.3% |
| OIQAND | 0.673 | 0.728 | 0.834 | 0.822 | 0.833 | 0.823 | 0.058 | 0.027 | 0.521 | 0.410 | 0.048 | 0.030 |
| Gain | -27.2% | -19.4% | -9.7% | -9.0% | -9.8% | -8.9% | -93.7% | -97.0% | -43.6% | -54.6% | -94.8% | -96.7% |
| ResNet-50-P | 0.871 | 0.852 | 0.873 | 0.861 | 0.855 | 0.791 | 0.208 | 0.114 | 0.515 | 0.405 | 0.047 | 0.045 |
| Gain | -2.9% | -4.3% | -2.7% | -3.3% | -4.7% | -11.1% | -76.8% | -87.2% | -42.6% | -54.5% | -94.8% | -94.9% |
| ResNet-152-P | 0.731 | 0.750 | 0.694 | 0.681 | 0.784 | 0.728 | 0.201 | 0.199 | 0.500 | 0.370 | 0.047 | 0.018 |
| Gain | -14.8% | -12.2% | -19.1% | -20.3% | -8.6% | -14.8% | -76.6% | -76.7% | -41.7% | -56.7% | -94.5% | -97.9% |
| Swin-v2-T-P | 0.792 | 0.835 | 0.854 | 0.845 | 0.874 | 0.809 | 0.090 | 0.043 | 0.512 | 0.399 | 0.052 | 0.033 |
| Gain | -12.7% | -7.1% | -5.8% | -6.0% | -3.6% | -10.0% | -90.1% | -95.2% | -43.6% | -55.6% | -94.3% | -96.3% |
| Swin-v2-B-P | 0.887 | 0.911 | 0.909 | 0.901 | 0.860 | 0.780 | 0.040 | 0.160 | 0.520 | 0.376 | 0.068 | 0.071 |
| Gain | -4.0% | +0.3% | -1.6% | -0.8% | -6.9% | -14.1% | -95.7% | -82.4% | -43.7% | -58.6% | -92.6% | -92.2% |
| MaxViT-T-P | 0.762 | 0.788 | 0.781 | 0.741 | 0.837 | 0.734 | 0.340 | 0.325 | 0.525 | 0.449 | 0.033 | 0.031 |
| Gain | -19.3% | -15.8% | -17.3% | -20.8% | -11.3% | -21.6% | -64.0% | -65.3% | -44.4% | -52.0% | -96.5% | -96.7% |
| Mean Gain | -21.5% | -16.8% | -19.0% | -18.2% | -17.2% | -20.1% | -84.7% | -85.2% | -48.4% | -57.9% | -93.0% | -93.2% |
IQA-ODI. The results are shown in Tab. 8, even though IQA-ODI contains a substantial number of samples, the single distortion situation limits BPIQA models to learn more useful information of distortion, leading to an unsatisfactory gain on other databases. Another plausible reason is that IQA-ODI focuses on studying the impact of map projection, which deviates somewhat from the distortion domain.
| Method | CVIQ | OIQA | MVAQD | OSIQA | OIQ-10K | JUFE-10K | ||||||
| PLCC | SRCC | PLCC | SRCC | PLCC | SRCC | PLCC | SRCC | PLCC | SRCC | PLCC | SRCC | |
| MC360IQA | 0.741 | 0.676 | 0.557 | 0.543 | 0.722 | 0.640 | 0.174 | 0.289 | 0.420 | 0.380 | 0.078 | 0.068 |
| Gain | -8.7% | -8.9% | -31.4% | -26.8% | -11.1% | -13.7% | -78.6% | -61.1% | -48.3% | -48.8% | -90.4% | -90.8% |
| Assessor360 | 0.767 | 0.726 | 0.380 | 0.110 | 0.541 | 0.476 | 0.129 | 0.165 | 0.356 | 0.177 | 0.100 | 0.089 |
| Gain | -20.4% | -24.1% | -60.5% | -88.5% | -43.8% | -50.3% | -86.6% | -82.8% | -63.0% | -81.5% | -89.6% | -90.7% |
| OIQAND | 0.596 | 0.591 | 0.377 | 0.083 | 0.408 | 0.152 | 0.217 | 0.190 | 0.341 | 0.138 | 0.095 | 0.089 |
| Gain | -38.2% | -36.2% | -60.9% | -91.0% | -57.7% | -83.6% | -77.5% | -79.5% | -64.7% | -85.1% | -90.2% | -90.4% |
| ResNet-50-P | 0.840 | 0.825 | 0.381 | 0.273 | 0.551 | 0.548 | 0.130 | 0.055 | 0.375 | 0.330 | 0.048 | -0.008 |
| Gain | -12.8% | -11.3% | -60.4% | -70.6% | -42.8% | -41.1% | -86.5% | -94.1% | -61.1% | -64.5% | -95.0% | -100.9% |
| ResNet-152-P | 0.809 | 0.783 | 0.375 | 0.191 | 0.603 | 0.570 | 0.222 | 0.229 | 0.383 | 0.310 | 0.045 | 0.022 |
| Gain | -15.5% | -14.0% | -60.8% | -79.0% | -37.0% | -37.4% | -76.8% | -74.8% | -60.0% | -65.9% | -95.3% | -97.6% |
| Swin-v2-T-P | 0.859 | 0.838 | 0.402 | 0.366 | 0.640 | 0.602 | 0.243 | 0.231 | 0.449 | 0.368 | 0.055 | 0.050 |
| Gain | -11.0% | -9.8% | -58.3% | -60.6% | -33.7% | -35.2% | -74.8% | -75.1% | -53.5% | -60.4% | -94.3% | -94.6% |
| Swin-v2-B-P | 0.779 | 0.717 | 0.369 | 0.259 | 0.470 | 0.403 | 0.129 | 0.060 | 0.359 | 0.267 | 0.025 | 0.017 |
| Gain | -19.5% | -22.6% | -61.9% | -72.0% | -51.4% | -56.5% | -86.7% | -93.5% | -62.9% | -71.2% | -97.4% | -98.2% |
| MaxViT-T-P | 0.847 | 0.832 | 0.385 | 0.265 | 0.499 | 0.336 | 0.175 | 0.216 | 0.400 | 0.291 | 0.042 | 0.008 |
| Gain | -12.4% | -9.9% | -60.2% | -71.3% | -48.4% | -63.6% | -81.9% | -76.6% | -58.6% | -68.5% | -95.7% | -99.1% |
| Mean Gain | -17.3% | -17.1% | -56.8% | -70.0% | -40.7% | -47.7% | -81.2% | -79.7% | -59.0% | -68.2% | -93.5% | -95.3% |
OSIQA. From the Tab. 9, we can clearly observe a significant decline in the generalization performance of nearly all models, indicating that the distortion information provided by OSIQA does not help the models learn the distortion features of panoramic images effectively. The reason lies in the small number of samples and the unique attribute of the distortion (stitching distortion in panoramic images), which makes it difficult to generalize to other types of distortion.
| Method | CVIQ | OIQA | MVAQD | IQA-ODI | OIQ-10K | JUFE-10K | ||||||
| PLCC | SRCC | PLCC | SRCC | PLCC | SRCC | PLCC | SRCC | PLCC | SRCC | PLCC | SRCC | |
| MC360IQA | 0.147 | 0.163 | 0.148 | 0.133 | 0.097 | 0.190 | 0.144 | 0.113 | 0.119 | 0.146 | 0.043 | 0.043 |
| Gain | -62.0% | -40.7% | -61.8% | -51.6% | -74.9% | -30.9% | -62.8% | -58.9% | -69.3% | -46.9% | -88.9% | -84.4% |
| Assessor360 | 0.008 | 0.309 | 0.334 | 0.333 | 0.056 | 0.246 | 0.091 | 0.059 | 0.143 | 0.162 | 0.040 | 0.040 |
| Gain | -70.9% | -55.9% | -83.4% | -78.8% | -78.7% | -65.1% | -87.1% | -75.0% | -94.8% | -99.2% | -94.5% | -91.2% |
| OIQAND | 0.242 | 0.235 | 0.138 | 0.113 | 0.177 | 0.186 | 0.107 | 0.133 | 0.043 | 0.004 | 0.046 | 0.047 |
| Gain | -72.0% | -71.4% | -84.0% | -86.2% | -79.5% | -77.3% | -87.6% | -83.8% | -95.0% | -99.5% | -94.7% | -94.3% |
| ResNet-50-P | 0.369 | 0.136 | 0.293 | 0.291 | 0.166 | 0.168 | 0.116 | 0.001 | 0.12 | 0.096 | 0.004 | 0.005 |
| Gain | -55.1% | -79.9% | -64.4% | -56.9% | -79.8% | -75.1% | -85.9% | -99.9% | -85.4% | -85.8% | -99.5% | -99.3% |
| ResNet-152-P | 0.115 | 0.111 | 0.154 | 0.034 | 0.097 | 0.094 | 0.141 | 0.131 | 0.05 | 0.031 | 0.049 | 0.037 |
| Gain | -84.2% | -81.4% | -78.9% | -94.3% | -86.7% | -84.3% | -80.7% | -78.1% | -93.2% | -94.8% | -93.3% | -93.8% |
| Swin-v2-T-P | 0.266 | 0.249 | 0.18 | 0.17 | 0.214 | 0.226 | 0.213 | 0.23 | 0.027 | 0.016 | 0.098 | 0.077 |
| Gain | -67.5% | -65.7% | -78.0% | -76.6% | -73.8% | -68.9% | -74.0% | -68.4% | -96.7% | -97.8% | -88.0% | -89.4% |
| Swin-v2-B-P | 0.133 | 0.117 | 0.177 | 0.175 | 0.166 | 0.166 | 0.14 | 0.146 | 0.037 | 0.025 | 0.077 | 0.071 |
| Gain | -83.7% | -83.9% | -78.4% | -75.9% | -79.7% | -77.2% | -82.9% | -79.9% | -95.5% | -96.6% | -90.6% | -90.2% |
| MaxViT-T-P | 0.191 | 0.04 | 0.197 | 0.195 | 0.164 | 0.111 | 0.125 | 0.133 | 0.077 | 0.067 | 0.096 | 0.089 |
| Gain | -76.5% | -94.0% | -75.8% | -70.7% | -79.9% | -83.3% | -84.6% | -80.0% | -90.5% | -89.9% | -88.2% | -86.6% |
| Mean Gain | -71.5% | -71.6% | -75.6% | -73.9% | -79.1% | -70.3% | -80.7% | -78.0% | -90.0% | -88.8% | -92.2% | -91.1% |
OIQ-10K. We surprisingly observe that a large portion of BPIQA models trained on the OIQ-10K has a positive gain on other databases as exhibited in Tab. 10, and the performance of these models merely has slight declines on the JUFE-10K, meaning that it empowers BPIQA models to deal with hard samples with both homogeneous distortion and heterogeneous distortion. OIQ-10K achieves this level of success due to its samples covering a wide range of panoramic space, including diverse scenes, image resolutions, and types of degradation.
| Method | CVIQ | OIQA | MVAQD | IQA-ODI | OSIQA | JUFE-10K | ||||||
| PLCC | SRCC | PLCC | SRCC | PLCC | SRCC | PLCC | SRCC | PLCC | SRCC | PLCC | SRCC | |
| MC360IQA | 0.705 | 0.740 | 0.818 | 0.809 | 0.643 | 0.533 | 0.496 | 0.436 | 0.013 | 0.008 | 0.319 | 0.253 |
| Gain | -2.2% | +4.2% | +13.5% | +13.9% | -10.8% | -24.9% | -31.2% | -38.6% | -98.2% | -98.9% | -55.8% | -64.4% |
| Assessor360 | 0.842 | 0.869 | 0.909 | 0.899 | 0.710 | 0.680 | 0.801 | 0.628 | 0.149 | 0.186 | 0.624 | 0.613 |
| Gain | +6.6% | +12.4% | +15.1% | +16.3% | -10.1% | -12.0% | +1.4% | -18.8% | -81.1% | -75.9% | -21.0% | -20.7% |
| OIQAND | 0.687 | 0.735 | 0.847 | 0.843 | 0.588 | 0.544 | 0.507 | 0.479 | 0.133 | 0.061 | 0.324 | 0.297 |
| Gain | -9.0% | -0.7% | +12.2% | +13.9% | -22.1% | -26.5% | -32.8% | -35.3% | -82.4% | -91.8% | -57.1% | -59.9% |
| ResNet-50-P | 0.671 | 0.692 | 0.884 | 0.872 | 0.776 | 0.736 | 0.772 | 0.630 | 0.179 | 0.161 | 0.703 | 0.695 |
| Gain | -17.0% | -15.0% | +9.4% | +7.1% | -4.0% | -9.6% | -4.5% | -22.6% | -77.8% | -80.2% | -13.0 | -14.6% |
| ResNet-152-P | 0.792 | 0.795 | 0.882 | 0.871 | 0.777 | 0.754 | 0.788 | 0.650 | 0.021 | 0.046 | 0.649 | 0.634 |
| Gain | -2.2% | -2.3% | +8.9% | +7.0% | -4.1% | -7.4% | -2.7% | -20.1% | -97.4% | -94.3% | -19.9% | -22.1% |
| Swin-v2-T-P | 0.865 | 0.869 | 0.903 | 0.894 | 0.766 | 0.733 | 0.802 | 0.726 | 0.070 | 0.010 | 0.630 | 0.611 |
| Gain | +8.5% | +9.0% | +13.3% | +12.2% | -3.9% | -8.0% | +0.6% | -8.9% | -91.2% | -98.7% | -21.0% | -23.3% |
| Swin-v2-B-P | 0.798 | 0.821 | 0.924 | 0.917 | 0.782 | 0.753 | 0.772 | 0.692 | 0.186 | 0.122 | 0.551 | 0.517 |
| Gain | +2.3% | +6.1% | +18.5% | +18.5% | +0.3% | -2.7% | -1.0% | -10.6% | -76.2% | -84.2% | -29.4% | -33.2% |
| MaxViT-T-P | 0.843 | 0.857 | 0.896 | 0.887 | 0.762 | 0.741 | 0.789 | 0.694 | 0.057 | 0.009 | 0.681 | 0.669 |
| Gain | +4.3% | +6.1% | +10.9% | +9.8% | -5.7% | -8.3% | -2.4% | -14.1% | -92.9% | -98.9% | -15.7% | -17.2% |
| Mean Gain | -1.1% | +2.5% | +12.7% | +12.3% | -7.6% | -12.4% | -9.1% | -21.1% | -87.2% | -90.4% | -29.1% | -31.9% |
JUFE-10K. The results are illustrated in Tab. 11. Despite JUFE-10K containing samples comparable to those in OIQ-10K, the gain on other databases is not entirely satisfactory. A possible explanation is that JUFE-10K focuses on samples with heterogeneous distortion, however, so far no BPIQA model has demonstrated the capability to learn and effectively apply local distortion patterns, which could advance the truth of the current status of BPIQA by encouraging the emergence of models with specialized designs to address local distortions.
| Method | CVIQ | OIQA | MVAQD | IQA-ODI | OSIQA | OIQ-10K | ||||||
| PLCC | SRCC | PLCC | SRCC | PLCC | SRCC | PLCC | SRCC | PLCC | SRCC | PLCC | SRCC | |
| MC360IQA | 0.456 | 0.438 | 0.471 | 0.390 | 0.320 | 0.096 | 0.117 | 0.117 | 0.168 | 0.136 | 0.416 | 0.409 |
| Gain | -26.5% | -28.3% | -24.0% | -36.2% | -48.4% | -84.3% | -81.1% | -80.9% | -72.9% | -77.7% | -32.9% | -33.1% |
| Assessor360 | 0.423 | 0.478 | 0.243 | 0.240 | 0.363 | 0.182 | 0.089 | 0.089 | 0.252 | 0.281 | 0.368 | 0.376 |
| Gain | -39.0% | -30.7% | -65.0% | -65.2% | -47.7% | -73.6% | -87.2% | -87.1% | -63.7% | -59.3% | -47.0% | -45.5% |
| OIQAND | 0.667 | 0.673 | 0.496 | 0.487 | 0.562 | 0.503 | 0.209 | 0.145 | 0.205 | 0.077 | 0.555 | 0.560 |
| Gain | -16.6% | -15.9% | -38.0% | -39.1% | -29.8% | -37.1% | -73.9% | -81.9% | -74.4% | -90.4% | -30.6% | -30.0% |
| ResNet-50-P | 0.506 | 0.543 | 0.516 | 0.448 | 0.512 | 0.408 | 0.182 | 0.080 | 0.164 | 0.054 | 0.504 | 0.507 |
| Gain | -35.4% | -30.7% | -34.1% | -42.8% | -34.6% | -47.9% | -76.8% | -89.8% | -79.1% | -93.1% | -35.6% | -35.2% |
| ResNet-152-P | 0.579 | 0.616 | 0.523 | 0.499 | 0.510 | 0.360 | 0.391 | 0.353 | 0.093 | 0.044 | 0.487 | 0.498 |
| Gain | -25.9% | -21.2% | -33.0% | -36.2% | -34.7% | -54.0% | -49.9% | -54.9% | -88.1% | -94.4% | -37.6% | -36.3% |
| Swin-v2-T-P | 0.586 | 0.629 | 0.507 | 0.453 | 0.480 | 0.254 | 0.265 | 0.263 | 0.158 | 0.145 | 0.464 | 0.468 |
| Gain | -20.5% | -13.8% | -31.2% | -37.9% | -34.9% | -65.2% | -64.0% | -64.0% | -78.6% | -80.1% | -37.0% | -35.9% |
| Swin-v2-B-P | 0.458 | 0.455 | 0.483 | 0.422 | 0.458 | 0.432 | 0.218 | 0.145 | 0.282 | 0.209 | 0.415 | 0.402 |
| Gain | -16.9% | -12.0% | -12.3% | -18.4% | -16.9% | -16.4% | -60.4% | -72.0% | -48.8% | -59.6% | -24.7% | -22.2% |
| MaxViT-T-P | 0.728 | 0.736 | 0.564 | 0.507 | 0.387 | 0.155 | 0.017 | -0.018 | 0.056 | 0.019 | 0.397 | 0.403 |
| Gain | -5.6% | -4.4% | -26.8% | -34.2% | -49.8% | -79.9% | -97.8% | -102.3% | -92.7% | -97.5% | -48.5% | -47.7% |
| Mean Gain | -23.3% | -19.6% | -33.1% | -38.7% | -37.1% | -57.3% | -73.9% | -79.1% | -74.8% | -81.5% | -36.8% | -35.7% |
Debiased validation. The analysis results from the first three perspectives are derived from existing PIQA databases, which are inevitably subject to biases introduced by the in-lab environment. To analyze the benefit of each PIQA database in practice, we utilize the BPIQA models initialized on the target database to assess the samples from the real world as shown in Fig. 3 (d). The experimental results are presented in Tab. 12, it is evident that the BPIQA models initialized on the OIQ-10K database exhibit the best performance, indicating that they can extract significantly more distortion information from this database than from others. Meanwhile, OIQA and MVAQD deliver sub-optimal results, yet it is apparent that all three databases feature a diverse array of distortion types and levels, coupled with rich and varied image content. Since CVIQ, IQA-OID, and JUFE-10K are tailored to samples featuring compressed distortion, map projection, and heterogeneous distortion, they serve to enhance BPIQA models in particular aspects but inherently exhibit a certain degree of limited generalization ability. OSIQA yields the worst results, primarily due to its small number of samples and sole focus on stitching distortion. Eventually, we rank all PIQA databases as follows (from highest to lowest performance): OIQ-10K, OIQA, MVAQD, JUFE-10K, CVIQ, IQA-ODI and OSIQA.
| Method | CVIQ (5) | OIQA (2) | MVAQD (3) | IQA-ODI (6) | OSIQA (7) | OIQ-10K (1) | JUFE-10K (4) | |||||||
| PLCC | SRCC | PLCC | SRCC | PLCC | SRCC | PLCC | SRCC | PLCC | SRCC | PLCC | SRCC | PLCC | SRCC | |
| MC360IQA | 0.259 | 0.254 | 0.603 | 0.534 | 0.116 | 0.023 | 0.213 | 0.222 | 0.203 | 0.136 | 0.550 | 0.518 | 0.393 | 0.378 |
| Assessor360 | 0.249 | 0.218 | 0.608 | 0.555 | 0.638 | 0.596 | 0.188 | 0.140 | 0.196 | 0.213 | 0.687 | 0.682 | 0.130 | 0.132 |
| OIQAND | 0.196 | 0.225 | 0.555 | 0.486 | 0.719 | 0.715 | 0.219 | 0.155 | 0.188 | 0.196 | 0.587 | 0.581 | 0.523 | 0.537 |
| ResNet-50-P | 0.509 | 0.498 | 0.532 | 0.467 | 0.593 | 0.573 | 0.286 | 0.143 | 0.126 | 0.088 | 0.678 | 0.667 | 0.417 | 0.447 |
| ResNet-152-P | 0.502 | 0.420 | 0.564 | 0.560 | 0.482 | 0.483 | 0.245 | -0.006 | 0.236 | 0.019 | 0.724 | 0.736 | 0.525 | 0.543 |
| Swin-v2-T-P | 0.308 | 0.272 | 0.620 | 0.594 | 0.708 | 0.704 | 0.211 | 0.183 | 0.020 | 0.042 | 0.686 | 0.676 | 0.378 | 0.412 |
| Swin-v2-B-P | 0.381 | 0.193 | 0.641 | 0.639 | 0.700 | 0.683 | 0.142 | -0.045 | 0.211 | 0.133 | 0.672 | 0.668 | 0.359 | 0.396 |
| MaxViT-T-P | 0.486 | 0.448 | 0.516 | 0.483 | 0.755 | 0.777 | 0.232 | 0.195 | 0.150 | 0.115 | 0.672 | 0.680 | 0.454 | 0.446 |
| Mean | 0.361 | 0.316 | 0.580 | 0.540 | 0.589 | 0.569 | 0.217 | 0.123 | 0.166 | 0.118 | 0.657 | 0.651 | 0.397 | 0.393 |
| Database | Global Ranking | ||||
| Q1 | Q2 | Q3 | T | Final | |
| OIQ-10K | 4 | 2 | 1 | 1 | 1 |
| JUFE-10K | 2 | 1 | 4 | 4 | 2 |
| MVAQD | 5 | 4 | 3 | 3 | 3 |
| OIQA | 6 | 6 | 2 | 2 | 4 |
| OSIQA | 1 | 3 | 7 | 7 | 5 |
| IQA-ODI | 3 | 5 | 6 | 6 | 6 |
| CVIQ | 7 | 7 | 5 | 5 | 7 |
4.5. Analysis Summary
Global ranking results. We first empirically rank all PIQA databases based on the analysis of three perspectives and the performance on in-the-wild samples respectively, and then induct the final global ranking results for a comprehensive analysis. Specifically, we consider the four aspects equally important in our study. Therefore, the average ranking score is used to determine the final result. As the results are shown in Tab. 13, OIQ-10K enables BPIQA models to learn the best distortion-related knowledge to assess the perceptual quality of most samples whether they are from in-lab databases or out-of-lab databases. Besides, this database causes a little challenge to the current BPIQA models, leading to an unsaturated performance which helps advance the ture of the current status of BPIQA. The success of OIQ-10K can be attributed to its consideration of real-world local degradation, which includes the introduction of homogeneous distortion and heterogeneous distortion simultaneously. Moreover, it encompasses a diverse range of distortion types, varying degrees of distortion, and various image resolutions, among other factors. The second high-quality PIQA database is JUFE-10K, it successfully creates a big gap between BIQA and BPIQA that disables the BIQA models to access the BPIQA. JUFE-10K focuses predominantly on the common local degradation issues encountered in real-world scenarios, encompassing a handful of panoramic images with heterogeneous distortions. These distortions pose significant challenges to BPIQA models, necessitating the introduction of specific design within the models to effectively address this unique distortion pattern. However, it seems that no one BPIQA model has successfully processed this distortion pattern so far, causing JUFE-10K to hardly enable BPIQA models to effectively process all distorted scenarios due to the specificity of the distortions. Although MVAQD attains a relative average rank in this computational analysis, it is worthy to be constructed and deserves further consideration in the future. The main reason is that MVAQD only contains a few samples compared with OIQ-10K and JUFE-10K, and reveals certain beneficial information for building the BPIQA model, suggesting that the diversity of distortion situation and image resolution are of great importance in the PIQA database. OIQA fails to create a gap between BIQA and BPIQA, leading to BIQA models substituting BPIQA models to assess the perceptual quality of panoramic images without any effort, which can not expose the true of the current status of BPIQA. In addition, BPIQA models present a saturated performance on this database that causes a waste of the human labeling budget. Surprisingly, the BPIQA models trained on OIQA demonstrate favorable generalization ability, this could attributed to the source images captured by professional photographers with diverse compositions and rich colors. OSIQA yield a polarized result, which lead to a less prominent overall quality. On one hand, it prevents BIQA models from recognizing its distortion patterns and significantly hinders BPIQA models, suggesting that it successfully encourages models to design better modules to handle its distortions. On the other hand, it struggles to improve the model’s generalization ability, proving that its distortions lack universal features, thus greatly diminishing its practical value. This result is understandable, similar to JUFE-10K, as both databases only contain heterogeneous distortions. Although IQA-ODI boasts a significantly larger sample size and possesses distinctive characteristics that distinguish it from planar images, unfortunately, it fails to pose effective obstacles for BPIQA models thereby enhancing their assessment capabilities through it. The main reason may be the single distortion type can not offer more distortion-related knowledge. Apparently, CVIQ suffers from a severe easy-database issue, which hinders the practical application in BPIQA. The reason is multiple. First, the source images in CVIQ have fewer distinctive features causing the overall samples with insufficient richness and depth. Second, CVIQ centers on compressed distortion, however, the panoramic images in the real world are commonly subjected to various distortions. Besides, the image resolution (only 4K) of samples in CVIQ is relatively sufficient compared to other PIQA databases.
The proposed general BPIQA models. We analyze the experimental results in Tab. 4 to explore our proposed general models. Specifically, the average PLCC value of the proposed five models reaches 0.978, 0.963, and 0.964 on CVIQ, OIQA, and IQA-ODI, respectively, while achieving a promising average performance with a PLCC of 0.801 on OIQ-10K. However, compared to OIQAND, the results on the databases with pure heterogeneous distortion (i.e., OSIQA and JUFE-10K) are relatively worse, which indicate that special designs are essential to address these challenging scenarios.
5. Conclusion and Future Work
In this paper, we conduct a thorough analysis of the easy-database issue emerging BPIQA from three perspectives, including the gap between BPIQA and BIQA, the necessity of specific design in BPIQA models, and the generalization ability of BPIQA models. Experimental results demonstrate that most of PIQA databases suffer from the easy-database issue, and are not sensitive to the specific designs in BPIQA models. Moreover, we study the PIQA databases by the generalization ability of BPIQA models, and we find that a high-quality PIQA database can empower BPIQA to deal with hard samples and exhibit high transfer performance in cross-validation experiments. Finally, we empirically rank all PIQA databases based on the above analysis and induct a global ranking about the easy-database issue, which could give insightful guidelines for next-generation PIQA databases and BPIQA models.
From the database perspective, we can observe that OSIQA, OIQ-10K and JUFE-10K present significant challenges for both BIQA and BPIQA, which implies that there still exists substantial improvement room for PIQA in real-world applications. Inspired by the results, we can put more subjective effort on those hard samples (i.e., images with non-uniform distortion distribution), and then design more powerful objective models by incorporating the characteristic of how human beings perceive these images. In addition, we can also shift partial attention to those panoramic images degraded by processing algorithms (Yan et al., 2023). From the model perspective, the transformer-based and hybrid-based models are worth further deep exploration, since the ability of global modeling in the transformer is of great importance in addressing panoramic-specific distortion. We can also consider introducing multimodal information to assist BPIQA models (Zhang et al., 2023b).
References
- (1)
- Agnolucci et al. (2024) Lorenzo Agnolucci, Leonardo Galteri, and Marco Bertini. 2024. Quality-aware image-text alignment for real-World image quality assessment. arXiv preprint arXiv:2403.11176 (2024).
- Chai et al. (2021) Xiongli Chai, Feng Shao, Qiuping Jiang, Xiangchao Meng, and Yo-Sung Ho. 2021. Monocular and binocular interactions oriented deformable convolutional networks for blind quality assessment of stereoscopic omnidirectional images. IEEE Transactions on Circuits and Systems for Video Technology 32, 6 (2021), 3407–3421.
- Deng et al. (2009) Jia Deng, Wei Dong, Richard Socher, Lijia Li, Kai Li, and Li Fei-Fei. 2009. ImageNet: A large-scale hierarchical image database. In IEEE Conference on Computer Vision and Pattern Recognition. 248–255.
- Deng et al. (2021) Xin Deng, Hao Wang, Mai Xu, Yichen Guo, Yuhang Song, and Li Yang. 2021. Lau-Net: Latitude adaptive upscaling network for omnidirectional image super-resolution. In IEEE Conference on Computer Vision and Pattern Recognition. 9189–9198.
- Duan et al. (2023) Huiyu Duan, Xiongkuo Min, Wei Sun, Yucheng Zhu, Xiao-Ping Zhang, and Guangtao Zhai. 2023. Attentive deep image quality assessment for omnidirectional stitching. IEEE Journal of Selected Topics in Signal Processing 17, 6 (2023), 1150–1164.
- Duan et al. (2018) Huiyu Duan, Guangtao Zhai, Xiongkuo Min, Yucheng Zhu, Yi Fang, and Xiaokang Yang. 2018. Perceptual quality assessment of omnidirectional images. In IEEE International Symposium on Circuits and Systems. 1–5.
- Fang et al. (2022) Yuming Fang, Liping Huang, Jiebin Yan, Xuelin Liu, and Yang Liu. 2022. Perceptual quality assessment of omnidirectional images. In AAAI Conference on Artificial Intelligence, Vol. 36. 580–588.
- Fang et al. (2023) Yuming Fang, Zhaoqian Li, Jiebin Yan, Xiangjie Sui, and Hantao Liu. 2023. Study of spatio-temporal modeling in video quality assessment. IEEE Transactions on Image Processing 32 (2023), 2693–2702.
- Fang et al. (2020a) Yuming Fang, Jiebin Yan, Rengang Du, Yifan Zuo, Wenying Wen, Yan Zeng, and Leida Li. 2020a. Blind quality assessment for tone-mapped images by analysis of gradient and chromatic statistics. IEEE Transactions on Multimedia 23 (2020), 955–966.
- Fang et al. (2019) Yuming Fang, Jiebin Yan, Xuelin Liu, and Jiheng Wang. 2019. Stereoscopic image quality assessment by deep convolutional neural network. Journal of Visual Communication and Image Representation 58 (2019), 400–406.
- Fang et al. (2021) Yuming Fang, Yan Zeng, Wenhui Jiang, Hanwei Zhu, and Jiebin Yan. 2021. Superpixel-based quality assessment of multi-exposure image fusion for both static and dynamic scenes. IEEE Transactions on Image Processing 30 (2021), 2526–2537.
- Fang et al. (2020b) Yuming Fang, Hanwei Zhu, Yan Zeng, Kede Ma, and Zhou Wang. 2020b. Perceptual quality assessment of smartphone photography. In IEEE Conference on Computer Vision and Pattern Recognition. 3677–3686.
- Fu et al. (2022) Jun Fu, Chen Hou, Wei Zhou, Jiahua Xu, and Zhibo Chen. 2022. Adaptive hypergraph convolutional network for no-reference 360-degree image quality assessment. In ACM International Conference on Multimedia. 961–969.
- Hands and Avons (2001) David S Hands and SE Avons. 2001. Recency and duration neglect in subjective assessment of television picture quality. Applied Cognitive Psychology: The Official Journal of the Society for Applied Research in Memory and Cognition 15, 6 (2001), 639–657.
- He et al. (2016) Kaiming He, Xiangyu Zhang, Shaoqing Ren, and Jian Sun. 2016. Deep residual learning for image recognition. In IEEE Conference on Computer Vision and Pattern Recognition. 770–778.
- Hosu et al. (2020) Vlad Hosu, Hanhe Lin, Tamas Sziranyi, and Dietmar Saupe. 2020. KonIQ-10k: An ecologically valid database for deep learning of blind image quality assessment. IEEE Transactions on Image Processing 29 (2020), 4041–4056.
- Hou et al. (2023) Guojia Hou, Yuxuan Li, Huan Yang, Kunqian Li, and Zhenkuan Pan. 2023. UID2021: An underwater image dataset for evaluation of no-reference quality assessment metrics. ACM Transactions on Multimedia Computing, Communications and Applications 19, 4 (2023), 1–24.
- Jiang et al. (2021) Hao Jiang, Gangyi Jiang, Mei Yu, Yun Zhang, You Yang, Zongju Peng, Fen Chen, and Qingbo Zhang. 2021. Cubemap-based perception-driven blind quality assessment for 360-degree images. IEEE Transactions on Image Processing 30 (2021), 2364–2377.
- Kamann and Rother (2020) Christoph Kamann and Carsten Rother. 2020. Benchmarking the robustness of semantic segmentation models. In IEEE Conference on Computer Vision and Pattern Recognition. 8828–8838.
- Kingma and Ba (2015) Diederik P Kingma and Jimmy Ba. 2015. Adam: A method for stochastic optimization. In International Conference on Learning Representations.
- Le et al. (2021) Chenyang Le, Jiebin Yan, Yuming Fang, and Kede Ma. 2021. Perceptually optimized deep high-dynamic-range image tone mapping. In IEEE International Conference on Virtual Reality and Visualization.
- Li et al. (2024) Aobo Li, Jinjian Wu, Yongxu Liu, and Leida Li. 2024. Bridging the synthetic-to-authentic gap: Distortion-guided unsupervised domain adaptation for blind image quality assessment. In IEEE Conference on Computer Vision and Pattern Recognition. 28422–28431.
- Li et al. (2019) D. Li, T. Jiang, and M. Jiang. 2019. Quality assessment of in-the-wild videos. In ACM International Conference on Multimedia. 2351–2359.
- Li et al. (2020) Dingquan Li, Tingting Jiang, and Ming Jiang. 2020. Norm-in-Norm loss with faster convergence and better performance for image quality assessment. In ACM International Conference on Multimedia. 789–797.
- Liu et al. (2024) Xuelin Liu, Jiebin Yan, Liping Huang, Yuming Fang, Zheng Wan, and Yang Liu. 2024. Perceptual Quality Assessment of Omnidirectional Images: A Benchmark and Computational Model. ACM Transactions on Multimedia Computing, Communications and Applications 20, 6 (2024), 1–24.
- Liu et al. (2023a) Xuelin Liu, Jiebin Yan, Zheng Wan, Yuming Fang, and Zhou Wang. 2023a. A quality-of-experience database for adaptive omnidirectional video streaming. IEEE Journal of Selected Topics in Signal Processing 17, 5 (2023), 949–963.
- Liu et al. (2023b) Yun Liu, Xiaohua Yin, Zuliang Wan, Guanghui Yue, and Zhi Zheng. 2023b. Toward a no-reference omnidirectional image quality evaluation by using multi-perceptual features. ACM Transactions on Multimedia Computing, Communications and Applications 19, 2 (2023), 1–19.
- Liu et al. (2022b) Yun Liu, Xiaohua Yin, Yan Wang, Zixuan Yin, and Zhi Zheng. 2022b. HVS-based perception-driven no-reference omnidirectional image quality assessment. IEEE Transactions on Instrumentation and Measurement 72 (2022), 1–11.
- Liu et al. (2021) Yun Liu, Hongwei Yu, Baoqing Huang, Guanghui Yue, and Baoyan Song. 2021. Blind omnidirectional image quality assessment based on structure and natural features. IEEE Transactions on Instrumentation and Measurement 70 (2021), 1–11.
- Liu et al. (2022a) Ze Liu, Han Hu, Yutong Lin, Zhuliang Yao, Zhenda Xie, Yixuan Wei, Jia Ning, Yue Cao, Zheng Zhang, Li Dong, et al. 2022a. Swin Transformer V2: Scaling up capacity and resolution. In IEEE Conference on Computer Vision and Pattern Recognition. 12009–12019.
- Ma et al. (2020) Kede Ma, Zhengfang Duanmu, Zhou Wang, Qingbo Wu, Wentao Liu, Hongwei Yong, Hongliang Li, and Lei Zhang. 2020. Group maximum differentiation competition: Model comparison with few samples. IEEE Transactions on Pattern Analysis and Machine Intelligence 42, 4 (2020), 851–864.
- Ma et al. (2016) Kede Ma, Zhengfang Duanmu, Qingbo Wu, Zhou Wang, Hongwei Yong, Hongliang Li, and Lei Zhang. 2016. Waterloo exploration database: New challenges for image quality assessment models. IEEE Transactions on Image Processing 26, 2 (2016), 1004–1016.
- Ma et al. (2021) Rui Ma, Hanxiao Luo, Qingbo Wu, King Ngi Ngan, Hongliang Li, Fanman Meng, and Linfeng Xu. 2021. Remember and reuse: Cross-task blind image quality assessment via relevance-aware incremental learning. In ACM International Conference on Multimedia. 5248–5256.
- Ma et al. (2023) Rui Ma, Qingbo Wu, King Ngi Ngan, Hongliang Li, Fanman Meng, and Linfeng Xu. 2023. Forgetting to remember: A scalable incremental learning framework for cross-task blind image quality assessment. IEEE Transactions on Multimedia 25 (2023), 8817–8827.
- Madhusudana et al. (2022) Pavan C Madhusudana, Neil Birkbeck, Yilin Wang, Balu Adsumilli, and Alan C Bovik. 2022. Image quality assessment using contrastive learning. IEEE Transactions on Image Processing 31 (2022), 4149–4161.
- Pan et al. (2022) Zhaoqing Pan, Feng Yuan, Jianjun Lei, Yuming Fang, Xiao Shao, and Sam Kwong. 2022. VCRNet: Visual compensation restoration network for no-reference image quality assessment. IEEE Transactions on Image Processing 31 (2022), 1613–1627.
- Paszke et al. (2017) Adam Paszke, Sam Gross, Soumith Chintala, Gregory Chanan, Edward Yang, Zachary DeVito, Zeming Lin, Alban Desmaison, Luca Antiga, and Adam Lerer. 2017. Automatic differentiation in pytorch. (2017).
- Recht et al. (2019) Benjamin Recht, Rebecca Roelofs, Ludwig Schmidt, and Vaishaal Shankar. 2019. Do ImageNet classifiers generalize to ImageNet?. In International Conference on Machine Learning. 5389–5400.
- Russakovsky et al. (2015) Olga Russakovsky, Jia Deng, Hao Su, Jonathan Krause, Sanjeev Satheesh, Sean Ma, Zhiheng Huang, Andrej Karpathy, Aditya Khosla, Michael Bernstein, Alexander C. Berg, and Li Fei-Fei. 2015. ImageNet large scale visual recognition challenge. International Journal of Computer Vision 115, 3 (2015), 211–252.
- Sendjasni and Larabi (2022) Abderrezzaq Sendjasni and Mohamed-Chaker Larabi. 2022. SAL-360IQA: A saliency weighted patch-based CNN model for 360-degree images quality assessment. In IEEE International Conference on Multimedia and Expo Workshops. IEEE, 1–6.
- Sheikh et al. (2006) Hamid R Sheikh, Muhammad F Sabir, and Alan C Bovik. 2006. A statistical evaluation of recent full reference image quality assessment algorithms. IEEE Transactions on Image Processing 15, 11 (2006), 3440–3451.
- Siekkinen et al. (2018) Matti Siekkinen, Teemu Kämäräinen, Leonardo Favario, and Enrico Masala. 2018. Can you see what I see? Quality-of-experience measurements of mobile live video broadcasting. ACM Transactions on Multimedia Computing, Communications, and Applications 14, 2s (2018), 1–23.
- Su et al. (2020) Shaolin Su, Qingsen Yan, Yu Zhu, Cheng Zhang, Xin Ge, Jinqiu Sun, and Yanning Zhang. 2020. Blindly assess image quality in the wild guided by a self-adaptive hyper network. In IEEE Conference on Computer Vision and Pattern Recognition. 3667–3676.
- Sui et al. (2021) Xiangjie Sui, Kede Ma, Yiru Yao, and Yuming Fang. 2021. Perceptual quality assessment of omnidirectional images as moving camera videos. IEEE Transactions on Visualization and Computer Graphics 28, 8 (2021), 3022–3034.
- Sui et al. (2023) Xiangjie Sui, Hanwei Zhu, Xuelin Liu, Yuming Fang, Shiqi Wang, and Zhou Wang. 2023. Perceptual Quality Assessment of 360 Images Based on Generative Scanpath Representation. arXiv preprint arXiv:2309.03472 (2023).
- Sun et al. (2018) Wei Sun, Ke Gu, Siwei Ma, Wenhan Zhu, Ning Liu, and Guangtao Zhai. 2018. A large-scale compressed 360-degree spherical image database: From subjective quality evaluation to objective model comparison. In IEEE International Workshop on Multimedia Signal Processing. 1–6.
- Sun et al. (2019) Wei Sun, Xiongkuo Min, Guangtao Zhai, Ke Gu, Huiyu Duan, and Siwei Ma. 2019. MC360IQA: A multi-channel CNN for blind 360-degree image quality assessment. IEEE Journal of Selected Topics in Signal Processing 14, 1 (2019), 64–77.
- Sun et al. (pear) Wei Sun, Wen Wen, Xiongkuo Min, Long Lan, Guangtao Zhai, and Kede Ma. 2024, to appear. Analysis of video quality datasets via design of minimalistic video quality models. IEEE Transactions on Pattern Analysis and Machine Intelligence (2024, to appear).
- Sun et al. (2017) Yule Sun, Ang Lu, and Lu Yu. 2017. Weighted-to-spherically-uniform quality evaluation for omnidirectional video. IEEE Signal Processing Letters 24, 9 (2017), 1408–1412.
- Tofighi et al. (2023) Nafiseh Jabbari Tofighi, Mohamed Hedi Elfkir, Nevrez Imamoglu, Cagri Ozcinar, Erkut Erdem, and Aykut Erdem. 2023. ST360IQ: No-reference omnidirectional image quality assessment with spherical vision transformers. In IEEE International Conference on Acoustics, Speech and Signal Processing. 1–5.
- Tu et al. (2022) Zhengzhong Tu, Hossein Talebi, Han Zhang, Feng Yang, Peyman Milanfar, Alan Bovik, and Yinxiao Li. 2022. MaxViT: Multi-axis vision transformer. In European Conference on Computer Vision. Springer, 459–479.
- Vaswani et al. (2017) A. Vaswani, N. Shazeer, N. Parmar, J. Uszkoreit, L. Jones, A. Gomez, Ł. Kaiser, and I. Polosukhin. 2017. Attention is all you need. In Advances in Neural Information Processing Systems, Vol. 30.
- Wang et al. (2020) Haotao Wang, Tianlong Chen, Zhangyang Wang, and Kede Ma. 2020. I am going MAD: Maximum discrepancy competition for comparing classifiers adaptively. In International Conference on Learning Representations.
- Wang et al. (2004) Zhou Wang, Alan C Bovik, Hamid R Sheikh, and Eero P Simoncelli. 2004. Image quality assessment: From error visibility to structural similarity. IEEE Transactions on Image Processing 13, 4 (2004), 600–612.
- Wang and Ma (2021) Zhihua Wang and Kede Ma. to appear, 2021. Active fine-tuning from gMAD examples improves blind image quality assessment. IEEE Transactions on Pattern Analysis and Machine Intelligence (to appear, 2021).
- Wang and Simoncelli (2008) Zhou Wang and Eero P Simoncelli. 2008. Maximum differentiation (MAD) competition: A methodology for comparing computational models of perceptual quantities. Journal of Vision 8, 12 (2008), 8–8.
- Wang et al. (2021) Zhihua Wang, Haotao Wang, Tianlong Chen, Zhangyang Wang, and Kede Ma. 2021. Troubleshooting blind image quality models in the wild. In IEEE Conference on Computer Vision and Pattern Recognition. 16256–16265.
- Wu et al. (2022) Haoning Wu, Chaofeng Chen, Jingwen Hou, Liang Liao, Annan Wang, Wenxiu Sun, Qiong Yan, and Weisi Lin. 2022. FAST-VQA: Efficient end-to-end video quality assessment with fragment sampling. In European Conference on Computer Vision. 538–554.
- Wu et al. (2023) Tianhe Wu, Shuwei Shi, Haoming Cai, Mingdeng Cao, Jing Xiao, Yinqiang Zheng, and Yujiu Yang. 2023. Assessor360: Multi-sequence Network for Blind Omnidirectional Image Quality Assessment. In Neural Information Processing Systems.
- Xu et al. (2020) Jiahua Xu, Wei Zhou, and Zhibo Chen. 2020. Blind omnidirectional image quality assessment with viewport oriented graph convolutional networks. IEEE Transactions on Circuits and Systems for Video Technology 31, 5 (2020), 1724–1737.
- Yan et al. (2020a) Jiebin Yan, Yuming Fang, Rengang Du, Yan Zeng, and Yifan Zuo. 2020a. No reference quality assessment for 3D synthesized views by local structure variation and global naturalness change. IEEE Transactions on Image Processing 29 (2020), 7443–7453.
- Yan et al. (2020b) Jiebin Yan, Yuming Fang, Liping Huang, Xiongkuo Min, Yiru Yao, and Guangtao Zhai. 2020b. Blind stereoscopic image quality assessment by deep neural network of multi-level feature fusion. In IEEE International Conference on Multimedia and Expo. 1–6.
- Yan et al. (2023) Jiebin Yan, Yuming Fang, Xuelin Liu, Yiru Yao, and Xiangjie Sui. 2023. A survey on recent advances in video quality assessment. Chinese Journal of Computers (2023).
- Yan et al. (2024a) Jiebin Yan, Jiale Rao, Junjie Chen, Ziwen Tan, Weide Liu, and Yuming Fang. 2024a. Multitask Auxiliary Network for Perceptual Quality Assessment of Non-Uniformly Distorted Omnidirectional Images. IEEE Transactions on Circuits and Systems for Video Technology (2024), 1–1. https://doi.org/10.1109/TCSVT.2024.3497994
- Yan et al. (pteda) Jiebin Yan, Jiale Rao, Xuelin Liu, Yuming Fang, Yifan Zuo, and Weide Liu. 2024, accepteda. Subjective and objective quality assessment of non-uniformly distorted omnidirectional images. IEEE Transactions on Multimedia (2024, accepted).
- Yan et al. (ptedb) Jiebin Yan, Ziwen Tan, Yuming Fang, Junjie Chen, Wenhui Jiang, and Zhou Wang. 2025, acceptedb. Omnidirectional image quality captioning: A large-scale database and a new model. IEEE Transactions on Image Processing (2025, accepted).
- Yan et al. (2024b) Jiebin Yan, Lei Wu, Yuming Fang, Xuelin Liu, Xue Xia, and Weide Liu. 2024b. Video Quality Assessment for Online Processing: From Spatial to Temporal Sampling. IEEE Transactions on Circuits and Systems for Video Technology (2024), 1–1. https://doi.org/10.1109/TCSVT.2024.3450085
- Yan et al. (2021) Jiebin Yan, Yu Zhong, Yuming Fang, Zhangyang Wang, and Kede Ma. 2021. Exposing semantic segmentation failures via maximum discrepancy competition. International Journal of Computer Vision 129 (2021), 1768–1786.
- Yang et al. (2024) Liu Yang, Huiyu Duan, Long Teng, Yucheng Zhu, Xiaohong Liu, Menghan Hu, Xiongkuo Min, Guangtao Zhai, and Patrick Le Callet. 2024. AIGCOIQA2024: Perceptual Quality Assessment of AI Generated Omnidirectional Images. arXiv preprint arXiv:2404.01024 (2024).
- Yang et al. (2021) Li Yang, Mai Xu, Xin Deng, and Bo Feng. 2021. Spatial attention-based non-reference perceptual quality prediction network for omnidirectional images. In IEEE International Conference on Multimedia and Expo. 1–6.
- Yang et al. (2022b) Li Yang, Mai Xu, Tie Liu, Liangyu Huo, and Xinbo Gao. 2022b. TVFormer: Trajectory-guided visual quality assessment on 360° images with transformers. In ACM International Conference on Multimedia. 799–808.
- Yang et al. (2022a) Sidi Yang, Tianhe Wu, Shuwei Shi, Shanshan Lao, Yuan Gong, Mingdeng Cao, Jiahao Wang, and Yujiu Yang. 2022a. MANIQA: Multi-dimension attention network for no-reference image quality assessment. In IEEE Conference on Computer Vision and Pattern Recognition. 1191–1200.
- Zhang and Liu (2022) Chaofan Zhang and Shiguang Liu. 2022. No-reference omnidirectional image quality assessment based on joint network. In ACM International Conference on Multimedia. 943–951.
- Zhang et al. (2016) Shanshan Zhang, Rodrigo Benenson, Mohamed Omran, Jan Hosang, and Bernt Schiele. 2016. How far are we from solving pedestrian detection?. In IEEE Conference on Computer Vision and Pattern Recognition. 1259–1267.
- Zhang et al. (2021) Weixia Zhang, Kede Ma, Guangtao Zhai, and Xiaokang Yang. 2021. Uncertainty-aware blind image quality assessment in the laboratory and wild. IEEE Transactions on Image Processing 30 (2021), 3474–3486.
- Zhang et al. (2023b) Weixia Zhang, Guangtao Zhai, Ying Wei, Xiaokang Yang, and Kede Ma. 2023b. Blind image quality assessment via vision-language correspondence: A multitask learning perspective. In IEEE Conference on Computer Vision and Pattern Recognition. 14071–14081.
- Zhang et al. (2023a) Zicheng Zhang, Wei Sun, Yingjie Zhou, Jun Jia, Zhichao Zhang, Jing Liu, Xiongkuo Min, and Guangtao Zhai. 2023a. Subjective and objective quality assessment for in-the-wild computer graphics images. ACM Transactions on Multimedia Computing, Communications and Applications 20, 4 (2023), 1–22.
- Zhou et al. (2023) Mingliang Zhou, Lei Chen, Xuekai Wei, Xingran Liao, Qin Mao, Heqiang Wang, Huayan Pu, Jun Luo, Tao Xiang, and Bin Fang. 2023. Perception-Oriented U-Shaped Transformer Network for 360-Degree No-Reference Image Quality Assessment. IEEE Transactions on Broadcasting (2023).
- Zhou et al. (pear) Wei Zhou, Qi Yang, Wu Chen, Qiuping Jiang, Guangtao Zhai, and Weisi Lin. 2024, to appear. Blind Quality Assessment of Dense 3D Point Clouds with Structure Guided Resampling. ACM Transactions on Multimedia Computing, Communications and Applications (2024, to appear).
- Zhou et al. (2021) Yu Zhou, Yanjing Sun, Leida Li, Ke Gu, and Yuming Fang. 2021. Omnidirectional image quality assessment by distortion discrimination assisted multi-stream network. IEEE Transactions on Circuits and Systems for Video Technology 32, 4 (2021), 1767–1777.
- Zhou et al. (2018) Yufeng Zhou, Mei Yu, Hualin Ma, Hua Shao, and Gangyi Jiang. 2018. Weighted-to-spherically-uniform SSIM objective quality evaluation for panoramic video. In IEEE International Conference on Signal Processing. 54–57.