CO Emission and Absorption-line Survey of the M87 Nucleus Using Archival ALMA Imaging
Abstract
We present an M87 molecular line search from archival Atacama Large Millimeter/sub-millimeter Array (ALMA) imaging, covering the circumnuclear disk (CND) as well as ionized gas filaments and dusty cloud regions. We find no evidence for CO emission in the central kpc and place an upper limit of in the atomic gas CND, a factor of 20 lower than previous surveys. During this search, we discovered extragalactic CO absorption lines in the = 10, 21, and 32 transitions against the bright (Jy-scale) active nucleus. These CO lines are narrow (5 km s-1) and blueshifted with respect to the galaxy’s systemic velocity by 75 to 84 km s-1. This CO absorber appears to be kinematically distinct from outflowing atomic gas seen in absorption. Assuming a diffuse molecular phase, low integrated opacities ranging from km s-1 and column density cm-2 translate to cm-2. CO excitation temperatures spanning K to 30 K do not follow local thermodynamic equilibrium (LTE) expectations, and non-LTE radex radiative transfer modeling suggests the CO absorber has a number density cm-3. Taken together, the observed CO absorption lines are most consistent with a thin, pressure-confined filament seen slightly off-center from the M87 nucleus. We also use these ALMA data to explore the impact of residual telluric lines and atmospheric variability on the identification and classification of narrow extragalactic lines. Additionally, we demonstrate how bandpass calibration limitations may introduce broad but very low S/N absorption and emission signatures near such a bright continuum source.
1 Introduction
Ongoing gas accretion onto supermassive black holes (BHs; with masses ) powers active galactic nuclei (AGN) at the centers of galaxies. In extreme cases, highly efficient central engines are visible across the observable universe. A wide range of AGN phenomena – including broad and/or narrow emission lines, a very hot accretion disk, and large-scale jets of relativistic plasma – are explained in the AGN standard model primarily by different viewing angles and accretion rates (e.g., C. Tadhunter, 2008; J. R. Trump et al., 2011; S. Bianchi et al., 2012). A subset of these AGN are radio bright with collimated jet features, typically classified as either type I (centrally dominant or edge-darkened continuum emission) or type II (edge-brightened) Fanaroff-Riley galaxies (FR; B. L. Fanaroff & J. M. Riley, 1974).
M87 (NGC 4486) is one of the most well-studied luminous early-type galaxies (ETGs; classified as cD0-1 pec; G. de Vaucouleurs et al., 1991), in large part due to its close proximity in the Virgo cluster and as the brightest galaxy of the Virgo A subgroup. This FR I galaxy is also well studied due to its central narrow-lined, low-ionized nuclear emission-line region (LINER Type 2; L. C. Ho et al., 1997; M. A. Dopita et al., 1997). The active nucleus is bright across mm to radio wavelengths (with central flux density Jy) and launches a jet seen primarily on the approaching side across radio to X-ray wavelengths (e.g., H. L. Marshall et al., 2002; J. Y. Kim et al., 2018), connecting to radio lobes that extend out to a projected 3 kpc (M. Chiaberge et al., 1999). M87 garnered significant additional attention during the Event Horizon Telescope (EHT) very large baseline interferometry (VLBI) campaigns that imaged its BH shadow on 25 as scales and connected gas accretion and magnetic field structures very close to the BH to the jet launching region (EHT Collaboration et al., 2019, 2021a, 2021b).
Modeling of both the EHT and stellar kinematics return a consistent ranging between (K. Gebhardt & J. Thomas, 2009; EHT Collaboration et al., 2019; E. R. Liepold et al., 2023; D. A. Simon et al., 2024). Earlier gas-dynamical modeling efforts had preferred a BH mass that was half that of stellar-dynamical modeling results (R. J. Harms et al., 1994; F. Macchetto et al., 1997; J. L. Walsh et al., 2013); recent work, however, has brought the gaseous results into better agreement (J. Osorno et al., 2023). The mass accretion rate of M87 is very low, between yr-1 or an Eddington fraction (C. Y. Kuo et al., 2014; K. Inayoshi et al., 2020). Together with many other radio galaxies, M87 lies in a transition region between cold, thin disk accretion and radiatively inefficient accretion flows.
Early ground-based and Hubble Space Telescope (HST) imaging revealed filaments of ionized gas extending out several kpc from the M87 nucleus (W. B. Sparks et al., 1993; H. C. Ford et al., 1994; R. W. Pogge et al., 2000). It is unclear if this gas is related to known merger activity (A. Longobardi et al., 2015), or even if the gas in the central few kpc is infalling towards the BH (e.g., in chaotic cold-mode accretion, or CCA; M. Gaspari et al., 2013) or is being disturbed by rising bubbles or the radio jet (e.g., V. Olivares et al., 2019). In some massive elliptical or cD galaxies like M87, spectral energy distribution (SED) fitting (F. Yuan & R. Narayan, 2014) suggests hot-mode accretion dominates most of the time, even if a gaseous circumnuclear disk (CND) is clearly detected.
Many FR I galaxies host morphologically regular, geometrically thin disks with relatively small radii (generally a few 100 pc; S. de Koff et al., 2000; L. Saripalli, 2012). These CNDs are often identified by dusty disks or lanes, and molecular line surveys have revealed modest cospatial H2 mass reservoirs (with typical ; e.g., B. Ocaña Flaquer et al., 2010; I. Prandoni et al., 2010; B. D. Boizelle et al., 2017, 2021; I. Ruffa et al., 2019). Unfortunately, the bright optical nucleus and jet of M87 prevent any definitive conclusions about dust absorption on the smallest scales (down to a projected radius or 10 pc from the galaxy center). On larger scales, its filamentary gas appears to connect to an ionized-gas CND with well-ordered rotation out to (¡50 pc; W. B. Sparks et al., 1993; H. C. Ford et al., 1994; J. L. Walsh et al., 2013; A. Boselli et al., 2019; J. Osorno et al., 2023). Atomic gas line-of-sight (LOS) speeds () for this rotation reach roughly km s-1 from the galaxy’s systemic velocity km s-1 (from stellar absorption-line fits with a heliocentric ; M. Cappellari et al., 2011) within an angular distance of from the nucleus.
Despite the mostly ordered central velocity field, maps of the atomic emission-line dispersion show asymmetries in the northwest direction that suggest a bi-conical outflow (with intrinsic speeds reaching out to 400 km s-1 along a position angle PA ; W. B. Sparks et al., 1993; A. Boselli et al., 2019; J. Osorno et al., 2023). Further support for an outflow comes from UV/optical absorption lines detected against the bright nucleus, although this may reveal a kinematically distinct component. These atomic tracers show blueshifted absorption lines with km s-1 and moderate intrinsic FWHM km s-1 (Z. I. Tsvetanov et al., 1999b; B. M. Sabra et al., 2003). Absorption-line measurements as well as modeling of the central X-ray spectrum both support hydrogen column densities in the cm-2 range (A. S. Wilson & Y. Yang, 2002; T. Di Matteo et al., 2003; B. M. Sabra et al., 2003).

Within the central few kpc of M87 (out to at least 40″), molecular gas is best traced in the optical by discrete, low-extinction filaments and clouds. Similar dusty features are observed in the inner kpc of most luminous elliptical galaxies (W. G. Mathews & F. Brighenti, 2003; P. Temi et al., 2018; G. R. Tremblay et al., 2018; V. Olivares et al., 2019), often following ionized atomic emission-line filaments (e.g., W. B. Sparks et al., 1993; L. Ferrarese et al., 2006; J. P. Madrid et al., 2007; A. Boselli et al., 2019; T. R. Taylor et al., 2020). For M87, evidence for the corresponding thermal dust continuum is ambiguous and global SED fits are often interpreted as showing no evidence for diffuse dust and limited support for circumnuclear dust (M. Baes et al., 2010). However, a couple of elevated SED points have been tied to a small, cold dust component (with characteristic temperature K and mass ; H. S. P. Müller et al., 2005). Also, mid-IR spectroscopy of the nucleus is better fit with the addition of a warmer low-mass dust component ( K and ; E. S. Perlman et al., 2007).
The expected, accompanying molecular gas remains elusive. Single-dish mm/sub-mm imaging of this target did not detect global 12CO (hereafter CO) emission in the transition across a velocity range of a few hundred km s-1, first with an initial 1 line flux upper limit Jy km s-1 (J. H. Bieging et al., 1981; W. Jaffe, 1987; J. Braine & T. Wiklind, 1993) and later on a 3 upper limit of 10.2 Jy km s-1 (F. Combes et al., 2007; P. Salomé & F. Combes, 2008). From interferometric observations with the Submillimeter Array (SMA), J. C. Tan et al. (2008) reported a tentative Jy km s-1 detection (with separate 1 statistical and systematic uncertainties) in an 80 pc-diameter aperture about the nucleus. If correct, the corresponding total H2 mass could be detected using the Atacama Large Millimeter/submillimeter Array (ALMA), which provides an order-of-magnitude improvement in both angular resolution and limiting sensitivity over previous mm-wavelength interferometers.
In this paper, we present the first ALMA mm/sub-mm wavelength molecular line search of the M87 nucleus. This paper is structured as follows. In Section 2, we introduce archival HST and ALMA data sets and imaging processes. Section 3 describes the CO emission-line search and CO absorption-line detection. We constrain molecular gas properties in Section 4 and conclude in Section 5. In the extensive appendices, we provide more in-depth analysis concerning extragalactic spectral line identification with ALMA, including the impact of atmospheric (ozone) variability the possibility of spurious broad line detection due to bandpass calibration limitations.
Throughout, we assume a standard CDM cosmology with km s-1 Mpc-1 along with and (Planck Collaboration et al., 2016). We adopt a distance modulus mag for M87 from surface brightness fluctuation methods (corresponding to a luminosity distance Mpc; J. P. Blakeslee et al., 2009). After correcting the observed redshift for infall towards the Virgo cluster (; J. R. Mould et al., 2000), this results in an angular size scale of 80.5 pc arcsec-1. When comparing to the literature, we corrected measurements (or upper limits) to this . We employed the optical velocity definition and referenced kinematic quantities in the barycentric frame by default.
2 Data
2.1 Optical Imaging
To create integration regions for this ALMA CO line search, we employed pipeline-calibrated HST images retrieved from the Mikulski Archive for Space Telescopes (DOI: http://dx.doi.org/10.17909/wmbg-9051 (catalog 10.17909/wmbg-9051)). To isolate dust features, we used drizzled Wide Field Camera 3 (WFC3/UVIS; L. Dressel, 2022) F475W imaging from program GO-14256 (PI: Biretta). To map out filamentary H+[N II] emission, we used a series of Advanced Camera for Surveys (ACS; J. E. Ryon, 2022) F660N polarized images from program GO-12271 (PI: Sparks) that we aligned before combining into a single Stokes image. In each case, we modeled and subtracted the stellar continuum using a concentric Multi-Gaussian Expansion (MGE; E. Emsellem et al., 1994) using GALFIT (C. Y. Peng et al., 2002). Following J. R. Davidson et al. (2024), we iteratively expanded a pixel mask containing non-stellar features (gas and dust, the optical jet, and central AGN) to avoid contaminating the stellar fit. Figure 1 shows the final gas emission and dust absorption maps. In Section 3.1, we describe the regions created for the CO emission-line search.
2.2 Archival ALMA Imaging
We obtained archival ALMA 12-m imaging from eleven single-pointing data sets taken between 2013 December 1 and 2018 September 25 whose phase centers coincided with the M87 nucleus (see Appendix A and Table A3 for additional details). In this nearly five-year window, one semipass program (2016.1.000415.S; PI: Marti-Vidal) was not included due to pipeline calibration difficulties arising from changing polarization calibrators between Execution Blocks (EBs; for the continuum analyis, see C. Goddi et al., 2021). Another program (2013.1.00862.S; PI: Simionescu) was centered 40″ south-east of the nucleus to image CO(21) in a dust and gas complex (hereafter the SE cloud; A. Simionescu et al., 2018), and the field of view does not cover the M87 nucleus.
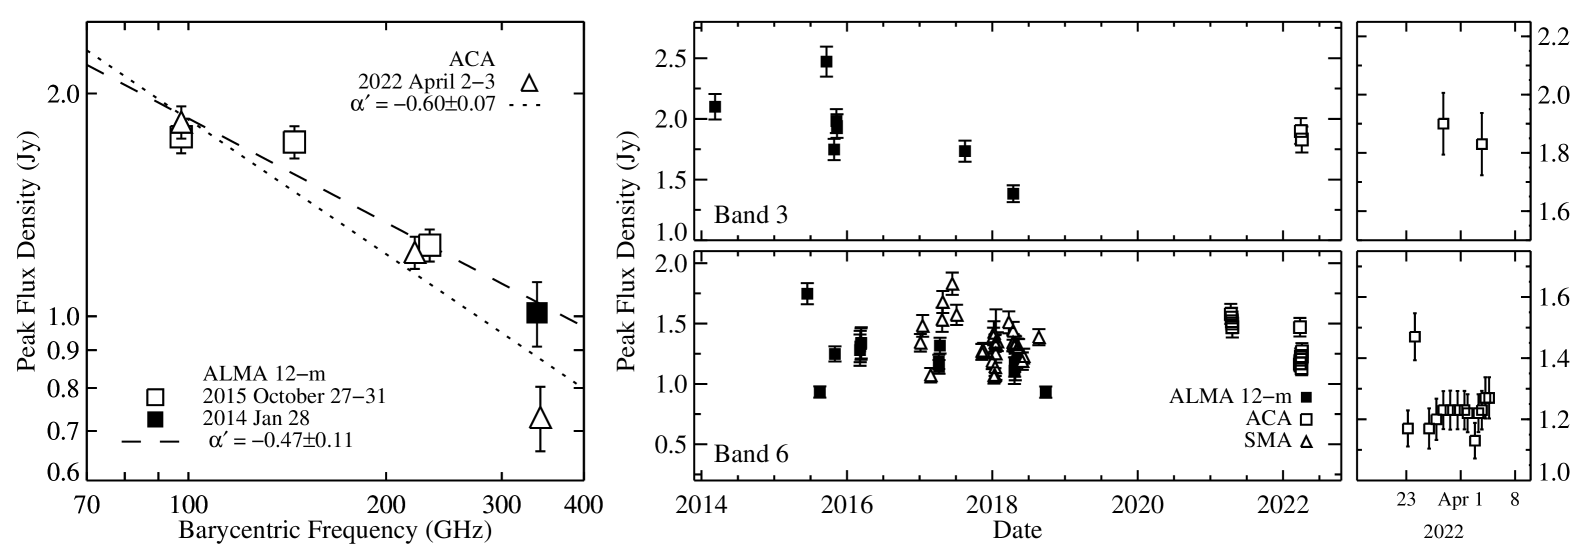
We also retrieved and analyzed ALMA Compact Array (ACA) 7-m observations in programs 2019.1.00807.S and 2021.1.01398.S. Due to large average FWHM of the synthesized beam and poorer limiting sensitivity compared to the ALMA 12-m data, these 7-m observations are only used for an analysis of the peak SED and to construct a light curve of the bright nucleus. We briefly discuss the ACA data sets, their calibration processes, and results in Appendix B.
2.2.1 ALMA Data Properties
The majority of the programs listed in Table A3 were explicitly designed to probe nuclear continuum properties, although not all of these programs were obtained in time division mode (TDM). These heterogeneous data cover Bands 3, 4, 6, and 7 with ranging from 003 to 23. The chosen spectral setups resulted in spectral resolutions from 1 to 63 MHz (after online Hanning smoothing). Both TDM-only and frequency division mode (FDM) data included dual and full polarization setups. For continuum-focused programs, a few redshifted atomic or molecular transitions (including low- CO) coincidentally lie within the spectral ranges, albeit at coarse spectral resolution (20–100 km s-1) at the native binning. Primary spectral windows (spws) for CO-line focused programs typically have velocity resolutions of 1–3 km s-1. Calibrator observations of M87 were not included due to generally short integrations (10 s to a few min; e.g., see also A. Doi et al., 2013).

2.2.2 Calibration Processes
In general, we applied standard pipeline calibrations to the 12-m data using the appropriate Common Astronomy Software Application (CASA; J. P. McMullin et al., 2007) pipeline version for each data set in order to construct Measurement Sets (MSs). Below, we discuss limited improvements to the standard pipeline calibration processes. Appendix C and E.3 contain additional discussion of the bandpass calibration.
In adjacent or overlapping spws, peak continuum spectra show mismatches at the 1–3% level, which is roughly consistent with relative flux calibration errors (L. Francis et al., 2020a). For projects 2015.1.00030.S and 2016.1.00021.S, these slight discrepancies complicated the -plane continuum subtraction for channel ranges with overlapping spws, so we manually re-scaled their flux calibrator fluxdensity Stokes levels in the setjy task for individual spws by up to 2% to ensure more continuous flux densities in image-plane spectral cubes. Residual mismatches at the 0.1% level impacted the search for very broad absorption or emission (see Figure 8 and Appendix E.2).
We applied phase (and usually amplitude) self-calibration with final solution intervals that were per integration (per scan). In two cases, amplitude self-calibration was not adopted when the multi-frequency synthesis (MFS) image peak/rms dynamic range (DR) decreased noticeably compared to the corresponding phase-only products. DRs spanned several hundred up to 9000 and the highest obtained in Band 3 far exceeded the more typical 100 without improved phase solutions (A. M. S. Richards et al., 2022; G. Privon et al., 2024). For certain other ALMA programs with bright continuum sources, higher DRs have been achieved with more careful, per-scan analysis (e.g., S. Komugi et al., 2022), especially when using brighter bandpass calibrators. The CO data have spectral dynamical ranges (SDRs) that exceed 2000 per native (unbinned) channel in Band 3, although the bandpass stability limit imposes an effective SDR limit over large frequency ranges (see Appendix E.3).
Three programs (2016.1.01154.V, 2017.1.00841.V, and 2017.1.00842.V) were obtained as a part of EHT+ALMA VLBI campaigns and most of their MSs coincidentally cover the redshifted CO(21) line. From the ALMA archive, the available .V datasets only contain columns and calibration tables pertaining to the phased (APP) observing mode. As is shown in Figure 8, APP-mode spectra show a characteristic scalloping pattern due to sets of 16 native channels (with individual binning MHz) being used for coarse frequency-dependent phase solutions. We adopted the APP-mode results since other projects covered redshifted CO(21) and because reconstructing the ALMA interferometric-mode calibration tables is beyond the scope of this archival project (for a guide, see C. Goddi et al., 2019). Without interferometric-mode calibration tables, phase self-calibration is not possible, and the peak (core) flux densities reported in Table A3 are lower by about 30% (EHT MWL Science Working Group et al., 2021, 2024). The scalloping spectral behavior prevents their inclusion in studies of broader line features ( km s-1), although some .V program data do reveal narrow absorption near redshifted .
2.2.3 Manual Flagging
For dual polarization data obtained during ALMA Early Science, or for full polarization data when that was still a non-standard observing mode, calibration scripts from the archive often included manual flagging of the science target as well as the flux and bandpass calibrators. We manually flagged a limited number of additional visibilities based on high antenna temperature, amplitude disagreement, and poor bandpass calibration near spw edges. For the MS from member Observing Unit Set A001/X12f/X20f (hereafter X20f and likewise for other member OUS), the pipeline script manually flagged a moderately strong and variable atmospheric line in the bandpass calibrator as extragalactic in origin. This introduced a spurious and deep absorption feature in the peak continuum spectrum of M87 that was coincidentally very close to redshifted . Removing these manually-flagged channels, re-calibrating the raw visibilities, and re-imaging the MS resulted in more consistent spectral behavior. Appendix D contains more discussion about atmospheric line identification and variability.
2.2.4 MFS and Spectral Imaging
As a part of the self-calibration loops, we imaged each MS into a Stokes MFS map using Briggs weighting (with robust parameter ; D. S. Briggs, 1995) in the CASA tclean deconvolution process. This weighting approach balanced sensitivity and angular resolution considerations. Imaging results are given in Table A3 while Figure 2 shows MFS imaging for a representative sample of this archival project. Additional MFS imaging details and brief continuum analysis are found in Appendices A and B. A more detailed analysis of the nuclear and extended continuum properties is beyond the scope of this paper but is covered in recent ALMA studies of the inner accretion flow and jet behavior (e.g., R.-S. Lu et al., 2023) as well as core and jet polarization (e.g., C. Goddi et al., 2021; EHT Collaboration et al., 2021b, a; EHT MWL Science Working Group et al., 2021). Recent radio interferometric and VLBI studies have revealed detailed jet motion and internal structure (e.g., K. Hada et al., 2016, 2017; K. Hada, 2017; A. Pasetto et al., 2021).
High spectral resolution ALMA imaging of AGN have also revealed both Galactic and extragalactic narrow molecular absorption lines (with typical FWHM km s-1; e.g., A. Klitsch et al., 2019; T. Rose et al., 2019a). To that end, we first imaged each spw (or set of overlapping spws) using tclean with Briggs () weighting at the native channel binning given in Table A3, resulting in 72 continuum-dominated spectral cubes with a common restoring beam for each spectral setup. Peak flux densities are plotted in Figure 8 across all unflagged frequencies for the entire sample. Absolute flux calibration uncertainties for MFS images and spectral cubes is about 5% in Band 3 and 10% in Bands 6 and 7 (E. Fomalont et al., 2014; L. Francis et al., 2020a; G. Privon et al., 2024). For most spws in the archival sample, channels are coarsely binned ( km s-1). Only four projects (2012.1.00661.S, 2013.1.00073.S, 2015.1.00030.S, and 2016.1.00021.S) have sufficiently fine FDM channels ( km s-1) to enable detection of narrow molecular lines.
Lastly, we subtracted the continuum for MSs containing CO transitions using the uvcontsub task (with fitorder = 1) with three distinct fitting regions. In the first and second cases, we excluded channels corresponding to either km s-1 to probe more standard velocity ranges for extragalactic gas or 1000 km s-1 for higher-amplitude rotation or outflow scenarios. Given the truncated CO(32) velocity coverage in program 2012.1.00661.S, for the second case we only excluded the range km s-1 when subtracting the Band 7 continuum. In a third case for CO(10) only, we excluded the ranges km s-1 to test for possible broad emission-line features that may originate from a pc-scale molecular CND. In this final case, including channels where km s-1 helped to anchor the continuum subtraction as the integrated emission is minimal near (e.g., B. D. Boizelle et al., 2017; M. D. Smith et al., 2021). We imaged the continuum-subtracted data into spectral cubes at both the native frequency spacing and at more coarse binning (2040 km s-1) to increase the signal-to-noise ratio (S/N). In Sections 3 and 4, we explore relatively narrow emission and absorption-line results derived using the first uvcontsub case. In Appendix E, we explore the second and third uvcontsub cases that produce very faint (and likely spurious) spectral deficits or excesses near redshifted CO transitions.
3 Spectral Line Properties
Here, we focus on a spectral line search for extragalactic CO near the redshift of M87. ALMA spectra extracted against and around the M87 nucleus are remarkably featureless, confirming previous mm-wavelength studies in finding no strong extragalactic molecular lines in the inner 20″ (1.6 kpc; e.g., J. Braine & T. Wiklind, 1993; J. C. Tan et al., 2008). Integrated line profiles and peak continuum spectra in spws covering redshifted CO result primarily in upper limits and low CO opacities. Additional dense gas tracers (e.g., SiO, CS, and HCN) are covered in certain data sets, but because of the expected low relative abundance of isotopologues or more exotic molecules (A. Crocker et al., 2012) and spectral setups without sufficiently fine FDM binning, these ALMA data do not allow for a broader line search. The ALMA 12-m spectra also show no evidence for Galactic CO(10) emission or absorption more directly about the M87 nucleus, even in spectra with binning MHz that could resolve narrow Galactic lines (whose line FWHM are often 10 km s-1; R. D. Davies & E. R. Cummings, 1975; M. R. Rugel et al., 2018).
A detailed mm/sub-mm line search is somewhat complicated by atmospheric lines that were not fully removed during calibration (J. Shangguan et al., 2020). The residual impact is typically over a narrow frequency range and at the percent level or less, but it does affect extragalactic CO(21) detection for M87. In Appendix D, we employ atmospheric transmission models to confirm the location and strength of telluric lines to avoid missing or misclassifying extragalactic lines.
3.1 CO Emission-line Constraints
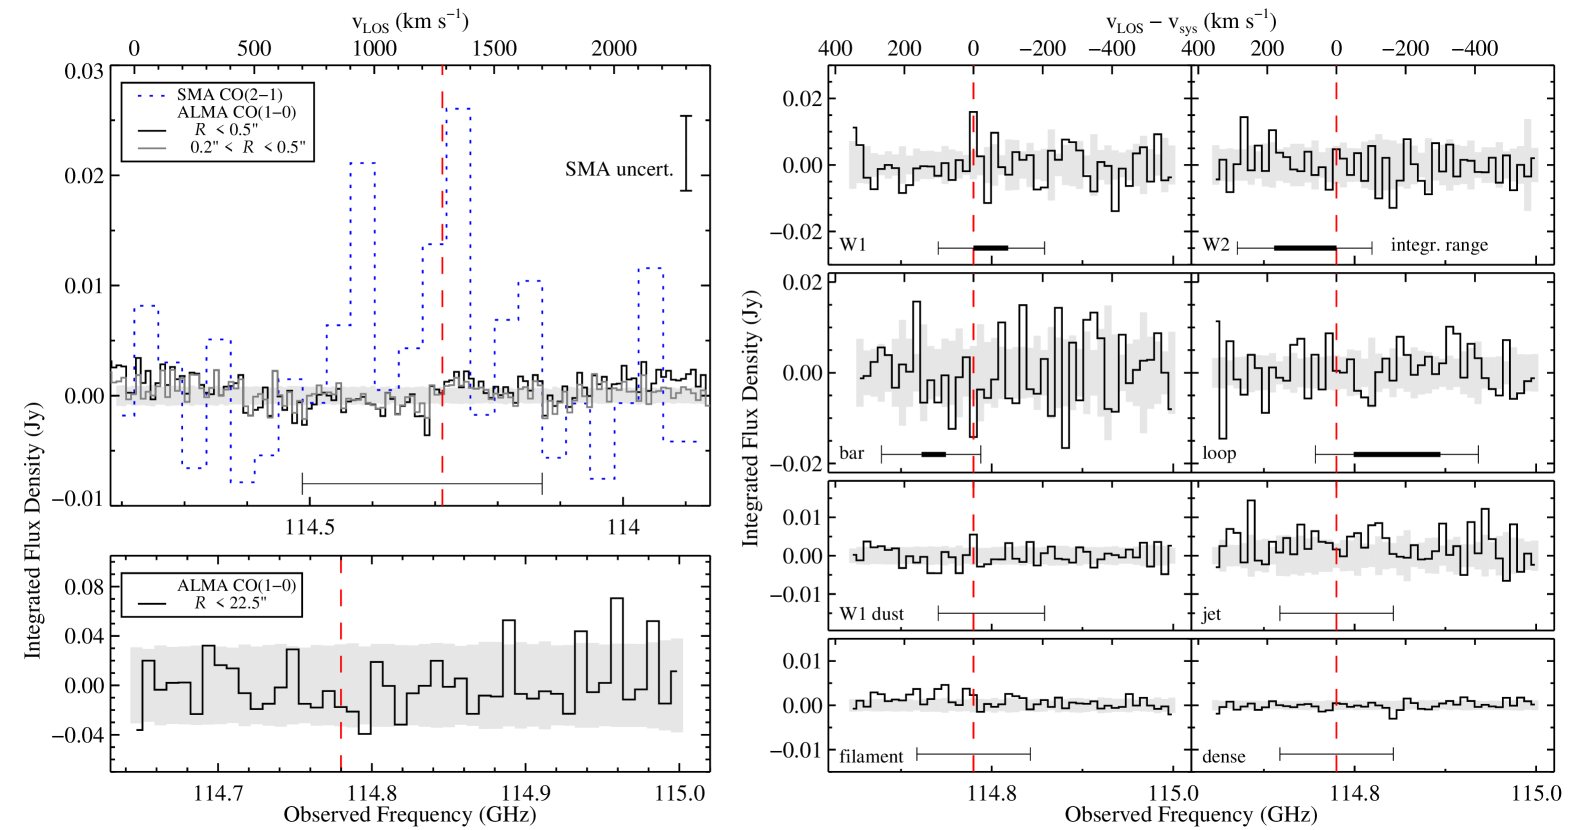
For any detectable molecular gas accompanying the CND or individual filamentary features, we expected CO emission line speeds to be similar to those of the cospatial atomic gas. Within the CND, atomic gas speeds reach about km s-1. For filamentary structures out to a couple kpc, the gas speeds span 400 km s-1 (A. Boselli et al., 2019; J. Osorno et al., 2023). To conduct an efficient emission-line search within M87, we extracted profiles from the X5 and Xa1 spectral cubes that excluded channels with km s-1 in the continuum subtraction. Visibilities were imaged into 20 km s-1 channels to better match the observed CO widths of other resolved cloud structures (e.g., the SE cloud; A. Simionescu et al., 2018).
| Region | Area | rms | Peak | Peak Excess | Range | min, max() | Range Excess |
|---|---|---|---|---|---|---|---|
| Name | () | (mJy) | (GHz) | (Jy km s-1) | (GHz) | (km s-1) | (Jy km s-1) |
| (1) | (2) | (3) | (4) | (5) | (6) | (7) | (8) |
| Atomic Gas Regions | |||||||
| W1 | 433.5 | 4.85 | 114.780 | 0.380 (0.113) | 0.414 | ||
| W2 | 515.2 | 5.60 | 114.678 | 0.295 (0.109) | 0.639 (0.519) | ||
| bar | 595.5 | 7.57 | 114.834 | 0.383 (0.129) | 0.633 | ||
| loop | 253.3 | 4.46 | 114.741 | 0.230 (0.073) | 0.883 (0.464) | ||
| jet | 150.0 | 4.23 | 114.827 | 0.276 (0.105) | 1.193 (0.355) | ||
| Dust Regions | |||||||
| W1 dust | 45.9 | 2.32 | 0.191 | ||||
| filament | 20.9 | 1.44 | 0.502 (0.123) | ||||
| dense | 10.1 | 1.00 | 0.085 | ||||
| Nuclear Regions | |||||||
| nucleus | 12.9 | 0.69 | 0.109 | ||||
| annulus | 10.8 | 0.68 | 0.085 | ||||
Note. — Tentative CO(10) emission (or upper limits) near the center of M87 from the Xa1 spectral cube with 20 km s-1 binning and typical rms mJy beam-1 per channel. Regions listed in col. (1) are shown in Figure 1 with corresponding beam-unit areas in col. (2). Col. (3) is the average rms per channel within each integration region. Cols. (4) and (5) give frequencies and integrated fluxes for the single channel with the highest flux density (S/N ) in each region. Cols. (6) and (7) give the frequency ranges and velocity endpoints corresponding to 100 km s-1 from the observed spread of atomic gas in each region or 150 km s-1 about for the dust-dominated regions. Col. (8) reports the possible CO fluxes (or upper limits) in these regions. Note that the peak excess in the integrated CO profile in Figure 3 does not always fall within the velocity integration ranges. Estimated 1 uncertainties were calculated by MC resampling of the background noise using the same region shapes.
In Figure 1, we trace broad regions of diffuse ionized atomic gas emission and higher H/H decrement (W1, W2, bar, and loop regions; W. B. Sparks et al., 2004; J. Osorno et al., 2023) as well as more compact regions that cover higher dust opacities (south of the nucleus and in a filament in atomic emission-line region W1; T. R. Taylor et al., 2020). A final region in the jet (covering clumps A, B, and C; Figure 2) explores the higher-pressure, shocked ISM (G. V. Bicknell & M. C. Begelman, 1996). From the F475W residual image, the dense dusty clump has an estimated intrinsic (deconvolved) width of 30 pc while the neighboring dusty filaments (and those in the W1 and loop regions) appear to have intrinsic diameters ranging from 10 pc down to perhaps just 12 pc. Another dusty filament appears to span from the dense cloud to the west side of the loop region and comes close to the nucleus ( separation; EHT MWL Science Working Group et al., 2024).
In Figure 3 and Table 1, we present integrated CO(10) line profiles and fluxes for the intermediate resolution Xa1 data set (). These line profiles reveal no unambiguous CO emission in any region, and the higher-resolution X5 data yields poorer constraints due to the larger number of beams in each integration area. Where there is cospatial atomic gas seen in the F660N filter, we integrated line profiles over the range of atomic gas observed in (or around) these regions with an additional 100 km s-1 buffer. In dust-dominated regions seen primarily in the F475W filter, line profiles were integrated over a 300 km s-1 range centered on . To encompass the entire atomic gas CND, we integrated over a circular aperture with a radius (40 pc). An additional annulus integration between avoided larger nuclear residuals while still including most of the observed ionized gas emission (J. Osorno et al., 2023). For comparison, we include the central SMA CO line profile, recovered from J. C. Tan et al. (2008) using PlotDigitizer111https://plotdigitizer.com.
To estimate uncertainties, we followed a Monte Carlo (MC) resampling technique that iteratively shifted each region by a random amount before re-integrating (without overlapping any defined regions; B. D. Boizelle et al., 2017). After 200 iterations, we adopted the standard deviation of the “blank” flux densities in each channel as a good proxy for the true uncertainty spectrum (for a more comprehensive approach, see T. Tsukui et al., 2023). In some cases, the spread in “blank” flux densities is slightly higher (by at most 10%) due to the impact of the primary beam correction further from the ALMA phase center, but this does not materially affect the analysis.
Based on the estimated noise spectra, the highest S/N candidate for CO emission is in the outer jet feature with an integrated Jy km s-1 that barely exceeds the 3 threshold. However, a channel-by-channel inspection of the integration over the velocity range shows no clear features. The dust filament and loop regions show positive features near at a 2–3 confidence, but the bulk of the signal being contained in 12 channels is not altogether convincing. Channel inspection did not reveal any likely discrete sources at the corresponding velocities (or elsewhere). A global CO(10) line profile integrated over the inner 2 kpc returns only an upper limit Jy km s-1 over the entire 500 km s-1 range.
The nuclear and annulus spectra also show no support for CO(10) emission. From typical rms uncertainties of 0.68 mJy beam-1 in a 20 km s-1 channel, we estimated nuclear Jy km s-1 (1 uncertainty) in a broad km s-1 range to match the extraction region and velocity range of the previous SMA CO(21) study (J. C. Tan et al., 2008). The annulus region spectrum is better behaved than the composite nuclear spectrum, which shows excesses at large velocity offsets ( km s-1) due to higher continuum residuals directly at the nucleus location. In Appendix E, we discuss the anomalous spectral behavior when excluding an even broader channel range in the uvcontsub process.
3.2 CO Absorption-line Properties
Despite the lack of any CO detection in emission, close inspection of the peak continuum spectra in Figure 4 reveals CO(10), CO(21), and CO(32) absorption features across 6 data sets with blueshifts corresponding to km s-1. Only one CO spw with narrow MHz from the X1b0 data set returns a non-detection. Its more complicated spectral response shown in Figure 8 is ameliorated by using just the lowest-rms data from the second EB. However, the more selective spectrum still appears featureless (see Figure 4) due to a sensitivity limit that exceeds the expected peak opacity in the common spectral definition:
| (1) |
Here, the peak continuum spectrum is measured in K units and is the fitted linear continuum level about the CO line feature. For the most confident cases, the measured values are much lower than for CO absorption lines observed in other ETGs (typically but it may approach unity; B. D. Boizelle et al., 2017; I. Ruffa et al., 2019; A. Klitsch et al., 2019; T. Rose et al., 2019a, b, 2020; S. Kameno et al., 2020). No other potential extragalactic CO or dense gas absorption lines are seen at a consistent across multiple data sets or transitions, including at the same km s-1 for the atomic-gas absorber.
From these opacity spectra, we also calculated upper limits of the integrated line opacity
| (2) |
for CO absorption in km s-1 units. Across these three transitions, the km s-1 range (with a median ) are very low and better match the bottom end of the distribution for diffuse Galactic clouds (e.g., H. S. Liszt & R. Lucas, 1998; H. S. Liszt & J. Pety, 2012; H. Liszt et al., 2019).
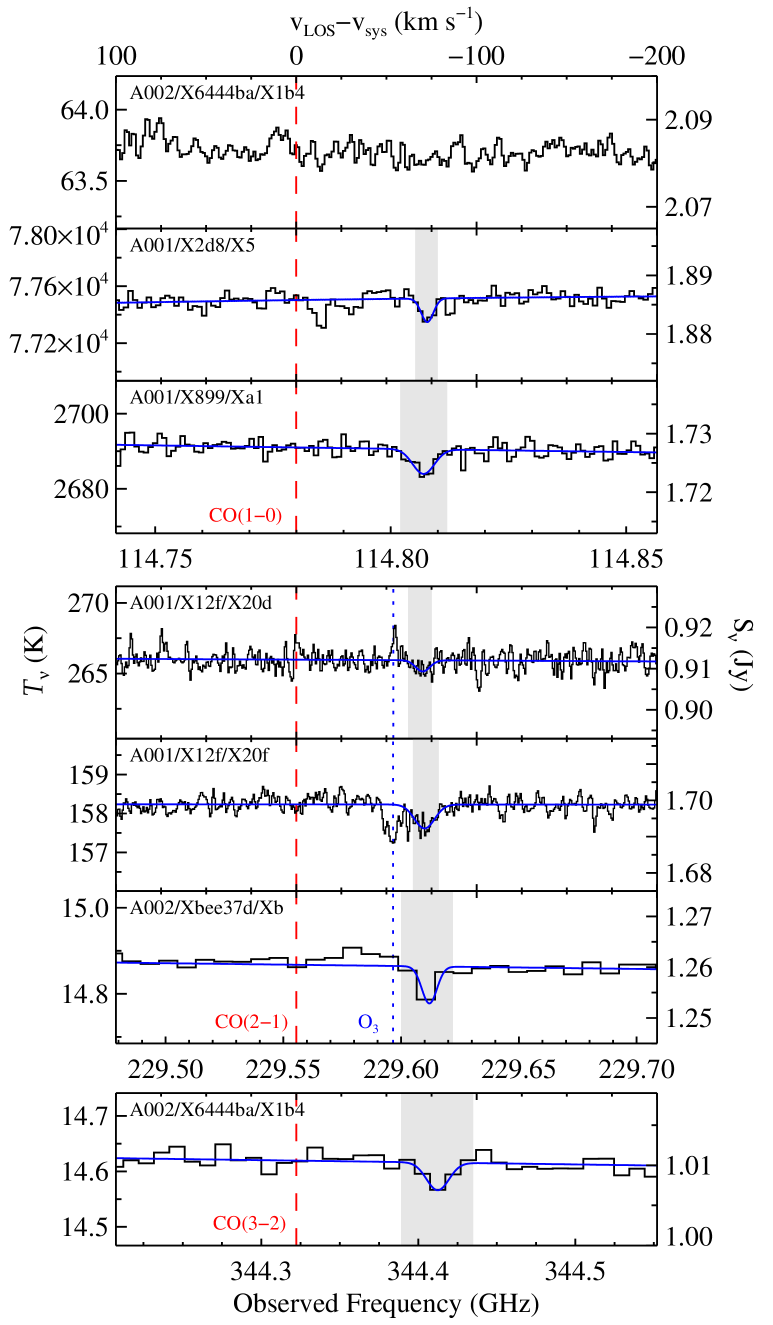
CO(21) absorption lines are detected less confidently than are CO(10), with an extreme case from the X20d data that only partially detects with S/N . What is measured may be 2030% lower due to difficulty in fully removing the neighboring ozone line contamination (see Appendix D). Two APP-mode programs cover the redshifted CO(21) frequency, but these peak spectra display frequency-dependent fluctuations due to phasing all elements together into a single array. Some of the .V program spectra appear to show CO(21) absorption, but we only utilize spectral fits to the most regular Xb data set from program 2016.1.01154.V when calculating CO absorber properties.
| Member | rms | ||||||
|---|---|---|---|---|---|---|---|
| OUS | (mJy beam-1) | (GHz) | (km s-1) | (MHz) | (km s-1) | (km s-1) | |
| (1) | (2) | (3) | (4) | (5) | (6) | (7) | (8) |
| CO(10) | |||||||
| A002/X6444ba/X1b0 | 2.61 | ||||||
| A001/X2d8/X5 | 0.91 | 114.808 (0.000287) | 78.45 (0.75) | 1.204 (0.317) | 3.13 (0.82) | 0.002286 (0.000785) | 0.0220 (0.0059) |
| A001/X899/Xa1 | 1.15 | 114.807 (0.000468) | 76.38 (1.22) | 2.275 (0.526) | 5.92 (1.37) | 0.002483 (0.000735) | 0.0361 (0.0068) |
| CO(21) | |||||||
| A001/X12f/X20d | 2.38 | 229.609 (0.001600) | 75.29 (2.08) | 3.012 (1.977) | 3.92 (2.57) | 0.002989 (0.002185) | 0.0325 (0.0078) |
| A001/X12f/X20f | 1.89 | 229.610 (0.000533) | 76.31 (0.69) | 4.259 (0.527) | 5.54 (0.69) | 0.003904 (0.000677) | 0.0438 (0.0053) |
| A002/Xbee37d/Xb | 0.85 | 229.612 (0.001210) | 78.94 (1.57) | 3.211 (1.340) | 4.18 (1.73) | 0.005798 (0.003290) | 0.0461 (0.0109) |
| CO(32) | |||||||
| A002/X6444ba/X1b4 | 0.95 | 344.412 (0.003276) | 83.58 (2.84) | 7.119 (3.592) | 6.17 (3.11) | 0.003418 (0.002263) | 0.0574 (0.0174) |
Note. — CO absorption-line properties measured from the M87 peak continuum spectra. Col. (2) gives the typical rms noise per channel. Cols. (3) to (6) are best-fit velocity and line width parameter values from Gaussian fitting with the values being intrinsic widths before any online Hanning smoothing. Cols. (7) and (8) report the peak and integrated CO opacities after continuum fitting and normalization. Uncertainties in these fitted Gaussian parameters and opacities (in parentheses) were estimated using a Monte Carlo resampling technique.
To better characterize these line properties, we fit each CO absorption feature with a Gaussian line profile and a linear continuum to recover the line centroid (, ), line width (), and peak opacity (). For results, see Figure 4 and Table 2). These fits incorporated Hanning smoothing222In frequency space, Hanning smoothing operates as a convolution of the FDM data before on-line channel averaging. The triangular kernel consists of three channels with a central and side amplitude of 0.50 and 0.25, respectively. Native frequency binning is found in Table A3 and finely-binned FDM data have frequency resolutions up to 2 larger due to Hanning smoothing. For those with the narrowest MHz, the intrinsic line widths are 7% lower than the blurred values; for those with MHz, there is no change. to recover intrinsic . We estimated parameter uncertainties by an MC resampling technique that adds random noise to the best-fitting model spectrum before refitting. The noise was drawn from a normal distribution with a standard deviation equal to that of line-free portions of each spectrum. During this process, we also explored channelization effects by randomly shifting the bin centers by a uniform fraction of a channel width when constructing the model spectrum. These frequency shifts were also drawn from a normal distribution with standard deviation equal to a quarter of the corresponding value in Table A3. This final step helps to provide more realistic line width uncertainties in cases where the measured width . Incorporating Hanning smoothing also better accounts for correlated spectral noise, although it cannot explain apparently coherent spectra features over frequency ranges 3 (e.g., see the X5 spectrum in Figure 4). Broader uncertainties on were also determined in this way. We note that bandpass calibration limitations are liable to introduce larger pattern noise (at the 0.1% level and within the model fitting region), creating low-level structure in the spectral response that is not represented in the linear fit. This appears most clearly in the CO(32) spectrum (see Figure 8). However, we do not attempt to quantify bandpass calibration effects on and values.
The ratio of centroid frequencies (or weighted-average when multiple observations exist) are broadly consistent with expectations using standard error propagation:
Deviations from the expected zero values are likely due to low-S/N CO(21) detection and an anomalously high value. We note that including the APP-mode value in Table 2 when calculating does not contribute appreciably to the measured offset from zero. In velocity units, these fits give consistent (intrinsic) line widths of 36 km s-1 and typical to 79 km s-1, although the CO(32) feature has a more blueshifted central velocity that is discrepant by 3 from the weighted-average CO(10) and CO(21) centroid values.
For use later when constraining molecular gas properties, we also constructed final weighted-average peak opacities and . If ignoring the APP-mode results from the Xb data set, only changes by 2%. The integrated opacity km s-1 is moderately lower than measured for while the latter is formally consistent with km s-1.
The core continuum source at the center of M87 is very compact, with the brightest component having a radial size of 25 as (0.002 pc; EHT Collaboration et al., 2019) that is expected to probe a very narrow line of sight through the CO absorber. At high resolution (e.g., V. A. Acciari et al., 2009), this very compact core brightness may account for only 2545% of the integrated flux density that remains unresolved in these ALMA data after extrapolating the synchrotron core and jet behavior from 3.5 mm (with spectral index for ; see Figure 7 and R.-S. Lu et al., 2023). As discussed in Appendix A.1, the next brightest compact synchrotron source (the N2 clump) lies 2 pc in projection from the nucleus with an integrated mm-wavelength core-to-N2 flux density ratio of 25. On smaller scales at radio wavelengths, the synchrotron jet core-to-jet flux density ratio approaches 100 (e.g., C. C. Cheung et al., 2007; R. C. Walker et al., 2018).
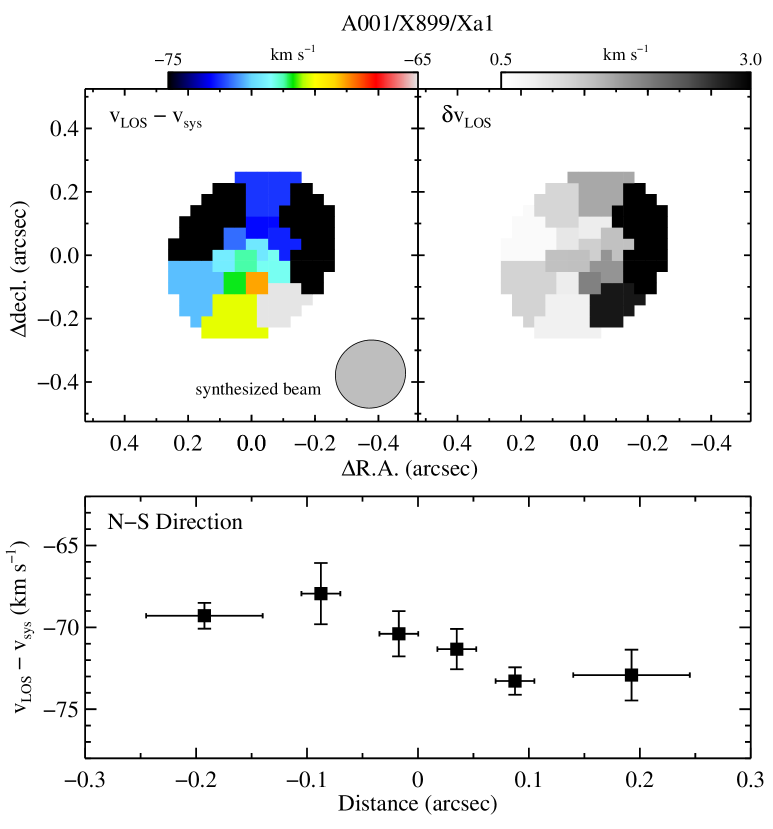
The question is whether the continuum emission from the approaching synchrotron jet emission (oriented at a from the core) probes sufficiently distinct lines of sight through the absorbing cloud to be sensitive to a possible velocity gradient. We attempted to answer this by refitting the CO(10) detection from the Xa1 data across the central beam area ( or 15 pc). Spectra in adjacent spatial pixels were combined together using Voronoi tessellation (M. Cappellari & Y. Copin, 2003) prior to refitting to achieve roughly uniform continuum S/N per bin. Figure 4 shows the velocity gradient to be no more than 3 km s-1 across 10 pc, with the putative gradient being oriented in a mostly N–S direction. Individual uncertainties were estimated using the same MC resampling approach. The other CO(10) continuum cube from the X5 data set had much higher angular resolution but insufficient S/N in binned spectra to measure opacities within the central beam areas.
3.3 Temperature and Column Densities
The relative level occupation defines an excitation temperature for two different transitions. Given the higher confidence in the lower- , we first solved column density equations that relate integrated CO(21) and CO(10) opacities with a common (B. Godard et al., 2010; T. Rose et al., 2019a) by
| (3) |
A similar equation relates a common for adjacent CO(32) and CO(21) transitions. Here, is the upper-level degeneracy for that radiative transition and is the corresponding Einstein coefficient for spontaneous decay333Obtained from Splatalogue: https://splatalogue.online/#/advanced. This assumes a single-zone system in local thermodynamic equilibrium (LTE) where adjacent transitions (e.g., and ) originate under the same conditions. We have ignored beam filling factors and also considered the impact of the CMB background to be negligible at this redshift and for the measured and values. Individual have lower S/N, so we employed weighted average values to recover more confident .
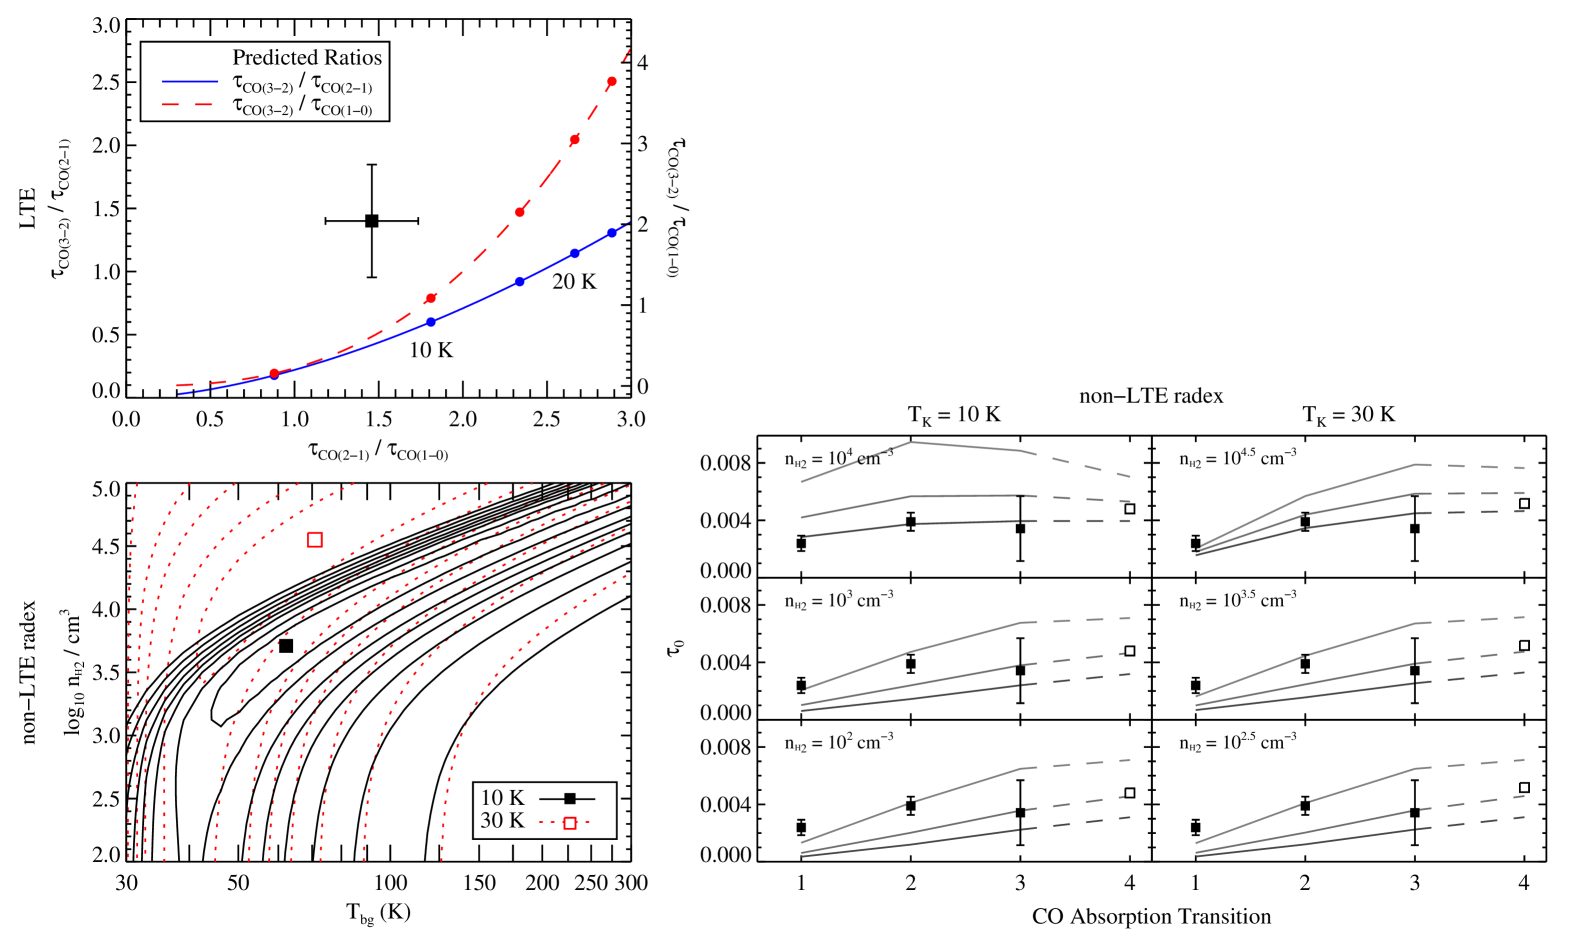
In Figure 5, we compare measured opacity ratios with theoretical values assuming the absorbing medium is in LTE with equivalent . However, the relatively large depth of the CO(32) feature as evidenced by is not consistent with LTE expectations. This may indicate an elevated population, possibly arising from absorption-line contributions by gas in distinct spatial or energetic regions. Unfortunately, neither or values are as reliable as is , and we do not attempt any reconciliation in the LTE framework. In Section 4.2.3, we use radiative transfer modeling to better account for possible deviations from LTE.
To determine a total column density , we primarily considered CO(10) absorption and an excitation temperature for the lowest- transitions:
| (4) |
This relationship assumes detailed balancing and the temperature-dependent 12CO rotational partition function (J. Mangum & Y. Shirley, 2015). Assuming LTE, the kinetic temperature . Here, we used for more confident determination.
We recovered more reliable error bars in a series of trials by drawing individual randomly from normal distributions centered on their measured value with standard deviations equal to their 1 uncertainties in Table 2. After calculating weighted-average opacities at each iteration, we used the best-fit to find a new and . After iterations, we used the 15.9 to 84.1 (0.14 to 99.87) percentile levels of the distribution to find a median K and with 1 (3) error bars. Calculated separately, we find higher median K (1) with cm-2 that are much less confident due to a relatively larger uncertainty.
4 Discussion
4.1 CO Emission
Similar cool-core BCGs frequently host rotation-dominated CNDs and/or extended filaments with CO-derived total molecular gas masses (V. Olivares et al., 2019; J. Baek et al., 2022). CO surveys have found a positive correlation between integrated H luminosity and total for cool-core galaxies (e.g., A. C. Edge, 2001; P. Salomé & F. Combes, 2003; F. A. Pulido et al., 2018). Among these massive elliptical galaxies, M87 has a low but confident444Not all cool-core galaxies host CNDs that could contribute to the global . For M87, atomic CND contributions to the global are only 1.71039 erg s-1 (W. B. Sparks et al., 1993; J. L. Walsh et al., 2013; J. Osorno et al., 2023). erg s-1 that would be consistent with a global . However, previous low- CO observations of M87 placed a much more strict on the nuclear molecular gas using both small and large apertures ( to 23″; P. Salomé & F. Combes, 2008; J. C. Tan et al., 2008) and 108 globally (W. Jaffe, 1987). Similar upper limits from this ALMA CO search suggest that M87 is either a clear outlier in the correlation for cool-core galaxies or that there is much wider scatter in this correlation.
Figure 3 demonstrates that these archival ALMA data do not support any CO emission-line detection from dusty clumps or atomic gas filaments. In the nucleus () we find a limiting Jy km s-1 with a 20% lower value for the annulus region. A standard CO(10)-to-H2 conversion factor pc-2 (K km s-1)-1 (K. M. Sandstrom et al., 2013) results in that is 20 lower than any previous upper limit. Both this limit and the corresponding (deprojected) surface mass density pc-2 averaged over the atomic CND extent are lower than for many CO-detected molecular CNDs in other massive elliptical galaxies (B. D. Boizelle et al., 2017; I. Ruffa et al., 2019; M. D. Smith et al., 2021). Integrated line profiles for the larger-scale W1, W2, bar, and loop regions have individual detection thresholds at the 0.40.6 Jy km s-1 level that translates to . All together, these regions give a total that is similar to a global 4106 limit when using a circular aperture with 2 kpc radius.
In these CO line profiles, the single-channel ( km s-1) excess in the W1 and bar regions and an integrated excess ( km s-1) in the jet region over clumps A–C may hint at CO emission. However, the low estimated S/N and a lack of clear compact or diffuse CO emission at the corresponding locations and frequencies disfavor that interpretation. For broad detection, the only possible candidate is the dust filament found 1525 to the southeast of the nucleus, although the integrated line profile only reaches S/N in the km s-1 range. Again, a channel-by-channel inspection of this region does not show any potential features above the 4rms threshold.
The dense and filament regions adjacent to the nucleus in projection provide some additional constraints on possible CO emission. Assuming close proximity to the M87 midplane, this dust should obscure only half of the stellar light along those lines of sight (for more details, see L. Ferrarese et al., 1996; S. Viaene et al., 2017; B. D. Boizelle et al., 2019). Observed fractional deficits in the F475W data correspond to peak intrinsic mag and 0.250.4 mag for the dense and filamentary regions, respectively (with decreasing by up to half if this dust lies significantly closer to us than the midplane). Since the M87 dust-to-gas ratio is estimated to be close to MW values (W. B. Sparks et al., 1993), an expected (J. A. Cardelli et al., 1989) and standard dust-to-extinction correlations (B. T. Draine et al., 2014) return a peak dust surface mass density pc-2 for the dense cloud. Taking an intrinsic (deconvolved) radius (4 pc) for the obscuration as a proxy for the cloud size and a standard dust-to-gas mass of 0.015 (K. M. Sandstrom et al., 2013), the expected pc-2 and a total is consistent with ALMA CO imaging non-detection. Assuming the same value, the corresponding integrated would be about 60 lower than the upper limit found for the dense dust aperture.
Unfortunately, new ALMA 12-m CO imaging would likely result in CO(10) detection from either the known dusty regions or the CND. To achieve just a 3 improvement in noise (rms mJy beam-1 in a 20 km s-1 channel) over the Xa1 results, the ALMA Observing Tool (OT; K. Immer et al., 2024) suggests a needed on-source (total) time of 8 hrs (12.5 hrs). Further improvement with SDR over a 20 km s-1 channel is likely beyond the current ALMA Band 3 capabilities. Unless the CND molecular gas , future ALMA CO line surveys of M87 will likely not detect any molecular gas in emission.
4.2 CO Absorption
Here, we discuss the properties of extragalactic CO absorption seen against the M87 nucleus. Based on both CO opacities and kinematics, this CO absorption appears more consistent with a narrow filament instead of a gravitationally bound cloud. We place the observed kinematics, density estimates, and temperature in context with circumnuclear gas seen both in absorption and emission in other luminous ETGs.
4.2.1 Kinematics
In other radio galaxies, CO absorption signatures appear to arise from chance alignment of dense CND molecular clouds and the bright nucleus, especially for higher disk inclination angles (e.g., B. D. Boizelle et al., 2017; T. Rose et al., 2019a; I. Ruffa et al., 2019). Absorption-line centroids tend to be close to (within 50 km s-1) as clouds oriented along the disk minor axis have little if any projected motion. The weighted-average km s-1 for the lower- CO transitions are therefore not fully consistent with clouds in low-ellipticity orbits. Also, these ALMA observations provide no convincing support for a molecular phase of the atomic gas disk that is oriented more face-on (; J. Osorno et al., 2023), making disk obscuration implausible.
The primary UV/optical absorption lines that are connected to a central outflow are slightly more blueshifted ( km s-1) and much broader (FWHM km s-1; Z. I. Tsvetanov et al., 1999a; B. M. Sabra et al., 2003) than is the CO absorption. However, these atomic gas velocities were shifted upwards by up to 60 km s-1 to match Galactic atomic absorption-line centroids (e.g., for S I or N II) with the primary H I centroid at km s-1 (R. D. Davies & E. R. Cummings, 1975). Additionally, two faint optical absorption-line systems were reported at and 1300 km s-1 (D. Carter & C. R. Jenkins, 1992; D. Carter et al., 1997). While higher spectral resolution UV/optical data exists (e.g., R. Sankrit et al., 1999), they do not have sufficient sensitivity to better characterize the absorption-line profiles.
At least some of these atomic absorption lines are tied to a central outflow (B. M. Sabra et al., 2003). In AGN winds, velocity centroids and widths for broader absorbers may change significantly on year timescales (J. S. Kaastra et al., 2014). Very narrow absorption-line properties do not typically show intrinsic or variability (i.e., changes above a few km s-1 over several-year timescales; e.g., T. Misawa et al., 2014; C. J. Grier et al., 2016; T. Misawa et al., 2019; T. Rose et al., 2019b), likely due to greater physical distances from the AGN. Another possibility for M87 is that the gaseous absorption arises from a filamentary flow that appears to wrap about the nucleus (W. B. Sparks et al., 1993; J. Osorno et al., 2023). In any case, atomic and molecular absorption-line velocities and line widths would be expected to be more similar if entrained in the same gaseous outflow (M. Margulis & R. L. Snell, 1989).
On kpc scales, cool-core BCGs often host multiple molecular gas clumps and filaments whose gas velocities range between about 200 km s-1 from the BCG rest frame. Outside of strongly rotationally-broadened regions like the nucleus, CO emission FWHM are typically 3060 km s-1 (V. Olivares et al., 2019; J. Baek et al., 2022; S. Ganguly et al., 2023). A good example is Abell 1644-S, whose arching CO emission spans 15 kpc with speeds shifting from about 140 to +30 km s-1 relative to its , possibly connecting down to an atomic gas CND. In the most isolated regions, moderate-resolution CO imaging shows narrow emission-line FWHM km s-1 with minimal velocity gradients (J. Baek et al., 2022), although beam smearing of adjacent clouds likely still appreciably broadens the line intrinsic FWHM. In cool-core BCGs, such patchy and filamentary multi-phase gas structures are typical of chaotic cooling of the galactic and circumgalactic medium that feeds episodic accretion with much higher (e.g., I. V. Babyk et al., 2019; M. Gaspari et al., 2020; T. Pasini et al., 2021).
For M87 specifically, A. Simionescu et al. (2018) used ALMA imaging to map out CO emission from the dense SE molecular cloud that is embedded within a broader filamentary atomic gas complex 40″ from the nucleus with projected km s-1. The SE cloud shows a modest gradient of at least a couple 10 km s-1 across the brightest emission-line clump that extends over a projected 150 pc. At an angular resolution of (average 85 pc), the gas cloud with Jy km s-1 and km s-1 is resolved into a spherical clump with a diameter of 100 pc and km s-1 together with a smaller, filamentary component with a narrower line width. The latter better matches the observed line widths and low velocity gradient from the CO absorption shown in Figure 4. Based on the relative distribution of ionized gas and X-ray emission, those authors argue the SE cloud is falling into M87 from behind, with the observed molecular gas surviving passage through the moderately cool-core X-ray gas in this part of the Virgo cluster (R. Shibata et al., 2001; W. Forman et al., 2007) only to be destroyed at closer radii either by shocks or by relativistic particles associated with the radio lobes.
We first explore the gravitationally bound cloud scenario. Assuming Galactic cloud size-line width correlations apply (Larson’s relations; e.g., P. M. Solomon et al., 1987; R. Shetty et al., 2012; T. Wong et al., 2022), the fitted CO absorption-line km s-1 suggests a radius pc. Infrequently, extragalactic CO imaging resolves emission-line clouds in CNDs (e.g., D. Utomo et al., 2015; E. Rosolowsky et al., 2021) but these studies tend to be sensitive only to more turbulent giant molecular clouds. For other luminous ETGs, gas-dynamical modeling of ALMA CO imaging even suggests higher typical intrinsic turbulent velocity dispersions (515 km s-1; e.g., A. J. Barth et al., 2016; B. D. Boizelle et al., 2019; E. V. North et al., 2019; however, c.f. T. A. Davis et al., 2017). Scaling Larson’s relation to fit these extragalactic clouds could give as low as 5 pc. For a virialized cloud with , the upper size and measured would suggest a gas surface mass density pc-2 that is implausibly high based on CO non-detection discussed in Section 4.1.
More likely, this CO absorption originates in a foreground filament. Simulations suggest that accreting clouds like those composing the SE complex or the dense dusty clump are preferentially drawn into narrow filaments by magnetic fields that thread massive galaxies (e.g., M. Fournier et al., 2024). In Galactic systems, resolved filamentary structures seen in emission have typical line widths 1 km s-1 and narrow core widths pc (wherein the is uniform; e.g., D. Arzoumanian et al., 2011; E. W. Koch & E. W. Rosolowsky, 2015; G. V. Panopoulou et al., 2016; A. Rivera-Ingraham et al., 2016; R. Indebetouw et al., 2020). For the measured , filament size-emission-line width relations would be consistent with an effective pc or more, which is at the very upper limit for Galactic filaments. However, the environment surrounding the M87 nucleus is very different than for MW filaments. We note that within and around radio galaxies, even wider filaments reaching kpc scales have been observed (F. Yusef-Zadeh et al., 2022).
4.2.2 Column Densities and Masses
The estimated cm-2 is below the detection threshold for many extragalactic ALMA programs, although it is reached by certain Galactic line surveys (e.g., H. S. Liszt & R. Lucas, 1998). A standard CO/H2 abundance ratio of (U. J. Sofia et al., 2004; A. D. Bolatto et al., 2013) would result in a very low cm-2. That conversion factor is typically applied to systems with peak cm-2 while such a low better comports with more diffuse Galactic lines of sight that have CO/H2 abundances of 210-6 (H. Liszt et al., 2019) to 810-7 (J. L. Pineda et al., 2010) due to easier CO destruction. These ratios result in our preferred range that matches an estimated total cm-2 towards the M87 nucleus from X-ray spectroscopy (e.g., A. S. Wilson & Y. Yang, 2002; T. Di Matteo et al., 2003). The corresponding pc-2 is far below the 102.3 pc-2 threshold needed to reconcile the measured with a larger ( pc) virialized system. This column density range is also much lower than typical Galactic filament peak (D. Arzoumanian et al., 2011, 2018; V. Könyves et al., 2020) but better matches properties of extragalactic filamentary structures (e.g., R. Sancisi et al., 2008; W. J. G. de Blok et al., 2014). Also, it is consistent with estimated ranges for a filamentary obscurer that matches the intrinsic extinction of the dense and filament regions (see Section 4.1), especially if the nucleus probes a line of sight for that is slightly offset from the peak dust obscuration.
The physical state (, ) of the absorber remains uncertain. For a single cloud centered on the nucleus, this preferred range and a broad pc would correspond to a line-of-sight average cm-3 with a total . For comparison, the more compact SE cloud region has an estimated cm-3. Adopting typical cloud radial density profiles and small core sizes (0.1 pc; e.g., T. Csengeri et al., 2017; P. J. André et al., 2022) relative to the outer pc, the expected central densities of 1001500 cm-3 would be lower than both typical dense gas cores and the CO(10) critical density (as opacity ; N. Z. Scoville, 2013). A compact pc would suggest a line-of-sight cm-3.
Instead, the CO absorption may arise from chance alignment with a filament. By calculating through the center of a Plummer filament model with total above (A. Rivera-Ingraham et al., 2016), the peak H2 densities should reach at least 10002500 cm-3, which is consistent with simulations of filament formation (P. Hennebelle, 2013). If pc, the corresponding linear mass pc-1 would be at the very bottom of the linear mass distribution for Galactic systems associated with star formation (R. Sancisi et al., 2008), although it does match better more diffuse extragalactic filaments associated with accretion (e.g., W. J. G. de Blok et al., 2014). If positioned off-center from the M87 nucleus, such a filament would allow for higher peak and values.
Simulations suggest CO is created (or persists in an equilibrium state) for gas with cm-3 where dust, H2, and line self-shielding prevents CO dissociation (C. Safranek-Shrader et al., 2017), in better agreement with the filament scenario. However, the low cm-2 and estimated mag suggests more limited shielding against interstellar radiation (N. Y. Gnedin & B. T. Draine, 2014). Similar to the SE complex, the CO-absorbing gas may be physically located far from the nucleus and evolving (further) towards atomic gas dominance. The low molecular gas fraction inferred from this range (; T. P. Snow & B. J. McCall, 2006) would make C II and not C I or CO the dominant reservoir of gas-phase carbon (M. Gerin et al., 2024). Far-IR spectroscopy centered about the M87 nucleus does reveal faint [C II] 158 m and [O I] 63 m fine-structure lines (J. R. Brauher et al., 2008), but the 1.7′ aperture diameter (and possible 1′ offset from the nucleus) prevents any clear connection to any specific gaseous structure. Adding neutral atomic gas with an estimated cm-2 pc-2 would lower but likely not enable the gas cloud to be gravitationally bound.
Instead, interactions with the hot interstellar medium or an envelope of warm, partially ionized gas may provide pressure support to the CO absorber. In the first case for an isothermal X-ray-emitting distribution, the lower-bound electron density cm-3 and temperature keV (; W. B. Sparks et al., 2004; W. Forman et al., 2007) give rise to a pressure dynes cm-2. In the second case, warm ionized gas with K and higher cm-3 (H. C. Ford & H. Butcher, 1979) would provide similar external pressure (see also T. M. Heckman et al., 1989). For comparison, the cloud or filament scenarios with their corresponding and a low K results in internal dynes cm-2, leading to pressure confinement of the diffuse molecular gas.

4.2.3 Molecular Gas Sensitivity and Temperature
The measured K is similar to excitation temperatures found for certain extragalactic and diffuse Galactic molecular gas (e.g., H. Liszt & R. Lucas, 2004; J. Roman-Duval et al., 2010). Some massive galaxies have diffuse obscurers with K (F. P. Israel, 1992; J. Lim et al., 2017; T. Rose et al., 2019a, b) while outflow CO line ratios or warmer molecular tracers suggest K and K, respectively (K. M. Dasyra et al., 2016; F. H. Cashman et al., 2021; I. Ruffa et al., 2022). Because of the intense interstellar radiation field and cosmic ray environment, the CO absorber is likely to be out of LTE. Indeed, both the measured and inferred K are elevated over LTE predictions from lower- CO measurements.
To probe more realistic cloud conditions, we employed the one-dimensional non-LTE radiative transfer code radex (G. J. Ferland et al., 1998; F. F. S. van der Tak et al., 2007) to reproduce the observed peak opacities , , and . Radiative transfer modeling typically relies on multiple molecular line tracers and/or isotopologues to probe dense gas conditions. In this case, however, the very low opacity simplifies the analysis and allows 12CO to trace the entire cloud. To be consistent with observations, we adopted cm-2 from LTE measurements and fixed the CO line FWHM km s-1. The level of gas turbulence is not known, but we assumed a cold gas distribution and tested K and 30 K in turn. During radex modeling, we explored cm-3 and background temperature K. In Figure 5, we compare measured and radex model values and present contours over these two variables. These results show strong preference for a very cold K with best-fitting cm-3 and K. While the 1 contours do not close for reasonable and values, they provide cm-3 and K lower limits. A warmer K gives much higher best-fit cm-3 and K with 7 higher ; still, lower-bound parameter limits are similar to the K case. Based on these radex bounds, the current CO absorption-line data appear more consistent with central cm-3 for a thin filament ( pc) instead of a more diffuse filament or spherical cloud.
Additional higher-frequency ALMA 12-m imaging would likely break the degeneracy between and . We tested two cases: one that improved the existing measurement and the other that obtained new Band 8 imaging to detect . In both cases, we assumed that the new peak opacity reached the same fractional precision as the Xa1 measurement (S/N ). In Figure 6, these radex results show closed 1 confidence intervals in both cases, although adding in the CO(43) measurement to the values in Table 2 provides much tighter constraints. In the best case, and could be known to within 0.3 dex and 1020 K, respectively. Using the OT, we estimate these new measurements would require a minimum on-source (total) time of 56 min (112 min) for the Band 7 imaging while for Band 8 the require time would be up to 6.25 hrs (12.1 hrs).
5 Conclusion
We conducted a CO line search of M87 using archival ALMA 12-m imaging, focusing on the CND and the dusty clouds and filaments seen in optical imaging in the inner kpc. Despite the deep ALMA imaging and multiple spws containing redshifted CO transitions, we did not clearly identify any CO emission. Over the atomic gas CND, the upper limit is 20 lower than achieved in previous CO surveys. In other regions containing atomic gas filaments and dust, we placed upper limits of with a global 4106 limit for a circular aperture with kpc. In narrow gaseous regions, potential CO emission-line signatures in extracted line profiles do not arise from compact sources.
During this search, we confidently detected molecular gas in absorption against the bright nucleus in the CO(10), CO(21), and CO(32) transitions. The absorber has very low opacity with average peak and integrated km s-1. Measured opacities are slightly higher values for the higher- absorption lines. Line fitting showed a consistently narrow, slightly blueshifted feature with average km s-1 and km s-1. From multiple low-S/N CO absorption lines we calculated column densities cm-2 and (1 uncertainties) assuming the gas is in a diffuse molecular phase. These molecular absorption features appear inconsistent with blueshifted atomic gas absorption detected in UV/optical spectroscopy at a relative speed of about 130 km s-1 with line FWHM km s-1, and we disfavor interpreting this CO absorber as arising from molecular gas entrained in an outflow.
Instead, the CO absorption-line properties are more consistent with an optically thin ( mag) dusty cloud or filament in a chance alignment with the AGN core, like those seen close in projection to the nucleus. Based on opacity measurements, LTE relations suggest the molecular gas is cold with excitation temperatures K (1) and K, hinting at a population that is elevated over LTE predictions. Non-LTE radiative transfer modeling finds much better agreement with the observed values. The radex output prefers low kinematic temperature K and more dense cm-3, surrounded by a hotter background radiation field with K. This (uniform) estimate better matches expectations for a thin, pressure-confined filament, perhaps viewed slightly offset from the compact core location.
| Obs. | Member | Baselines | MRS | Time | Peak | MFS rms | PWV | Pol. | |||
|---|---|---|---|---|---|---|---|---|---|---|---|
| Date | OUS | (GHz) | (MHz) | (km) | (arcsec) | (hrs) | (Jy) | (mJy beam-1) | (mm) | ||
| (1) | (2) | (3) | (4) | (5) | (6) | (7) | (8) | (9) | (10) | (11) | (12) |
| 2012.1.00661.S (PI: Vlahakis) | |||||||||||
| 99.90101.89 | 15.63 | 0.0150.423 | 12.5 | 1.71 | 2.10 | 1.81 | 1.41 | XX YY | |||
| 2014 | A002/X6444ba | 101.78103.76 | 15.63 | ||||||||
| 7 Mar | /X1b0 | 111.92113.91 | 15.63 | ||||||||
| 113.85115.72 | 0.49 | ||||||||||
| 331.50333.48 | 15.63 | 0.0150.347 | 6.04 | 1.89 | 1.01 | 0.104 | 0.97 | XX YY | |||
| 2014 | A002/X6444ba | 333.30335.29 | 15.63 | ||||||||
| 28 Jan | /X1b4 | 343.41345.28 | 9.77 | 83.7∘ | |||||||
| 345.30347.29 | 15.63 | ||||||||||
| 2013.1.00073.S (PI: Tan) | |||||||||||
| 213.00214.99 | 15.63 | 0.0210.784 | 4.04 | 0.25 | 1.75 | 1.10 | 0.69 | XX YY | |||
| 2015 | A001/X12f | 215.00216.99 | 15.63 | ||||||||
| 14 Jun | /X20f | 228.63230.50 | 0.49 | 47.8∘ | |||||||
| 230.57232.56 | 15.63 | ||||||||||
| 213.00214.99 | 15.63 | 0.0431.574 | 1.88 | 0.50 | 0.93 | 1.99 | 0.74 | XX YY | |||
| 2015 | A001/X12f | 215.00216.99 | 15.63 | ||||||||
| 16 Aug | /X20d | 228.63230.50 | 0.49 | 14.3∘ | |||||||
| 230.57232.56 | 15.63 | ||||||||||
| 2013.1.01022.S (PI: Asada) | |||||||||||
| 89.5191.48 | 31.25 | 0.0412.070 | 23.8 | 3.32 | 2.47 | 0.27 | 1.56 | ||||
| 2015 | A001/X13a | 91.4593.42 | 31.25 | XX XY | |||||||
| 19 Sep | /Xbe | 101.51103.48 | 31.25 | 30.0∘ | YX YY | ||||||
| 103.51105.48 | 31.25 | ||||||||||
| 2015.1.00030.S (PI: Vlahakis) | |||||||||||
| 99.88101.86 | 15.63 | 0.08516.20 | 0.97 | 0.66 | 1.96 | 0.51 | 0.96 | XX YY | |||
| 2015 | A001/X2d8 | 101.87103.86 | 15.63 | ||||||||
| 8 Nov | /X5 | 112.28114.16 | 0.98 | 56.5∘ | |||||||
| 113.85115.72 | 0.98 | ||||||||||
| 2015.1.01170.S (PI: Asada) | |||||||||||
| 89.5091.47 | 31.25 | 0.08516.20 | 0.88 | 2.29 | 1.94 | 0.34 | 1.34 | ||||
| 2015 | A001/X2df | 91.4493.41 | 31.25 | XX XY | |||||||
| 11 Nov | /X135 | 101.50103.47 | 31.25 | 34.8∘ | YX YY | ||||||
| 103.50105.47 | 31.25 | ||||||||||
| 2015.1.01352.S (PI: Doi) | |||||||||||
| 89.5091.48 | 15.63 | 0.25316.20 | 0.90 | 0.034 | 1.75 | 0.69 | 0.97 | XX YY | |||
| 2015 | A001/X2d6 | 91.4393.42 | 15.63 | ||||||||
| 27 Oct | /X2ba | 101.50103.48 | 15.63 | 39.3∘ | |||||||
| 103.50105.48 | 15.63 | ||||||||||
| 136.99138.98 | 15.63 | 0.06815.24 | 0.72 | 0.36 | 1.72 | 0.35 | 1.81 | XX YY | |||
| 2015 | A001/X2d6 | 138.93140.91 | 15.63 | ||||||||
| 31 Oct | /X2be | 148.99150.98 | 15.63 | 37.2∘ | |||||||
| 150.99152.98 | 15.63 | ||||||||||
| 222.99224.98 | 15.63 | 0.06815.24 | 1.34 | 0.22 | 1.25 | 0.47 | 1.24 | XX YY | |||
| 2015 | A001/X2d6 | 224.99226.98 | 15.63 | ||||||||
| 31 Oct | /X2c2 | 238.98240.97 | 15.63 | 35.1∘ | |||||||
| 240.98242.97 | 15.63 | ||||||||||
Note. — Properties of ALMA 12-m interferometric and phased-array (APP; .V) mode data sets that were centered on the M87 nucleus, with the project code and Principle Investigator listed above each synopsis. Cols. (1) and (2) give the UT observation date for each member OUS, respectively, while cols. (3) and (4) give the frequency coverage of each spectral window (spw) along with the associated channel binning. For FDM spws, online Hanning smoothing decreases the effective spectral resolution by a factor of up to two. Unprojected baseline ranges in col. (5) give rise to the corresponding synthesized beam parameters from the final MFS image in col. (6) and the maximum recoverable scale (MRS; adopted from the ALMA Science Archive) in col. (7). Col. (8) reports the on-source integration times, including latencies. Cols. (9) and (10) give the peak continuum flux density and rms of the MFS image at the average frequency for the four spws after applying self-calibration loops, if possible. Col. (11) gives the average precipitable water vapor (PWV; adopted from the ALMA Science Archive) over that time interval. Col. (12) reports the dual (XX YY) or cross-polarization (XY YX) setup.
| Obs. | Member | Baselines | MRS | Time | Peak | MFS rms | PWV | Pol. | |||
|---|---|---|---|---|---|---|---|---|---|---|---|
| Date | OUS | (GHz) | (MHz) | (km) | (arcsec) | (hrs) | (Jy) | (mJy beam-1) | (mm) | ||
| (1) | (2) | (3) | (4) | (5) | (6) | (7) | (8) | (9) | (10) | (11) | (12) |
| 2016.1.00021.S (PI: Vlahakis) | |||||||||||
| 112.00113.99 | 15.63 | 0.0213.64 | 3.16 | 1.59 | 1.73 | 0.37 | 0.57 | XX YY | |||
| 2017 | A001/X899 | 112.62114.49 | 0.98 | ||||||||
| 15 Aug | /Xa1 | 113.85115.72 | 0.98 | 64.8∘ | |||||||
| 114.04115.91 | 0.98 | ||||||||||
| 2016.1.01154.V (PI: EHT Consortium) | |||||||||||
| 212.17214.04 | 7.81 | 0.0150.375 | 12.87 | 1.22 | 1.18 | 1.02 | 0.81 | ||||
| 2017 | A001/X11a7 | 214.17216.04 | 7.81 | XX XY | |||||||
| 5 Apr | /X3a | 226.17228.04 | 7.81 | 82.0∘ | YX YY | ||||||
| 228.17230.04 | 7.81 | ||||||||||
| 212.17214.04 | 7.81 | 0.0150.279 | 9.95 | 0.89 | 1.14 | 0.54 | 0.69 | ||||
| 2017 | A001/X11a7 | 214.17216.04 | 7.81 | XX XY | |||||||
| 6 Apr | /X3c | 226.17228.04 | 7.81 | 76.0∘ | YX YY | ||||||
| 228.17230.04 | 7.81 | ||||||||||
| 212.17214.04 | 7.81 | 0.0150.161 | 12.90 | 1.69 | 1.32 | 1.14 | 1.11 | ||||
| 2017 | A002/Xbee37d | 214.17216.04 | 7.81 | XX XY | |||||||
| 11 Apr | /Xb | 226.17228.04 | 7.81 | 70.5∘ | YX YY | ||||||
| 228.17230.04 | 7.81 | ||||||||||
| 2017.1.00608.S (PI: Marti-Vidal) | |||||||||||
| 211.51213.48 | 31.25 | 0.0151.398 | 3.70 | 0.58 | 0.93 | 1.68 | 0.77 | ||||
| 2018 | A001/X129e | 213.51215.48 | 31.25 | XX XY | |||||||
| 25 Sep | /X1d | 227.51229.48 | 31.25 | 53.1∘ | YX YY | ||||||
| 229.51231.48 | 31.25 | ||||||||||
| 2017.1.00841.V (PI: Doeleman) | |||||||||||
| 212.17214.04 | 7.81 | 0.0150.418 | 7.66 | 1.78 | 0.709 | 2.95 | 2.06 | ||||
| 2018 | A001/X12d1 | 214.17216.04 | 7.81 | XX XY | |||||||
| 20 Apr | /X25 | 226.17228.04 | 7.81 | 46.1∘ | YX YY | ||||||
| 228.17230.04 | 7.81 | ||||||||||
| 212.17214.04 | 7.81 | 0.0150.418 | 7.66 | 1.29 | 0.72 | 3.15 | 2.10 | ||||
| 2018 | A001/X12d1 | 214.17216.04 | 7.81 | XX XY | |||||||
| 21 Apr | /X27 | 226.17228.04 | 7.81 | 40.6∘ | YX YY | ||||||
| 228.17230.04 | 7.81 | ||||||||||
| 212.17214.04 | 7.81 | 0.0150.418 | 7.66 | 1.68 | 0.84 | 2.27 | 2.67 | ||||
| 2018 | A001/X12d1 | 214.17216.04 | 7.81 | XX XY | |||||||
| 24 Apr | /X255 | 226.17228.04 | 7.81 | 11.0∘ | YX YY | ||||||
| 228.17230.04 | 7.81 | ||||||||||
| 2017.1.00842.V (PI: Lu) | |||||||||||
| 85.3487.20 | 7.81 | 0.0150.372 | 19.39 | 1.51 | 1.38 | 0.73 | 2.88 | ||||
| 2018 | A001/X12d0 | 87.3489.20 | 7.81 | XX XY | |||||||
| 14 Apr | /Xe | 97.4099.26 | 7.81 | 4.3∘ | YX YY | ||||||
| 99.34101.20 | 7.81 | ||||||||||
Note. — cont.
Appendix A Continuum Properties
A.1 MFS imaging
Representative ALMA 12-m MFS imaging in Figure 2 have average synthesized beam FWHM ranging from 23 in a more compact configuration to just 32 (24) mas using robust (uniform) weighting of the configuration 8/7 data, which is the most extended ALMA configuration applied to the M87 nucleus to date. In compact configurations, these mm-wavelength images capture the approaching jet and the double radio lobes, albeit with significantly less sensitivity to fainter features observed in traditional radio bands. On the smallest scales, Band 6 data partially resolve the central continuum to reveal a collimated jet that is prominent in both lower-frequency VLBI and HST imaging (e.g., see M. J. Reid et al., 1989; J. A. Biretta et al., 1999; R. C. Walker et al., 2018). Intermediate-resolution data resolve previously identified clumps in the approaching jet, including features A–F and I. At high resolution, Band 6 imaging isolates features M (sometimes referred to as L) and N1 that lie closer to the nucleus. The N2 clump seen in VLBI data is only detected by ALMA as a slight elongation from the core when using uniform weighting. Notably, the highest-resolution ALMA data do not reveal (or are not sufficiently sensitive to detect) diffuse non-thermal emission beyond M that leads into the superluminal HST-1 clump at a distance of 1″ (M. Giroletti et al., 2012; J. Park et al., 2019).
We fit the highest-resolution Band 6 MFS image in the X2c2 data set (with uniform weighting; mas, averaging to 2 pc) using the CASA imfit task. In addition to the nuclear source, this image-plane fit included an additional, offset elliptical Gaussian to characterize the N2 clump that is not fully separate from the nuclear light at this resolution. As is shown in Figure 2, residuals from this two-component model fit do not support any additional sources within the inner 50 mas with a background rms of 0.83 mJy beam-1. The residual noise only marginally improves after uv-plane subtraction of the central point source using the CASA uvmodelfit task. In the image-plane fit, the dominant source is identical to the synthesized beam while the N2 component has observed FWHM axes of 49.518.5 mas, appearing to be resolved only in the jet direction along a . While heavily affected by beam smearing, the N2 component centroid is offset from the nucleus by (R.A.,decl.) = (20.0,+5.3) mas, which is consistent within the formal imfit uncertainties to its location in 22 GHz imaging taken just a few months later (J. Park et al., 2019). The imfit components fitted to the core and the N2 clump have integrated flux densities of 1.220 Jy and 50.3 mJy, respectively, at 232.98 GHz.
A.2 Circumnuclear Dust
These ALMA continuum and spectral data provide additional constraints on heretofore unconfirmed circumnuclear dust. Global SED measurements are dominated by synchrotron emission for m, with the mid-IR nucleus SED showing some limited support for thermal continuum contributions from a small, cold dust distribution ( K with an estimated total circumnuclear mass ; E. S. Perlman et al., 2001, 2007; M. Baes et al., 2010).
We had hoped that high-resolution mm/sub-mm wavelength continuum images would detect and disentangle the Rayleigh-Jeans tail of thermal emission from the synchrotron core and jet. Because the Band 6 imfit residuals shown in Figure 2 have no excess in the inner 50 mas (4 pc; Figure 2) and are more smooth than the surrounding regions, we estimated an effective flux density upper limit by shifting a circular () aperture randomly to 100 continuum-free regions of the residual MFS image to sample the noise. The standard deviation mJy of these extended integrations is an effective 1 upper limit for any (resolved) thermal continuum emission (for additional discussion of practical noise recovery in ALMA imaging, refer to T. Tsukui et al., 2023). The enclosed dust mass limit
| (A1) |
assumes a standard dust absorption coefficient and emissivity index in the opacity relationship (B. T. Draine, 2003). For K and a standard dust-to-gas mass ratio of 0.015 (K. M. Sandstrom et al., 2013), this modified black body would correspond to a total gas mass . A hotter K that follows the upper dust temperature distribution in ETGs (T. Kokusho et al., 2019) would result in and . In either case, this upper limit is not more constraining than is the SED fitting of mid-IR flux densities while the limit abuts against CO(10)-derived upper limits presented in Section 4.1.
Higher-frequency ALMA continuum imaging would better probe thermal emission as thermal increases with frequency roughly as . In addition, the synchrotron nucleus intensity decreases towards higher frequencies with a spectral index (see Appendix B), further reducing . DR limitations would dilute improvements due to higher and lower peak , with standard Bands 7 and 8 and 250, respectively. With good observing conditions and standard self-calibration, such observations could achieve a factor of 2 higher DR in practice (G. Privon et al., 2024). Extreme DR imaging (85000 in Band 3 and 2500 in Band 7; S. Komugi et al., 2022) has been demonstrated with ALMA, although even in this best case and for the higher we estimate a maximal mJy would only probe 6 lower than above.
Appendix B Light Curves and Spectral Slopes
| Obs. | Member | Time | Peak | MFS rms | PWV | |||
|---|---|---|---|---|---|---|---|---|
| Date | OUS | GHz | (arcsec) | (min) | (Jy) | (mJy) | (mm) | |
| (1) | (2) | (3) | (4) | (5) | (6) | (7) | (8) | |
| 2019.1.00807.S (PI: Ramakrishnan) | ||||||||
| Apr 11 | A001/X1527/X2bc | 221.10 | 694 | 7.55 | 1.58 | 83.1 | 1.62 | |
| Apr 15 | A001/X1527/X2bf | 221.10 | 695 | 7.55 | 1.55 | 80.4 | 1.14 | |
| 2021 | Apr 17 | A001/X1527/X2c2 | 221.10 | 696 | 7.55 | 1.52 | 79.7 | 0.69 |
| Apr 18 | A001/X1527/X2c5 | 221.10 | 677 | 7.55 | 1.50 | 80.3 | 0.81 | |
| Apr 19 | A001/X1527/X2c8 | 221.10 | 865 | 7.55 | 1.47 | 85.8 | 0.81 | |
| 2021.1.01398.S (PI: Ramakrishnan) | ||||||||
| Mar 23 | A001/X15bc/X6a5 | 221.10 | 605 | 7.55 | 1.17 | 59.1 | 1.00 | |
| Mar 24 | A001/X15bc/X6a8 | 221.10 | 469 | 7.55 | 1.47 | 76.8 | 0.26 | |
| Mar 26 | A001/X15bc/X6ae | 221.10 | 695 | 7.55 | 1.20 | 65.8 | 0.81 | |
| Mar 27 | A001/X15bc/X6b1 | 221.10 | 603 | 5.02 | 1.23 | 67.4 | 0.76 | |
| Mar 28 | A001/X15bc/X7f8 | 97.50 | 1468 | 7.55 | 1.90 | 106.1 | 2.16 | |
| Mar 28 | A001/X15bc/X6b4 | 221.97 | 634 | 7.55 | 1.23 | 62.2 | 2.11 | |
| Mar 29 | A001/X15bc/X6b7 | 221.10 | 664 | 7.55 | 1.23 | 63.8 | 2.27 | |
| 2022 | Mar 30 | A001/X15bc/X6ba | 221.10 | 631 | 7.55 | 1.23 | 62.4 | 1.19 |
| Mar 31 | A001/X15bc/X6bd | 221.10 | 672 | 7.55 | 1.23 | 62.9 | 1.36 | |
| Apr 1 | A001/X15bc/X6c0 | 221.10 | 676 | 7.55 | 1.22 | 62.0 | 0.30 | |
| Apr 2 | A001/X15bc/X26a | 203.00 | 611 | 5.02 | 1.13 | 58.1 | 1.47 | |
| Apr 2 | A001/X15bc/X278 | 343.50 | 419 | 5.84 | 0.73 | 79.6 | 0.80 | |
| Apr 2 | A001/X15bc/X6c3 | 221.10 | 645 | 7.55 | 1.22 | 61.8 | 0.87 | |
| Apr 3 | A001/X15bc/X7fb | 95.70 | 1649 | 5.02 | 1.83 | 107.0 | 1.22 | |
| Apr 3 | A001/X15bc/X6c6 | 221.10 | 672 | 7.55 | 1.23 | 63.2 | 1.36 | |
| Apr 4 | A001/X15bc/X271 | 233.00 | 736 | 5.02 | 1.27 | 67.5 | 0.64 | |
Note. — Continuum properties of archival ACA 7-m data sets. Cols. (3) and (4) give the average frequency of the final MFS image across all spws and average synthesized beam FWHM from Briggs () imaging. Col. (5) gives the on-source integration time while cols. (6) and (7) report the peak and rms intensities of each MFS image. Col. (8) reports average PWV conditions. Each project used the same MHz TDM channel binning with dual polarization set-up.
In addition to ALMA 12-m observations taken between 2014 to 2019, we retrieved additional ACA 7-m imaging in projects 2019.1.00807.S and 2021.1.01398.S that monitored the Band 3 and 6 variability of M87 around EHT campaigns in 2021 and 2022. We obtained these archival data and applied standard pipeline calibration followed by phase-only self-calibration prior to imaging into MFS images with typical limiting sensitivities of 60–80 mJy beam-1. Despite the coarse angular resolution (5″ in Band 6) relative to the 12-m data, we convolved an MFS image from project 2013.1.01022.S to match the ACA resolution and confirmed that higher beam sizes do not result in jet emission contaminating the peak flux densities reported in Table A2. To construct more complete light curves shown in Figure 7, we joined together ALMA 12 and 7-m peak flux densities with Submillimeter Array (SMA) monitoring of M87 over this time frame (EHT MWL Science Working Group et al., 2021, 2024).
From adjacent ACA observations in program 2021.1.01398.S that span 100400 GHz, we measured an apparent mm/sub-mm spectral index from roughly contemporaneous data taken between 2022 April 23. Fit errors include both rms and absolute flux scaling uncertainties. More separate ALMA 12-m imaging in programs 2012.1.00661.S and 2015.1.01352.S were obtained in programs 2012.1.00661.S and 2015.1.01352.S between 2014 Jan 28 and 2015 October 2731, respectively, with coverage spanning 95340 GHz. From these data, we find a best-fit . Both spectral indices are consistent with the synchrotron origin for the radio-continuum data for the core and jet regions (e.g., J. A. Biretta et al., 1991; EHT MWL Science Working Group et al., 2021). The more contemporaneous of the ALMA 12-m peak flux densities hint at a flattening spectral slope at longer wavelengths, although we do not detect a transition to (seen in VLBI for mm within ; M. A. Prieto et al., 2016).
At radio to mm wavelengths, the peak flux densities of the M87 nucleus can vary by over 50% over few month timescales. Consistent with damped-random walk (DRW) variability, though, the typical level has remained consistent over a decade (V. A. Acciari et al., 2009; H. E. S. S. Collaboration et al., 2011; K. Hada et al., 2014; G. C. Bower et al., 2015). This strong variability at long wavelengths may introduce large uncertainties in the SED slope measured across a narrow frequency range. We tested the impact of using non-contemporaneous ALMA data by creating mock light curves in ALMA Bands 3, 6, and 7 whose variability was defined by the power spectral density (PSD) fits to other radio galaxies (from 43 GHz light curves with an average power-law PSD slope ; H.-M. Zhang et al., 2020). Following the methodology of D. Emmanoulopoulos et al. (2013), we simulated an ALMA Band 6 peak light curve spanning 2 yrs with a one-day cadence. Additional Bands 3 and 7 light curves were then created using a consistent (intrinsic) at each time epoch. We evaluated the change in recovered relative to when the different Band measurements were separated by days to months. We added random, realistic noise drawn from a normal distribution following the absolute flux calibration uncertainties (E. Fomalont et al., 2014) to each synthetic flux density before calculating across these ALMA Bands. We then collected these for a given time separation across the entire synthetic light curve. The standard deviation of the values serves as a proxy for the total uncertainty when using non-contemporaneous ALMA measurements. When synthetic measurements are separated by at most a few days, we find that . When separated by a few weeks to a few months, increases from 0.15 to 0.35 before flattening. As a result, including a peak point taken over 1.5 years before the remaining closely-sampled ALMA 12-m data means the fitted underestimates the true uncertainty by at least a factor of 2. We note that measured across broad radio (or radio-to-mm) frequency ranges will give more reliable spectral indices that are robust against DRW variability.
Appendix C Peak Continuum Spectra
In Figure 8, we present peak flux density spectra of all member OUS listed in Table A3. The spectra show no strong molecular line features except for residual contamination from atmospheric ozone, which we discuss in Appendix D. Spectral shapes are not always consistent across all spws in a single setup or as a function of time. We attribute this to either limitations in the standard pipeline calibration process or assumptions about the calibrator spectral index.
ALMA bandpass and flux calibration typically rely on week to few-month cadence monitoring of bright AGN (with peak flux densities of 0.12 Jy) that are tied to Solar System standards (M. Bonato et al., 2019). For point-source AGN, mm-wavelength flux densities have a median 10% variability amplitude over year timescales (and larger at higher frequencies; e.g., E. M. Sadler et al., 2008; M. Bonato et al., 2019). Calibrator flux densities are updated in the ALMA Calibrator Source Catalogue (CSC) and are recorded in pipeline files for MS reconstruction. This approach does not always account for the power-law spectral index of a calibrator (reflected by the spix parameter in the setjy task) or spix variability. Bandpass and flux calibrators are overwhelmingly selected from radio quasars and BL Lac-type objects that show approximately flat spectral shapes as measured in L to C radio bands, although in ALMA Bands the mm/sub-mm spectral index is often more characteristic of classical synchrotron radiation (including for some calibrators used in these programs; see Appendix B and M. Bonato et al., 2018).
In some cases, the pipeline calibration process adopted a non-zero spix based on a roughly contemporaneous spectral index measurement, but this was not uniform in the earlier ALMA Cycles. Within a single sideband, spix discrepancies led to inconsistencies in the relative flux densities in individual spws at the 1–2% level. For adjacent EBs separated by an hour, even when using the same calibrators, the inter-spw value may change by up to 10% (see Figure 12). The main outlier is the X20d data set, whose inter-spw is much steeper than roughly contemporaneous ALMA Band 6 observations and SED slopes in Figure 7. We attribute these discrepancies to poor spw-dependent phase solutions during self-calibration. Over all spws for a given spectral setup, the typical inter-spw after standard pipeline and self-calibration processes spans a broad range of 0.1 to 1.0. Some of this scatter is likely attributable to the apparent flattening in peak for measurements where GHz (see Figure 7 and M. A. Prieto et al., 2016). Intra-spw slopes are particularly unreliable (L. Francis et al., 2020b) due in large part to bandpass calibration limitations (see Appendix E.3).
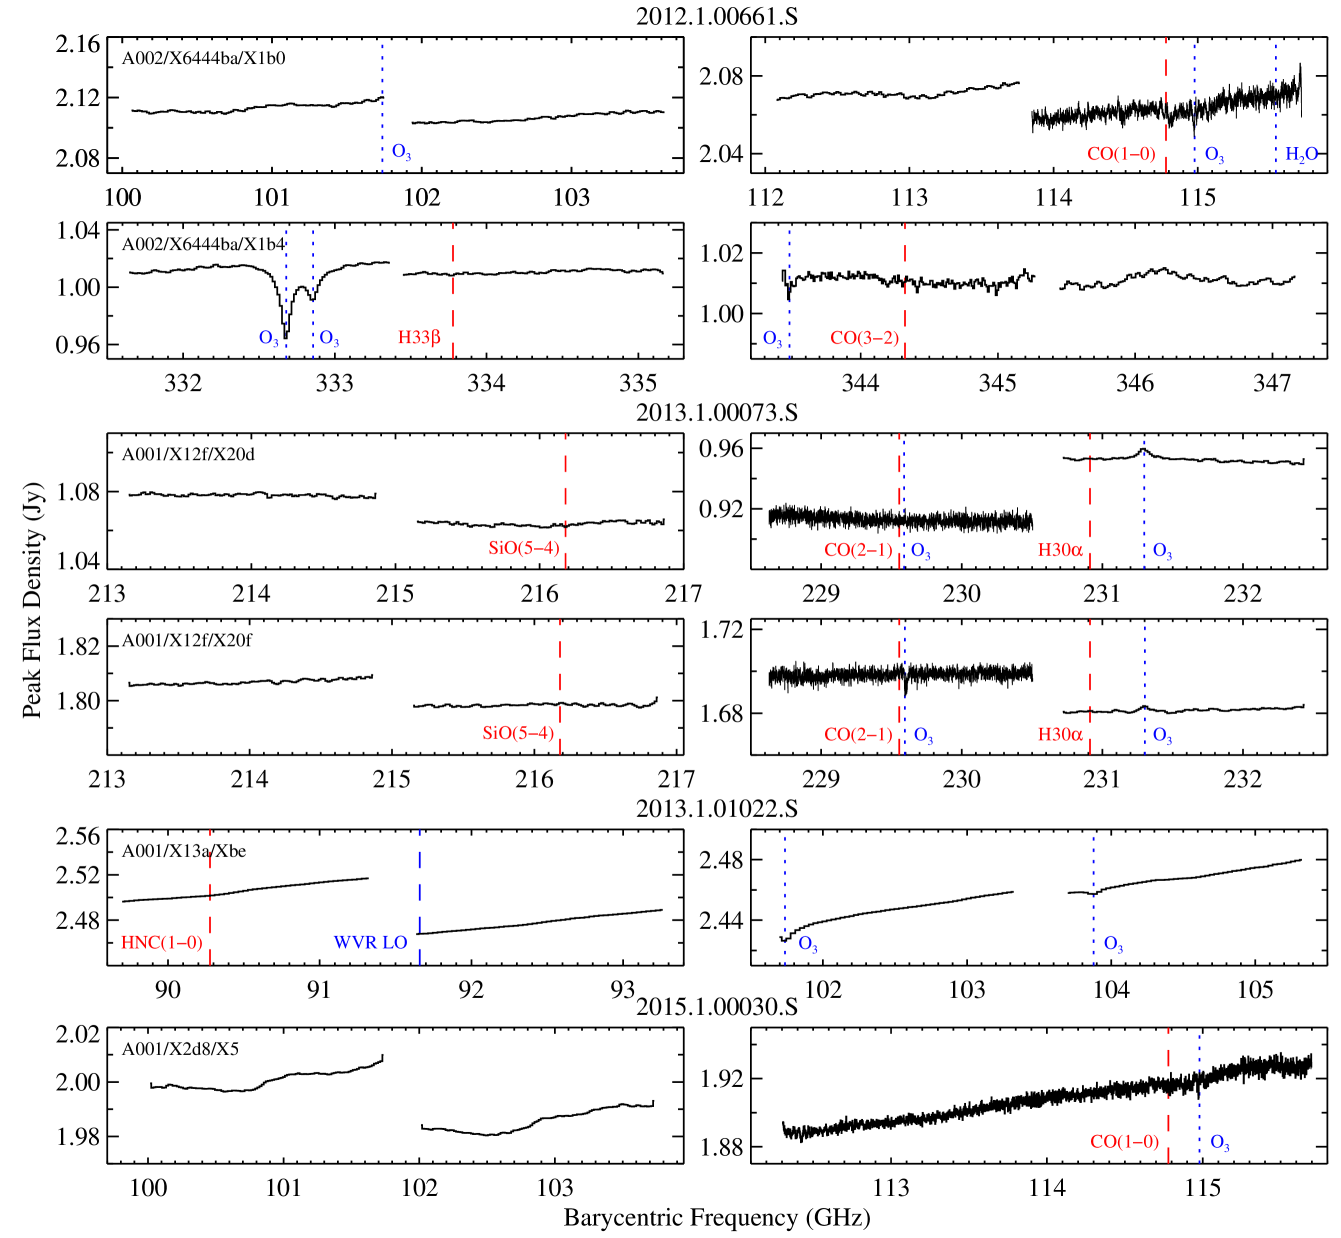

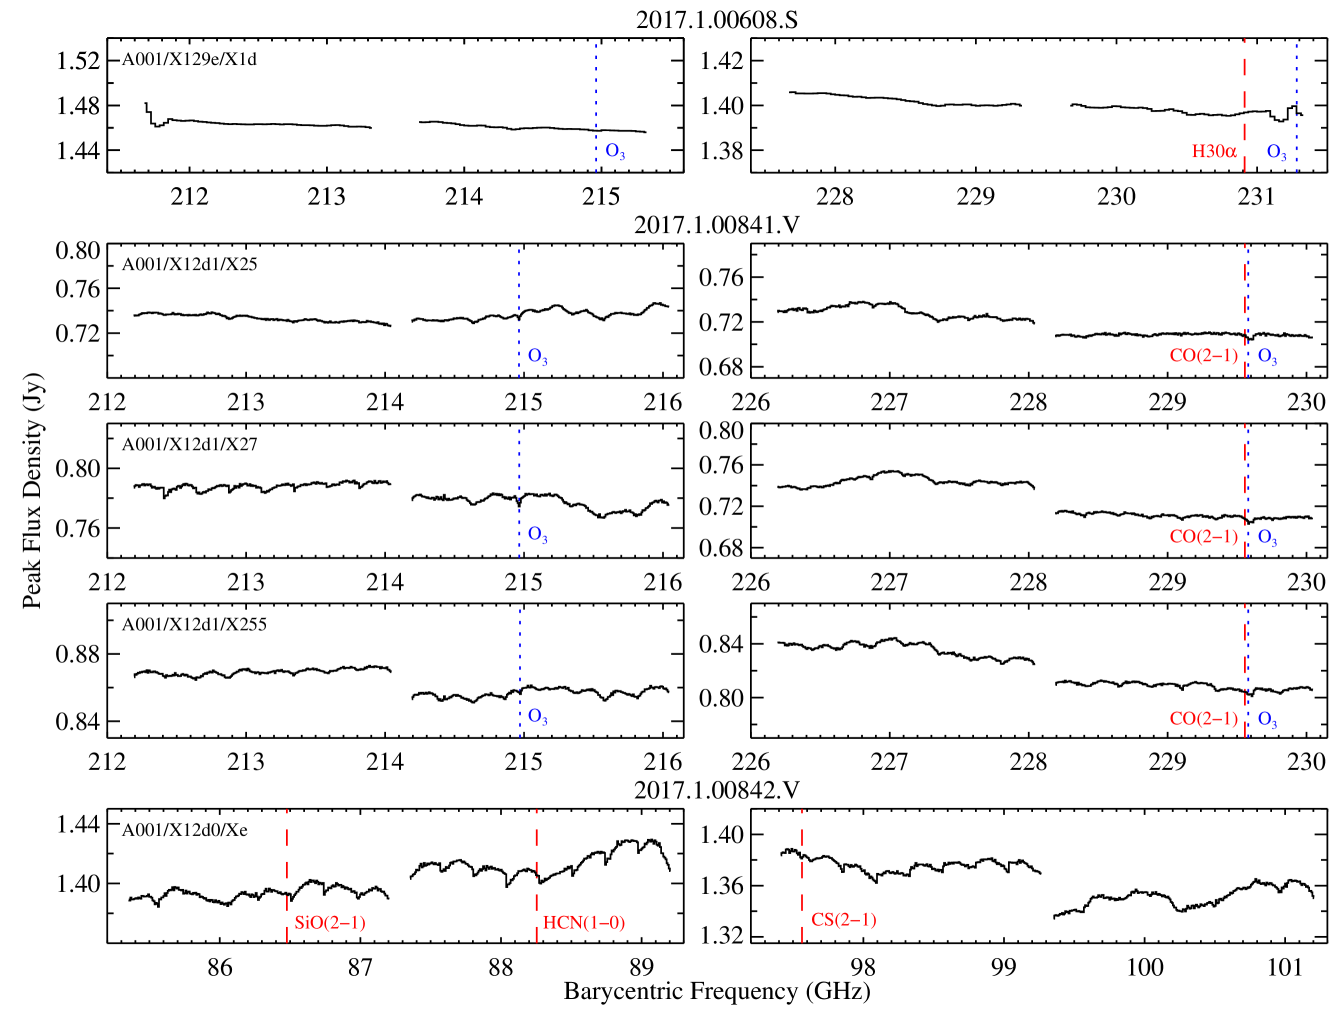
Appendix D Atmospheric Modeling
The deepest atmospheric absorption features (primarily water vapor) often set the frequency ranges for mm/sub-mm Bands. For Band 3, an O2 line ( ; GHz) limits coverage in practice to a topocentric GHz. As we demonstrate in Appendix E.3, this impacts the continuum subtraction reliability near CO(10) and may contribute to the spurious broad absorption or emission-line features. Pipeline calibration does correct for most of the H2O and O2 transmission drop. However, the spw nearest the broad H2O feature centered at GHz in the X1b4 data set does show some residual spectral curvature due to water vapor in the first EB when the relative humidity decreases rapidly after the initial calibration scans.
From the continuum spectral cubes, we identified several absorption and emission features that could not be matched to Galactic or extragalactic lines but that did coincide with various telluric ozone (O3) transitions in the topocentric frame. T. Hunter et al. (2018) demonstrated that the coarse TDM atmospheric calibration used for these ALMA 12-m data may over/undercorrect for atmospheric ozone, resulting in either positive or negative residuals. These lines have been further studied by the PHANGS-ALMA team in Band 6 around redshifted CO(21) in their total-power array imaging, primarily as a function of elevation or airmass (A. Usero et al., 2019; A. K. Leroy et al., 2021) while assuming that atmospheric conditions (e.g., relative humidity, ambient temperature, and O3 concentration) are stable over 12 EBs (12 hours). Here, we focus on atmospheric variability on such short timescales as well as the impact of calibrator offset on the correction of telluric line features. Since the O3 transitions do not generally interfere with most of the extragalactic line transitions at the redshift of M87, we did not attempt to mitigate their impact by constructing spectra in FDM mode during manual calibration (as suggested by T. Hunter et al., 2018). In Figure 8 and elsewhere, we indicate the frequencies of the ozone and water vapor transitions that have CDMS/JPL logarithmic intensities555Identified using the Splatalogue database for astronomical spectroscopy https://splatalogue.online/ (H. M. Pickett et al., 1998; H. S. P. Müller et al., 2005) brighter than the limiting 5.3 for which ozone lines have been detected in our ALMA 12-m data. Telluric lines are detected with continuum absorption depths down to a fraction of a percent in data sets with high SDR.
To aid in identifying and characterizing faint ozone features, we employed the am atmospheric modeling tool (S. Paine, 2018) to calculate an atmospheric transmission curve for each continuum spectrum. This approach adopts column densities for select molecules and approximates the vertical structure with layers of varying pressure and temperature. Without detailed conditions above the Atacama plateau, we borrowed the realistic am manual model for Mauna Kea at nearly the same altitude after adjusting for the average PWV, target elevation, and ground-layer temperature for each MS. Using the same spectral ranges and binning, we constructed final transmission curves for each spw and shifted them to barycentric frame to more easily compare to plots in Figure 8. We note that the am model results are close to those from the Atmospheric Transmission at Microwaves model (ATM; J. Pardo et al., 2001; J. R. Pardo, 2019), especially after additional minor lines were included and tuned for observed seasonal and diurnal O3 concentration and altitude changes (S. M. Frith et al., 2020; J. Pardo, 2024).
These ozone features are typically distinct from major molecular transitions at a barycentric , although one O3 transition [23(5,19)24(4,20); GHz] lies close to the CO(21) frequency at low redshifts. For the X20f data set, the archival calibration script manually flagged a narrow range of channels for the bandpass calibrator (J1229+0203; 3C 273), misidentifying an atmospheric ozone line as extragalactic in origin. The result was a sharp, moderately deep (6% of the continuum level; see Figure 9), spurious absorption feature in the corresponding calibrated M87 spectral window near redshifted . During pipeline calibration, the wings of this ozone feature remain apparent as slight excesses due to calculations being carried out in TDM mode with default ATM ozone model parameters (T. Hunter et al., 2018). After inspecting the relevant frequency range when this calibrator was a science target in project 2019.1.00807.S, we could not identify a line feature or possible molecular gas candidate at the calibrator’s redshift (). We removed these flags before re-calibrating and re-imaging the X20f MS, which removed nearly all of the ozone line contamination and revealed the faint CO(21) absorption feature. None of the other data sets appear to have similar flagging issues.
Atmospheric phase differences between baselines vary with characteristic timescales of minutes. While many studies of water vapor or O3 column densities tend to track differences on hour timescales or longer (e.g., B. Rappenglück et al., 2014; Q. Zhang et al., 2018; L. T. Maud et al., 2023), rapid changes decrease the coherence time for high-frequency observations (S. Matsushita et al., 2017) and increase phase fluctuations, especially for extended ALMA configurations (G. Privon et al., 2024). Regular WVR measurements correct for smaller-scale, more rapidly-varying PWV changes, and phase self-calibration works to remove residual path length discrepancies. Due to the bright mm/sub-mm continuum source at the center of M87, clean phase solutions can generally be obtained through iterative self-calibration by using the CASA gaincal task on timescales as short as the scan length. We find that these phase self-calibration loops mitigate nearly all path length fluctuations that arise due to tropospheric turbulence, even on the longest ALMA baselines. However, for two exceptions (the X20d data set and the first EB of X1b0), the self-calibration process never produced sufficiently clean phase solutions regardless of the choice of refant or solint. The resulting spectra were less reliable due to poorer rms sensitivity or much lower flux scaling and high CLEAN residuals.
Good bandpass calibrators are not always found close to the science target on the sky, but those that are significantly removed in time or obtained along a far-removed line of sight have the potential to leave imprints of atmospheric lines on calibrated science data (G. S. Meena, 2010; S. M. Frith et al., 2020). Figure 9 plots the peak spectra obtained in the X1b4 data set during Cycle 1, showing residual O3 absorption [in the 11(2,10)11(1,11) and 2(2,0)1(1,1) transitions; and 332.882 GHz, respectively]. The am model with matching observing conditions shows a fractional depth of 0.18 for the deeper O3 line compared to the neighboring continuum. In this member OUS, the bandpass calibrators for the first and second EB were separated by 25.3° and 10.3° from M87, respectively, and ATM models removed 55% and 90% of the expected ozone absorption towards M87. The second bandpass calibrator appears to have been observed through a more similar , enabling a better telluric correction for the second EB. We note that PWV or relative humidity trends are not mirrored by the residual O3 line strengths as the molecules originate from different altitudes (O3 primarily at 1540 km while the H2O scale height is 12 km). Variable is suggested by other data sets, especially in projects 2013.1.00073.S, 2013.1.01022.S, and 2016.1.01154.V. Positive O3 line features in the target spectral cube suggest a higher towards the bandpass calibrator than towards the science target. Assuming that scales linearly with the depth of unsaturated O3 absorption lines, the residual depths shown in Figure 9 for a single EB suggest that either stratospheric or ground-layer along the line of sight changed by up to 6% over just 30 min.
Appendix E Constraints on Broad CO Features
Here, we present anomalous spectral behavior when excluding wider channel ranges during continuum subtraction. Depending on the choice of fitting windows, some continuum-subtracted spectra of the M87 nucleus appear to show broad but very low-amplitude CO absorption or emission. After exploring possible implications of broad extragalactic CO absorption or emission detection at low S/N, we detail evidence that they arise naturally from the inherent limitations of ALMA bandpass calibration.
E.1 Broad CO Absorption
After excluding channels with km s-1 in the uvcontsub task, we imaged the deeper X1b0, X5, and Xa1 data sets (Band 3) as well as those from X20d and X20f (Band 6) covering redshifted CO(10) and CO(21) into spectral cubes with 40 km s-1 channel binning. For the X1b4 data set (Band 7), we excluded a more narrow channel range with km s-1 due to more limited frequency coverage. In Figure 10, we plot integrated spectra over their central beam areas after adding back the fitted peak continuum, revealing deficits in the km s-1 range. In Band 3, these broad spectral deficits have peak opacities with S/N relative to the rms of the continuum-fitting channels. When integrated over that velocity range, we find km s-1 with S/N . In the higher-frequency Bands, the CO(10) opacity signature is not replicated in the same manner.
If real, these deficits would seem to trace a fast molecular outflow. Previously, a blueshifted atomic outflow has been suggested by emission (J. Osorno et al., 2023) and absorption against the bright nucleus (Z. I. Tsvetanov et al., 1999b; B. M. Sabra et al., 2003). However, the atomic gas absorption feature is narrow in comparison and neither reaches the same km s-1 terminal speeds. We note that such fast ouflows have been detected in absorption against ultraluminous infrared galaxy nuclei and AGN, including several LINERs in far-IR OH absorption (albeit at much higher opacity; e.g., S. Veilleux et al., 2013; M. Stone et al., 2016; R. Herrera-Camus et al., 2020). Unfortunately, there is no far-IR spectroscopy covering the M87 nucleus that can probe dense gas to support a possible broad outflow seen in CO. In a closer analog, broad and shallow molecular absorption-line outflows reaching speeds of a few 100 km s-1 are reported against the FR I/Seyfert nucleus of NGC 1275 in dense gas tracers (and likely CO; H. Nagai et al., 2019). In NGC 1275 and other AGN, molecular outflows are detected in emission with blueshifted speeds ranging from 100–1000 km s-1 (e.g., C. Cicone et al., 2014; S. Garc´ıa-Burillo et al., 2014; R. A. Riffel et al., 2020; A. D. Bolatto et al., 2021). Evidence for outflows in LINERs is less distinct, with outflow signatures being confined to the wings of the integrated emission-line profiles.
Such a fast molecular outflow in M87 remains unlikely based on both physical and calibration considerations:
- 1.
-
2.
Continuum-subtracted spectra are not fully consistent, even about the same CO transition. In Band 3, the deficits vary in velocity extremes by 600 km s-1. For those covering redshifted CO(21), the integrated X20d spectrum shows a broader deficit that favors higher recessional speeds while the X20f spectrum appears flat. For redshifted CO(32), the X1b4 spectrum is overly deep and abrupt due to narrower velocity coverage and a lack of overlapping spws to anchor the continuum subtraction. Sub-percent level flux mismatches between spws in the upper sideband may also result in a spurious (and relatively deep) deficit.
-
3.
Peak fractional deficits are at or below the level of the bandpass stability. In Band 3, correcting for the deep transmission drop due to the adjacent O2 line may leave residual fluctuations in the profile wings as a result of calculations in TDM mode (see Appendix D and Figure 9). A spurious excess around GHz due to O2 overcorrection in the wings could then create the impression of a blueshifted CO deficit after continuum subtraction.
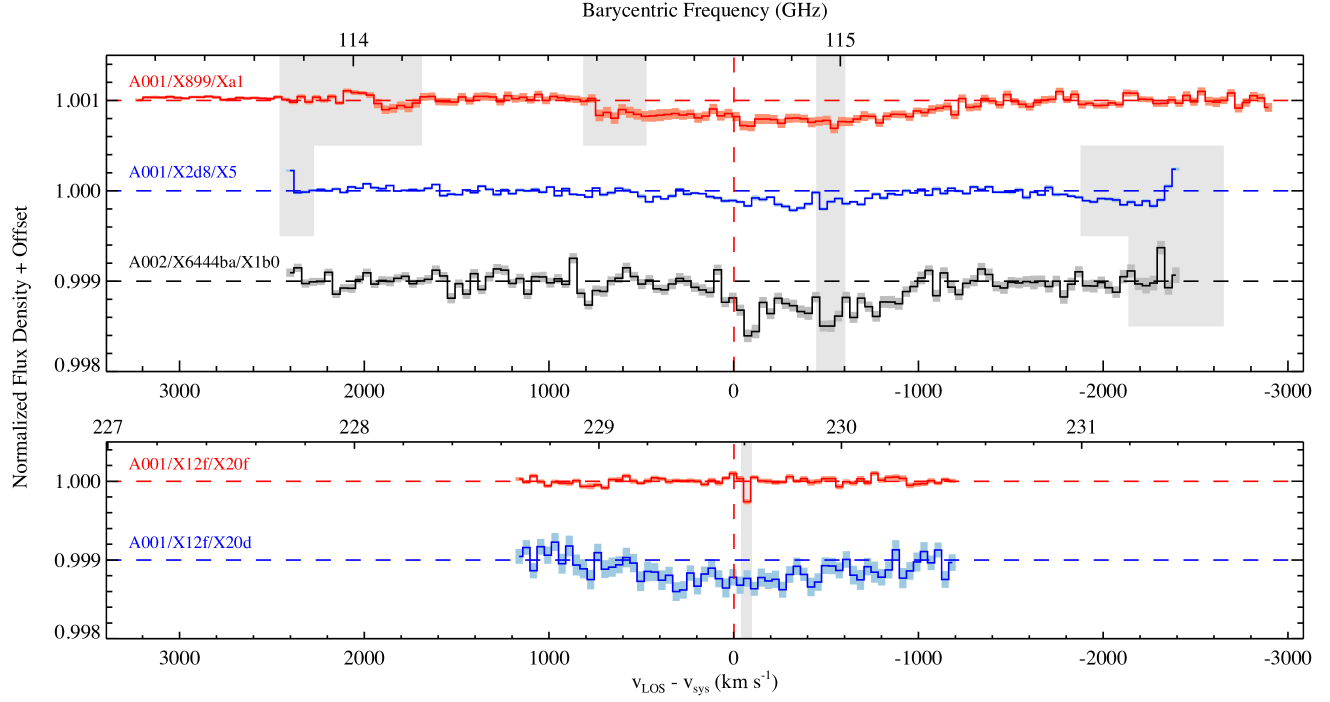
E.2 Broad CO Emission
After excluding channels with km s-1 in the uvcontsub task (with fitorder = 1), we imaged redshifted CO(10) in the X5 and Xa1 data sets into cubes with 40 km s-1 bins to improve S/N. Care was taken to avoid channels at spw edges that showed poor response or whose flux densities were discrepant with those in overlapping spws. Unfortunately, higher- transitions did not have sufficient frequency coverage (or spw overlap) to allow for reliable continuum subtraction, so we limited this analysis to the CO(10) transition. In Figure 11, we show CO(10) position-velocity diagrams (PVDs) extracted in a N–S direction with a width matching the beam average FWHM. The observed excess are roughly centered around and +1000 km s-1, with spatial centroids separated by as little as 0015 (1 pc). Because this excess appears to be almost unresolved in either case666We tentatively detect a similar small shift in continuum centroid (but not peak location) in both the X5 and Xa1 continuum cubes shown in Figure 8. We attribute this to residual frequency-dependent phase offsets that had not been fully removed during self-calibration, giving the appearance of a slight spatial shift of the continuum emission., we constructed line profiles by integrating over the central region with a circular aperture.

From the more symmetrical Xa1 CO line profile, the excess would correspond to an integrated Jy km s-1. Assuming for the moment that the excess represents a dynamically cold disk rotating about the BH, the excess extreme at km s-1 can be transformed into an estimate of the molecular gas distribution. Using an inclination angle (J. Osorno et al., 2023) and an (E. R. Liepold et al., 2023), these extrema would originate 1.72.7 pc (002003) from the BH while the bulk of the excess would appear to originate 9 pc away. However, this is much smaller than for the Xa1 data set, so a putative rotating disk cannot explain the measured moment 1 map gradient in the N–S direction in Figures 4 and 11. Also, these velocity extrema would be inconsistent with the essentially unresolved excesses in the X5 data set.
Detection of a rotating CND traced by CO(10) on such scales is improbable with the following counter arguments:
-
1.
Based on the Xa1 excess, the total molecular mass of would correspond to pc-2, which far exceeds surface mass densities for ALMA CO-detected CNDs (e.g., B. D. Boizelle et al., 2017) and comes close to the highest constraints on from thermal excess limits.
-
2.
The excess profiles are not sufficiently consistent or symmetrical, and they are not well centered about . Also, the putative moment 0 (1) map in Figure 11 has a major-axis PA (PA of the velocity gradient) that is oriented 90° (45°) from that of the atomic gas CND. Warping of the inner disk (e.g., I. Ruffa et al., 2019) could not explain the discrepancy.
-
3.
The maximum excess flux densities reach only 0.15% of the integrated continuum level, matching the 0.1% amplitude variation seen when testing bandpass stability (S. Kameno, 2014).
-
4.
The blueshifted peak at higher frequencies abuts the Band 3 edge. Any calibration residual from the strong O2 feature may imprint a bump feature around GHz (similar to that seen in the wings of an O3 line after correction) due to calculations using TDM frequency binning.
E.3 Bandpass Calibration Accuracy
The maximum SDR measured in individual channels for the Band 3 data sets corresponds to , allowing for narrow CO absorption-line detection. For broad line signatures, however, the larger frequency response depends on the accuracy of the bandpass calibration, effectively lowering the SDR. These spectral calibration solutions vary in frequency as well as in time. S. Kameno (2014) demonstrated that cross-correlation bandpass calibration remained stable at the 0.2% level over short time frames (1 hr for Bands 3 and 6), producing a mostly flat spectral response with corresponding global SDR or . For much longer than the length of an EB, changes in atmospheric transmission begin to introduce more significant uncertainty in the bandpass amplitude correction. Imaging that combines multiple EBs, especially with partially overlapping spws, may result in inconsistent or discontinuous spectral behavior. For frequency separations MHz (100200 MHz and 500 MHz) in Band 3 (Band 6), the bandpass amplitude calibration shows noticeable systematic variation above the white-noise prediction (S. Kameno, 2014). This means that fully calibrated spectra may have very low-amplitude fluctuations imprinted on velocity scales of km s-1 (130160 km s-1, 650 km s-1).
In Figure 12, we compare the spectral behavior for individual spws in a single sideband from all standard ALMA programs covering redshifted CO(10) and CO(21) transitions. Especially for Band 3 peak spectra, both the CO-centered and adjacent spws show similar fluctuations at the 0.10.3% level relative to the spw channel center. In the lower sideband, adjacent spws also show similar spectral response (e.g., from the X5 and X2be data; see Figure 8.) In Band 3 spectra, the downward fluctuation between 00.5 GHz relative to the spw center coincides with the apparent spectral deficits seen in Figure 10. Such fluctuations arising from bandpass amplitude calibration may mimic faint, broad absorption for a fast outflow. For very low-amplitude, broad spectral features, we find a more appropriate SDR limit across a single Band 3 spw using the standard bandpass calibration. Because these Band 3 spectra abut a strong O2 absorption feature, they may also be negatively impacted by the correction as well as slight changes in between the bandpass and science scans, either due to temporal variations or angular separation. In Band 6, the spectral shape appears more consistent with fluctuations at or below the 0.05% level, matching its native SDR. However, the small sample size of deep Band 6 imaging with fine FDM binning prevents any clear conclusions.

We find further support for a bandpass calibration origin for these low-amplitude spectral features in the peak spectrum in roughly contemporaneous observations. For example, the peak shape over 102104 GHz in the X5 data set is inconsistent with those covering the same spectral range in Xbe and X135 data sets, which were obtained just weeks apart. While the latter two member OUS used a different bandpass calibrator (J1229+0203) than the former (J1256–0547), differences in the calibrated, intra-spw shape is still within the quoted limitations for bandpass calibration (G. Privon et al., 2024). For these reasons, we view the very low amplitude spectral deficits or excess features in Figures 10 and 11 as spurious and arising from a patterned response in the bandpass amplitude calibration for adjacent basebands. The mostly regular shape and extent of the seemingly broad CO(10) absorption in Figure 10 would then be a product of spw placement relative to the redshifted CO transition and proximity to the O2 line that defines the end of the Band coverage.
References
- V. A. Acciari et al. (2009) Acciari, V. A., Aliu, E., Arlen, T., et al. 2009, \bibinfotitleRadio Imaging of the Very-High-Energy -Ray Emission Region in the Central Engine of a Radio Galaxy, Science, 325, 444, doi: 10.1126/science.1175406
- P. J. André et al. (2022) André, P. J., Palmeirim, P., & Arzoumanian, D. 2022, \bibinfotitleThe typical width of Herschel filaments, A&A, 667, L1, doi: 10.1051/0004-6361/202244541
- D. Arzoumanian et al. (2018) Arzoumanian, D., Shimajiri, Y., Inutsuka, S.-i., Inoue, T., & Tachihara, K. 2018, \bibinfotitleMolecular filament formation and filament-cloud interaction: Hints from Nobeyama 45 m telescope observations, PASJ, 70, 96, doi: 10.1093/pasj/psy095
- D. Arzoumanian et al. (2011) Arzoumanian, D., André, P., Didelon, P., et al. 2011, \bibinfotitleCharacterizing interstellar filaments with Herschel in IC 5146, A&A, 529, L6, doi: 10.1051/0004-6361/201116596
- I. V. Babyk et al. (2019) Babyk, I. V., McNamara, B. R., Tamhane, P. D., et al. 2019, \bibinfotitleOrigins of Molecular Clouds in Early-type Galaxies, ApJ, 887, 149, doi: 10.3847/1538-4357/ab54ce
- J. Baek et al. (2022) Baek, J., Chung, A., Edge, A., et al. 2022, \bibinfotitleCircumnuclear Medium around the Central AGN in a Cool-core Cluster, Abell 1644-South, ApJ, 932, 64, doi: 10.3847/1538-4357/ac6de6
- M. Baes et al. (2010) Baes, M., Clemens, M., Xilouris, E. M., et al. 2010, \bibinfotitleThe Herschel Virgo Cluster Survey . VI. The far-infrared view of M 87, A&A, 518, L53, doi: 10.1051/0004-6361/201014555
- A. J. Barth et al. (2016) Barth, A. J., Boizelle, B. D., Darling, J., et al. 2016, \bibinfotitleMeasurement of the Black Hole Mass in NGC 1332 from ALMA Observations at 0.044 arcsecond Resolution, ApJ, 822, L28, doi: 10.3847/2041-8205/822/2/L28
- S. Bianchi et al. (2012) Bianchi, S., Maiolino, R., & Risaliti, G. 2012, \bibinfotitleAGN Obscuration and the Unified Model, Advances in Astronomy, 2012, 782030, doi: 10.1155/2012/782030
- G. V. Bicknell & M. C. Begelman (1996) Bicknell, G. V., & Begelman, M. C. 1996, \bibinfotitleUnderstanding the Kiloparsec-Scale Structure of M87, ApJ, 467, 597, doi: 10.1086/177636
- J. H. Bieging et al. (1981) Bieging, J. H., Blitz, L., Lada, C. J., & Stark, A. A. 1981, \bibinfotitleCO emission from Seyfert galaxies., ApJ, 247, 443, doi: 10.1086/159052
- J. A. Biretta et al. (1999) Biretta, J. A., Sparks, W. B., & Macchetto, F. 1999, \bibinfotitleHubble Space Telescope Observations of Superluminal Motion in the M87 Jet, ApJ, 520, 621, doi: 10.1086/307499
- J. A. Biretta et al. (1991) Biretta, J. A., Stern, C. P., & Harris, D. E. 1991, \bibinfotitleThe Radio to X-ray Spectrum of the M87 Jet and Nucleus, AJ, 101, 1632, doi: 10.1086/115793
- J. P. Blakeslee et al. (2009) Blakeslee, J. P., Jordán, A., Mei, S., et al. 2009, \bibinfotitleThe ACS Fornax Cluster Survey. V. Measurement and Recalibration of Surface Brightness Fluctuations and a Precise Value of the Fornax-Virgo Relative Distance, ApJ, 694, 556, doi: 10.1088/0004-637X/694/1/556
- B. D. Boizelle et al. (2017) Boizelle, B. D., Barth, A. J., Darling, J., et al. 2017, \bibinfotitleALMA Observations of Circumnuclear Disks in Early-type Galaxies: 12CO(2-1) and Continuum Properties, ApJ, 845, 170, doi: 10.3847/1538-4357/aa8266
- B. D. Boizelle et al. (2019) Boizelle, B. D., Barth, A. J., Walsh, J. L., et al. 2019, \bibinfotitleA Precision Measurement of the Mass of the Black Hole in NGC 3258 from High-resolution ALMA Observations of Its Circumnuclear Disk, ApJ, 881, 10, doi: 10.3847/1538-4357/ab2a0a
- B. D. Boizelle et al. (2021) Boizelle, B. D., Walsh, J. L., Barth, A. J., et al. 2021, \bibinfotitleBlack Hole Mass Measurements of Radio Galaxies NGC 315 and NGC 4261 Using ALMA CO Observations, ApJ, 908, 19, doi: 10.3847/1538-4357/abd24d
- A. D. Bolatto et al. (2013) Bolatto, A. D., Wolfire, M., & Leroy, A. K. 2013, \bibinfotitleThe CO-to-H2 Conversion Factor, ARA&A, 51, 207, doi: 10.1146/annurev-astro-082812-140944
- A. D. Bolatto et al. (2021) Bolatto, A. D., Leroy, A. K., Levy, R. C., et al. 2021, \bibinfotitleALMA Imaging of a Galactic Molecular Outflow in NGC 4945, ApJ, 923, 83, doi: 10.3847/1538-4357/ac2c08
- M. Bonato et al. (2018) Bonato, M., Liuzzo, E., Giannetti, A., et al. 2018, \bibinfotitleALMACAL IV: a catalogue of ALMA calibrator continuum observations, MNRAS, 478, 1512, doi: 10.1093/mnras/sty1173
- M. Bonato et al. (2019) Bonato, M., Liuzzo, E., Herranz, D., et al. 2019, \bibinfotitleALMA photometry of extragalactic radio sources, MNRAS, 485, 1188, doi: 10.1093/mnras/stz465
- A. Boselli et al. (2019) Boselli, A., Fossati, M., Longobardi, A., et al. 2019, \bibinfotitleA Virgo Environmental Survey Tracing Ionised Gas Emission (VESTIGE). V. Properties of the ionised gas filament of M 87, A&A, 623, A52, doi: 10.1051/0004-6361/201834492
- G. C. Bower et al. (2015) Bower, G. C., Dexter, J., Markoff, S., et al. 2015, \bibinfotitleA Black Hole Mass-Variability Timescale Correlation at Submillimeter Wavelengths, ApJ, 811, L6, doi: 10.1088/2041-8205/811/1/L6
- J. Braine & T. Wiklind (1993) Braine, J., & Wiklind, T. 1993, \bibinfotitleNo molecular gas in M 87 : just a monster ?, A&A, 267, L47
- J. R. Brauher et al. (2008) Brauher, J. R., Dale, D. A., & Helou, G. 2008, \bibinfotitleA Compendium of Far-Infrared Line and Continuum Emission for 227 Galaxies Observed by the Infrared Space Observatory, ApJS, 178, 280, doi: 10.1086/590249
- D. S. Briggs (1995) Briggs, D. S. 1995, PhD thesis, New Mexico Institute of Mining and Technology
- M. Cappellari & Y. Copin (2003) Cappellari, M., & Copin, Y. 2003, \bibinfotitleAdaptive spatial binning of integral-field spectroscopic data using Voronoi tessellations, MNRAS, 342, 345, doi: 10.1046/j.1365-8711.2003.06541.x
- M. Cappellari et al. (2011) Cappellari, M., Emsellem, E., Krajnović, D., et al. 2011, \bibinfotitleThe ATLAS3D project - I. A volume-limited sample of 260 nearby early-type galaxies: science goals and selection criteria, MNRAS, 413, 813, doi: 10.1111/j.1365-2966.2010.18174.x
- J. A. Cardelli et al. (1989) Cardelli, J. A., Clayton, G. C., & Mathis, J. S. 1989, \bibinfotitleThe Relationship between Infrared, Optical, and Ultraviolet Extinction, ApJ, 345, 245, doi: 10.1086/167900
- D. Carter & C. R. Jenkins (1992) Carter, D., & Jenkins, C. R. 1992, \bibinfotitleThe nucleus of M87, MNRAS, 257, 7P, doi: 10.1093/mnras/257.1.7P
- D. Carter et al. (1997) Carter, D., Johnstone, R. M., & Fabian, A. C. 1997, \bibinfotitleInterstellar matter in the core of M87, MNRAS, 285, L20, doi: 10.1093/mnras/285.3.L20
- F. H. Cashman et al. (2021) Cashman, F. H., Fox, A. J., Savage, B. D., et al. 2021, \bibinfotitleMolecular Gas within the Milky Way’s Nuclear Wind, ApJ, 923, L11, doi: 10.3847/2041-8213/ac3cbc
- C. C. Cheung et al. (2007) Cheung, C. C., Harris, D. E., & Stawarz, Ł. 2007, \bibinfotitleSuperluminal Radio Features in the M87 Jet and the Site of Flaring TeV Gamma-Ray Emission, ApJ, 663, L65, doi: 10.1086/520510
- M. Chiaberge et al. (1999) Chiaberge, M., Capetti, A., & Celotti, A. 1999, \bibinfotitleThe HST view of FR I radio galaxies: evidence for non-thermal nuclear sources, A&A, 349, 77. https://arxiv.org/abs/astro-ph/9907064
- C. Cicone et al. (2014) Cicone, C., Maiolino, R., Sturm, E., et al. 2014, \bibinfotitleMassive molecular outflows and evidence for AGN feedback from CO observations, A&A, 562, A21, doi: 10.1051/0004-6361/201322464
- F. Combes et al. (2007) Combes, F., Young, L. M., & Bureau, M. 2007, \bibinfotitleMolecular gas and star formation in the SAURON early-type galaxies, MNRAS, 377, 1795, doi: 10.1111/j.1365-2966.2007.11759.x
- P. C. Cortes et al. (2024) Cortes, P. C., Vlahakis, C., Hales, A., et al. 2024, \bibinfotitleALMA Technical Handbook,, 11.3, Zenodo Zenodo, doi: 10.5281/zenodo.4511521
- A. Crocker et al. (2012) Crocker, A., Krips, M., Bureau, M., et al. 2012, \bibinfotitleThe ATLAS3D project - XI. Dense molecular gas properties of CO-luminous early-type galaxies, MNRAS, 421, 1298, doi: 10.1111/j.1365-2966.2011.20393.x
- T. Csengeri et al. (2017) Csengeri, T., Bontemps, S., Wyrowski, F., et al. 2017, \bibinfotitleALMA survey of massive cluster progenitors from ATLASGAL. Limited fragmentation at the early evolutionary stage of massive clumps, A&A, 600, L10, doi: 10.1051/0004-6361/201629754
- K. M. Dasyra et al. (2016) Dasyra, K. M., Combes, F., Oosterloo, T., et al. 2016, \bibinfotitleALMA reveals optically thin, highly excited CO gas in the jet-driven winds of the galaxy IC 5063, A&A, 595, L7, doi: 10.1051/0004-6361/201629689
- J. R. Davidson et al. (2024) Davidson, J. R., Boizelle, B. D., Walsh, J. L., et al. 2024, \bibinfotitleCircumnuclear Dust in Luminous Early-type Galaxies. I. Sample Properties and Stellar Luminosity Models, ApJ, 972, 127, doi: 10.3847/1538-4357/ad5be4
- R. D. Davies & E. R. Cummings (1975) Davies, R. D., & Cummings, E. R. 1975, \bibinfotitle21 cm observations of hot neutral intercloud gas., MNRAS, 170, 95, doi: 10.1093/mnras/170.1.95
- T. A. Davis et al. (2017) Davis, T. A., Bureau, M., Onishi, K., et al. 2017, \bibinfotitleWISDOM Project - II. Molecular gas measurement of the supermassive black hole mass in NGC 4697, MNRAS, 468, 4675, doi: 10.1093/mnras/stw3217
- W. J. G. de Blok et al. (2014) de Blok, W. J. G., Keating, K. M., Pisano, D. J., et al. 2014, \bibinfotitleA low H I column density filament in NGC 2403: signature of interaction or accretion, A&A, 569, A68, doi: 10.1051/0004-6361/201423880
- S. de Koff et al. (2000) de Koff, S., Best, P., Baum, S. A., et al. 2000, \bibinfotitleThe Dust-Radio Connection in 3CR Radio Galaxies, ApJS, 129, 33, doi: 10.1086/313402
- G. de Vaucouleurs et al. (1991) de Vaucouleurs, G., de Vaucouleurs, A., Corwin, Herold G., J., et al. 1991, Third Reference Catalogue of Bright Galaxies
- T. Di Matteo et al. (2003) Di Matteo, T., Allen, S. W., Fabian, A. C., Wilson, A. S., & Young, A. J. 2003, \bibinfotitleAccretion onto the Supermassive Black Hole in M87, ApJ, 582, 133, doi: 10.1086/344504
- A. Doi et al. (2013) Doi, A., Hada, K., Nagai, H., et al. 2013, in European Physical Journal Web of Conferences, Vol. 61, European Physical Journal Web of Conferences, 08008, doi: 10.1051/epjconf/20136108008
- M. A. Dopita et al. (1997) Dopita, M. A., Koratkar, A. P., Allen, M. G., et al. 1997, \bibinfotitleThe LINER Nucleus of M87: A Shock-excited Dissipative Accretion Disk, ApJ, 490, 202, doi: 10.1086/304862
- B. T. Draine (2003) Draine, B. T. 2003, \bibinfotitleInterstellar Dust Grains, ARA&A, 41, 241, doi: 10.1146/annurev.astro.41.011802.094840
- B. T. Draine et al. (2014) Draine, B. T., Aniano, G., Krause, O., et al. 2014, \bibinfotitleAndromeda’s Dust, ApJ, 780, 172, doi: 10.1088/0004-637X/780/2/172
- L. Dressel (2022) Dressel, L. 2022, in WFC3 Instrument Handbook for Cycle 30 v. 14, Vol. 14, 14
- A. C. Edge (2001) Edge, A. C. 2001, \bibinfotitleThe detection of molecular gas in the central galaxies of cooling flow clusters, MNRAS, 328, 762, doi: 10.1046/j.1365-8711.2001.04802.x
- EHT Collaboration et al. (2019) EHT Collaboration, Akiyama, K., Alberdi, A., et al. 2019, \bibinfotitleFirst M87 Event Horizon Telescope Results. I. The Shadow of the Supermassive Black Hole, ApJ, 875, L1, doi: 10.3847/2041-8213/ab0ec7
- EHT Collaboration et al. (2021a) EHT Collaboration, Akiyama, K., Algaba, J. C., et al. 2021a, \bibinfotitleFirst M87 Event Horizon Telescope Results. VII. Polarization of the Ring, ApJ, 910, L12, doi: 10.3847/2041-8213/abe71d
- EHT Collaboration et al. (2021b) EHT Collaboration, Akiyama, K., Algaba, J. C., et al. 2021b, \bibinfotitleFirst M87 Event Horizon Telescope Results. VIII. Magnetic Field Structure near The Event Horizon, ApJ, 910, L13, doi: 10.3847/2041-8213/abe4de
- EHT MWL Science Working Group et al. (2024) EHT MWL Science Working Group, EHT Collaboration, The Fermi Large Area Telescope Collaboration, et al. 2024, \bibinfotitleBroadband Multi-wavelength Properties of M87 during the 2018 EHT Campaign including a Very High Energy Flaring Episode, arXiv e-prints, arXiv:2404.17623, doi: 10.48550/arXiv.2404.17623
- EHT MWL Science Working Group et al. (2021) EHT MWL Science Working Group, Algaba, J. C., Anczarski, J., et al. 2021, \bibinfotitleBroadband Multi-wavelength Properties of M87 during the 2017 Event Horizon Telescope Campaign, ApJ, 911, L11, doi: 10.3847/2041-8213/abef71
- D. Emmanoulopoulos et al. (2013) Emmanoulopoulos, D., McHardy, I. M., & Papadakis, I. E. 2013, \bibinfotitleGenerating artificial light curves: revisited and updated, MNRAS, 433, 907, doi: 10.1093/mnras/stt764
- E. Emsellem et al. (1994) Emsellem, E., Monnet, G., & Bacon, R. 1994, \bibinfotitleThe multi-gaussian expansion method: a tool for building realistic photometric and kinematical models of stellar systems I. The formalism, A&A, 285, 723
- B. L. Fanaroff & J. M. Riley (1974) Fanaroff, B. L., & Riley, J. M. 1974, \bibinfotitleThe morphology of extragalactic radio sources of high and low luminosity, MNRAS, 167, 31P, doi: 10.1093/mnras/167.1.31P
- G. J. Ferland et al. (1998) Ferland, G. J., Korista, K. T., Verner, D. A., et al. 1998, \bibinfotitleCLOUDY 90: Numerical Simulation of Plasmas and Their Spectra, PASP, 110, 761, doi: 10.1086/316190
- L. Ferrarese et al. (1996) Ferrarese, L., Ford, H. C., & Jaffe, W. 1996, \bibinfotitleEvidence for a Massive Black Hole in the Active Galaxy NGC 4261 from Hubble Space Telescope Images and Spectra, ApJ, 470, 444, doi: 10.1086/177876
- L. Ferrarese et al. (2006) Ferrarese, L., Côté, P., Jordán, A., et al. 2006, \bibinfotitleThe ACS Virgo Cluster Survey. VI. Isophotal Analysis and the Structure of Early-Type Galaxies, ApJS, 164, 334, doi: 10.1086/501350
- E. Fomalont et al. (2014) Fomalont, E., van Kempen, T., Kneissl, R., et al. 2014, \bibinfotitleThe Calibration of ALMA using Radio Sources, The Messenger, 155, 19
- H. C. Ford & H. Butcher (1979) Ford, H. C., & Butcher, H. 1979, \bibinfotitleThe system of filaments in M87: evidence for matter falling into an active nucleus., ApJS, 41, 147, doi: 10.1086/190613
- H. C. Ford et al. (1994) Ford, H. C., Harms, R. J., Tsvetanov, Z. I., et al. 1994, \bibinfotitleNarrowband HST Images of M87: Evidence for a Disk of Ionized Gas around a Massive Black Hole, ApJ, 435, L27, doi: 10.1086/187586
- W. Forman et al. (2007) Forman, W., Jones, C., Churazov, E., et al. 2007, \bibinfotitleFilaments, Bubbles, and Weak Shocks in the Gaseous Atmosphere of M87, ApJ, 665, 1057, doi: 10.1086/519480
- M. Fournier et al. (2024) Fournier, M., Grete, P., Brüggen, M., Glines, F. W., & O’Shea, B. W. 2024, \bibinfotitleThe formation and survival of cold gas in a magnetized cool-core galaxy cluster, arXiv e-prints, arXiv:2406.05044, doi: 10.48550/arXiv.2406.05044
- L. Francis et al. (2020a) Francis, L., Johnstone, D., Herczeg, G., Hunter, T. R., & Harsono, D. 2020a, in Five Years After HL Tau: A New Era in Planet Formation (HLTAU2020), 23, doi: 10.5281/zenodo.4300195
- L. Francis et al. (2020b) Francis, L., Johnstone, D., Herczeg, G., Hunter, T. R., & Harsono, D. 2020b, \bibinfotitleOn the Accuracy of the ALMA Flux Calibration in the Time Domain and across Spectral Windows, AJ, 160, 270, doi: 10.3847/1538-3881/abbe1a
- S. M. Frith et al. (2020) Frith, S. M., Bhartia, P. K., Oman, L. D., et al. 2020, \bibinfotitleModel-based climatology of diurnal variability in stratospheric ozone as a data analysis tool, Atmospheric Measurement Techniques, 13, 2733, doi: 10.5194/amt-13-2733-2020
- S. Ganguly et al. (2023) Ganguly, S., Li, Y., Olivares, V., et al. 2023, \bibinfotitleThe nature of the motions of multiphase filaments in the centers of galaxy clusters, Frontiers in Astronomy and Space Sciences, 10, 1138613, doi: 10.3389/fspas.2023.1138613
- S. Garc´ıa-Burillo et al. (2014) García-Burillo, S., Combes, F., Usero, A., et al. 2014, \bibinfotitleMolecular line emission in NGC 1068 imaged with ALMA. I. An AGN-driven outflow in the dense molecular gas, A&A, 567, A125, doi: 10.1051/0004-6361/201423843
- M. Gaspari et al. (2013) Gaspari, M., Ruszkowski, M., & Oh, S. P. 2013, \bibinfotitleChaotic cold accretion on to black holes, MNRAS, 432, 3401, doi: 10.1093/mnras/stt692
- M. Gaspari et al. (2020) Gaspari, M., Tombesi, F., & Cappi, M. 2020, \bibinfotitleLinking macro-, meso- and microscales in multiphase AGN feeding and feedback, Nature Astronomy, 4, 10, doi: 10.1038/s41550-019-0970-1
- K. Gebhardt & J. Thomas (2009) Gebhardt, K., & Thomas, J. 2009, \bibinfotitleThe Black Hole Mass, Stellar Mass-to-Light Ratio, and Dark Halo in M87, ApJ, 700, 1690, doi: 10.1088/0004-637X/700/2/1690
- M. Gerin et al. (2024) Gerin, M., Liszt, H., Pety, J., & Faure, A. 2024, \bibinfotitleH2CO and CS in diffuse clouds: Excitation and abundance, A&A, 686, A49, doi: 10.1051/0004-6361/202449152
- M. Giroletti et al. (2012) Giroletti, M., Hada, K., Giovannini, G., et al. 2012, \bibinfotitleThe kinematic of HST-1 in the jet of M 87, A&A, 538, L10, doi: 10.1051/0004-6361/201218794
- N. Y. Gnedin & B. T. Draine (2014) Gnedin, N. Y., & Draine, B. T. 2014, \bibinfotitleLine Overlap and Self-Shielding of Molecular Hydrogen in Galaxies, ApJ, 795, 37, doi: 10.1088/0004-637X/795/1/37
- B. Godard et al. (2010) Godard, B., Falgarone, E., Gerin, M., Hily-Blant, P., & de Luca, M. 2010, \bibinfotitleMolecular absorption lines toward star-forming regions: a comparative study of HCO+, HNC, HCN, and CN, A&A, 520, A20, doi: 10.1051/0004-6361/201014283
- C. Goddi et al. (2019) Goddi, C., Martí-Vidal, I., Messias, H., et al. 2019, \bibinfotitleCalibration of ALMA as a Phased Array. ALMA Observations During the 2017 VLBI Campaign, PASP, 131, 075003, doi: 10.1088/1538-3873/ab136a
- C. Goddi et al. (2021) Goddi, C., Martí-Vidal, I., Messias, H., et al. 2021, \bibinfotitlePolarimetric Properties of Event Horizon Telescope Targets from ALMA, ApJ, 910, L14, doi: 10.3847/2041-8213/abee6a
- C. J. Grier et al. (2016) Grier, C. J., Brandt, W. N., Hall, P. B., et al. 2016, \bibinfotitleC IV Broad Absorption Line Acceleration in Sloan Digital Sky Survey Quasars, ApJ, 824, 130, doi: 10.3847/0004-637X/824/2/130
- H. E. S. S. Collaboration et al. (2011) H. E. S. S. Collaboration, Abramowski, A., Acero, F., et al. 2011, \bibinfotitleDetection of very-high-energy -ray emission from the vicinity of PSR B1706-44 and G 343.1-2.3 with H.E.S.S., A&A, 528, A143, doi: 10.1051/0004-6361/201015381
- K. Hada (2017) Hada, K. 2017, \bibinfotitleThe Structure and Propagation of the Misaligned Jet M87, Galaxies, 5, 2, doi: 10.3390/galaxies5010002
- K. Hada et al. (2014) Hada, K., Giroletti, M., Kino, M., et al. 2014, \bibinfotitleA Strong Radio Brightening at the Jet Base of M 87 during the Elevated Very High Energy Gamma-Ray State in 2012, ApJ, 788, 165, doi: 10.1088/0004-637X/788/2/165
- K. Hada et al. (2016) Hada, K., Kino, M., Doi, A., et al. 2016, \bibinfotitleHigh-sensitivity 86 GHz (3.5 mm) VLBI Observations of M87: Deep Imaging of the Jet Base at a Resolution of 10 Schwarzschild Radii, ApJ, 817, 131, doi: 10.3847/0004-637X/817/2/131
- K. Hada et al. (2017) Hada, K., Park, J. H., Kino, M., et al. 2017, \bibinfotitlePilot KaVA monitoring on the M 87 jet: Confirming the inner jet structure and superluminal motions at sub-pc scales, PASJ, 69, 71, doi: 10.1093/pasj/psx054
- R. J. Harms et al. (1994) Harms, R. J., Ford, H. C., Tsvetanov, Z. I., et al. 1994, \bibinfotitleHST FOS Spectroscopy of M87: Evidence for a Disk of Ionized Gas around a Massive Black Hole, ApJ, 435, L35, doi: 10.1086/187588
- T. M. Heckman et al. (1989) Heckman, T. M., Baum, S. A., van Breugel, W. J. M., & McCarthy, P. 1989, \bibinfotitleDynamical, Physical, and Chemical Properties of Emission-Line Nebulae in Cooling Flows, ApJ, 338, 48, doi: 10.1086/167181
- P. Hennebelle (2013) Hennebelle, P. 2013, \bibinfotitleOn the origin of non-self-gravitating filaments in the ISM, A&A, 556, A153, doi: 10.1051/0004-6361/201321292
- R. Herrera-Camus et al. (2020) Herrera-Camus, R., Janssen, A., Sturm, E., et al. 2020, \bibinfotitleAGN feedback in a galaxy merger: multi-phase, galaxy-scale outflows with a fast molecular gas blob 6 kpc away from IRAS F08572+3915, A&A, 635, A47, doi: 10.1051/0004-6361/201936434
- L. C. Ho et al. (1997) Ho, L. C., Filippenko, A. V., & Sargent, W. L. W. 1997, \bibinfotitleA Search for “Dwarf” Seyfert Nuclei. III. Spectroscopic Parameters and Properties of the Host Galaxies, ApJS, 112, 315, doi: 10.1086/313041
- T. Hunter et al. (2018) Hunter, T., Phillips, N., Broguiére, D., & Gonzalez, J. 2018, \bibinfotitleALMA Development Study Final Report: Improving the calibration of atmospheric spectral features in ALMA data, NRAO
- K. Immer et al. (2024) Immer, K., et al. 2024, \bibinfotitleALMA Observing Tool User Manual,
- K. Inayoshi et al. (2020) Inayoshi, K., Ichikawa, K., & Ho, L. C. 2020, \bibinfotitleUniversal Transition Diagram from Dormant to Actively Accreting Supermassive Black Holes, ApJ, 894, 141, doi: 10.3847/1538-4357/ab8569
- R. Indebetouw et al. (2020) Indebetouw, R., Wong, T., Chen, C. H. R., et al. 2020, \bibinfotitleStructural and Dynamical Analysis of 0.1 pc Cores and Filaments in the 30 Doradus-10 Giant Molecular Cloud, ApJ, 888, 56, doi: 10.3847/1538-4357/ab5db7
- F. P. Israel (1992) Israel, F. P. 1992, \bibinfotitleMolecular-line emission from the centres of Centaurus A and other southern galaxies., A&A, 265, 487
- W. Jaffe (1987) Jaffe, W. 1987, \bibinfotitleLimits on the cool gas content of NGC 1275 and M 87, A&A, 171, 378
- J. S. Kaastra et al. (2014) Kaastra, J. S., Kriss, G. A., Cappi, M., et al. 2014, \bibinfotitleA fast and long-lived outflow from the supermassive black hole in NGC 5548, Science, 345, 64, doi: 10.1126/science.1253787
- S. Kameno (2014) Kameno, S. 2014, \bibinfotitleALMA Cross Correlation Bandpass Stability,, Tech. rep., JAO/NAOJ
- S. Kameno et al. (2020) Kameno, S., Sawada-Satoh, S., Impellizzeri, C. M. V., et al. 2020, \bibinfotitleA Massive Molecular Torus inside a Gas-poor Circumnuclear Disk in the Radio Galaxy NGC 1052 Discovered with ALMA, ApJ, 895, 73, doi: 10.3847/1538-4357/ab8bd6
- J. Y. Kim et al. (2018) Kim, J. Y., Krichbaum, T. P., Lu, R. S., et al. 2018, \bibinfotitleThe limb-brightened jet of M87 down to the 7 Schwarzschild radii scale, A&A, 616, A188, doi: 10.1051/0004-6361/201832921
- A. Klitsch et al. (2019) Klitsch, A., Péroux, C., Zwaan, M. A., et al. 2019, \bibinfotitleALMACAL - VI. Molecular gas mass density across cosmic time via a blind search for intervening molecular absorbers, MNRAS, 490, 1220, doi: 10.1093/mnras/stz2660
- E. W. Koch & E. W. Rosolowsky (2015) Koch, E. W., & Rosolowsky, E. W. 2015, \bibinfotitleFilament identification through mathematical morphology, MNRAS, 452, 3435, doi: 10.1093/mnras/stv1521
- T. Kokusho et al. (2019) Kokusho, T., Kaneda, H., Bureau, M., et al. 2019, \bibinfotitleDust properties in the cold and hot gas phases of the ATLAS3D early-type galaxies as revealed by AKARI, A&A, 622, A87, doi: 10.1051/0004-6361/201833911
- S. Komugi et al. (2022) Komugi, S., Toba, Y., Matsuoka, Y., Saito, T., & Yamashita, T. 2022, \bibinfotitleDetection of Extended Millimeter Emission in the Host Galaxy of 3C 273 and Its Implications for QSO Feedback via High Dynamic Range ALMA Imaging, ApJ, 930, 3, doi: 10.3847/1538-4357/ac616e
- V. Könyves et al. (2020) Könyves, V., André, P., Arzoumanian, D., et al. 2020, \bibinfotitleProperties of the dense core population in Orion B as seen by the Herschel Gould Belt survey, A&A, 635, A34, doi: 10.1051/0004-6361/201834753
- C. Y. Kuo et al. (2014) Kuo, C. Y., Asada, K., Rao, R., et al. 2014, \bibinfotitleMeasuring Mass Accretion Rate onto the Supermassive Black Hole in M87 Using Faraday Rotation Measure with the Submillimeter Array, ApJ, 783, L33, doi: 10.1088/2041-8205/783/2/L33
- A. K. Leroy et al. (2021) Leroy, A. K., Hughes, A., Liu, D., et al. 2021, \bibinfotitlePHANGS-ALMA Data Processing and Pipeline, ApJS, 255, 19, doi: 10.3847/1538-4365/abec80
- E. R. Liepold et al. (2023) Liepold, E. R., Ma, C.-P., & Walsh, J. L. 2023, \bibinfotitleKeck Integral-field Spectroscopy of M87 Reveals an Intrinsically Triaxial Galaxy and a Revised Black Hole Mass, ApJ, 945, L35, doi: 10.3847/2041-8213/acbbcf
- J. Lim et al. (2017) Lim, J., Dinh-V-Trung, Vrtilek, J., David, L. P., & Forman, W. 2017, \bibinfotitleThe Role of Electron Excitation and Nature of Molecular Gas in Cluster Central Elliptical Galaxies, ApJ, 850, 31, doi: 10.3847/1538-4357/aa9275
- H. Liszt et al. (2019) Liszt, H., Gerin, M., & Grenier, I. 2019, \bibinfotitleStanding in the shadow of dark gas: ALMA observations of absorption from dark CO in the molecular dark neutral medium of Chamaeleon, A&A, 627, A95, doi: 10.1051/0004-6361/201935436
- H. Liszt & R. Lucas (2004) Liszt, H., & Lucas, R. 2004, \bibinfotitleMm-wave HCO+, HCN and CO absorption toward NGC 1052, A&A, 428, 445, doi: 10.1051/0004-6361:20041650
- H. S. Liszt & R. Lucas (1998) Liszt, H. S., & Lucas, R. 1998, \bibinfotitleCO in absorption and emission toward compact extragalactic radio continuum sources, A&A, 339, 561
- H. S. Liszt & J. Pety (2012) Liszt, H. S., & Pety, J. 2012, \bibinfotitleImaging diffuse clouds: bright and dark gas mapped in CO, A&A, 541, A58, doi: 10.1051/0004-6361/201218771
- A. Longobardi et al. (2015) Longobardi, A., Arnaboldi, M., Gerhard, O., & Mihos, J. C. 2015, \bibinfotitleThe build-up of the cD halo of M 87: evidence for accretion in the last Gyr, A&A, 579, L3, doi: 10.1051/0004-6361/201526282
- R.-S. Lu et al. (2023) Lu, R.-S., Asada, K., Krichbaum, T. P., et al. 2023, \bibinfotitleA ring-like accretion structure in M87 connecting its black hole and jet, Nature, 616, 686, doi: 10.1038/s41586-023-05843-w
- F. Macchetto et al. (1997) Macchetto, F., Marconi, A., Axon, D. J., et al. 1997, \bibinfotitleThe Supermassive Black Hole of M87 and the Kinematics of Its Associated Gaseous Disk, ApJ, 489, 579, doi: 10.1086/304823
- J. P. Madrid et al. (2007) Madrid, J. P., Sparks, W. B., Harris, D. E., et al. 2007, \bibinfotitleDeep Hubble space telescope ultraviolet imaging of the M87 jet, Ap&SS, 311, 329, doi: 10.1007/s10509-007-9528-2
- J. Mangum & Y. Shirley (2015) Mangum, J., & Shirley, Y. 2015, \bibinfotitleHow to Calculate Molecular Column Density, Publications of the Astronomical Society of the Pacific, 127, doi: 10.1086/680323
- M. Margulis & R. L. Snell (1989) Margulis, M., & Snell, R. L. 1989, \bibinfotitleVery High Velocity Emission from Molecular Outflows, ApJ, 343, 779, doi: 10.1086/167749
- H. L. Marshall et al. (2002) Marshall, H. L., Miller, B. P., Davis, D. S., et al. 2002, \bibinfotitleA High-Resolution X-Ray Image of the Jet in M87, ApJ, 564, 683, doi: 10.1086/324396
- W. G. Mathews & F. Brighenti (2003) Mathews, W. G., & Brighenti, F. 2003, \bibinfotitleHot Gas in and around Elliptical Galaxies, ARA&A, 41, 191, doi: 10.1146/annurev.astro.41.090401.094542
- S. Matsushita et al. (2017) Matsushita, S., Asaki, Y., Fomalont, E. B., et al. 2017, \bibinfotitleALMA Long Baseline Campaigns: Phase Characteristics of Atmosphere at Long Baselines in the Millimeter and Submillimeter Wavelengths, PASP, 129, 035004, doi: 10.1088/1538-3873/aa5787
- L. T. Maud et al. (2023) Maud, L. T., Pérez-Sánchez, A. F., Asaki, Y., et al. 2023, \bibinfotitleUpdates to ALMA Site Properties: using the ESO-Allegro Phase RMS database – ALMA Memo 624, arXiv e-prints, arXiv:2304.08318, doi: 10.48550/arXiv.2304.08318
- J. P. McMullin et al. (2007) McMullin, J. P., Waters, B., Schiebel, D., Young, W., & Golap, K. 2007, in Astronomical Society of the Pacific Conference Series, Vol. 376, Astronomical Data Analysis Software and Systems XVI, ed. R. A. Shaw, F. Hill, & D. J. Bell, 127
- G. S. Meena (2010) Meena, G. S. 2010, \bibinfotitleTotal column density variations of ozone (O3) in presence of different types of clouds, Journal of Earth System Science, 119, 249, doi: 10.1007/s12040-010-0024-7
- T. Misawa et al. (2014) Misawa, T., Charlton, J. C., & Eracleous, M. 2014, \bibinfotitleMonitoring the Variability of Intrinsic Absorption Lines in Quasar Spectra, ApJ, 792, 77, doi: 10.1088/0004-637X/792/1/77
- T. Misawa et al. (2019) Misawa, T., Eracleous, M., Charlton, J. C., & Kashikawa, N. 2019, \bibinfotitleDirect Measurement of Quasar Outflow Wind Acceleration, ApJ, 870, 68, doi: 10.3847/1538-4357/aaf0fe
- J. R. Mould et al. (2000) Mould, J. R., Huchra, J. P., Freedman, W. L., et al. 2000, \bibinfotitleThe Hubble Space Telescope Key Project on the Extragalactic Distance Scale. XXVIII. Combining the Constraints on the Hubble Constant, ApJ, 529, 786, doi: 10.1086/308304
- H. S. P. Müller et al. (2005) Müller, H. S. P., Schlöder, F., Stutzki, J., & Winnewisser, G. 2005, \bibinfotitleThe Cologne Database for Molecular Spectroscopy, CDMS: a useful tool for astronomers and spectroscopists, Journal of Molecular Structure, 742, 215, doi: 10.1016/j.molstruc.2005.01.027
- H. Nagai et al. (2019) Nagai, H., Onishi, K., Kawakatu, N., et al. 2019, \bibinfotitleThe ALMA Discovery of the Rotating Disk and Fast Outflow of Cold Molecular Gas in NGC 1275, ApJ, 883, 193, doi: 10.3847/1538-4357/ab3e6e
- E. V. North et al. (2019) North, E. V., Davis, T. A., Bureau, M., et al. 2019, \bibinfotitleWISDOM project - V. Resolving molecular gas in Keplerian rotation around the supermassive black hole in NGC 0383, MNRAS, 490, 319, doi: 10.1093/mnras/stz2598
- B. Ocaña Flaquer et al. (2010) Ocaña Flaquer, B., Leon, S., Combes, F., & Lim, J. 2010, \bibinfotitleTANGO I: Interstellar medium in nearby radio galaxies. Molecular gas, A&A, 518, A9, doi: 10.1051/0004-6361/200913392
- V. Olivares et al. (2019) Olivares, V., Salome, P., Combes, F., et al. 2019, \bibinfotitleUbiquitous cold and massive filaments in cool core clusters, A&A, 631, A22, doi: 10.1051/0004-6361/201935350
- J. Osorno et al. (2023) Osorno, J., Nagar, N., Richtler, T., et al. 2023, \bibinfotitleRevisiting the black hole mass of M 87 using VLT/MUSE adaptive optics integral field unit data. I. Ionized gas kinematics, A&A, 679, A37, doi: 10.1051/0004-6361/202346549
- S. Paine (2018) Paine, S. 2018, \bibinfotitleThe am atmospheric model,, 10.0, Zenodo Zenodo, doi: 10.5281/zenodo.1193771
- G. V. Panopoulou et al. (2016) Panopoulou, G. V., Psaradaki, I., & Tassis, K. 2016, \bibinfotitleThe magnetic field and dust filaments in the Polaris Flare, MNRAS, 462, 1517, doi: 10.1093/mnras/stw1678
- J. Pardo (2024) Pardo, J. 2024, \bibinfotitleImproved and tested atmospheric model above 300 GHz,, https://www.eso.org/sci/facilities/alma/developmentstudies/20240703154158_20240703_FINAL_ESO_19-25417-HNE_REPORT-merged-1.pdf ESO
- J. Pardo et al. (2001) Pardo, J., Cernicharo, J., & Serabyn, E. 2001, \bibinfotitleAtmospheric transmission at microwaves (ATM): an improved model for millimeter/submillimeter applications, IEEE Transactions on Antennas and Propagation, 49, 1683, doi: 10.1109/8.982447
- J. R. Pardo (2019) Pardo, J. R. 2019, in ALMA Development Workshop, 36, doi: 10.5281/zenodo.3240379
- J. Park et al. (2019) Park, J., Hada, K., Kino, M., et al. 2019, \bibinfotitleKinematics of the M87 Jet in the Collimation Zone: Gradual Acceleration and Velocity Stratification, ApJ, 887, 147, doi: 10.3847/1538-4357/ab5584
- A. Pasetto et al. (2021) Pasetto, A., Carrasco-González, C., Gómez, J. L., et al. 2021, \bibinfotitleReading M87’s DNA: A Double Helix Revealing a Large-scale Helical Magnetic Field, ApJ, 923, L5, doi: 10.3847/2041-8213/ac3a88
- T. Pasini et al. (2021) Pasini, T., Finoguenov, A., Brüggen, M., et al. 2021, \bibinfotitleRadio galaxies in galaxy groups: kinematics, scaling relations, and AGN feedback, MNRAS, 505, 2628, doi: 10.1093/mnras/stab1451
- C. Y. Peng et al. (2002) Peng, C. Y., Ho, L. C., Impey, C. D., & Rix, H.-W. 2002, \bibinfotitleDetailed Structural Decomposition of Galaxy Images, AJ, 124, 266, doi: 10.1086/340952
- E. S. Perlman et al. (2001) Perlman, E. S., Sparks, W. B., Radomski, J., et al. 2001, \bibinfotitleDeep 10 Micron Imaging of M87, ApJ, 561, L51, doi: 10.1086/324515
- E. S. Perlman et al. (2007) Perlman, E. S., Mason, R. E., Packham, C., et al. 2007, \bibinfotitleThe Mid-Infrared Emission of M87, ApJ, 663, 808, doi: 10.1086/518781
- H. M. Pickett et al. (1998) Pickett, H. M., Poynter, R. L., Cohen, E. A., et al. 1998, \bibinfotitleSubmillimeter, millimeter and microwave spectral line catalog., J. Quant. Spec. Radiat. Transf., 60, 883, doi: 10.1016/S0022-4073(98)00091-0
- J. L. Pineda et al. (2010) Pineda, J. L., Goldsmith, P. F., Chapman, N., et al. 2010, \bibinfotitleThe Relation Between Gas and Dust in the Taurus Molecular Cloud, ApJ, 721, 686, doi: 10.1088/0004-637X/721/1/686
- Planck Collaboration et al. (2016) Planck Collaboration, Ade, P. A. R., Aghanim, N., et al. 2016, \bibinfotitlePlanck 2015 results. XIII. Cosmological parameters, A&A, 594, A13, doi: 10.1051/0004-6361/201525830
- R. W. Pogge et al. (2000) Pogge, R. W., Maoz, D., Ho, L. C., & Eracleous, M. 2000, \bibinfotitleThe Narrow-Line Regions of LINERS as Resolved with the Hubble Space Telescope, ApJ, 532, 323, doi: 10.1086/308567
- Porbital (2024) Porbital. 2024, \bibinfotitlePlotDigitizer: Version 3.1.6, https://plotdigitizer.com
- I. Prandoni et al. (2010) Prandoni, I., Laing, R. A., de Ruiter, H. R., & Parma, P. 2010, \bibinfotitleMolecular disks in radio galaxies. The pathway to ALMA, A&A, 523, A38, doi: 10.1051/0004-6361/201015456
- M. A. Prieto et al. (2016) Prieto, M. A., Fernández-Ontiveros, J. A., Markoff, S., Espada, D., & González-Martín, O. 2016, \bibinfotitleThe central parsecs of M87: jet emission and an elusive accretion disc, MNRAS, 457, 3801, doi: 10.1093/mnras/stw166
- G. Privon et al. (2024) Privon, G., et al. 2024, ALMA Proposer’s Guide, ALMA Doc. 11.2, ver. 1.0, doi: 10.5281/zenodo.4511961
- F. A. Pulido et al. (2018) Pulido, F. A., McNamara, B. R., Edge, A. C., et al. 2018, \bibinfotitleThe Origin of Molecular Clouds in Central Galaxies, ApJ, 853, 177, doi: 10.3847/1538-4357/aaa54b
- B. Rappenglück et al. (2014) Rappenglück, B., Ackermann, L., Alvarez, S., et al. 2014, \bibinfotitleStrong wintertime ozone events in the Upper Green River basin, Wyoming, Atmospheric Chemistry and Physics, 14, 4909, doi: 10.5194/acp-14-4909-2014
- M. J. Reid et al. (1989) Reid, M. J., Biretta, J. A., Junor, W., Muxlow, T. W. B., & Spencer, R. E. 1989, \bibinfotitleSubluminal Motion and Limb Brightening in the Nuclear Jet of M87, ApJ, 336, 112, doi: 10.1086/166998
- A. M. S. Richards et al. (2022) Richards, A. M. S., Moravec, E., Etoka, S., et al. 2022, \bibinfotitleSelf-calibration and improving image fidelity for ALMA and other radio interferometers, arXiv e-prints, arXiv:2207.05591, doi: 10.48550/arXiv.2207.05591
- R. A. Riffel et al. (2020) Riffel, R. A., Storchi-Bergmann, T., Zakamska, N. L., & Riffel, R. 2020, \bibinfotitleIonized and hot molecular outflows in the inner 500 pc of NGC 1275, MNRAS, 496, 4857, doi: 10.1093/mnras/staa1922
- A. Rivera-Ingraham et al. (2016) Rivera-Ingraham, A., Ristorcelli, I., Juvela, M., et al. 2016, \bibinfotitleGalactic cold cores. VII. Filament formation and evolution: Methods and observational constraints, A&A, 591, A90, doi: 10.1051/0004-6361/201526263
- J. Roman-Duval et al. (2010) Roman-Duval, J., Jackson, J. M., Heyer, M., Rathborne, J., & Simon, R. 2010, \bibinfotitlePhysical Properties and Galactic Distribution of Molecular Clouds Identified in the Galactic Ring Survey, ApJ, 723, 492, doi: 10.1088/0004-637X/723/1/492
- T. Rose et al. (2019a) Rose, T., Edge, A. C., Combes, F., et al. 2019a, \bibinfotitleConstraining cold accretion on to supermassive black holes: molecular gas in the cores of eight brightest cluster galaxies revealed by joint CO and CN absorption, MNRAS, 489, 349, doi: 10.1093/mnras/stz2138
- T. Rose et al. (2019b) Rose, T., Edge, A. C., Combes, F., et al. 2019b, \bibinfotitleDeep and narrow CO absorption revealing molecular clouds in the Hydra-A brightest cluster galaxy, MNRAS, 485, 229, doi: 10.1093/mnras/stz406
- T. Rose et al. (2020) Rose, T., Edge, A. C., Combes, F., et al. 2020, \bibinfotitleA molecular absorption line survey towards the AGN of Hydra-A, MNRAS, 496, 364, doi: 10.1093/mnras/staa1474
- E. Rosolowsky et al. (2021) Rosolowsky, E., Hughes, A., Leroy, A. K., et al. 2021, \bibinfotitleGiant molecular cloud catalogues for PHANGS-ALMA: methods and initial results, MNRAS, 502, 1218, doi: 10.1093/mnras/stab085
- I. Ruffa et al. (2022) Ruffa, I., Prandoni, I., Davis, T. A., et al. 2022, \bibinfotitleThe AGN fuelling/feedback cycle in nearby radio galaxies - IV. Molecular gas conditions and jet-ISM interaction in NGC 3100, MNRAS, 510, 4485, doi: 10.1093/mnras/stab3541
- I. Ruffa et al. (2019) Ruffa, I., Prandoni, I., Laing, R. A., et al. 2019, \bibinfotitleThe AGN fuelling/feedback cycle in nearby radio galaxies I. ALMA observations and early results, MNRAS, 484, 4239, doi: 10.1093/mnras/stz255
- M. R. Rugel et al. (2018) Rugel, M. R., Beuther, H., Bihr, S., et al. 2018, \bibinfotitleOH absorption in the first quadrant of the Milky Way as seen by THOR, A&A, 618, A159, doi: 10.1051/0004-6361/201731872
- J. E. Ryon (2022) Ryon, J. E. 2022, in ACS Instrument Handbook for Cycle 30 v. 21.0, Vol. 21, 21
- B. M. Sabra et al. (2003) Sabra, B. M., Shields, J. C., Ho, L. C., Barth, A. J., & Filippenko, A. V. 2003, \bibinfotitleEmission and Absorption in the M87 LINER, ApJ, 584, 164, doi: 10.1086/345664
- E. M. Sadler et al. (2008) Sadler, E. M., Ricci, R., Ekers, R. D., et al. 2008, \bibinfotitleThe extragalactic radio-source population at 95GHz, MNRAS, 385, 1656, doi: 10.1111/j.1365-2966.2008.12955.x
- C. Safranek-Shrader et al. (2017) Safranek-Shrader, C., Krumholz, M. R., Kim, C.-G., et al. 2017, \bibinfotitleChemistry and radiative shielding in star-forming galactic discs, MNRAS, 465, 885, doi: 10.1093/mnras/stw2647
- P. Salomé & F. Combes (2003) Salomé, P., & Combes, F. 2003, \bibinfotitleCold molecular gas in cooling flow clusters of galaxies, A&A, 412, 657, doi: 10.1051/0004-6361:20031438
- P. Salomé & F. Combes (2008) Salomé, P., & Combes, F. 2008, \bibinfotitleSearch for cold gas along radio lobes in the cooling core galaxies MS0735.6+7421 and M87, A&A, 489, 101, doi: 10.1051/0004-6361:200810262
- R. Sancisi et al. (2008) Sancisi, R., Fraternali, F., Oosterloo, T., & van der Hulst, T. 2008, \bibinfotitleCold gas accretion in galaxies, A&A Rev., 15, 189, doi: 10.1007/s00159-008-0010-0
- K. M. Sandstrom et al. (2013) Sandstrom, K. M., Leroy, A. K., Walter, F., et al. 2013, \bibinfotitleThe CO-to-H2 Conversion Factor and Dust-to-gas Ratio on Kiloparsec Scales in Nearby Galaxies, ApJ, 777, 5, doi: 10.1088/0004-637X/777/1/5
- R. Sankrit et al. (1999) Sankrit, R., Sembach, K. R., & Canizares, C. R. 1999, \bibinfotitleHubble Space Telescope/Faint Object Spectrograph Observations of M87:Ly Emission from the Active Galactic Nucleus, ApJ, 527, 733, doi: 10.1086/308115
- L. Saripalli (2012) Saripalli, L. 2012, \bibinfotitleUnderstanding the Fanaroff-Riley Radio Galaxy Classification, AJ, 144, 85, doi: 10.1088/0004-6256/144/3/85
- N. Z. Scoville (2013) Scoville, N. Z. 2013, in Secular Evolution of Galaxies, ed. J. Falcón-Barroso & J. H. Knapen (Cambridge University Press), 491, doi: 10.48550/arXiv.1210.6990
- J. Shangguan et al. (2020) Shangguan, J., Ho, L. C., Bauer, F. E., Wang, R., & Treister, E. 2020, \bibinfotitleAn ALMA CO(2-1) Survey of Nearby Palomar-Green Quasars, ApJS, 247, 15, doi: 10.3847/1538-4365/ab5db2
- R. Shetty et al. (2012) Shetty, R., Beaumont, C. N., Burton, M. G., Kelly, B. C., & Klessen, R. S. 2012, \bibinfotitleThe linewidth-size relationship in the dense interstellar medium of the Central Molecular Zone, MNRAS, 425, 720, doi: 10.1111/j.1365-2966.2012.21588.x
- R. Shibata et al. (2001) Shibata, R., Matsushita, K., Yamasaki, N. Y., et al. 2001, \bibinfotitleTemperature Map of the Virgo Cluster of Galaxies Observed with ASCA, ApJ, 549, 228, doi: 10.1086/319075
- A. Simionescu et al. (2018) Simionescu, A., Tremblay, G., Werner, N., et al. 2018, \bibinfotitleALMA observation of the disruption of molecular gas in M87, MNRAS, 475, 3004, doi: 10.1093/mnras/sty047
- D. A. Simon et al. (2024) Simon, D. A., Cappellari, M., & Hartke, J. 2024, \bibinfotitleSupermassive black hole mass in the massive elliptical galaxy M87 from integral-field stellar dynamics using OASIS and MUSE with adaptive optics: assessing systematic uncertainties, MNRAS, 527, 2341, doi: 10.1093/mnras/stad3309
- M. D. Smith et al. (2021) Smith, M. D., Bureau, M., Davis, T. A., et al. 2021, \bibinfotitleWISDOM project - VI. Exploring the relation between supermassive black hole mass and galaxy rotation with molecular gas, MNRAS, 500, 1933, doi: 10.1093/mnras/staa3274
- T. P. Snow & B. J. McCall (2006) Snow, T. P., & McCall, B. J. 2006, \bibinfotitleDiffuse Atomic and Molecular Clouds, ARA&A, 44, 367, doi: 10.1146/annurev.astro.43.072103.150624
- U. J. Sofia et al. (2004) Sofia, U. J., Lauroesch, J. T., Meyer, D. M., & Cartledge, S. I. B. 2004, \bibinfotitleInterstellar Carbon in Translucent Sight Lines, ApJ, 605, 272, doi: 10.1086/382592
- P. M. Solomon et al. (1987) Solomon, P. M., Rivolo, A. R., Barrett, J., & Yahil, A. 1987, \bibinfotitleMass, Luminosity, and Line Width Relations of Galactic Molecular Clouds, ApJ, 319, 730, doi: 10.1086/165493
- W. B. Sparks et al. (2004) Sparks, W. B., Donahue, M., Jordán, A., Ferrarese, L., & Côté, P. 2004, \bibinfotitleX-Ray and Optical Filaments in M87, ApJ, 607, 294, doi: 10.1086/383189
- W. B. Sparks et al. (1993) Sparks, W. B., Ford, H. C., & Kinney, A. L. 1993, \bibinfotitleThe Dusty Emission Filaments of M87, ApJ, 413, 531, doi: 10.1086/173022
- M. Stone et al. (2016) Stone, M., Veilleux, S., Meléndez, M., et al. 2016, \bibinfotitleThe Search for Molecular Outflows in Local Volume AGNs with Herschel-PACS, ApJ, 826, 111, doi: 10.3847/0004-637X/826/2/111
- C. Tadhunter (2008) Tadhunter, C. 2008, \bibinfotitleAn introduction to active galactic nuclei: Classification and unification, New A Rev., 52, 227, doi: 10.1016/j.newar.2008.06.004
- J. C. Tan et al. (2008) Tan, J. C., Beuther, H., Walter, F., & Blackman, E. G. 2008, \bibinfotitleA Search for Molecular Gas in the Nucleus of M87 and Implications for the Fueling of Supermassive Black Holes, ApJ, 689, 775, doi: 10.1086/592592
- T. R. Taylor et al. (2020) Taylor, T. R., Chao, C.-T., & Chiou, J.-S. 2020, \bibinfotitleNovel Deep Level Image State Ensemble Enhancement Method for M87 Imaging, Applied Sciences, 10, doi: 10.3390/app10113952
- P. Temi et al. (2018) Temi, P., Amblard, A., Gitti, M., et al. 2018, \bibinfotitleALMA Observations of Molecular Clouds in Three Group-centered Elliptical Galaxies: NGC 5846, NGC 4636, and NGC 5044, ApJ, 858, 17, doi: 10.3847/1538-4357/aab9b0
- G. R. Tremblay et al. (2018) Tremblay, G. R., Combes, F., Oonk, J. B. R., et al. 2018, \bibinfotitleA Galaxy-scale Fountain of Cold Molecular Gas Pumped by a Black Hole, ApJ, 865, 13, doi: 10.3847/1538-4357/aad6dd
- J. R. Trump et al. (2011) Trump, J. R., Impey, C. D., Kelly, B. C., et al. 2011, \bibinfotitleAccretion Rate and the Physical Nature of Unobscured Active Galaxies, ApJ, 733, 60, doi: 10.1088/0004-637X/733/1/60
- T. Tsukui et al. (2023) Tsukui, T., Iguchi, S., Mitsuhashi, I., & Tadaki, K. 2023, \bibinfotitleEstimating the statistical uncertainty due to spatially correlated noise in interferometric images, Journal of Astronomical Telescopes, Instruments, and Systems, 9, 018001, doi: 10.1117/1.JATIS.9.1.018001
- Z. I. Tsvetanov et al. (1999a) Tsvetanov, Z. I., Allen, M. G., Ford, H. C., & Harms, R. J. 1999a, in The Radio Galaxy Messier 87, ed. H.-J. Röser & K. Meisenheimer, Vol. 530, 301, doi: 10.1007/BFb0106441
- Z. I. Tsvetanov et al. (1999b) Tsvetanov, Z. I., Hartig, G. F., Ford, H. C., et al. 1999b, in The Radio Galaxy Messier 87, ed. H.-J. Röser & K. Meisenheimer, Vol. 530, 307, doi: 10.1007/BFb0106442
- A. Usero et al. (2019) Usero, A., et al. 2019, \bibinfotitleContamination by a Telluric O3 Line in PHANGS CO(2–1) TP data,
- D. Utomo et al. (2015) Utomo, D., Blitz, L., Davis, T., et al. 2015, \bibinfotitleGiant Molecular Clouds in the Early-type Galaxy NGC 4526, ApJ, 803, 16, doi: 10.1088/0004-637X/803/1/16
- F. F. S. van der Tak et al. (2007) van der Tak, F. F. S., Black, J. H., Schöier, F. L., Jansen, D. J., & van Dishoeck, E. F. 2007, \bibinfotitleA computer program for fast non-LTE analysis of interstellar line spectra. With diagnostic plots to interpret observed line intensity ratios, A&A, 468, 627, doi: 10.1051/0004-6361:20066820
- S. Veilleux et al. (2013) Veilleux, S., Meléndez, M., Sturm, E., et al. 2013, \bibinfotitleFast Molecular Outflows in Luminous Galaxy Mergers: Evidence for Quasar Feedback from Herschel, ApJ, 776, 27, doi: 10.1088/0004-637X/776/1/27
- S. Viaene et al. (2017) Viaene, S., Sarzi, M., Baes, M., Fritz, J., & Puerari, I. 2017, \bibinfotitleMUSE stares into the shadows: the high-resolution dust attenuation curve of NGC 5626, MNRAS, 472, 1286, doi: 10.1093/mnras/stx1781
- R. C. Walker et al. (2018) Walker, R. C., Hardee, P. E., Davies, F. B., Ly, C., & Junor, W. 2018, \bibinfotitleThe Structure and Dynamics of the Subparsec Jet in M87 Based on 50 VLBA Observations over 17 Years at 43 GHz, ApJ, 855, 128, doi: 10.3847/1538-4357/aaafcc
- J. L. Walsh et al. (2013) Walsh, J. L., Barth, A. J., Ho, L. C., & Sarzi, M. 2013, \bibinfotitleThe M87 Black Hole Mass from Gas-dynamical Models of Space Telescope Imaging Spectrograph Observations, ApJ, 770, 86, doi: 10.1088/0004-637X/770/2/86
- A. S. Wilson & Y. Yang (2002) Wilson, A. S., & Yang, Y. 2002, \bibinfotitleChandra X-Ray Imaging and Spectroscopy of the M87 Jet and Nucleus, ApJ, 568, 133, doi: 10.1086/338887
- T. Wong et al. (2022) Wong, T., Oudshoorn, L., Sofovich, E., et al. 2022, \bibinfotitleThe 30 Doradus Molecular Cloud at 0.4 pc Resolution with the Atacama Large Millimeter/submillimeter Array: Physical Properties and the Boundedness of CO-emitting Structures, ApJ, 932, 47, doi: 10.3847/1538-4357/ac723a
- F. Yuan & R. Narayan (2014) Yuan, F., & Narayan, R. 2014, \bibinfotitleHot Accretion Flows Around Black Holes, ARA&A, 52, 529, doi: 10.1146/annurev-astro-082812-141003
- F. Yusef-Zadeh et al. (2022) Yusef-Zadeh, F., Arendt, R. G., Wardle, M., et al. 2022, \bibinfotitleStatistical Properties of the Population of the Galactic Center Filaments: the Spectral Index and Equipartition Magnetic Field, ApJ, 925, L18, doi: 10.3847/2041-8213/ac4802
- H.-M. Zhang et al. (2020) Zhang, H.-M., Wang, Z.-J., Zhang, J., et al. 2020, \bibinfotitleDiversity of -ray and radio variability of bright blazars and implications for -ray emission location, PASJ, 72, 44, doi: 10.1093/pasj/psaa029
- Q. Zhang et al. (2018) Zhang, Q., Ye, J., Zhang, S., & Han, F. 2018, \bibinfotitlePrecipitable Water Vapor Retrieval and Analysis by Multiple Data Sources: Ground-Based GNSS, Radio Occultation, Radiosonde, Microwave Satellite, and NWP Reanalysis Data, Journal of Sensors, 2018, 4909, doi: 10.1155/2018/3428303