Molecular-dynamics study of diffusional creep in uranium mononitride
Abstract
Uranium mononitride (UN) is a promising advanced nuclear fuel due to its high thermal conductivity and high fissile density. Yet, many aspects of its mechanical behavior and microstructural features are currently unknown. In this paper, molecular dynamics (MD) simulations are used to study UN’s diffusional creep. Nanometer-sized polycrystals are used to simulate diffusional creep and to calculate an effective GB width. It is found that Nabarro-Herring creep is not dominant in the temperature range of 1700–2000 K and that the dominant diffusional creep mechanism is Coble creep with an activation energy of 2.28 0.09 eV. A method is proposed to calculate the diffusional GB width and its temperature dependence in polycrystals. The effective GB width of UN is calculated as 2.69 0.08 nm. This value fits very well with the prefactor of the phenomenological Coble creep formula. It is demonstrated that the most comprehensive thermal creep model for UN can be represented as the combination of our Coble creep model and the dislocation creep model proposed by Hayes et al.
keywords:
uranium nitride , molecular dynamics , Coble creep , Nabarro-Herring creep , grain-boundary width , grain-boundary diffusion1 Introduction
Uranium mononitride (UN) is a potential next-generation nuclear fuel with several favorable properties like high fissile density, good heat transfer, compatibility with most potential cladding materials, and longer fuel residence periods [1, 2, 3]. However, it also has challenges like complex manufacturing processes, high cost due to 15N enrichment, and vulnerability to steam at high temperatures [1, 2, 3]. Many aspects of the mechanical behavior and microstructural features of UN at high temperatures and under irradiation are lacking in both consistent experimental data and detailed mechanistic understanding. The mechanical properties of nuclear fuels are crucial for a better understanding of the pellet-cladding mechanical interactions (PCMI) that occur during reactor operation, where cladding creep-down and fuel swelling lead to contact and the development of stresses between the cladding and the fuel, which, with the build-up of fission products, promotes stress corrosion cracking in the cladding material [4]. Fuel creep has an important role in accommodating void swelling once the fuel contacts the cladding [2].
There are a limited number of experimental investigations into the creep behavior of UN. Hayes et al. [5] developed an empirical correlation for the steady-state thermal creep rate of UN based on three experimental investigations by Fassler et al. [6], Vandervoort et al. [7], and Uchida and Ichikawa [8]. These experiments were conducted at a temperature range of 1373–2083 K, a stress range of 13–55.1 MPa, and for five grain sizes: 9, 15, 30, 140, and 2000 m. In addition, the tested samples contained varying levels of carbon and oxygen impurities. To determine the mechanism controlling the creep of UN, Hayes et al. [5] determined the average stress exponent, based only on the data by Fassler et al. [6] and Vandervoort et al. [7], to be . They therefore concluded that the dominant creep mechanism is most probably a climb-controlled dislocation glide mechanism, for which there is no grain size dependence, i.e., the grain size exponent . The data by Uchida and Ichikawa [8] gave a stress exponent = 1.8–2.6, which is indicative of a combination between diffusional and dislocation creep. However, Hayes et al. decided to disregard this data set because its temperature range was intermediate between that of Fassler et al. [6] and Vandervoort et al. [7], and they deemed it was unlikely that a diffusion-based mechanism would only be active in such a narrow temperature range (i.e., 1583–1773 K). The rest of the correlation (i.e., the prefactor and the activation energy) was only fit to the data by Vandervoort et al. [7] because it is the only data set that reported stoichiometric samples of 100% theoretical density. The final correlation reads:
| (1) |
where is the creep rate measured in s-1, is the stress measured in MPa, and is the temperature measured in K. The correlation is strictly valid for = 1770–2083 K (although it was assumed by Hayes et al. to yield reasonable estimates of the creep rate over the range of 298–2523 K), = 20–34 MPa, and theoretically dense UN. The exponential term in Eq.˜1 corresponds to an activation energy = 3.39 eV.
Rogozkin et al. [9] performed experiments and reported thermal creep data for U0.8Pu0.2N. They found that for theoretically dense samples, the thermal creep rate follows the correlation:
| (2) |
which indicates an activation energy = 3.45 eV. The investigators noted that the mass fraction of oxygen and carbon impurities did not exceed 0.15% and the stress varied from 10 to 60 MPa. However, they did not report any grain sizes or an explicit unit for the creep rate. Note that a stress exponent of 1.35 in Eq.˜2 is close to 1 and might indicate a diffusion-dominant creep mechanism [9, 10].
Nabarro-Herring (N-H) creep of UN has been investigated via computational tools. Kotomin et al. [11] conducted a DFT investigation of the diffusion mechanisms of U and N atoms in UN and calculated their associated migration energies. Assuming thermal creep is rate-limited by the diffusion of the slower species (i.e., uranium), they concluded that the activation energy of thermal creep in bulk UN is 5.6 eV. Their thermal creep model is incorporated into the TRANSURANUS fuel performance code [11].
Finally, Konovalov et al. [12] conducted a compilation of available data on UN, (U, Pu)N, UC, and mononitrides of refractory metals (e.g., Zr and Ti) to find a correlation for thermal and irradiation creep in UN and (U, Pu)N. Based on the data, they assumed a combination of dislocation-climb creep and Coble creep according to:
| (3) |
where and are estimated from typical values for refractory-metal mononitrides, the stress exponent of the dislocation-climb creep part is , the same as in Eq.˜1, and is the volume fraction of GBs. Note that the dependence of the Coble creep on the grain size is included in . They further assumed that the activation energy for the dislocation-climb creep is equal to the activation energy of bulk diffusion of U atoms in UN, i.e., = 5 eV. Based on the observation that in typical metallic compounds, the activation energy of GB diffusion is nearly half that of bulk diffusion, they assumed similar to UC, because measurements of U self-diffusion at GBs in UN are not yet available. An important result of their analysis is that diffusional creep is the dominant mechanism in the temperature range of fuel manufacturing processes and nuclear reactor operation, although they did not clarify the effect of stress and grain size.
A few observations can be made about the previous studies. The assumption by Hayes et al. that dislocation creep is the dominant creep process cannot be made for all grain sizes at all temperatures based only on very few experimental data points. The studies by Fassler et al. [6] and Vandervoort et al. [7], on which the stress exponent in Eq.˜1 was based, report grain sizes of 30, 140, and 2000 m. However, typical grain sizes of manufactured UN fuel range between 5 and 30 m [13, 14, 15, 16]. Johnson and Lopes [14] report that the grain size for UN to achieve optimum fuel porosity (i.e., 0% open porosity to suppress oxidation and 4% closed porosity to accommodate gas fission products) is around 8 1 m. Uchida and Ichikawa [8], who found a stress exponent closer to 1, reported grain sizes of 9 and 15 m. That is, diffusional creep might be the dominant creep mechanism at the grain sizes typical of the manufactured fuel. The existence of diffusional creep as a contributing process is supported by the studies of Rogozkin et al. [9] and Konovalov et al. [12], and can be dominant if the activation energy of a diffusional creep mechanism is found to be lower than that of dislocation creep. Basing the thermal creep model of UN on bulk diffusion activation energies, as was done by Kotomin et al. [11], is questionable, especially because GB diffusion is known to be much faster than bulk diffusion [17], and the typical grain sizes of manufactured UN (5–30 m) are quite small and might render Coble creep as the dominant mechanism at the temperature range of practical interest. Finally, Nabarro-Herring creep is expected to be dominant near the melting point [18].
It is worth mentioning that Hayes et al. [19] also developed correlations for diffusion in UN based on a few scattered data points. Their estimated activation energies for U and N atoms are 0.69 and 1.66 eV, respectively, which raises suspicions because U atoms are not expected to have a lower diffusion activation energy than that of N atoms. Hayes et al. reported that their correlation for N diffusion is for tracer diffusion measurements, and is only representative of extremely hyper-stoichiometric conditions. Finally, while the analysis by Konovalov et al. [12] is qualitatively appealing, it lacks quantitative insights because it is based on typical values and educated guesses. In summary, the literature on creep in UN is sparse, somewhat contradictory, and requires additional investigation to identify the dominant creep mechanisms at various temperatures, stresses, and grain sizes.
Molecular-dynamics (MD) studies have been used with success to study diffusional creep in, e.g., Si [20], Pd [21], and \ceUO2 [22, 23]. These studies set up a simulation for idealized microstructures, where the supercells are equilibrated at a certain temperature and put under stress, and the strain rate is then analyzed. Haslam et al. [24] further developed this approach by using random grain sizes and shapes, instead of idealized microstructures, to observe both creep rate and grain growth mechanisms in Pd. Cooper et al. [25] used another approach (hereafter termed the parameter-based approach) for predicting Coble creep rates for \ceU3Si2 where, instead of directly observing creep, an initial creep formula is assumed, and then, a lower-length scale modeling approach is used to calculate the formula parameters, e.g., defect volumes and GB diffusivities. To the best of our knowledge, no computational studies exist in the literature for Coble creep in UN.
In order to conduct MD simulations, a sufficiently accurate interatomic potential is required. Two promising interatomic potentials of UN exist in the literature: Tseplyaev and Starikov’s angular-dependent potential [26], and Kocevski et al.’s embedded-atom method (EAM) potential [27]. Both potentials have been utilized and compared in our previous works [28, 29], however, their ability to model dynamical processes like diffusional creep has not been assessed. In this work, nano-sized polycrystals are employed to perform MD simulations of diffusional creep in UN. The polycrystals are also used to study GB diffusion and the temperature dependence of the diffusional GB width in UN. A parameter-based model of Coble creep is also constructed and compared to the simulation model.
2 Methods
All MD calculations performed in this work utilize the Large-scale Atomic/Molecular Massively Parallel Simulator (LAMMPS) software package [30] using a 1 fs time step and the Tseplyaev [26] and Kocevski [27] force-field potentials. Periodic boundary conditions (PBCs) are applied to all supercells. The Atomsk code [31] is used to generate polycrystals by the Voronoi tessellation method. The OVITO software package [32] is used for supercell visualization and analysis.
2.1 Creep mechanisms
Steady-state creep strain rates can be represented by the Mukherjee-Bird-Dorn equation [33]:
| (4) |
where is temperature, is stress, is the grain size, is an activation energy, is the Boltzmann constant, and , , and are dimensionless constants. The inverse temperature dependence is relatively weak, especially at temperatures where creep is important, and is usually neglected [34]. That is why is treated as a constant prefactor. The values of the exponents and depend on the creep mechanism under consideration. For example, for power-law (dislocation) creep, = 3–8 and = 0, i.e., no grain size dependence, whereas for diffusional creep, = 1 and = 2 (for the Nabarro-Herring mechanism) or = 3 (for the Coble mechanism).
It should be noted that the Harper-Dorn creep, a dislocation creep mechanism, has a stress exponent , similar to diffusional-creep mechanisms, as well as , i.e., no grain size dependence. However, for Harper-Dorn creep to be significant, the material must have a large grain size (in the order of 100 m [10]); otherwise, diffusional creep mechanisms are more likely to dominate. There is little evidence for the existence of Harper-Dorn creep in ceramics [10]. Ceramics generally have smaller grain sizes, fewer available slip systems, and high Peierls-Nabarro stresses, all of which lead to the prevalence of other creep mechanisms [10]. For this reason, the Harper-Dorn creep is excluded from consideration as a competing creep mechanism in UN, and dislocation creep refers exclusively to power-law creep.
In this work, we study diffusional creep, whose rate, in general, is a sum of the Nabarro-Herring creep rate, , and the Coble creep rate, , since both mechanisms operate in parallel [18].
For Coble creep, the steady-state strain rate is expressed as [35, 18]:
| (5) |
where depends on the grain shape ( for spherical grains), is the effective GB diffusivity, is the GB width, and is the vacancy volume usually approximated as the atomic volume or expressed as [33] or [10] where is the magnitude of the Burgers vector. In this formulation, is the diffusion flux in the GB, and is the work performed by the stress during an elementary diffusion jump [20, 21]. It should be noted that the original paper by Coble [35] reports the value of for spherical grains as 148. However, we performed the derivation by Coble and found a value of . This agrees with the values of 47 reported by Keblinski et al. [20] and by Wang et al. [36]. The maximum difference between these different results for is only a factor of three; thus, it is effectively negligible compared to the orders of magnitude difference in creep rate resulting from, for example, in Eq.˜5. In Section˜3.2, Eq.˜5 is used as a basis for the parameter-based Coble creep model.
Homogeneous grain elongation along the tensile stress direction during diffusional creep requires GB sliding as a geometrically necessary accommodation process [21, 18]. In this context, GB sliding happens sequentially to diffusional creep on a local atom-by-atom basis and does not involve changes in the relative positions of the centers of mass of individual grains (i.e., their coordinates normalized by the simulation box dimensions are constant) [18]. If GB sliding were absent, voids/microcracks would form along the GBs. Since GB sliding and diffusional creep occur sequentially and sliding is faster than diffusion [18], the net creep rate is the rate of the slower process, which is diffusional creep.
2.2 Diffusional creep
High-temperature deformation and grain growth are coupled phenomena. Deformation enhances grain growth, and, in turn, grain growth can either increase or decrease the deformation rate depending on the interplay between the GB processes governing this coupling which include GB diffusion, GB sliding, GB migration, and grain rotation [24]. Although the Coble creep formula (Eq.˜5) implies that grain growth reduces the creep rate, experimental evidence suggests that the strain rate can also increase during deformation due to GB migration which acts as a stress-relaxation mechanism [24]. To suppress grain growth, an idealized nanocrystalline microstructure of uniform grain sizes and shapes is usually used in MD creep simulations [20, 21]. The geometry of grains can be closely modeled by the space-filling 14-sided polyhedron known as the truncated octahedron [21, 37]. Truncated-octahedral grains are nearly spherical, yet, they display realistic grain features like triple lines and quadruple junctions. Atomsk [31] was used to generate 16 truncated-octahedral grains with random misorientations, and average grain diameters of 14, 16, 18, and 20 nm. Based on our tests, smaller grain sizes (10 and 12 nm) suffered inconsistent evolution in creep simulations at the highest temperature (i.e., 2000 K) and the lowest stress (i.e., 200 MPa). Random grain misorientations lead to a relatively small fraction of low-angle GBs [21, 24]; thus, all GBs within a polycrystal can be considered high-angle GBs. Atoms with distances smaller than , where is the lattice parameter, were deleted to prevent unrealistic high forces as an artifact of the structure generation process.
Based on initial tests, we found that the Kocevski potential stabilizes voids along GBs in both bicrystals and polycrystals. This is likely due to the U-U repulsion in the Kocevski potential and its inability to simulate metallic U [28]. Thus, the Kocevski potential is unable to be used for the study of Coble creep phenomena. For this reason, only the Tseplyaev potential is used to simulate the creep behavior of UN. Supercells are equilibrated in the NPT ensemble using the Nosé-Hoover thermostat and barostat at temperatures of 1700–2000 K and zero pressure for 200 ps. Then, tensile stresses in the range of 200–500 MPa are applied to the supercells in the -direction for 5 ns. The calculations were repeated using three different initial velocity distributions.
Diffusional creep is typically observed for , where is the melting point [18]. For UN, the experimental melting temperature is about 3035 K at a nitrogen vapor pressure of 1 atm [38], and the Tseplyaev potential predicts thermodynamic melting of UN at about 2700 K [28]. Thus, diffusional creep is expected to be observed at the studied temperature range of 1700–2000 K. On the other hand, the applied stresses (i.e., 200–500 MPa) are an order of magnitude higher than typical experimental stresses at which creep is observed and will lead to strain rates in the range of s-1, which is several orders of magnitude higher than experimental creep rate values. However, such high stresses are required for creep to be observed within MD time scales. If we decrease the applied stress by an order of magnitude and increase the grain size from 10 nm to 10 m, the strain rate becomes – s-1—a typical experimental creep rate value. However, this would increase the computational cost to achieve a similar creep strain by approximately times. It is expected that the fundamental physics of Coble creep is captured given the computational setup applied here, and thus the extrapolation of conclusions from high stress/small grain simulations to more realistic stresses and grain sizes is considered reasonable.
To visualize the microstructural details of the supercells, the centrosymmetry parameter (CSP) and the dislocation extraction algorithm (DXA) are utilized. The CSP has been calculated by OVITO for snapshots of the simulated supercells using the minimum-weight matching algorithm [39]. The CSP quantifies lattice disorder and is defined as [40]:
| (6) |
where represents the number of nearest neighbors around an atom (for NaCl, ), and and are vectors extending from the atom in question to a pair of opposite neighboring atoms. In a perfectly centrosymmetric crystal, contributions from all neighboring pairs cancel each other, yielding a CSP of zero. The CSP method is resilient to thermal noise; for a pristine crystal, it produces a single peak starting at zero, with its width broadening as temperature increases. A second peak in the CSP graph indicates a different local structure, such as dislocations or highly disordered grain boundaries (GBs) [41, 39]. The CSP has units of squared distance, typically expressed as , where is the lattice constant. The CSP serves as an indirect analysis method. For direct visualization of dislocations, OVITO’s DXA [42] is used, particularly applied to the U sub-lattice. A drawback of the DXA is its limitation in identifying predefined dislocations in single-component crystals, so dislocations with a Burgers vector outside the predefined families go undetected. This limits the algorithm’s ability to identify GB dislocations, which typically have much shorter Burgers vectors than those in the lattice [43]. Given that each sub-lattice in the B1 structure of UN forms a face-centered cubic (FCC) lattice, applying DXA to the U sub-lattice allows for precise dislocation identification and visualization.
3 Results
3.1 Direct simulation of Coble creep
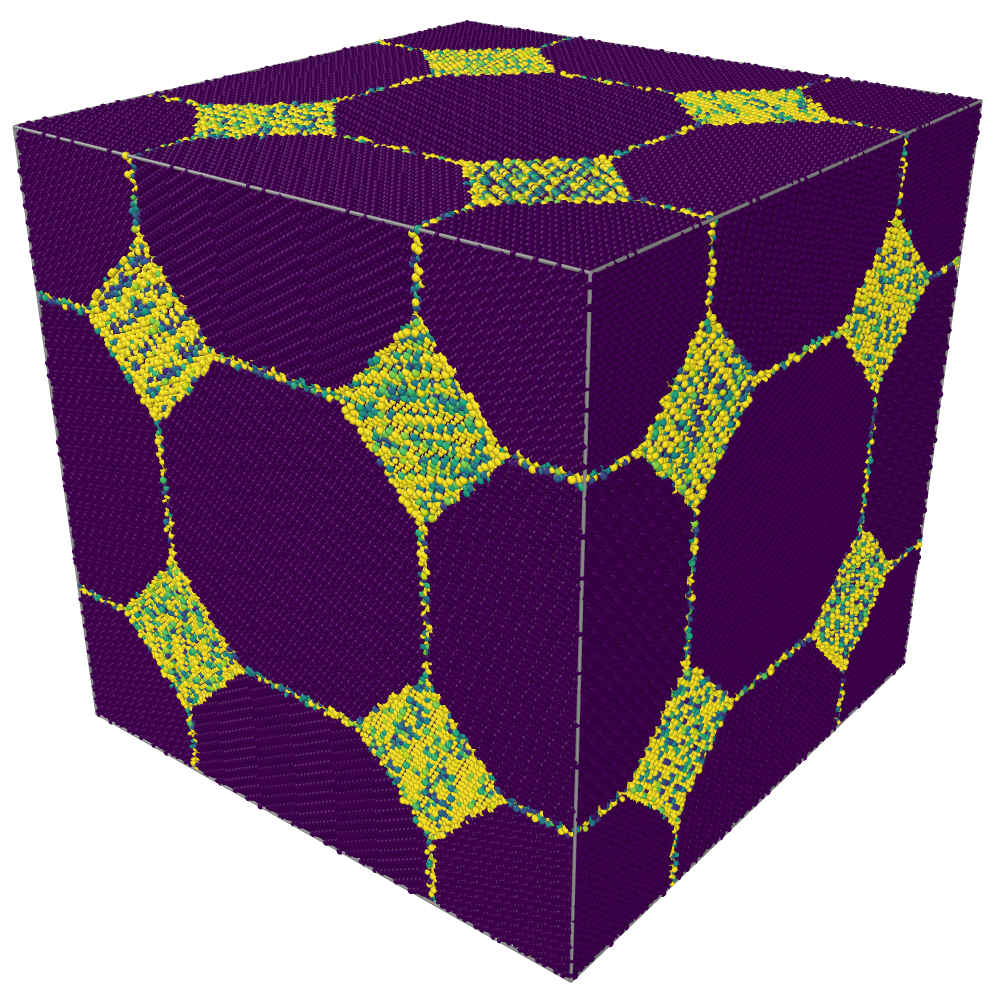
A model microstructure of UN whose energy has been minimized at 0 K with a relative energy tolerance of is shown in Fig.˜1. The numbers of atoms in the constructed polycrystals range between 1,547,344 atoms for the 14-nm polycrystal and 4,537,943 atoms for the 20-nm polycrystal, and the N/U ratio varies between 0.9999 and 1.0002. Each system is therefore either slightly hypo-stoichiometric or slightly hyper-stoichiometric, and any effect that may arise due to this slight off-stoichiometry is minor. Each creep rate is an average over three simulations using three different initial velocity distributions. To visualize the GB structure, atoms have been colored according to their CSP; yellow atoms have high CSP (i.e., high degree of miscoordination) and dark purple atoms have low CSP (i.e., low degree of miscoordination). Conceptually, low-angle GBs consist of isolated dislocation cores of high miscoordination that are separated by a nearly perfect crystal region of low miscoordination [44]. On the other hand, high-angle GBs consist of overlapping dislocation cores and display a high degree of miscoordination that is uniformly distributed along the GB area [24]. Hence, it can be concluded from the figure that virtually all of the GBs in the supercell are high-angle GBs which are visualized as continuous uninterrupted yellow lines. This also applies to all the supercells employed in this work. Networks of GB dislocations have also been observed along the GBs using the DXA in OVITO. These GB dislocations are not preferentially aligned with any slip plane, are essentially immobile, and do not give rise to any dislocation-dominated deformation that would interfere with diffusional creep. Additionally, sustainable plastic deformation via the dislocation–nucleation mechanism is not possible because, e.g., the stress required to activate a Frank-Read source (a principal mechanism to sustain plastic deformation via dislocation multiplication [45]) increases inversely with decreasing grain size (), and the size of a Frank-Read source cannot exceed the grain size [46, 21]. Thus, our nanometer-sized grains are too small to accommodate a Frank–Read source that can be activated by typical stresses. It has also been visually confirmed that the microstructure does not undergo any micro-cracking, grain growth, GB sliding, or dislocation activity within grain interiors during the time scale of the simulation.
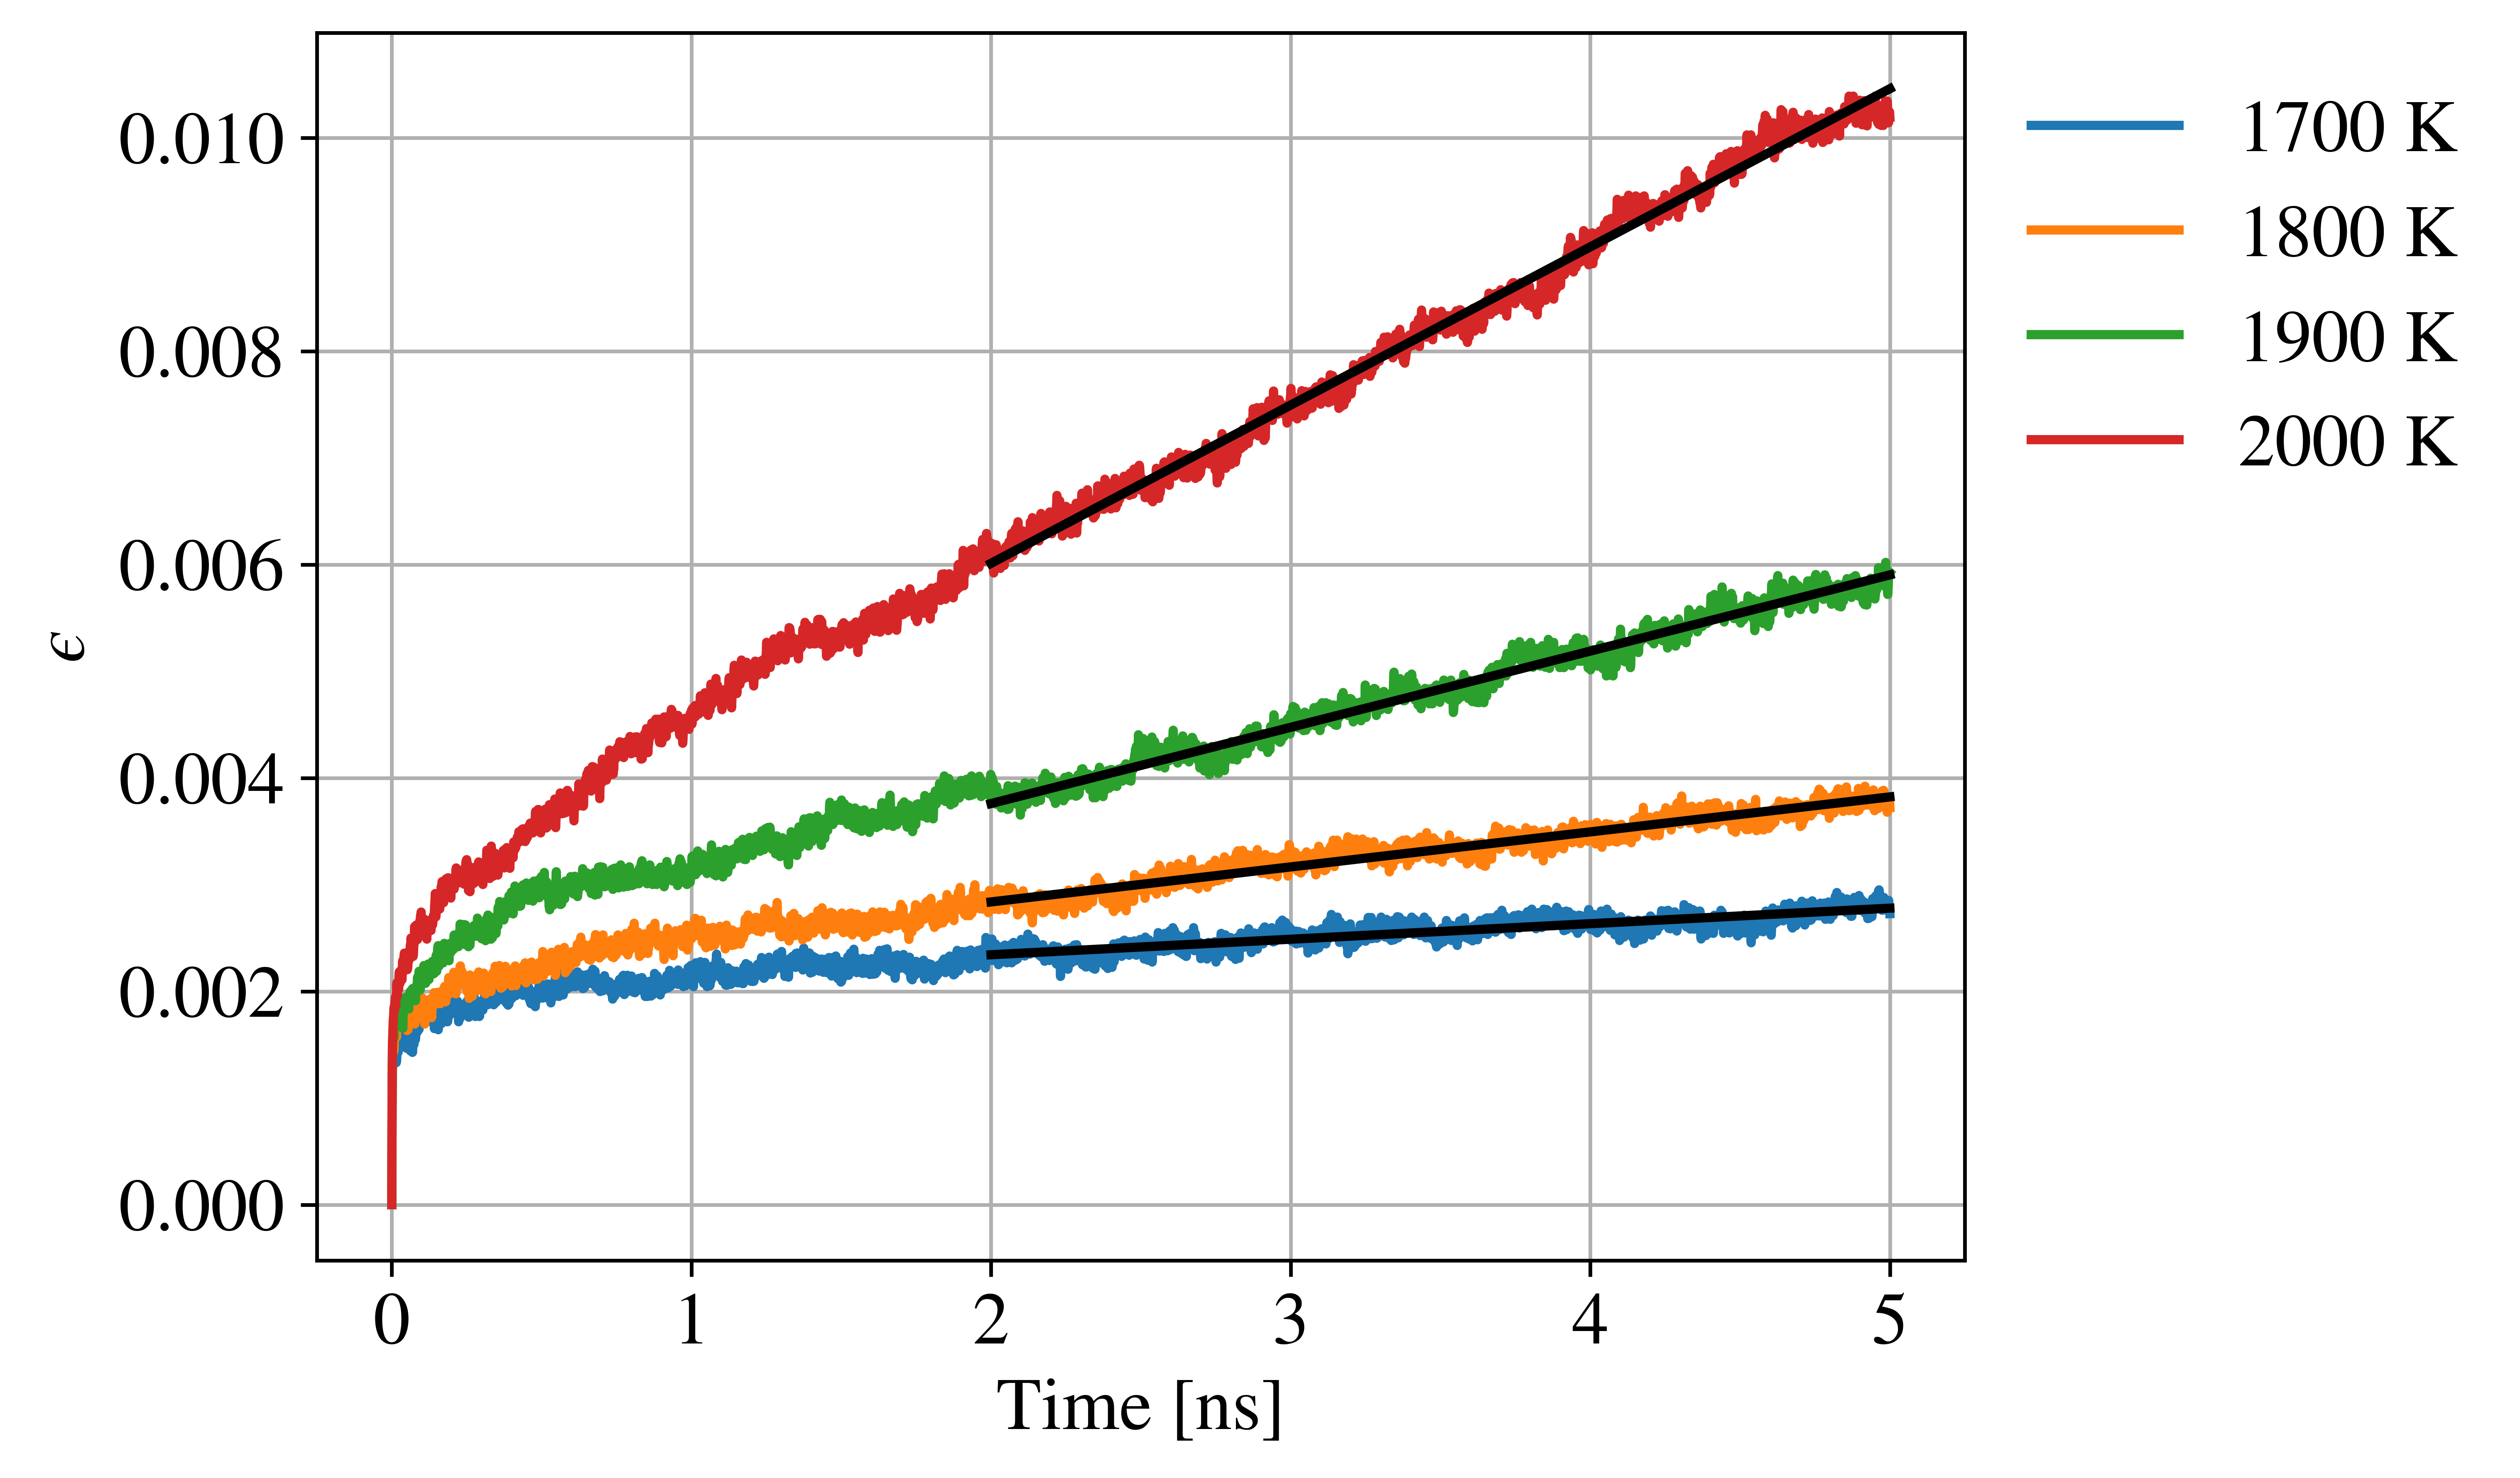
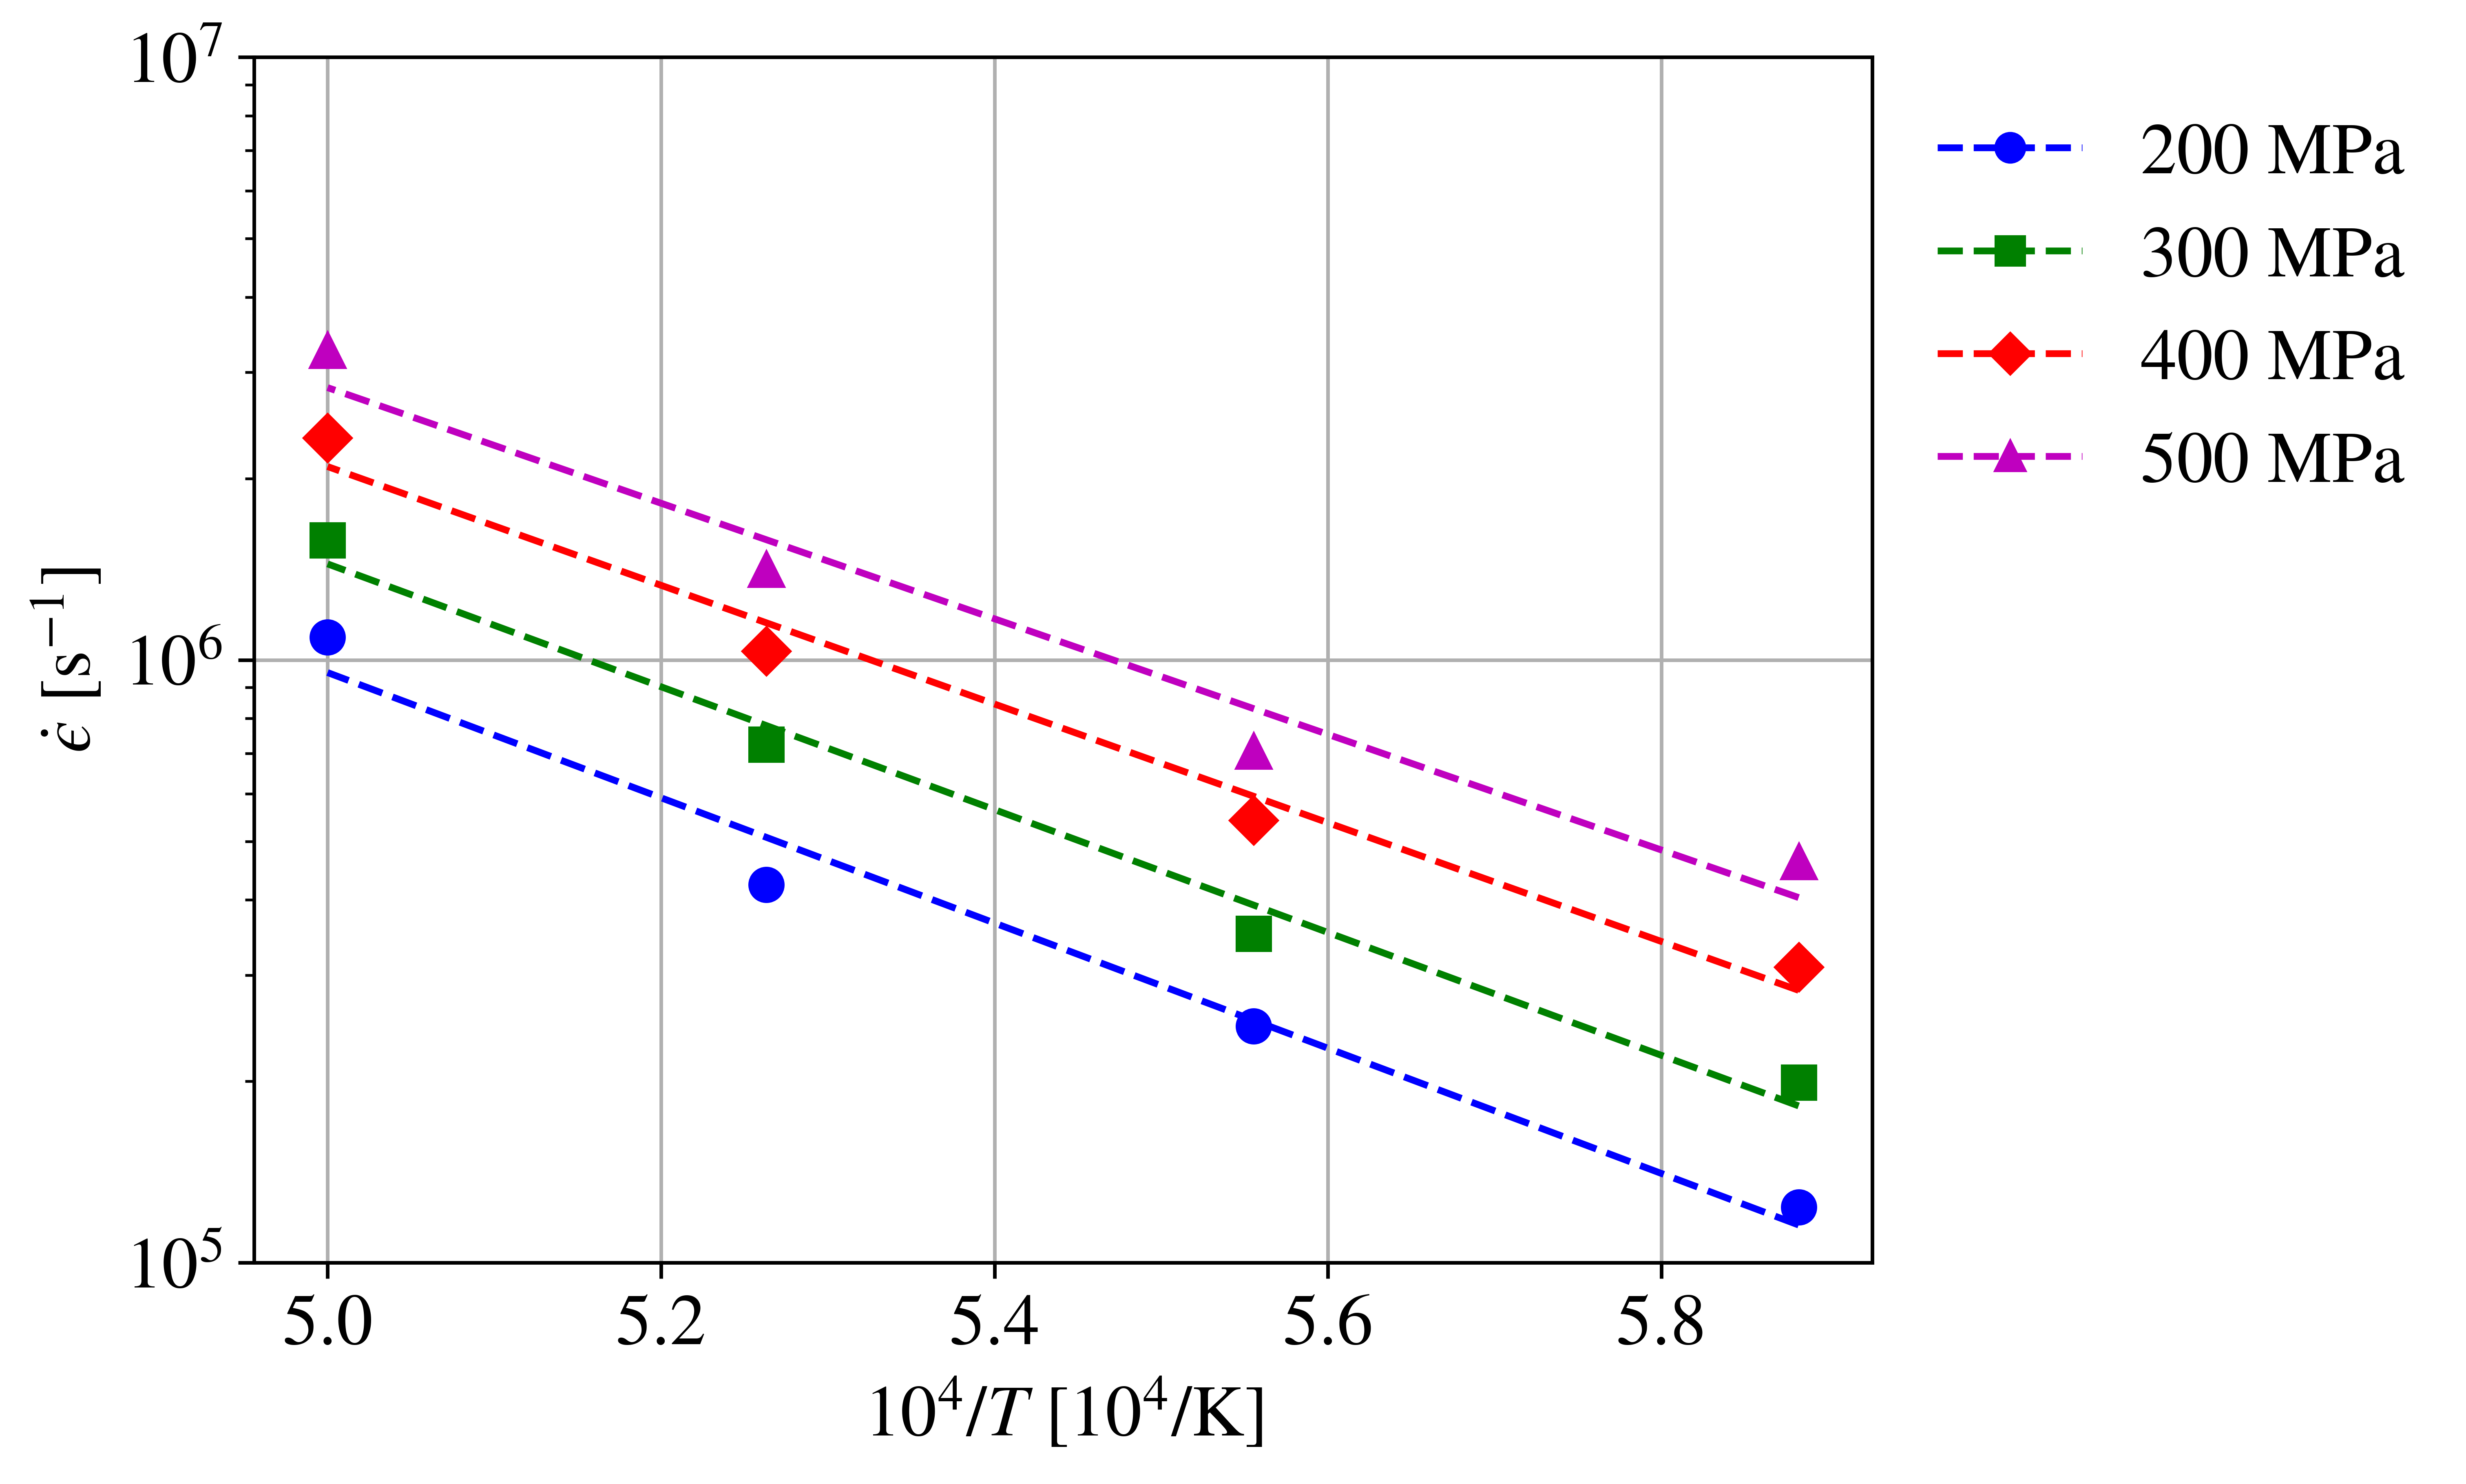
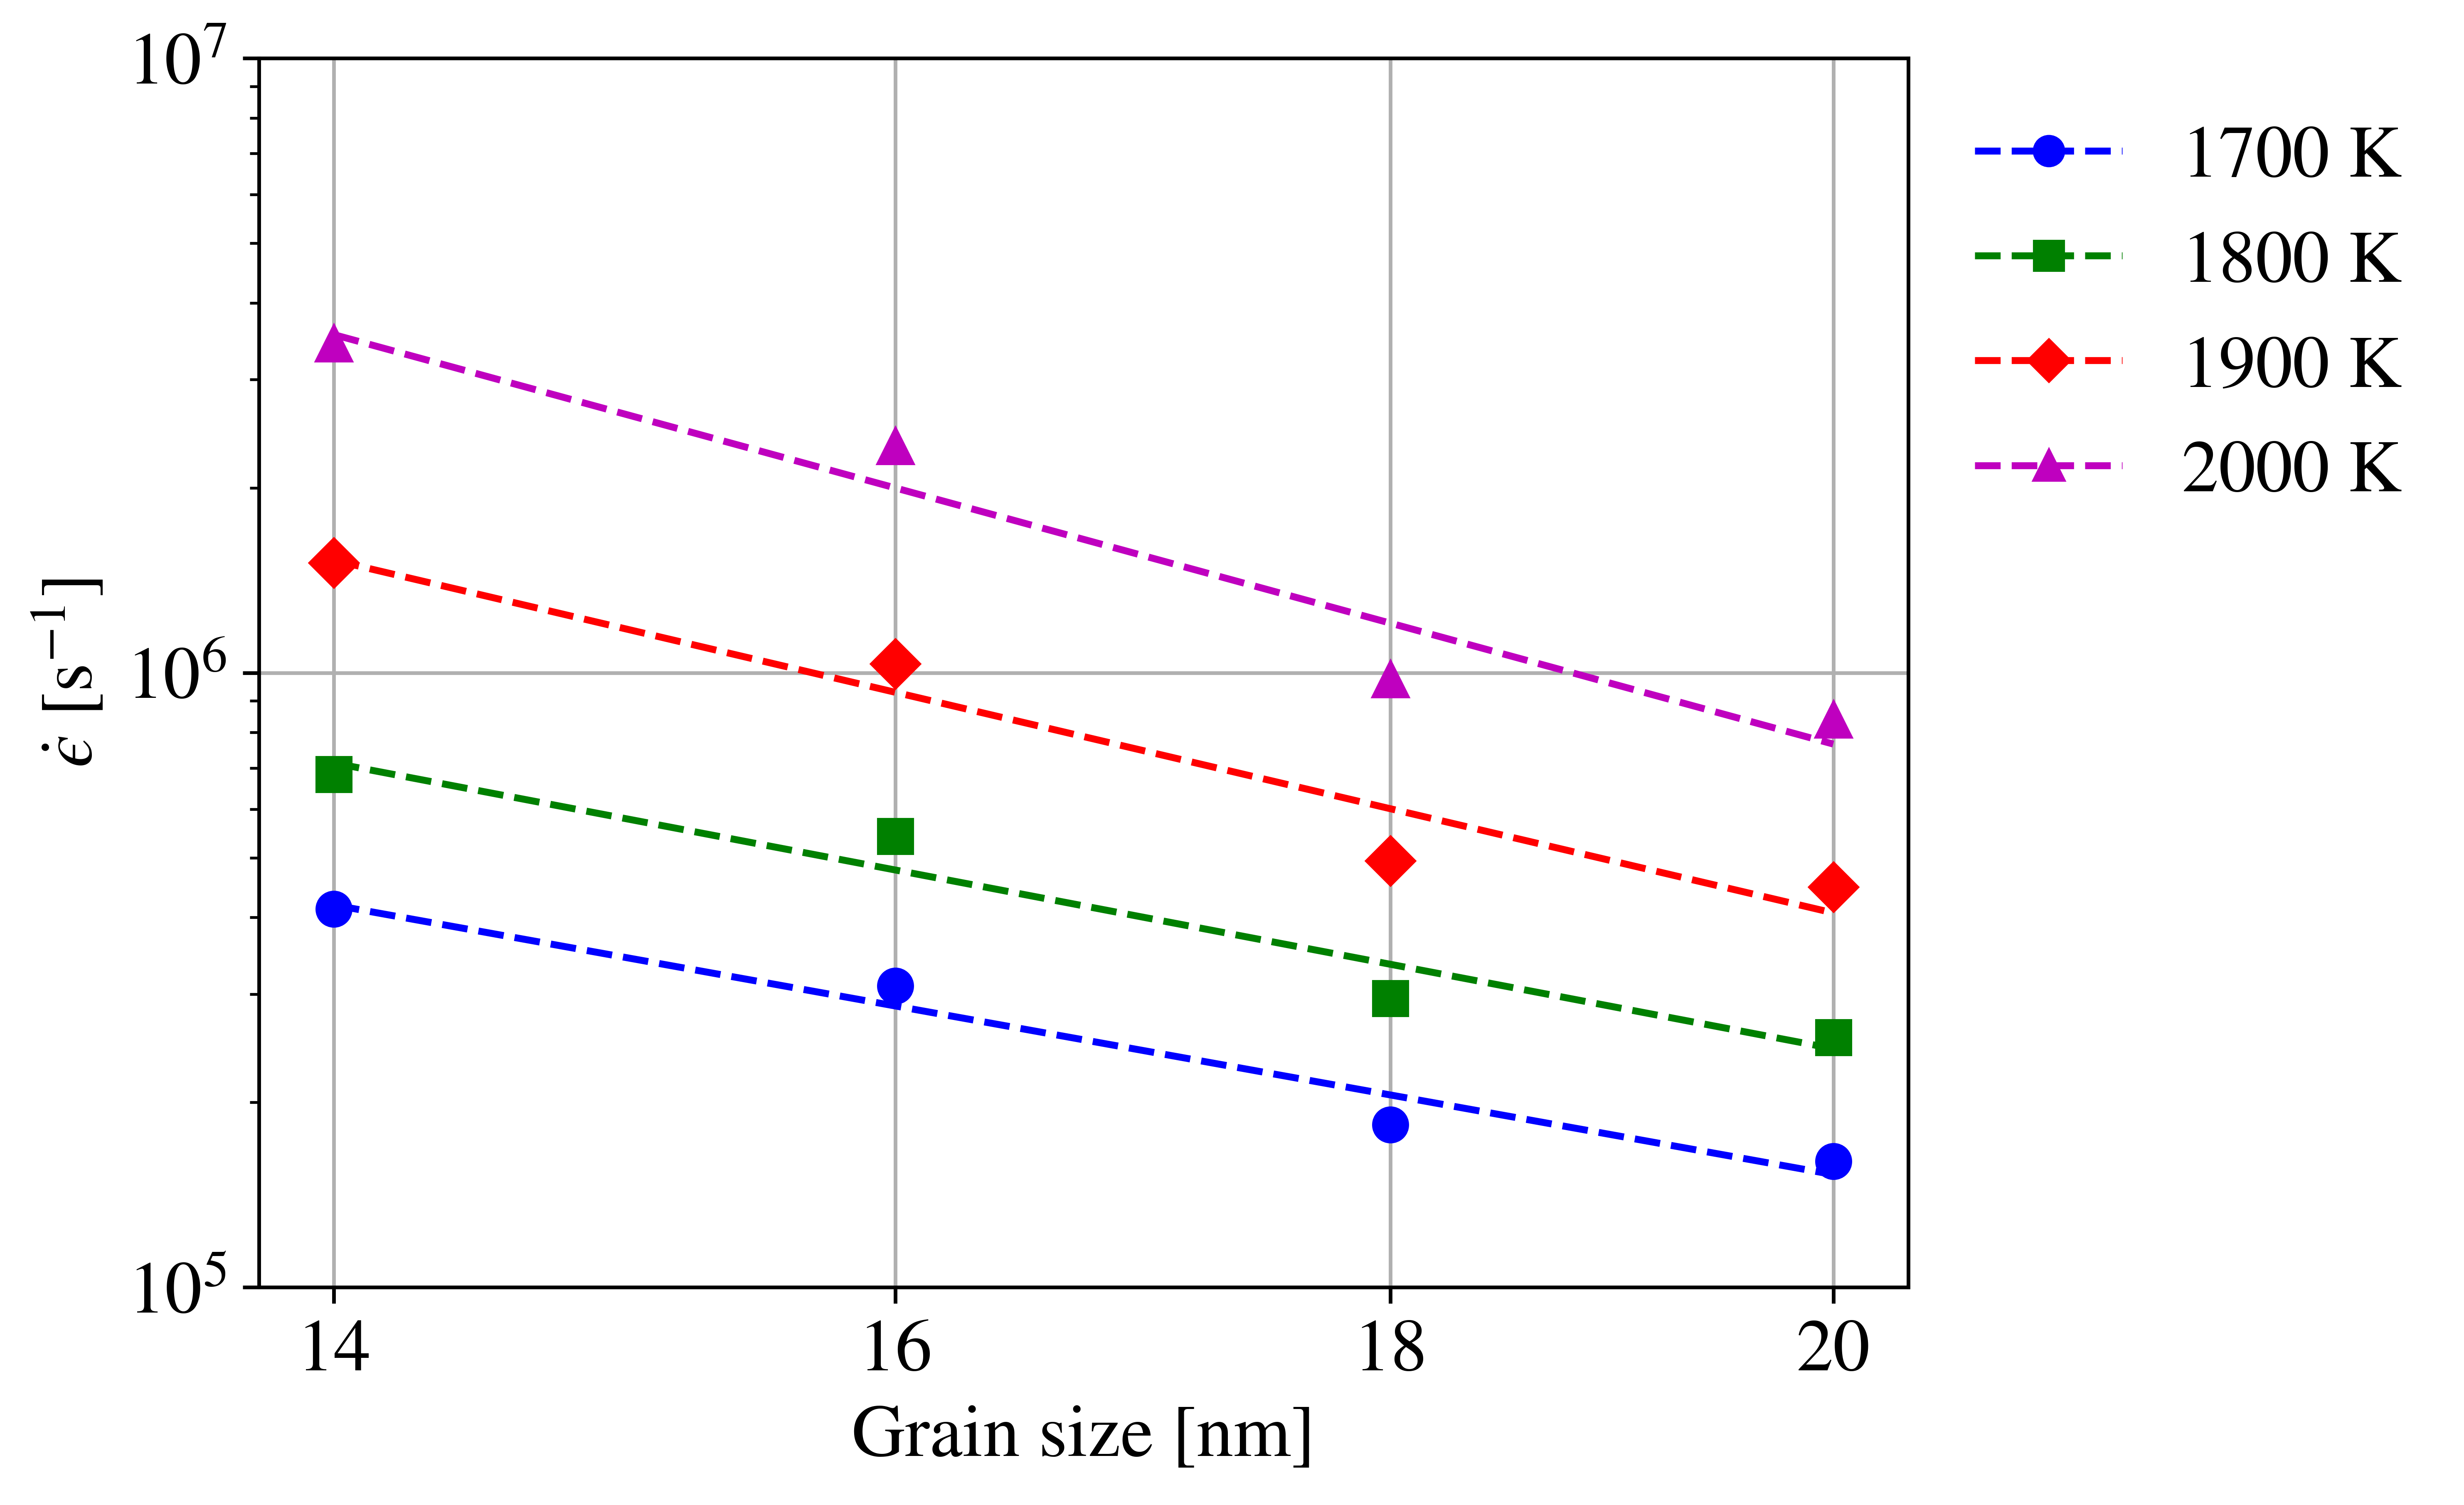
Plots from the Coble creep simulations are shown in Fig.˜2. An example of the strain variation with time is shown in Fig.˜2(a). After the instantaneous elastic strain, a transient strain stage is observed in which the strain rate decreases with time until it attains its steady-state value. Temperatures and stresses were chosen to maintain steady-state creep throughout the simulation while simultaneously ensuring a sufficient signal-to-noise ratio in the strain response. The strain rate is calculated using a linear fit to the final 3 ns of the strain versus time curve where steady-state creep is reached. The data was analyzed to parameterize Eq.˜4. To calculate the activation energy of creep, the Arrhenius plots of the strain rate versus inverse temperature (e.g., Fig.˜2(b)) have been fitted and an average value over all grain sizes and stresses calculated. As shown in Table˜1, the calculated activation energy is eV, which is smaller than the activation energy of the Hayes correlation for thermal creep in UN (Eq.˜1, eV [5]), which assumes a dislocation mechanism, and closer to the activation energy for GB diffusion in UN assumed by Konovalov et al. (i.e., = 2.65 eV) [12]. This indicates that Coble creep can be a competitive mechanism to dislocation creep in UN.
| Activation energy, [eV] | Stress exponent, | Grain size exponent, |
|---|---|---|
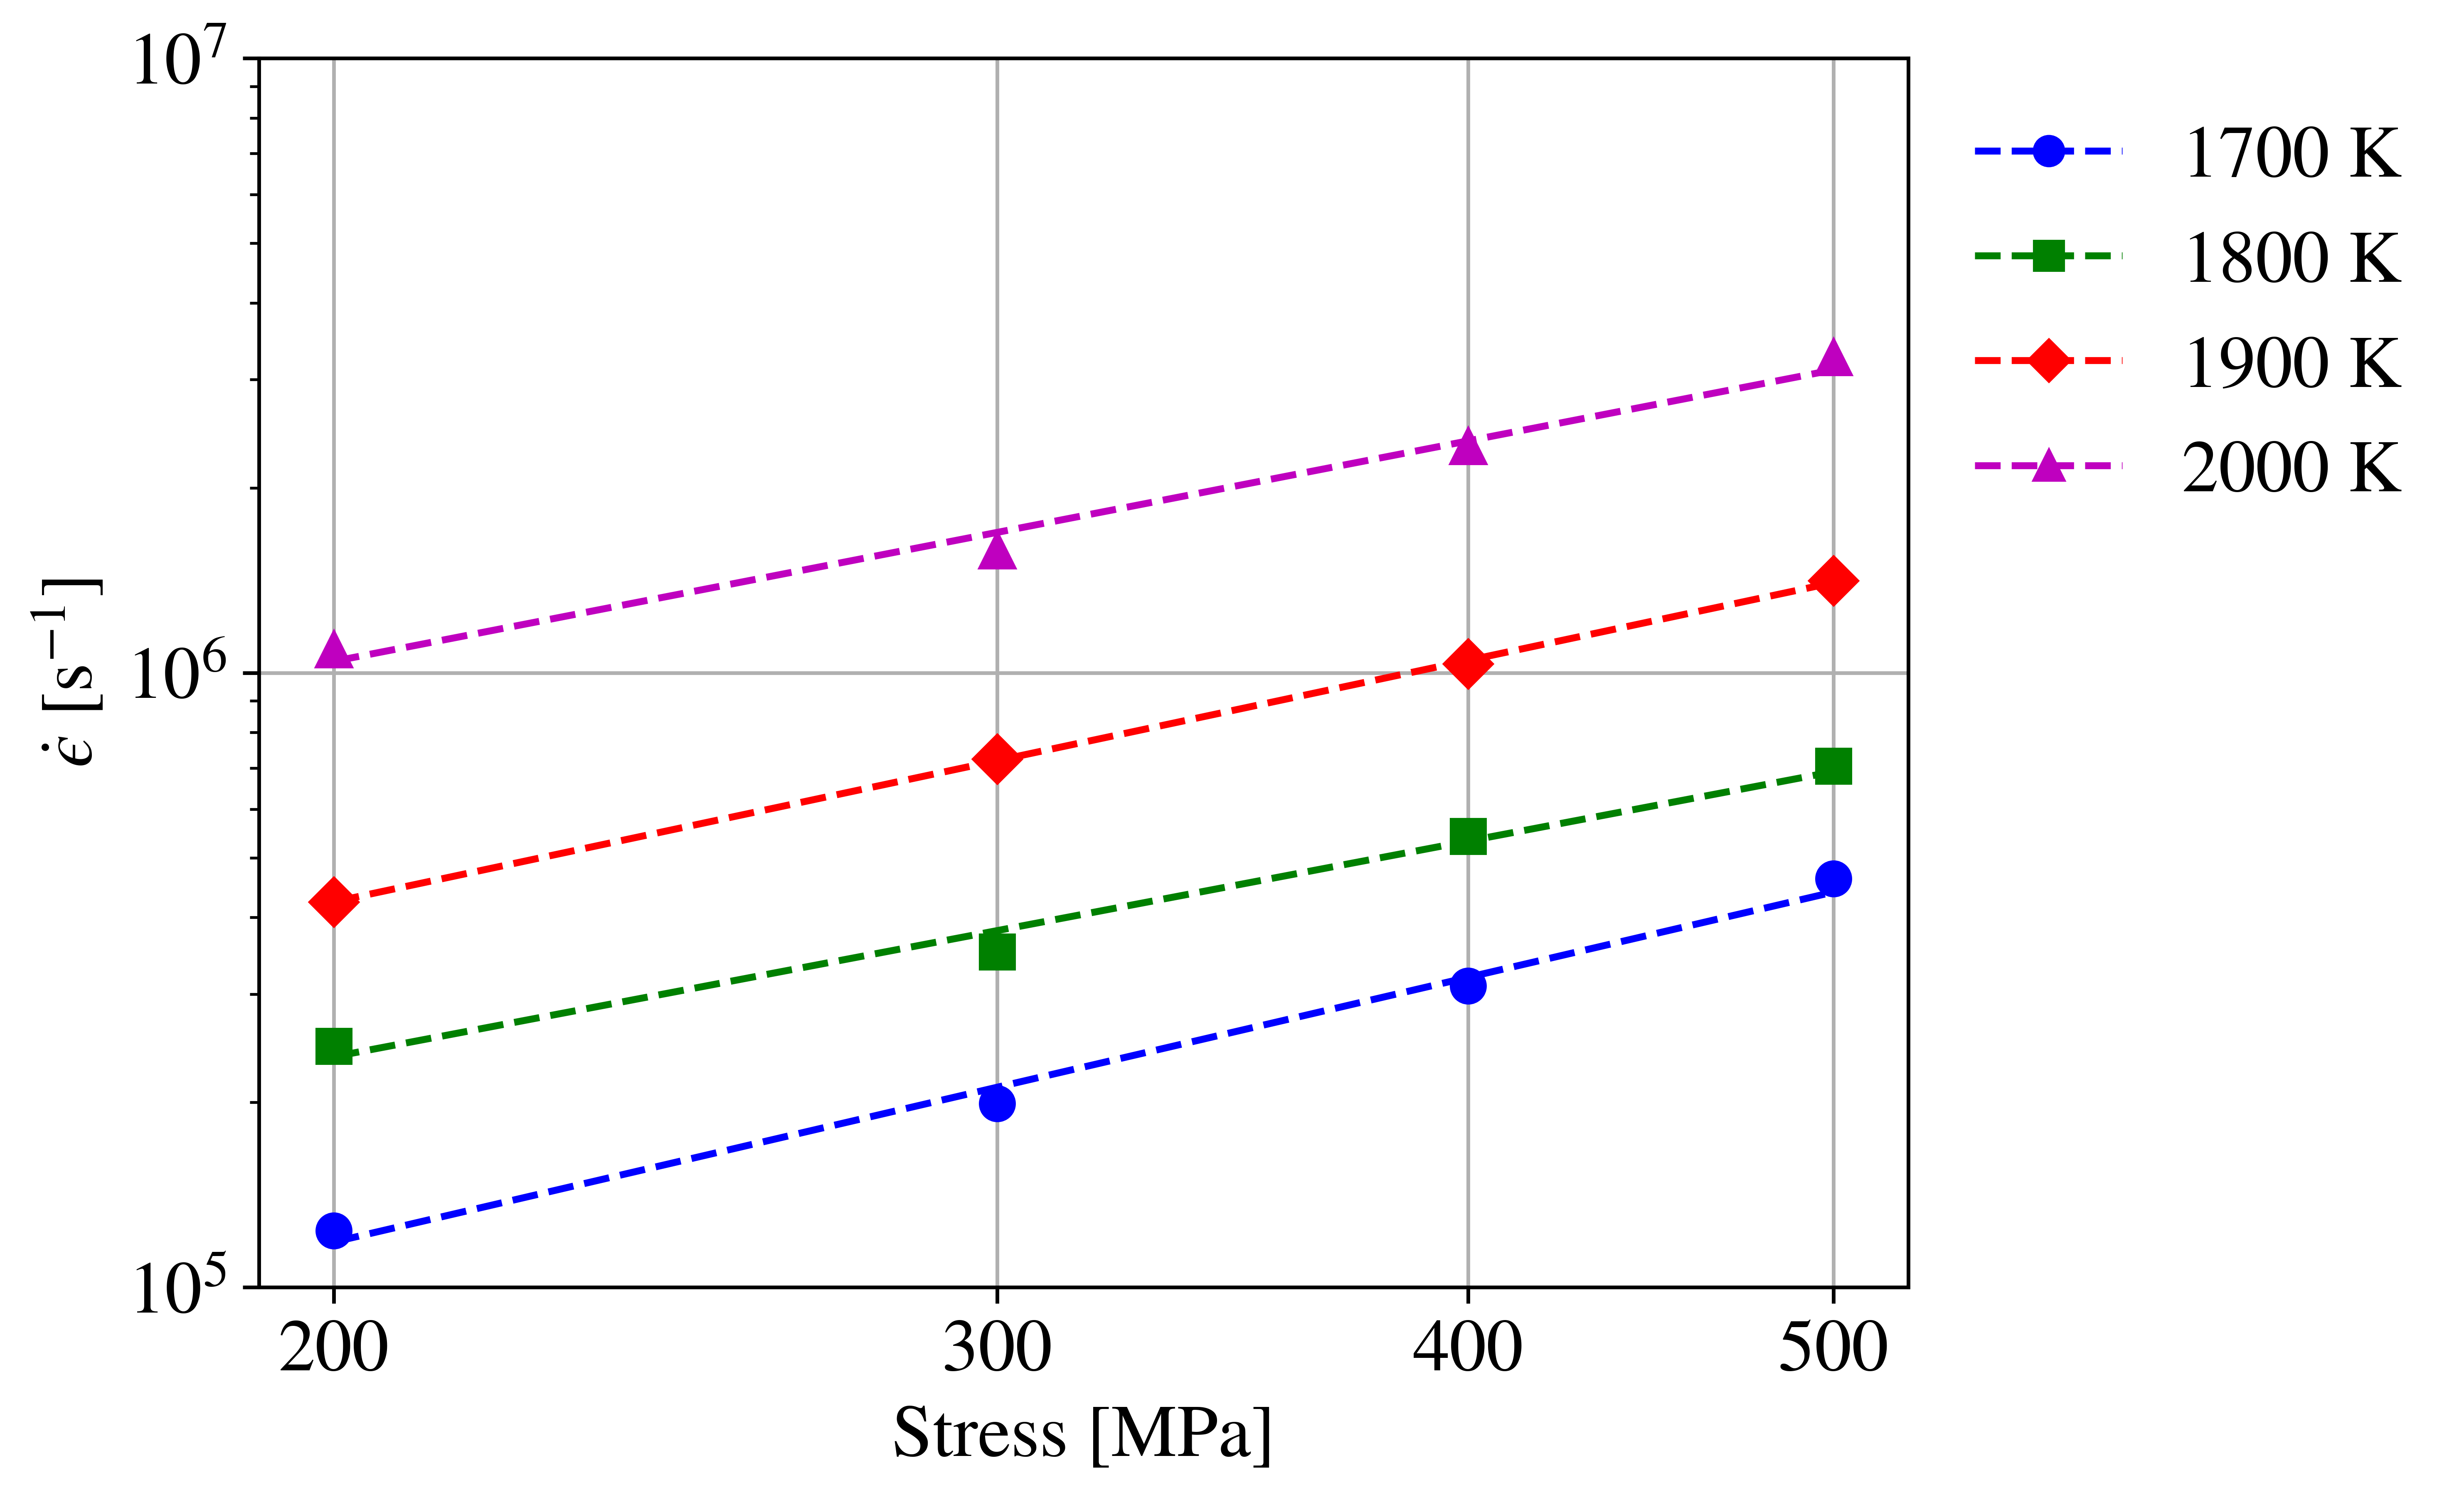
To determine the dependence of the creep strain rate on the applied stress for each grain size and temperature, log-log plots of strain rate versus stress (Fig.˜2(c)) have been fitted and the averaged value is shown in Table˜1. A strain exponent indicates that the stress dependence is nearly linear, which is characteristic of diffusional creep, and which agrees with the stress exponent found by Rogozkin et al. [9]. Following the same procedure for the stress exponent, the grain size exponent has been determined (Fig.˜2(d)) for each applied stress and temperature, and the final averaged value is also shown in Table˜1. It can be seen that the average grain size exponent is very close to the grain size dependence of Coble creep (), but with relatively high uncertainty (24%). Uncertainties of the fitting parameters in Table˜1 are estimated by dividing the standard deviations by the mean values. It should be emphasized that only a subset of the data is shown in Figure˜2, but the entire data set for all stresses, temperatures, and grain size are utilized in the determination of the average values in Table˜1.
To confirm that the deformation mechanism is homogeneous (i.e., the total deformation of the supercell is proportional to the deformation of the individual grains), we visually confirmed that the positions of the centers of mass of the grains, normalized by the instantaneous lengths of the cubic simulation box, did not move during the time scale of the simulation. Additionally, using the “displacement vectors” modifier in OVITO [32] it was confirmed that only atoms along the GBs undergo motion during the time scale of the simulations. That is, only Coble creep is observed in our simulations and Nabarro-Herring creep is essentially absent at the considered temperatures and time scale.
3.2 Parameter-based Coble creep model
Following the methodology of Cooper et al. [25] for \ceU3Si2 and Galvin et al. [23] for \ceUO2, we also construct a parameter-based Coble creep model. In this approach, the parameters of the Coble creep formula (Eq.˜5) are calculated independently.
3.2.1 GB diffusivity
In ionic compounds like UN, the diffusional process requires ambipolar coupling to avoid compound decomposition [47]. This means that U and N atoms must diffuse in stoichiometric ratios with an effective diffusivity that is limited by the diffusivity of the slower species, i.e., uranium, along its fastest path. The total effective diffusivity is calculated based on Gordon’s formula [47] for ambipolar diffusion in an ionic solid AαBβ (For UN, ):
| (7) |
Eq.˜7 differs from the usual formula for effective by including the extra term , which appears because Gordon’s formulation is based on the molecular volume of AαBβ whereas the traditional Coble creep formula (Eq.˜5) includes the average atomic volume [48, 22]. Because we are dealing with polycrystals, it is difficult to exclusively track the atomic movement within the GBs to determine the GB diffusivity. Instead, we track the movement of all atoms within the polycrystals. In this picture, the total diffusivity of either U or N atoms has both bulk and GB components. According to the Hart formulation [49, 50], the total diffusivity in a polycrystal can be divided between bulk and GB components according to:
| (8) |
where is the fraction of atoms that belong to the GBs ( will be defined quantitatively later in Section˜3.2.2), is the GB diffusivity, and is the bulk diffusivity. Thus, with the knowledge of the total diffusivity in the polycrystals and the bulk diffusivity, the GB diffusivity can be readily estimated.
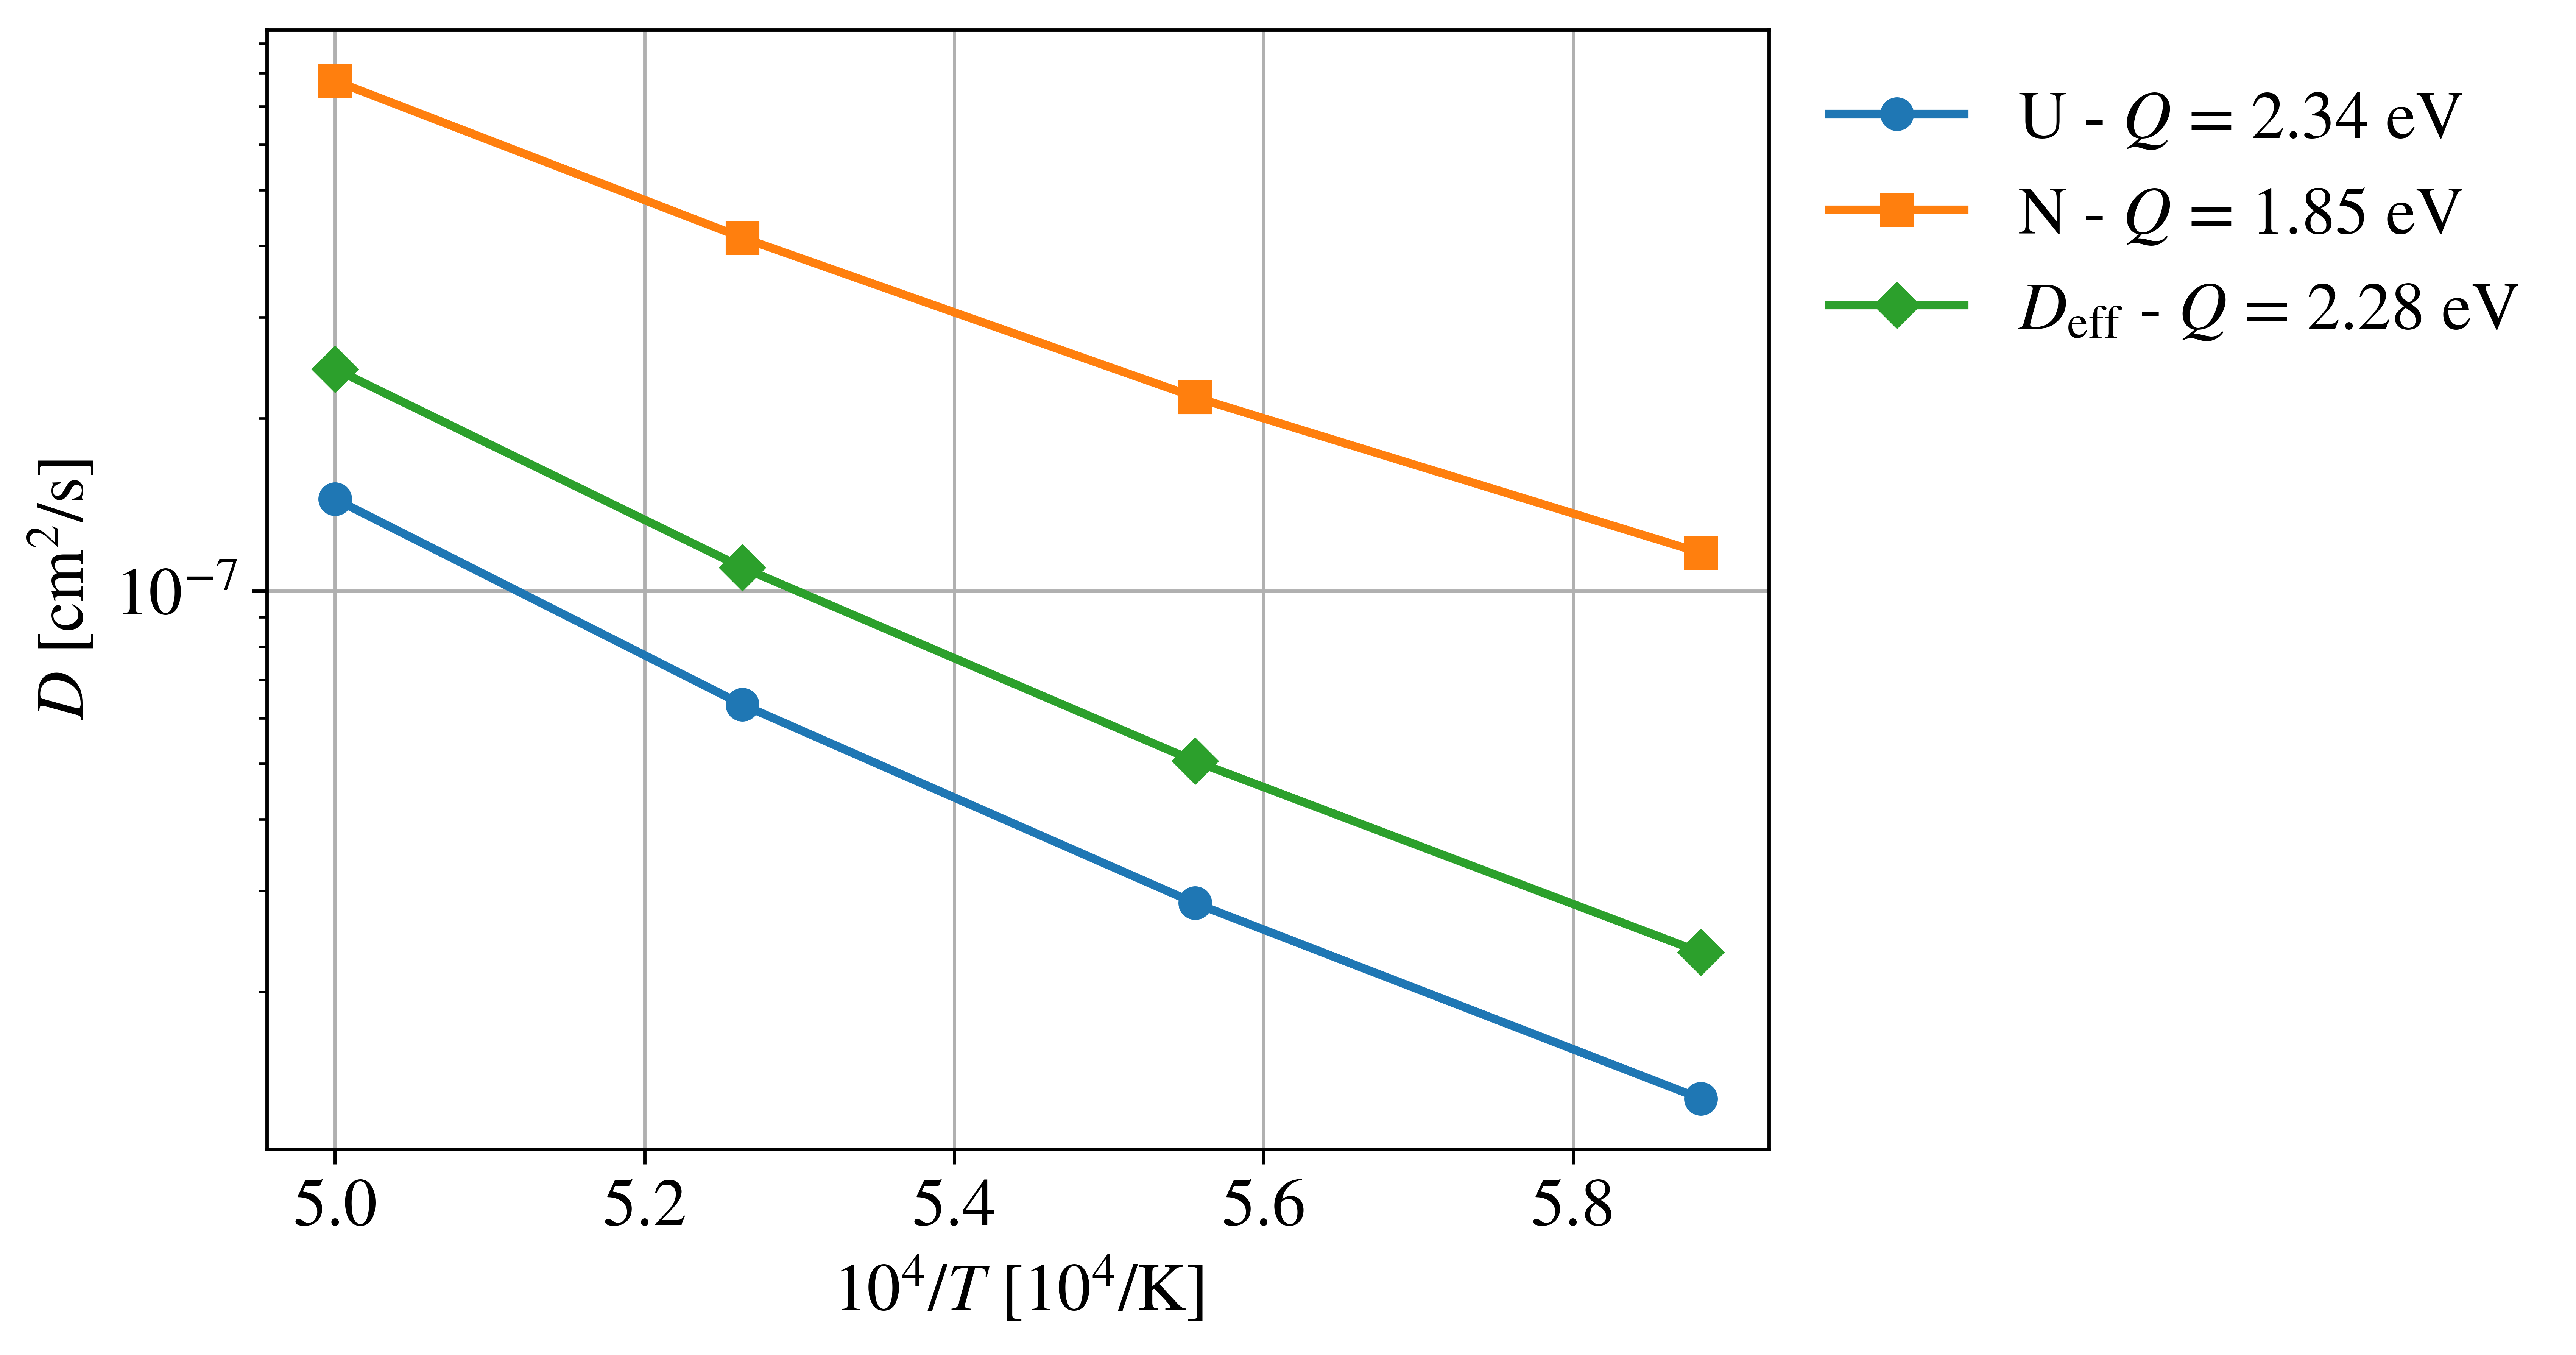
To calculate the bulk diffusivities of U and N atoms, an unbound Schottky pair is randomly introduced within a UN supercell which is then equilibrated at temperatures of 1700–2000 K and zero pressure under the NPT ensemble for 100 ps [51]. After equilibration, the mean squared displacements (MSD) of both species are averaged every 1 ps for a total simulation time of 5 ns. The results are shown in Fig.˜3(a). It is apparent that the U atoms do not diffuse within bulk UN and only undergo vibrational motion in their positions. N atoms start to show non-zero diffusivity only at 2000 K and only vibrate around their equilibrium positions at lower temperatures. According to the Einstein relation, in the limit of an infinite time. Fitting the MSD curve for N atoms at 2000 K over the final 3 ns gives cm2/s. This diffusivity value is negligible compared to the GB diffusivities of either U or N atoms (Fig.˜3(b), which will be described later in this subsection). Because U atoms do not undergo any measurable diffusivity, we can conclude that bulk diffusivity is essentially non-existent and all the atomic movement in the polycrystals can be solely attributed to GB diffusion.
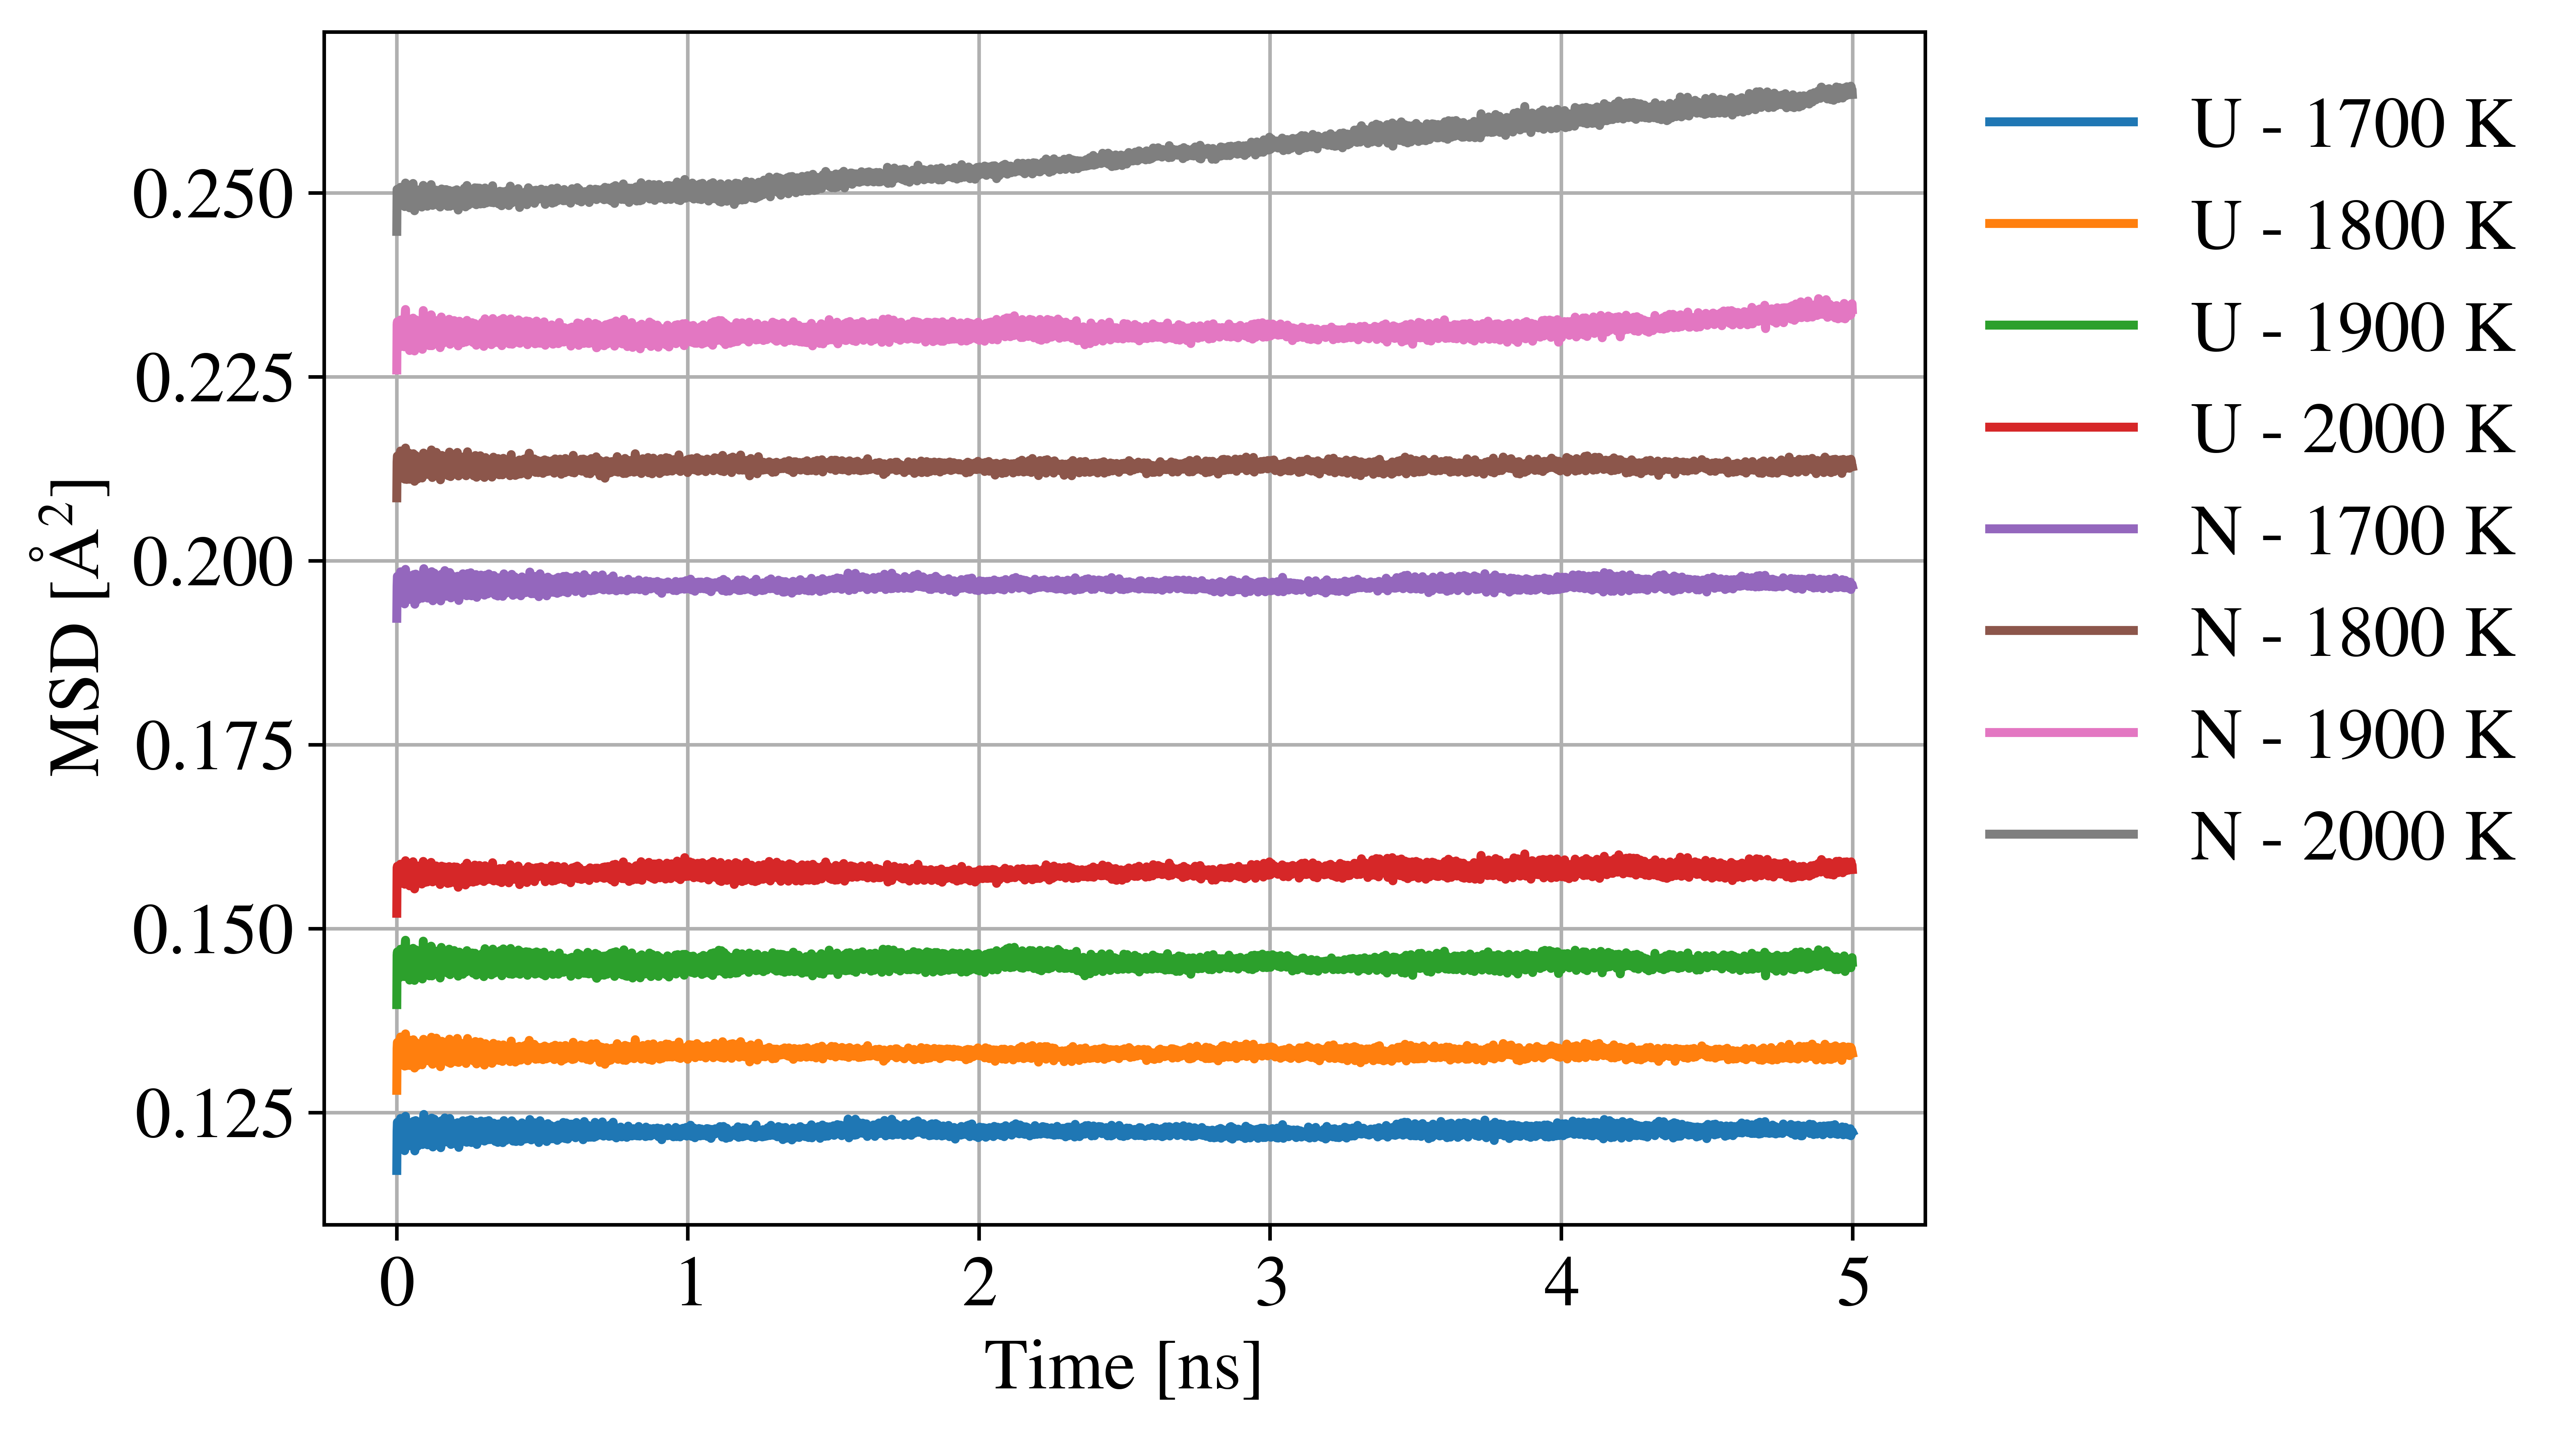
The motion of all atoms in stress-free polycrystals with a grain size of 20 nm has been tracked. The polycrystal is equilibrated at the target temperature and zero pressure within the NPT ensemble for 50 ps. Then, the MSD of all atoms of both types is averaged every 1 ps for a total averaging time of 5 ns. It was shown earlier that bulk diffusion is absent and all the atomic movement is attributed to diffusion along the GBs. Diffusion in the direction perpendicular to a GB is usually much smaller than the other two directions spanned by the GB, and GB diffusion is treated as a two-dimensional (2D) phenomenon [50]. Thus, we calculate the GB diffusivity of each atomic species by a linear fit of the MSD of that species over the last 3 ns to the 2D Einstein relation:
| (9) |
The results of such calculations are shown in Fig.˜3(b). The calculation of the variable for each temperature and grain size will be shown later. After getting the GB diffusivities of U and N atoms, the effective diffusivity is calculated based on Gordon’s formula (Eq.˜7). The effective activation energy of GB diffusion is = 2.28 0.09 eV and the prefactor is = 0.130 0.075 cm2/s (which has the typical order of magnitude). It can be seen that the activation energy of GB diffusion in stress-free polycrystals ( eV) is closer to the assumed activation energy of GB diffusion in UN ( = 2.65 eV [12]) than the fitted activation energy of Coble creep simulation ( = 1.79 eV). Additionally, we repeated the GB diffusion calculation for grains with sizes of 14–18 nm and found that the standard deviation of is 0.03 eV, and that of is 0.02 eV. Compared to this, the fitted activation energy of Coble creep has a larger uncertainty of 0.33 eV. This discrepancy can be attributed to the stress effect on GB diffusion. In general, GB diffusivity increases with the applied stress [24], which might be manifested by a reduction in the activation energy. A reduction in the activation energy stems from an increase of the GB diffusivity at the higher temperatures for which the stress effect on the GB diffusivity is more pronounced. It is also observed that the activation energy for the effective diffusivity is nearly dominated by that of U atoms, which confirms the assertion that the GB diffusion of the slowest-moving species, i.e., U atoms, is rate-limiting for Coble creep.
3.2.2 Grain-boundary width
Next, we closely analyze the GB width. At first, we need to differentiate between two concepts of GB width in high-purity materials [44, 52]: (a) diffusional GB width, , which corresponds to the width within which atoms diffuse, and (b) structural GB width, , which corresponds to the width within which miscoordinated atoms exist, whether they diffuse or not. Keblinski et al. [44] found in their atomistic simulations that is thermally activated and shows an Arrhenius dependence on temperature. However, their analysis was based on bicrystals, which usually contain symmetric tilt GBs and are not necessarily representative of realistic microstructures. Additionally, the analysis was conducted at temperatures near the melting point, which are not usually accessible in GB diffusion experiments due to the simultaneous contribution of bulk diffusion at these high temperatures. Thus, their results could not be experimentally verified. On the other hand, Prokoshkina et al. [52] conducted an extensive analysis of the measured GB widths of various metals and compounds and found that the GB widths measured in GB diffusion measurements do not show any dependence on temperature or grain size. The purpose of this section is to resolve this apparent conflict between atomistic simulations and experiments and provide a consistent definition for GB width that can be extracted from atomistic simulations and agrees with the experimental data. We begin by using our GB diffusivity data to extend the analysis from Keblinski et al. to polycrystals of uniform size and shape and temperatures relatively far from the melting point.
The diffusion flux at the GB (in m3/s) is a product of the GB diffusivity and diffusional GB width: , and can be expressed as follows:
| (10) |
where both the MSD of GB atoms, MSD, and the number of atoms diffusing within the GB, , are functions of temperature. In A, we derive the following formula for the diffusional GB width of polycrystals:
| (11) |
where is the volume of a space-filling grain and is defined as the fraction of atoms that have undergone non-affine displacements of at least the nearest-neighbor distance in the limit of infinite simulation time. For UN, the nearest-neighbor distance is , where is the lattice parameter. can be estimated using the displacement-vectors (DV) modifier in OVITO [32] applied to snapshots of the polycrystal. is a shape factor that depends on the grain shape. For truncated-octahedral grains, . Note that, unlike the calculation of the GB diffusivity which is based on averages taken during the MD simulation, the estimation of the GB width is a post-processing step.
Although Eq.˜11 is derived for grains of uniform size and shape, it is principally applicable to grains of random sizes and shapes provided that the average grain volume is treated as the volume of a truncated octahedral grain and the grain size distribution is relatively narrow. In this case, Eq.˜11 can be readily applied to estimate for any polycrystal using . The advantage of this method is that it enables us to determine for a microstructure that contains realistic grain features like triple lines and quadruple junctions. In contrast to other methods based on bicrystal simulations, our proposed method simultaneously samples many GBs with various misorientations and gives an effective value for averaged over all of them.
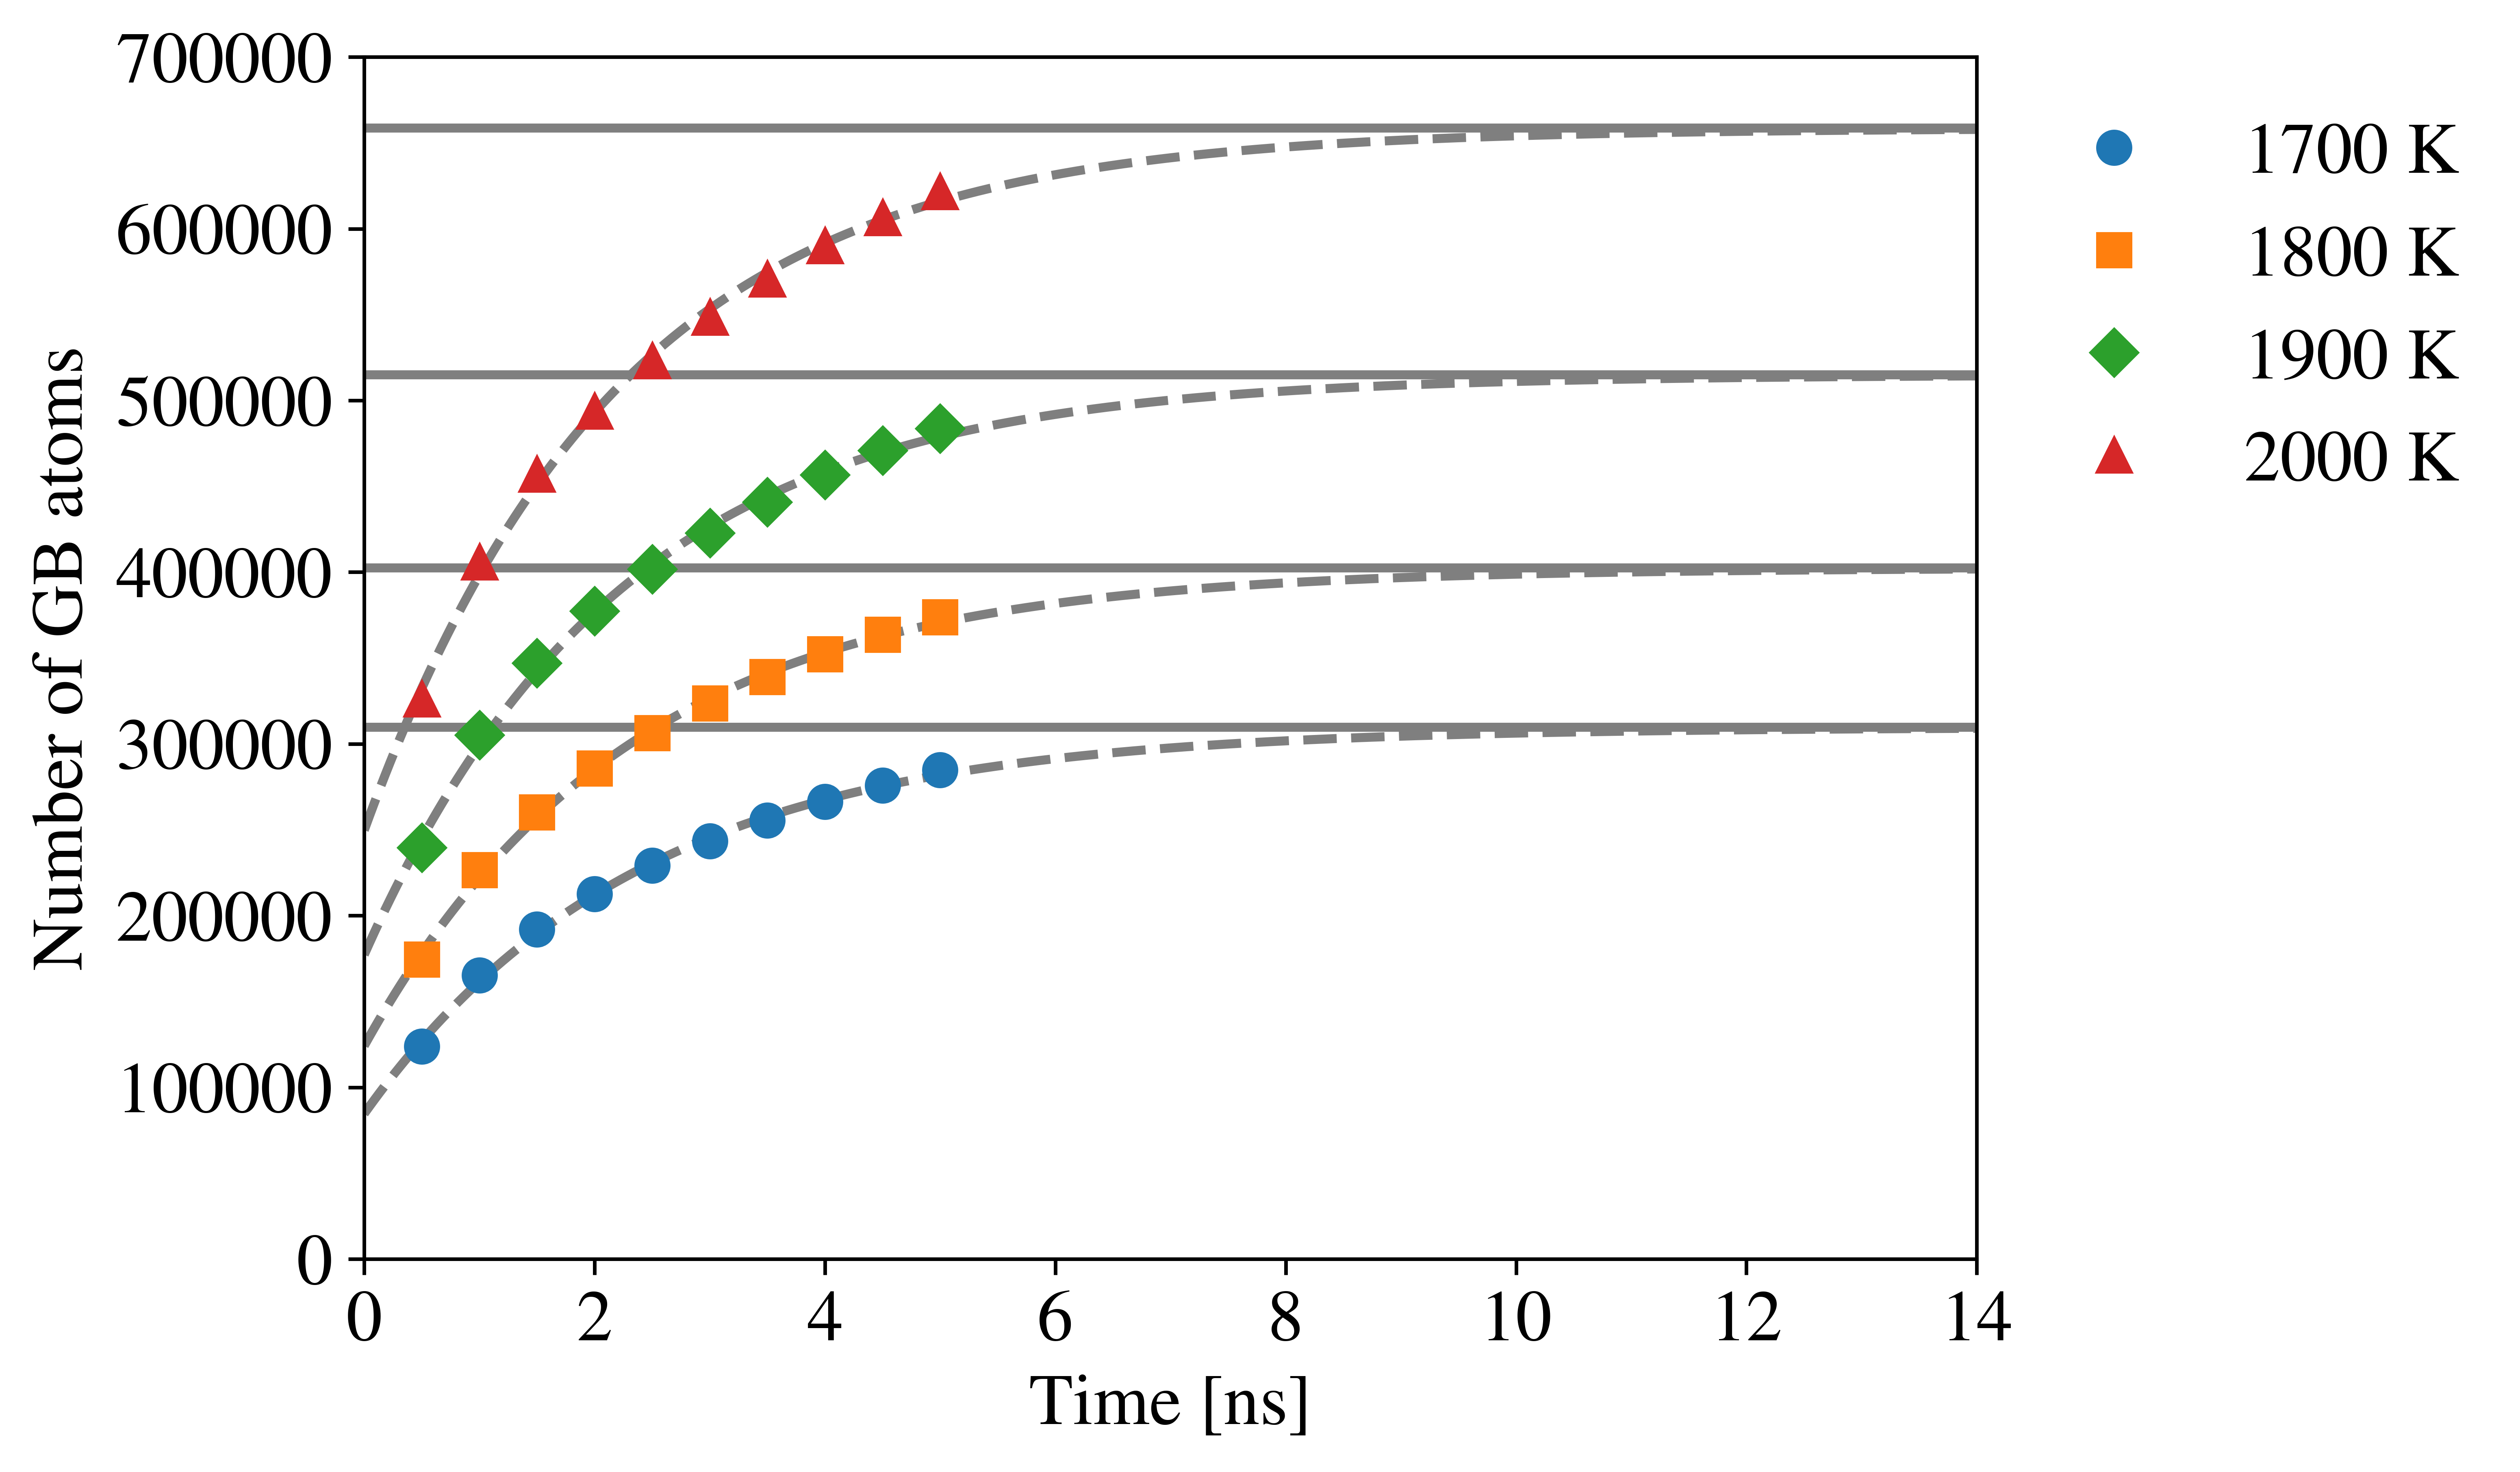
This analysis is implicitly based on two assumptions. First, in the limit of a very long time, the number of GB atoms that have moved by at least the nearest-neighbor distance will saturate to a value determined by the temperature. This was assumed by Keblinski et al. [44] but never proved. To demonstrate that this is indeed the case, we use OVITO’s DV modifier to track the number of diffusing atoms in a stress-free 20-nm supercell. To probe the effect of the stress and the grain size on the diffusional GB width, we conduct the same analysis for the 20-nm supercell under stresses of 400 MPa and 500 MPa and the 18-nm supercell under a stress of 500 MPa. In all cases, the number of diffusing atoms is fitted to a saturation function of the form:
| (12) |
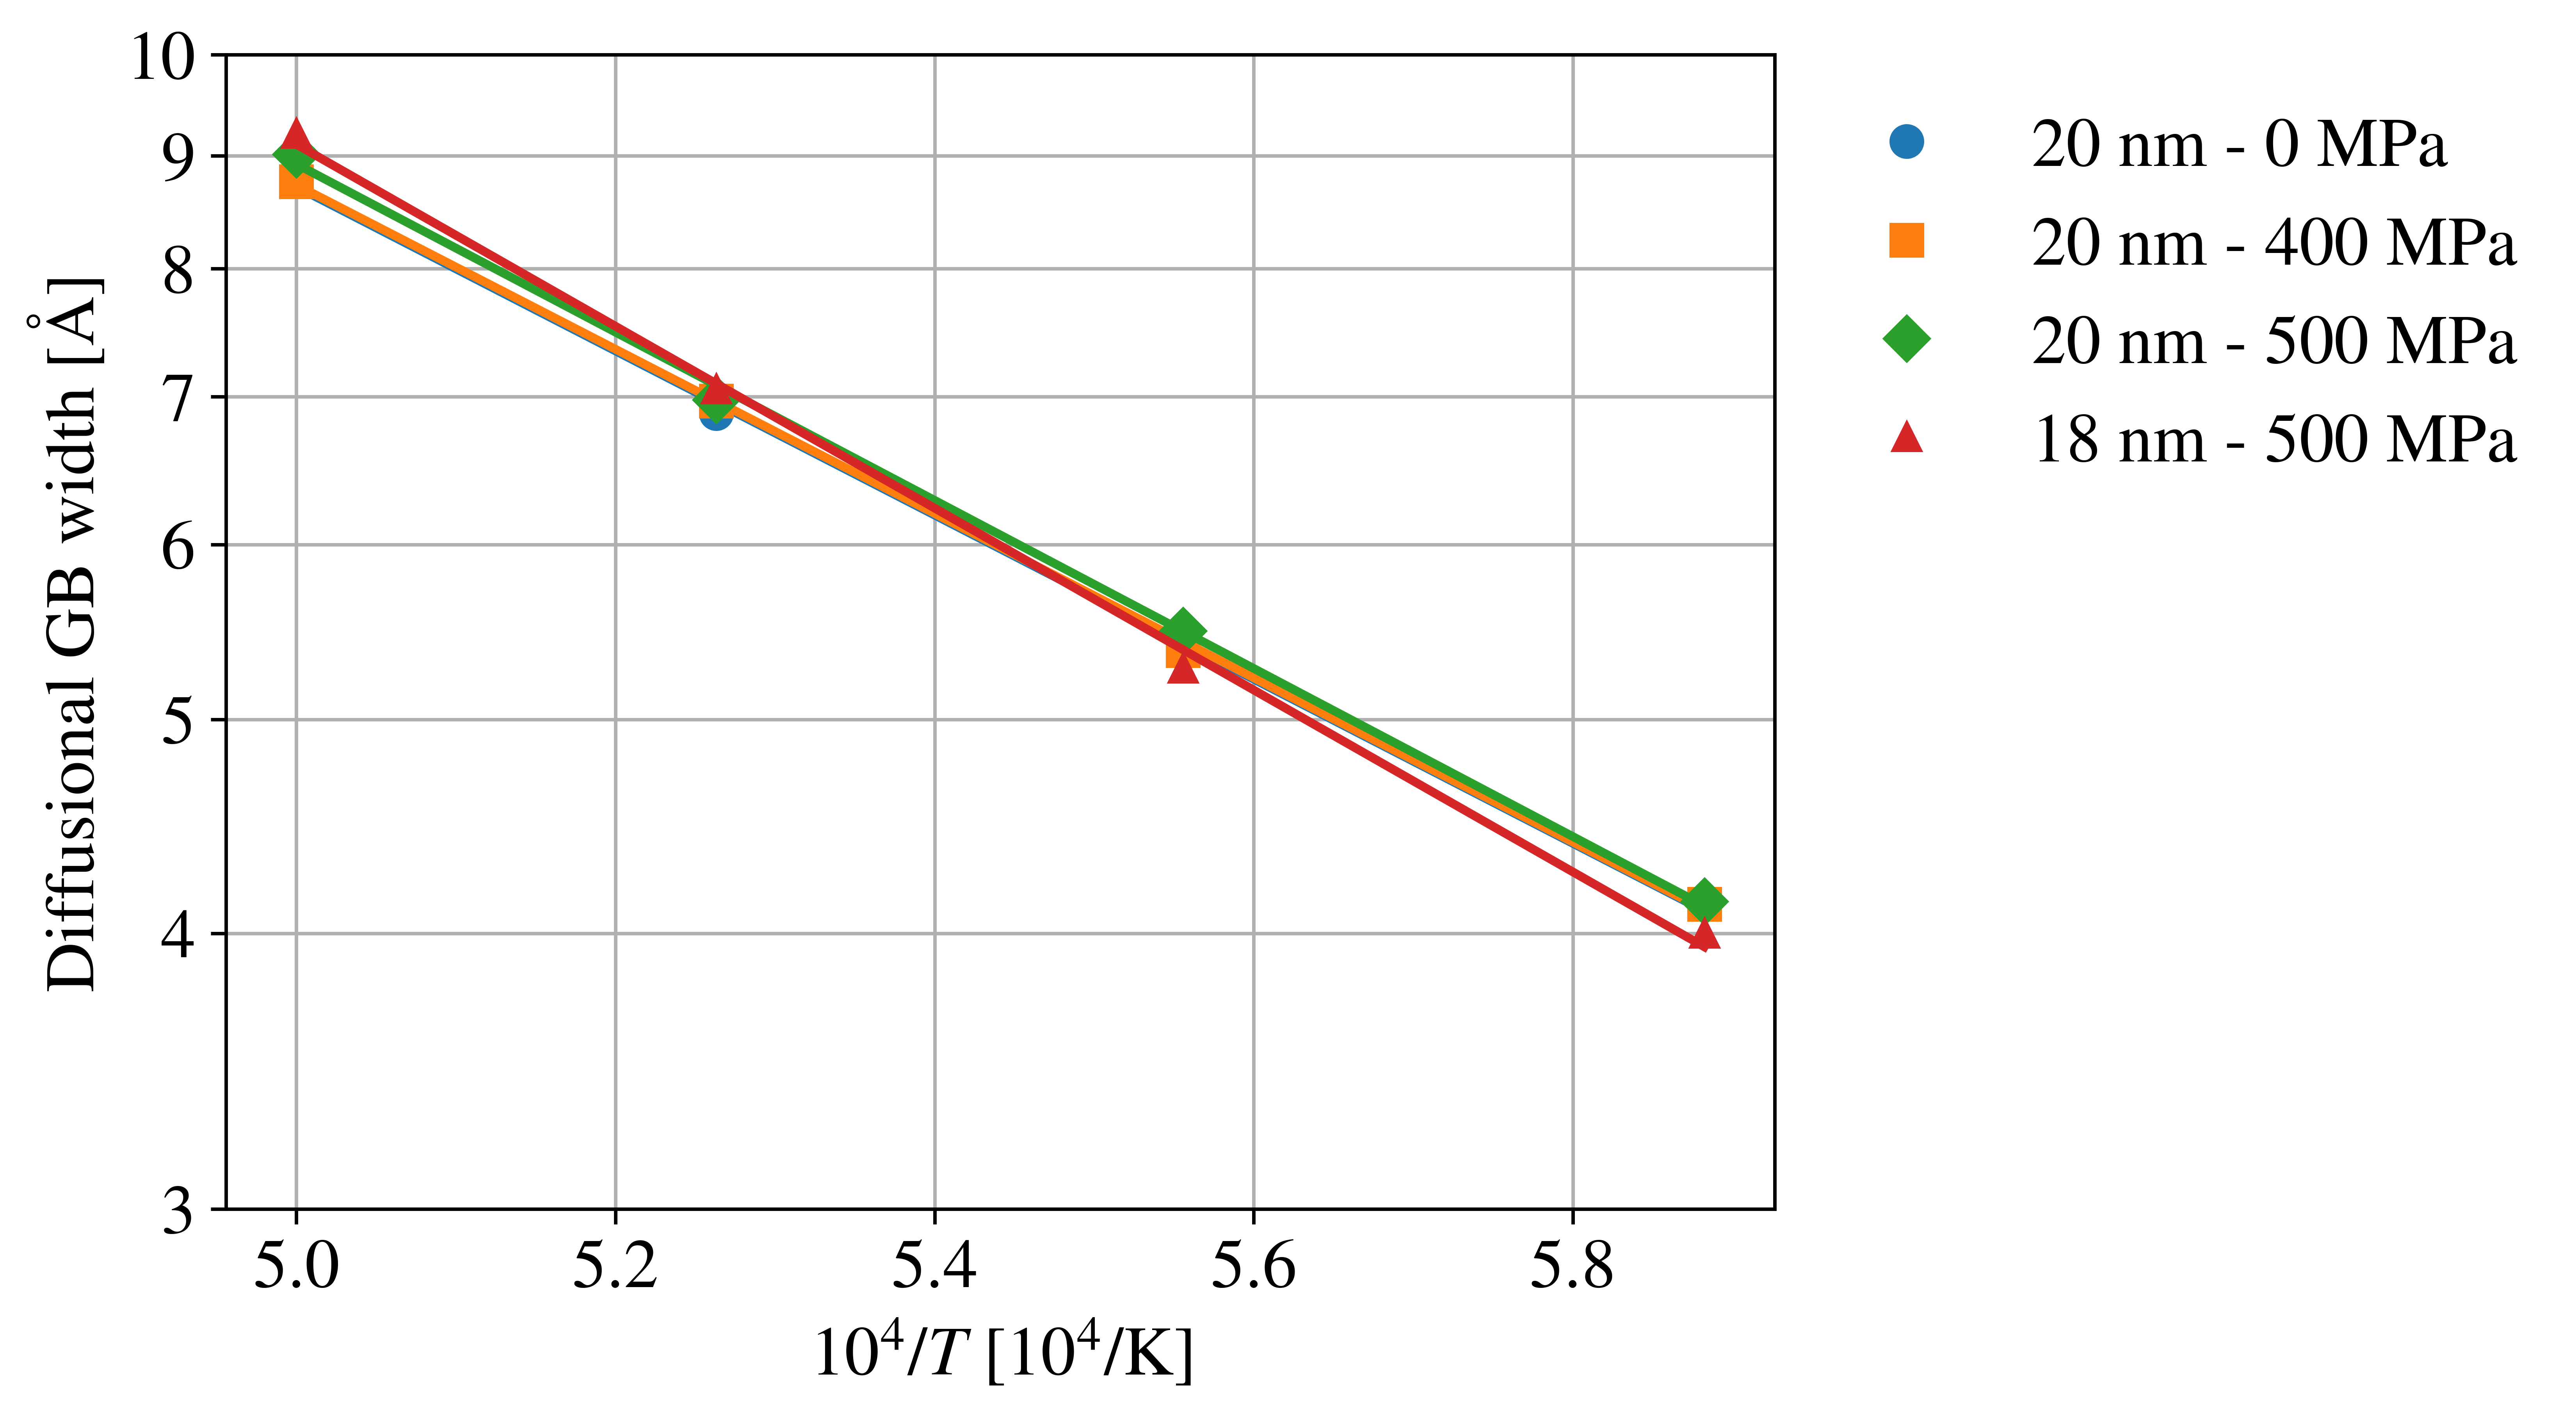
In the limit of infinite time, the exponential dies out, and . The result of the fitting for the 20-nm supercell under no stress is shown in Fig.˜4(a), which demonstrates that perfectly follows a saturation function, and that the saturated value of increases with increasing temperature. Similar trends have been observed for the other tracked supercells. The saturated values of are then fitted to an Arrhenius-type function. The results of such fitting for the tracked supercells are shown in Fig.˜4(b), which shows that the diffusional GB width perfectly follows an Arrhenius behavior that is independent of supercell grain size and applied stress. The activation energy for all tracked supercells is 0.74 0.01 eV for the 20-nm supercell at all stress values and 0.82 eV for the 18-nm supercell. While the effect of grain size on is quite small, the effect of stress is essentially non-existent. Based on their bicrystal calculation, Keblinski et al. [44] estimated the activation energy of the GB width in Pd to be 0.22 eV.
While these results corroborate the computational findings of Keblinski et al., this Arrhenius dependence still contradicts the experimental observations that the measured GB width is independent of temperature. This leads to our second assumption: the GB width in the Coble creep formula corresponds to a temperature-independent (effective) GB width, which is calculated by extrapolating the diffusional GB width to the melting point where all miscoordinated atoms are assumed to have undergone diffusion. Extrapolating the Arrhenius curves in Fig.˜4(b) to 2700 K (the melting point as predicted by the Tseplyaev potential [28]), the effective GB width is found to be nm. This GB width should correspond to the diffusion of all the GB atoms and is the one we use in parameter-based Coble creep formulation. We show later that this value of the GB width provides an excellent prediction of the prefactor in the phenomenological Coble creep formula, which supports our second assumption.
Lastly, we need to discuss the parameter in Eq.˜11, which is used in Eq.˜9 to estimate the GB diffusivity. In analogy with the two definitions of the GB width, there are two definitions of the parameter: (a) the fraction of atoms that diffuse within the GBs, and (b) the fraction of miscoordinated atoms existing within the GBs, whether they diffuse or not. A third definition [12] is to estimate as the volume fraction of the GBs based on the formula:
| (13) |
where is the GB width, and is the grain diameter. The same procedure of calculating the GB width is used to extract the parameter of the 20-nm polycrystal to calculate the GB diffusivity in Section˜3.2.1. Note that the saturated number of GB atoms is linearly proportional to the diffusional GB width (Eq.˜16), and, thus, both follow an Arrhenius behavior with the same activation energy. Like the GB width, we extrapolate the Arrhenius plot of the saturated number of GB atoms up to the melting temperature to extract the number of miscoordinated atoms. This number is then divided by the total number of atoms in the supercell to get . Based on this procedure, = 0.44 0.01 for the stress-free 20-nm polycrystal. It should be noted that if we used = 2.69 nm, and = 20 nm in Eq.˜13, we get = 0.40. That is, the definitions of based on the volume fraction or the atomic fraction give very close results and can be used interchangeably. For macroscopic systems with in the m-range, . In effect, penalizes the nm-sized structures for having grains with a large surface-to-volume ratio.
3.2.3 Vacancy volume
The remaining unknown parameter in the Coble creep model (Eq.˜5) is the vacancy volume. To calculate the vacancy volume in UN, we construct perfect supercells and calculate the volume of the minimized structure at 0 K. Then, we separately delete U and N atoms from the center of the supercell, minimize the energy of the defective structure, and finally calculate the vacancy volume as the volume difference between the pristine and defective crystals. All structures have been minimized with a relative energy tolerance of 10-9. The result of such calculations is presented in Table˜2, where the atomic volume is also given for reference. We use the values of the Tspelyaev potential, but those calculated by the Kocevski potential are also shown for comparison. It can be observed that the Kocevski potential predicts a positive volume for the N vacancy, which is unphysical. The reason for this is that upon removing the N atom, there is no longer a screening/shielding between the U atoms, which repel each other and lead to increasing the volume of the supercell with the vacancy. This is due to the inability of the Kocevski potential to model metallic U. From Table˜2, we take the absolute value of as the vacancy volume, i.e., = 4.963 Å3. All the values for the parameter-based Coble creep model are summarized in in Table˜3.
| Tseplyaev potential | 13.909 | ||
|---|---|---|---|
| Kocevski potential | 4.350 | 14.685 |
As a sanity check of our calculated parameters, according to the Mukherjee-Bird-Dorn phenomenological model of Coble creep [33], the product should numerically equal where is the Burgers vector. With = 46.374, we find that = 6195 Å4, whereas = 6691 Å4, with a difference of only 7.42%. This also supports our method in calculating the GB width and its associated assumptions.
| Coble prefactor, | 46.347 |
|---|---|
| Vacancy volume, | m3 |
| Effective GB width, | m |
| GB diffusivity prefactor, | m2/s |
| GB diffusivity activation energy, | 2.28 eV |
3.2.4 Comparison of Creep Predictions
We compare the simulation and parameter-based models of Coble creep in UN developed in this work to Coble creep in \ceUO2 as calculated by Galvin et al. [23]. The prefactor in the simulation model was calculated by utilizing the values in Table˜1 in Eq.˜4. The prefactor was found to have a numerical value of . For both fuels, a stress of 15 MPa, and a grain size of 10 m were assumed. The result of such a comparison is shown in Fig.˜5. It can be seen that the two models of Coble creep in UN agree to less than an order of magnitude, especially at lower temperatures. Additionally, irrespective of the creep model, the Coble creep rate of UN is approximately one order of magnitude larger than that of \ceUO2. It is also an order of magnitude larger than the Hayes et al. correlation for dislocation creep in UN. Although a stress of 15 MPa is outside the stress range of the Hayes creep correlation (i.e., 20-34 MPa), it is not very far from the range’s lower limit, and we assume it can at least provide an estimate of the dislocation creep rate for stresses slightly smaller or larger than the reported stress applicability range. This comparison shows that Coble creep in UN can be more dominant than (or is at least competitive to) dislocation creep. This agrees with the qualitative analysis by Konovalov et al. [12]. It should be mentioned that Galvin et al. [23] used a Coble creep prefactor for their \ceUO2 Coble creep formula, whereas in this work we use . However, the difference between the two values is only a factor of 3, which would have little effect on the results in Fig.˜5.
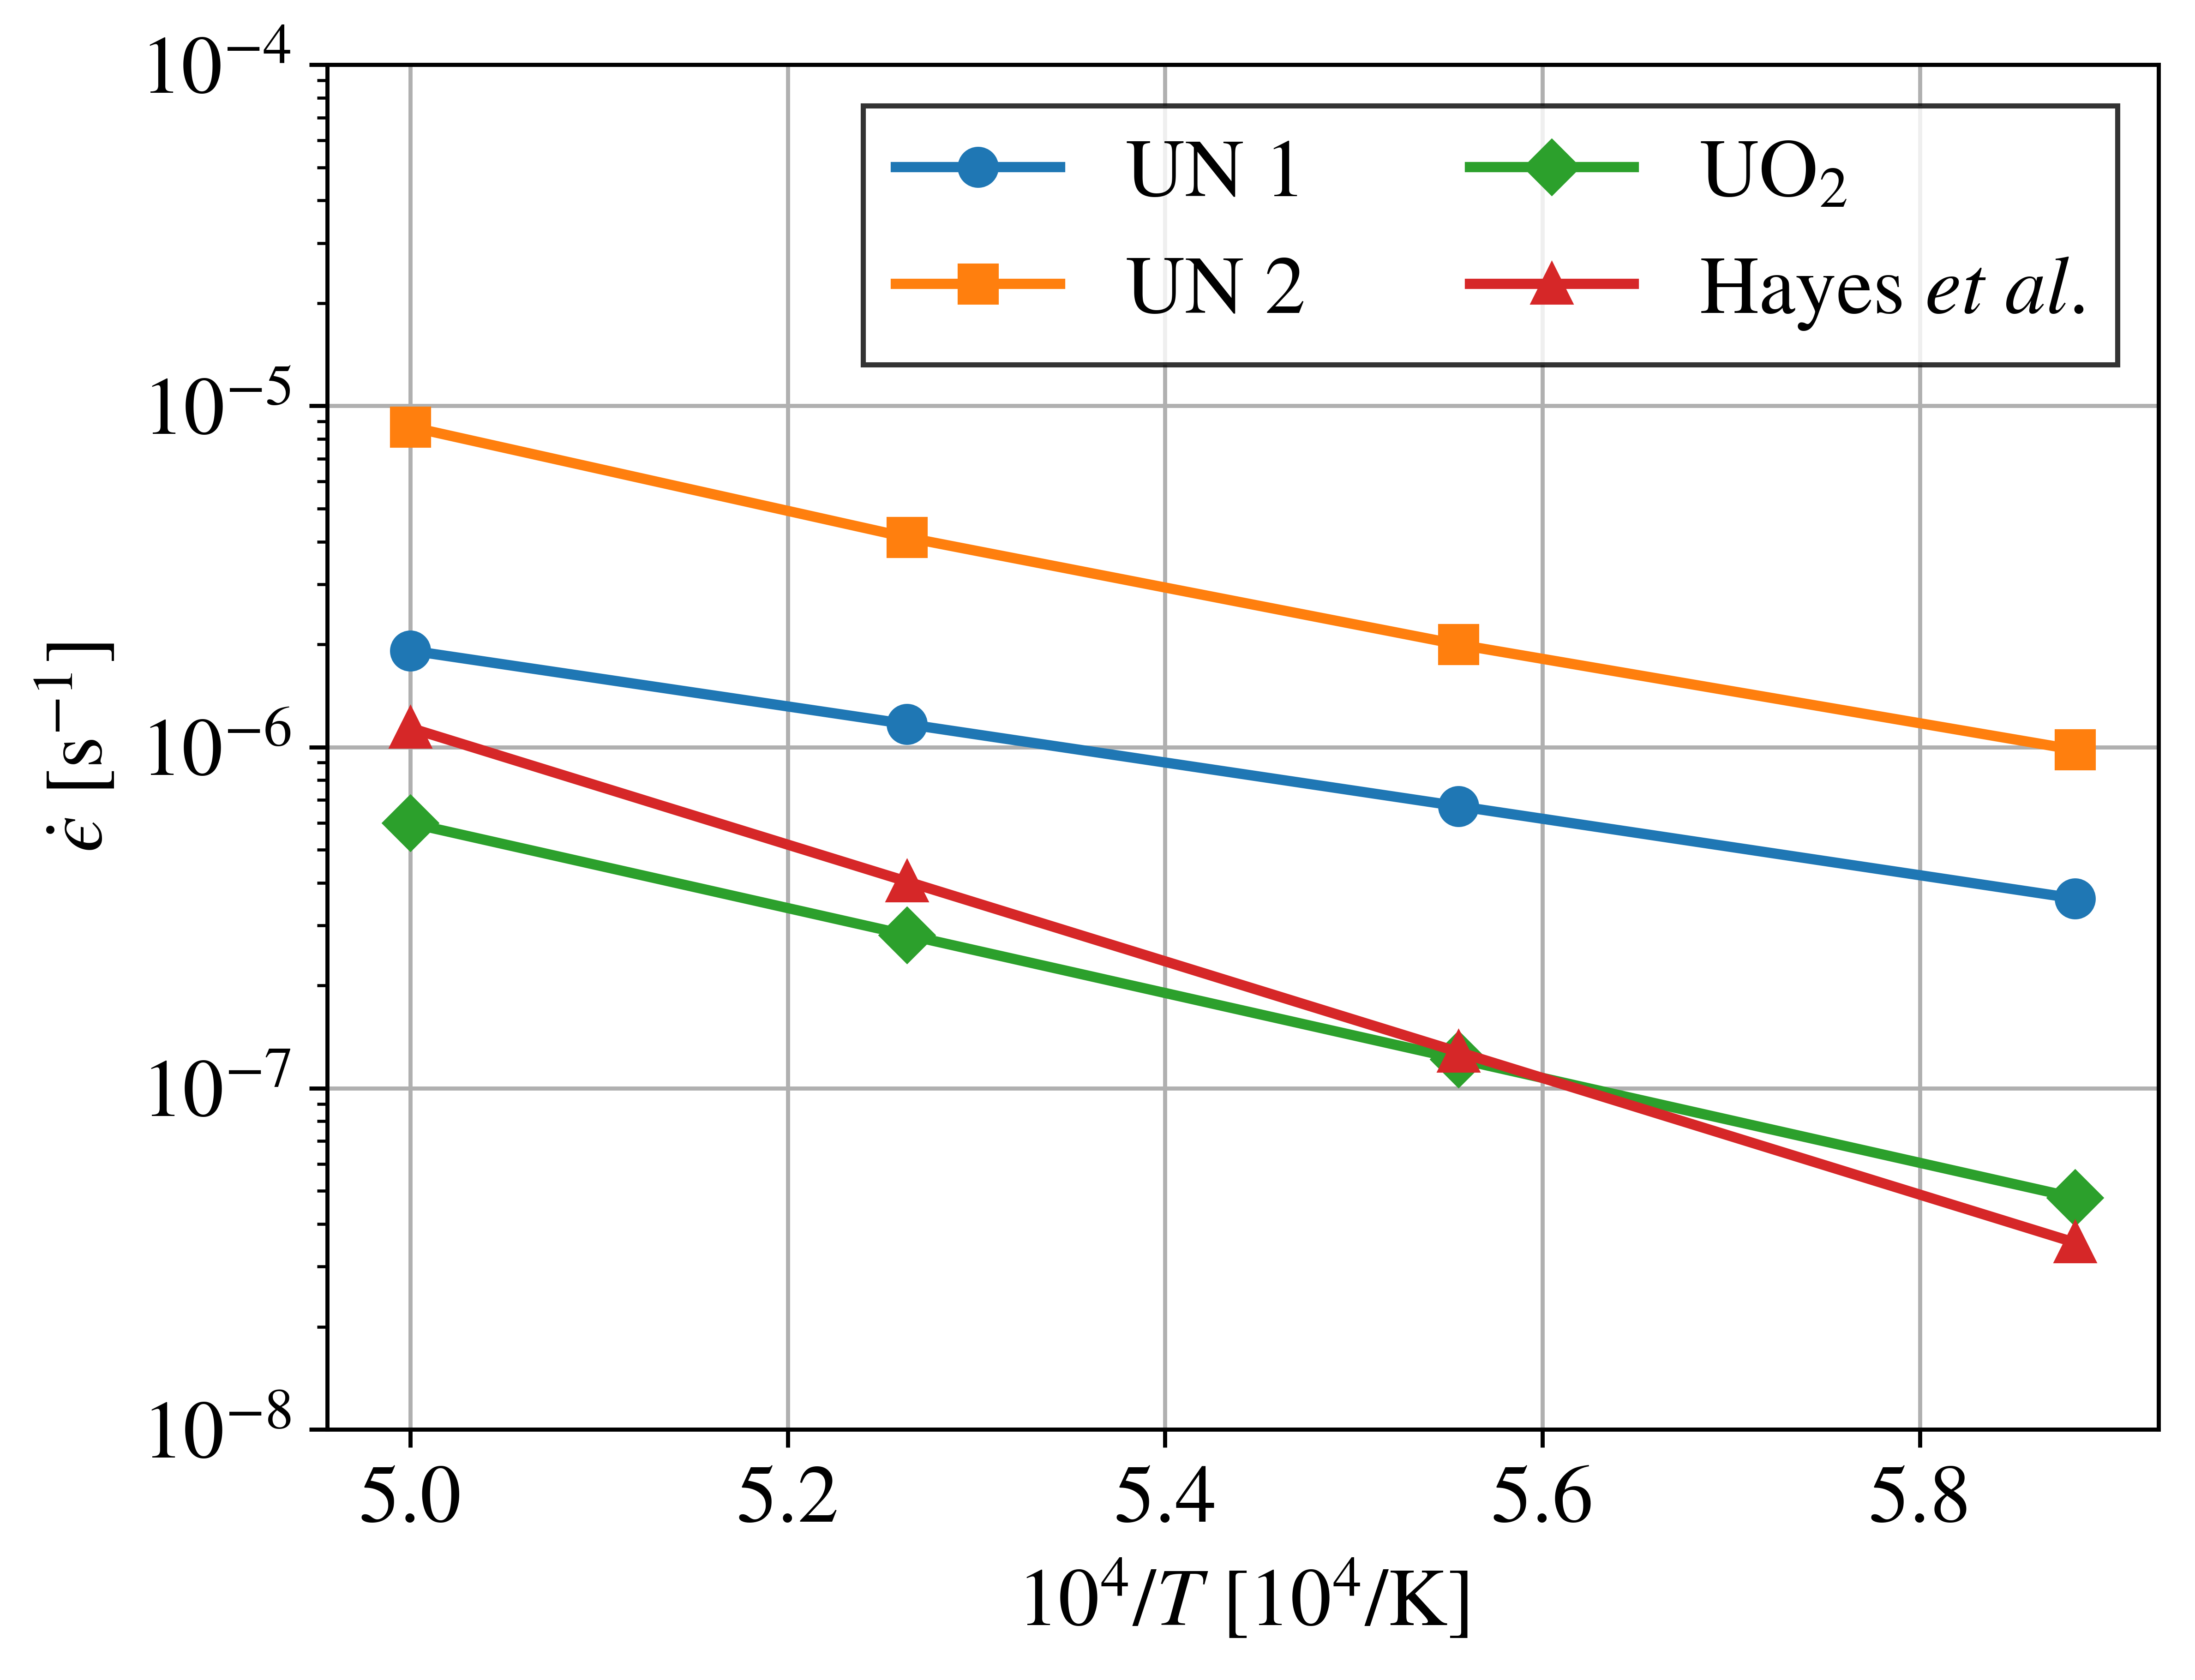
Merely comparing the properties of different fuel systems within a temperature range might not accurately represent how the fuel systems behave in reactor conditions. More appropriately, we should compare fuel behaviors at representative center-line temperatures [53]. Considering the high thermal conductivity of UN, it is expected that the center-line temperatures and temperature gradients of UN fuel rods are much lower than that of \ceUO2 fuel rods under the same conditions. For example, based on their finite-element analysis of the thermal-mechanical behavior of several advanced fuel-cladding combinations, Zeng et al. [54] have estimated the early-life centerline temperature of the \ceUO2-FeCrAl fuel system to be about 1300 K, whereas it is only about 900 K for the UN-FeCrAl fuel system. Thus, under the same early-life reactor conditions, the creep of UN is expected to be less pronounced than that of \ceUO2. The effect of irradiation on this comparison, however, requires a separate study.
4 Discussion
Parameters in Table˜1 calculated from the fitting of the diffusional creep simulation have about 16-24% uncertainty which is reasonable considering that each strain rate is an average over three unique simulations. The uncertainty can be reduced by simulating for longer times or averaging over more runs. However, this is computationally expensive for the supercells at hand whose number of atoms ranges between 1,547,344 atoms for the 14-nm polycrystal, and 4,537,943 atoms for the 20-nm polycrystal. Due to the much lower computational cost and smaller uncertainties, the parameter-based Coble creep model is recommended for use for the determination of a Coble creep rate.
An important aspect of this work is that we investigated the temperature dependence of the diffusional GB width and proposed a consistent method to calculate an effective GB width for the Coble creep formula. We found that the diffusional GB width in UN follows an Arrhenius behavior with an activation energy of about = 0.74–0.82 eV. Keblinski et al. [44] assumed that the activation energy of GB diffusion ( = 2.28 eV in our case) can be expressed as , where is the activation energy for diffusion in the amorphous structure of the GB. Based on this assumption, should be 1.47–1.55 eV. For this assumption to be verified experimentally, amorphous diffusion coefficients need to be measured for UN. However, it was never reported that UN amorphizes under irradiation. However, this does not affect our estimated GB width which nearly perfectly predicts the prefactor of the Coble creep formula, i.e., Eq.˜5. Our two Coble creep models closely agree, especially at lower temperatures. However, considering that the parameter-based model generally exhibits smaller uncertainties in its calculated parameters, is much less computationally expensive, and can be more easily extended to a larger temperature range, we recommend its use in fuel performance codes. For ease of access, the complete Coble creep rate equation is provided here:
| (14) |
where is the stress in MPa, is the temperature in K, is the average grain size in m, and is the creep rate in s-1.
The activation energy of Coble creep in UN is about 1 eV smaller than that of the dislocation-mediated creep estimated by Hayes et al. [5] and is very close to the activation energy of GB diffusion in UN assumed by Konovalov et al. [12]. This implies that there is a surface in the -space that separates regions in which Coble creep is dominant from other regions where dislocation creep is dominant. To examine this idea in some detail, we use Eqs.˜1 and 14 (our Coble creep correlation and the Hayes dislocation creep correlation) to construct deformation mechanism maps for UN to identify regions where Coble creep is dominant and others where dislocation creep is dominant. Deformation mechanism maps that examine the dominant creep mechanisms for different grain sizes and stresses at = 1800 K and 2200 K are shown in Figs.˜6(a) and 6(b), respectively. As expected, as the grain size is increased, dislocation creep becomes more dominant. The red solid line in Figs.˜6(a) and 6(b) refers to the grain size and stress range of the creep rate measurements by Fassler et al. [6], which had a stress exponent of about 4.7. The measurements are clearly in the dislocation creep region which explains the high stress exponent. It should be mentioned that Fassler et al. data were obtained at 1373–1623 K.
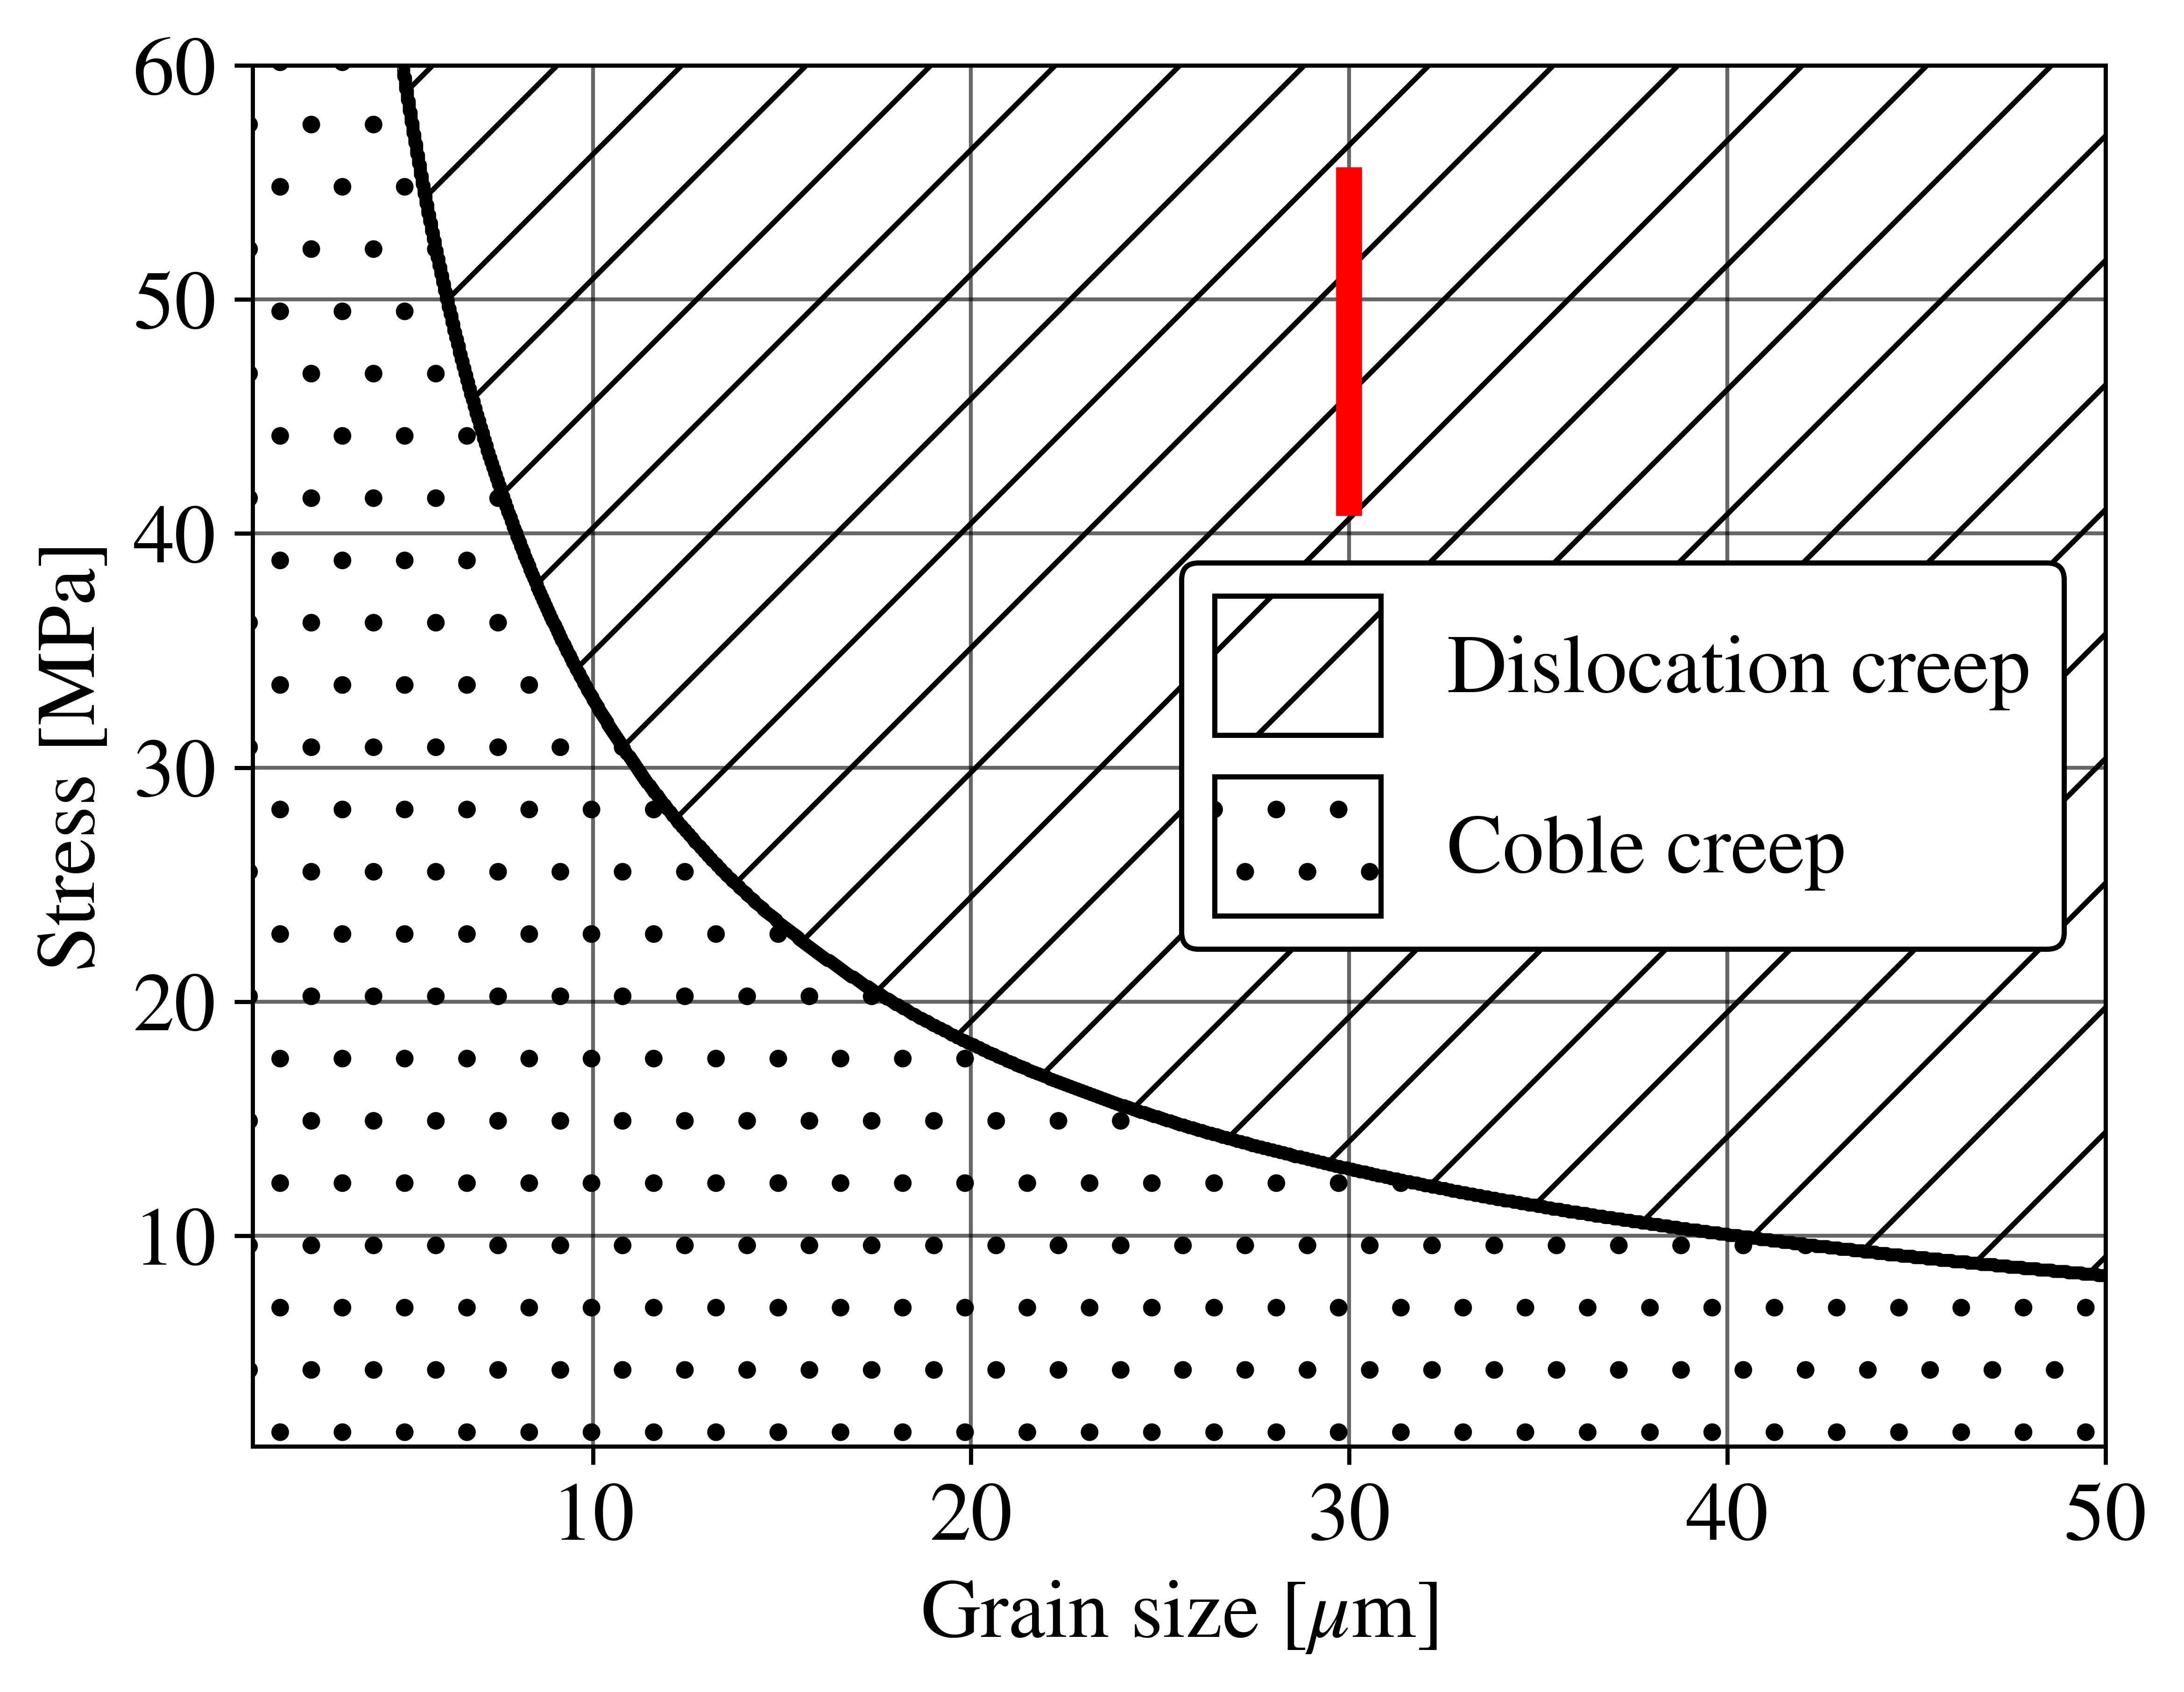
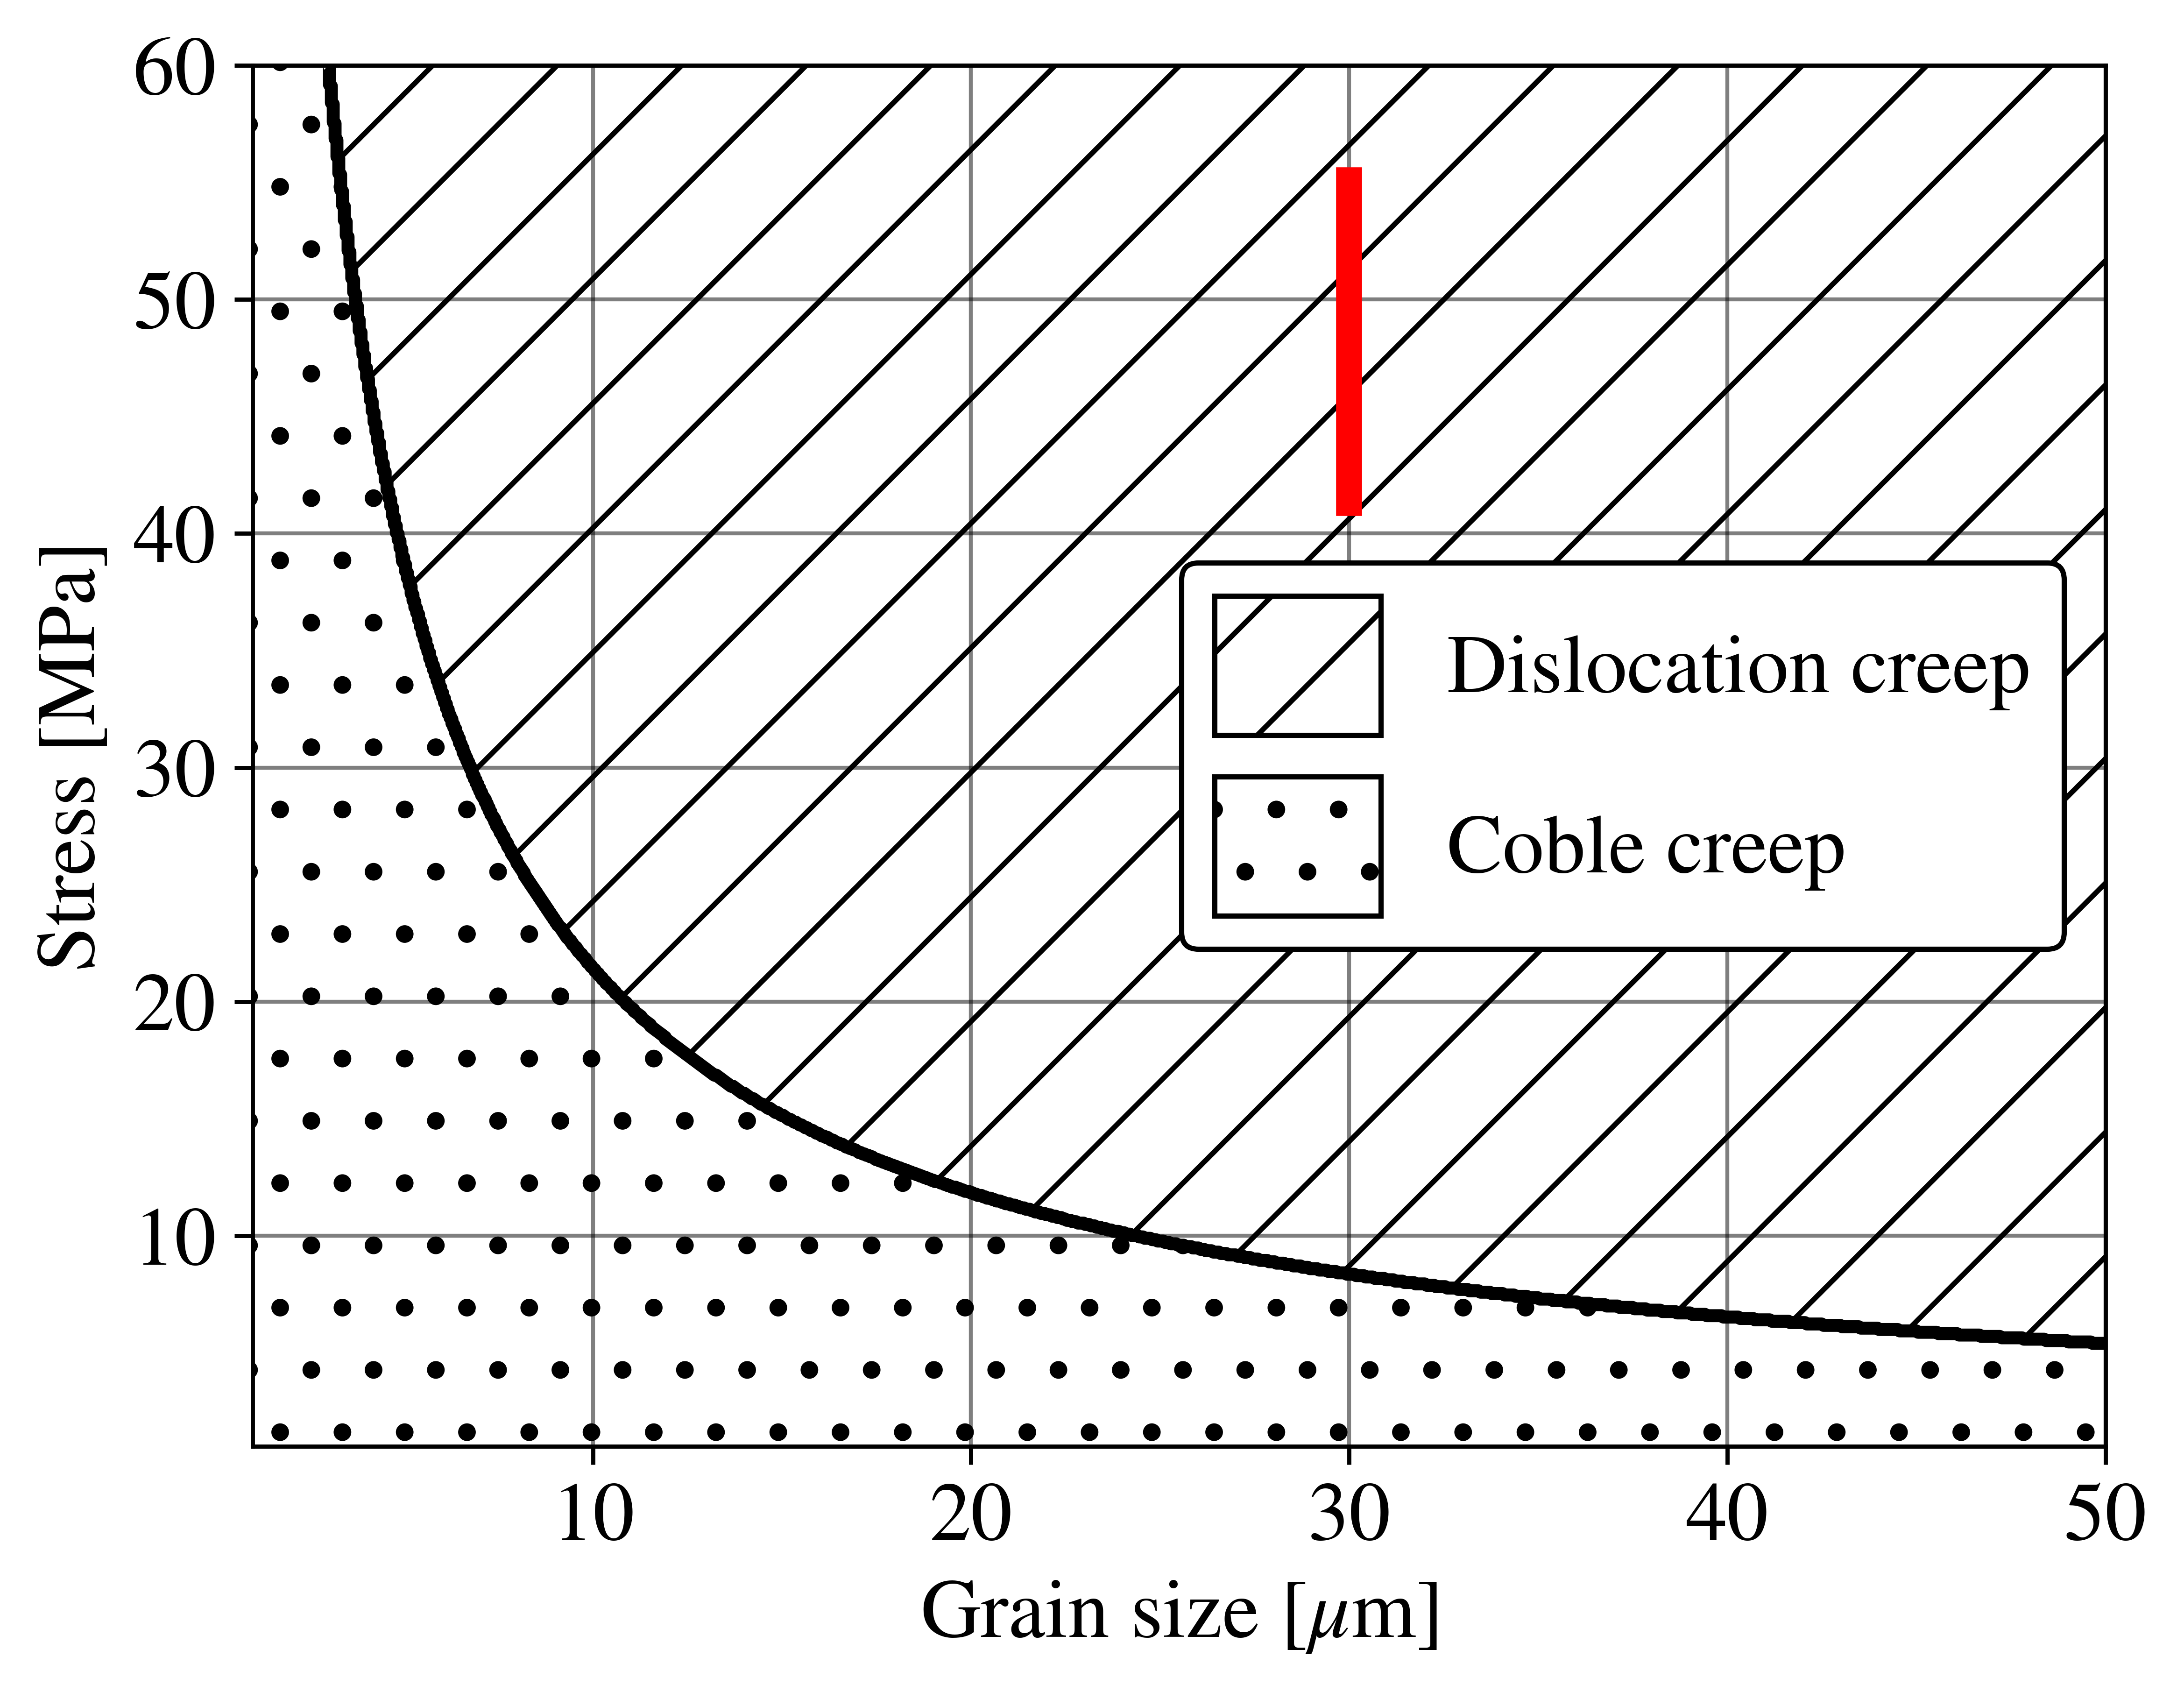
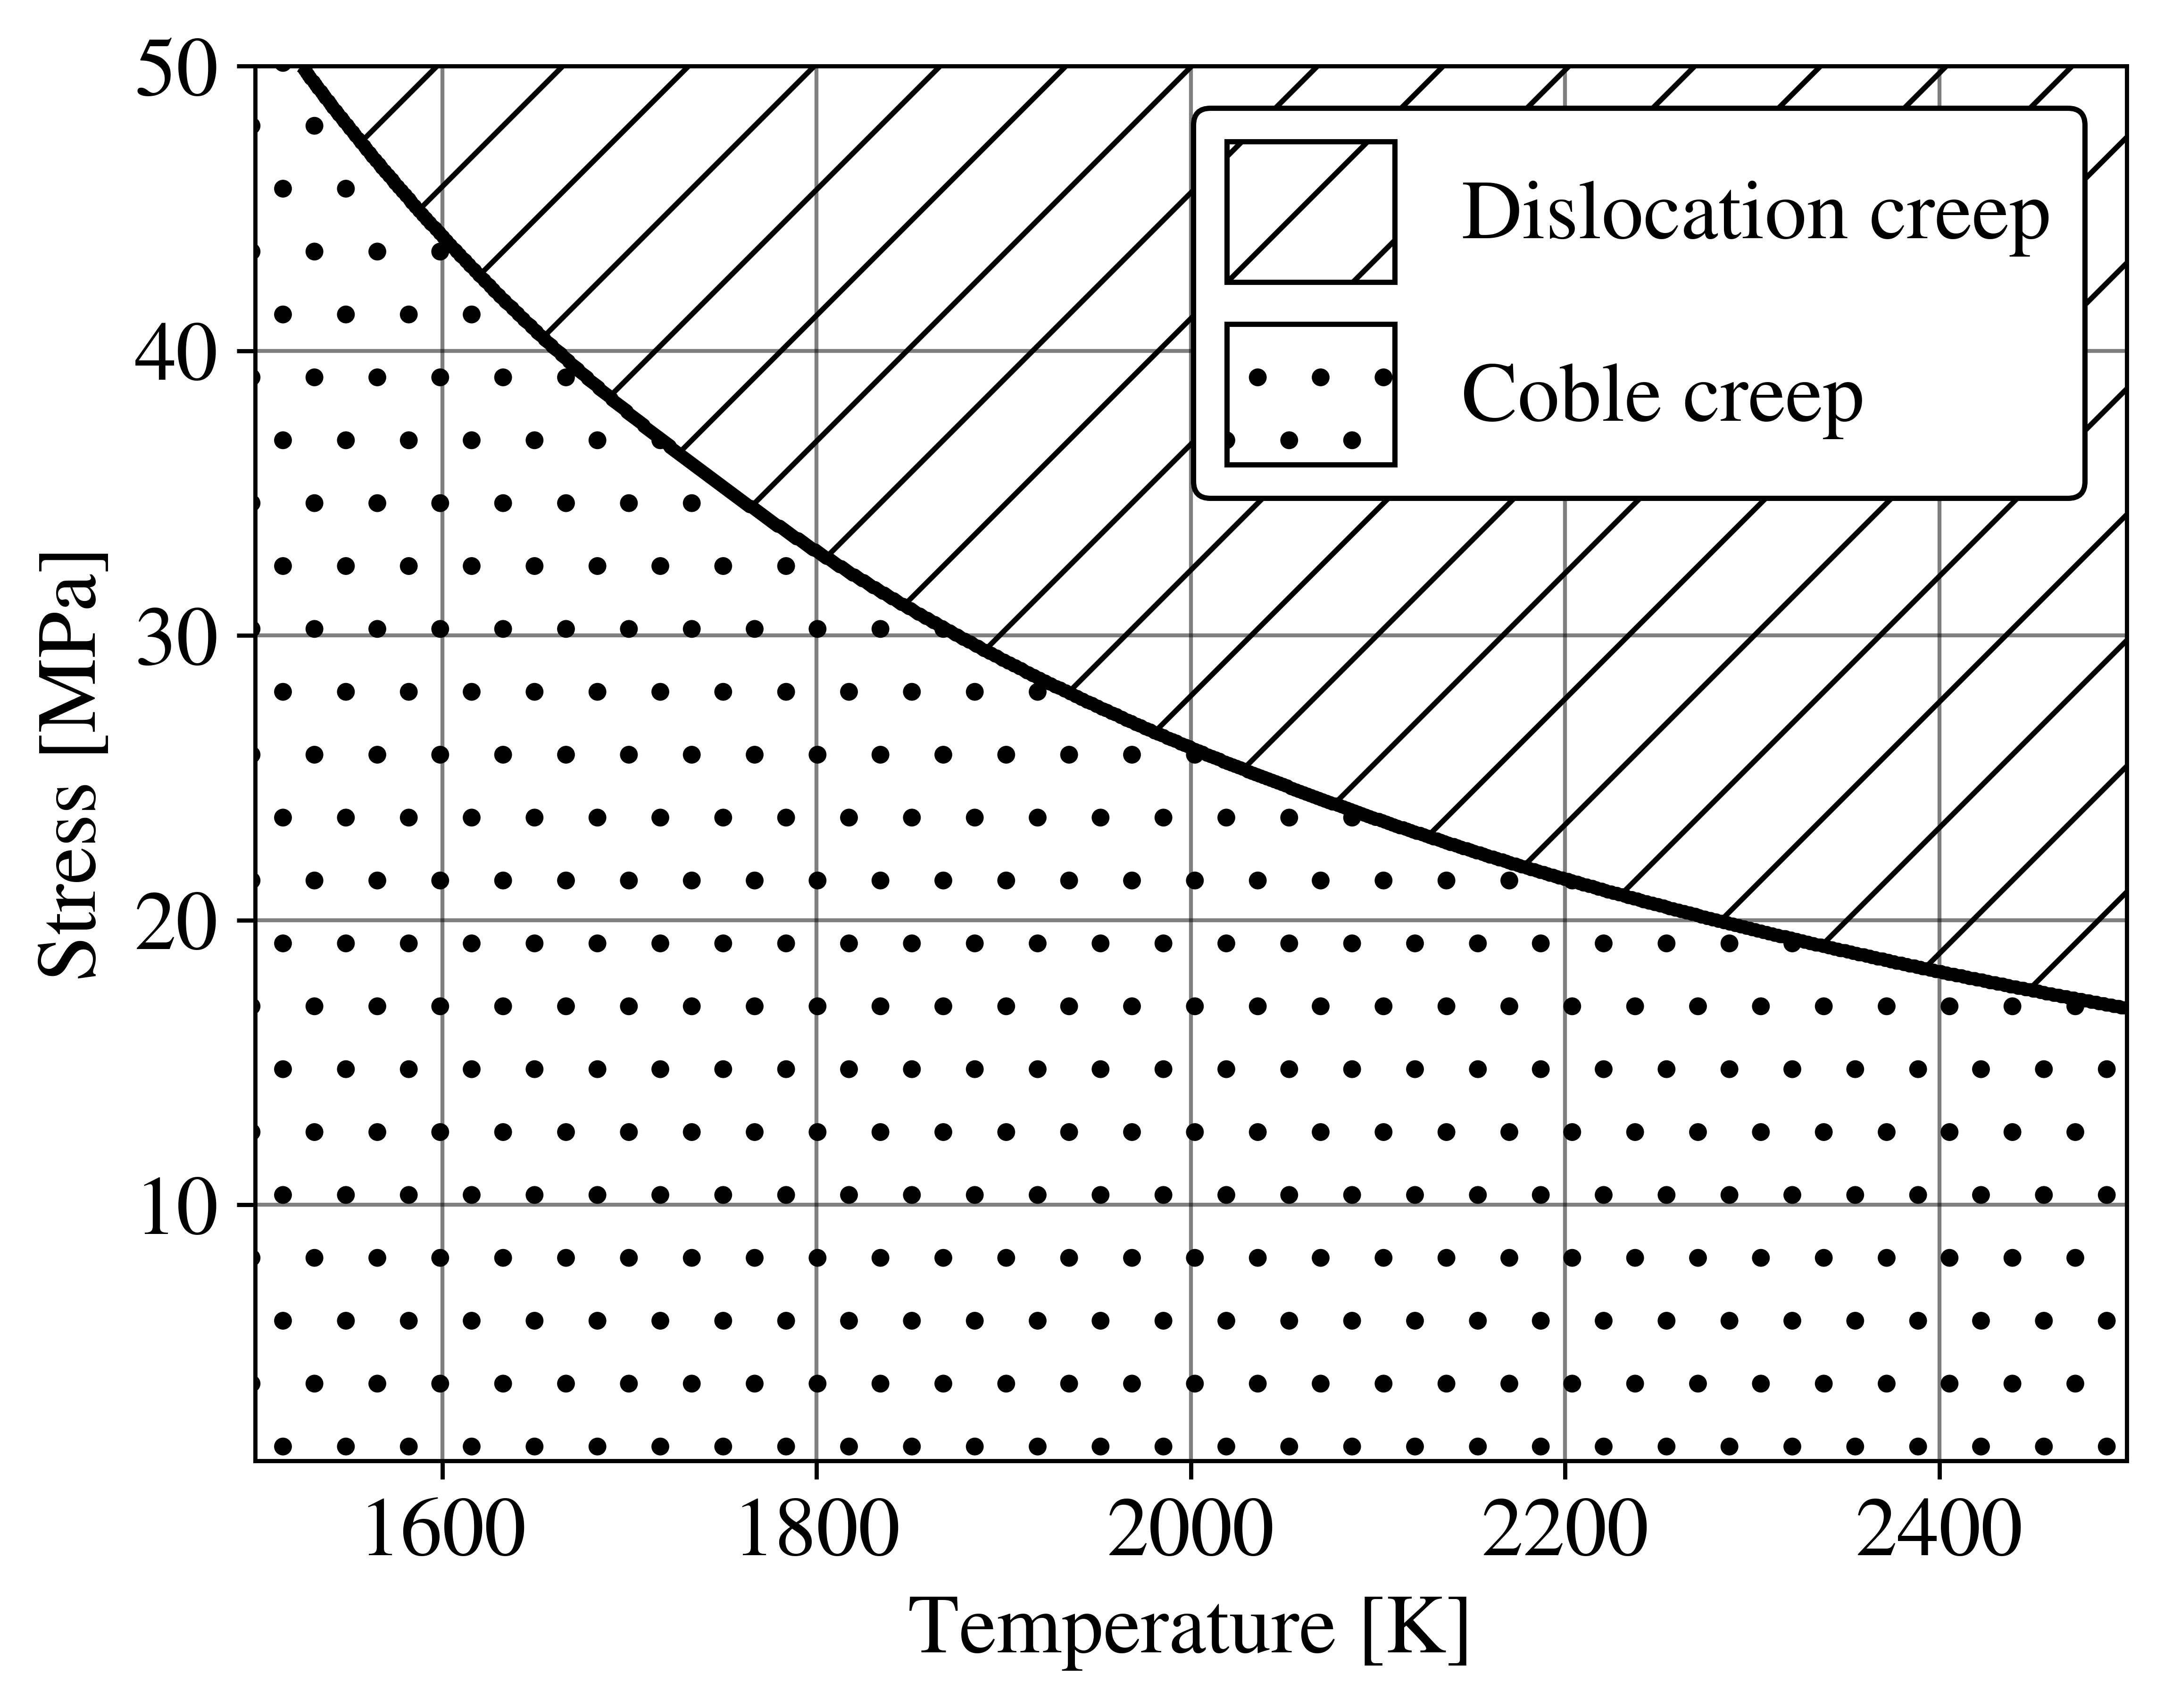
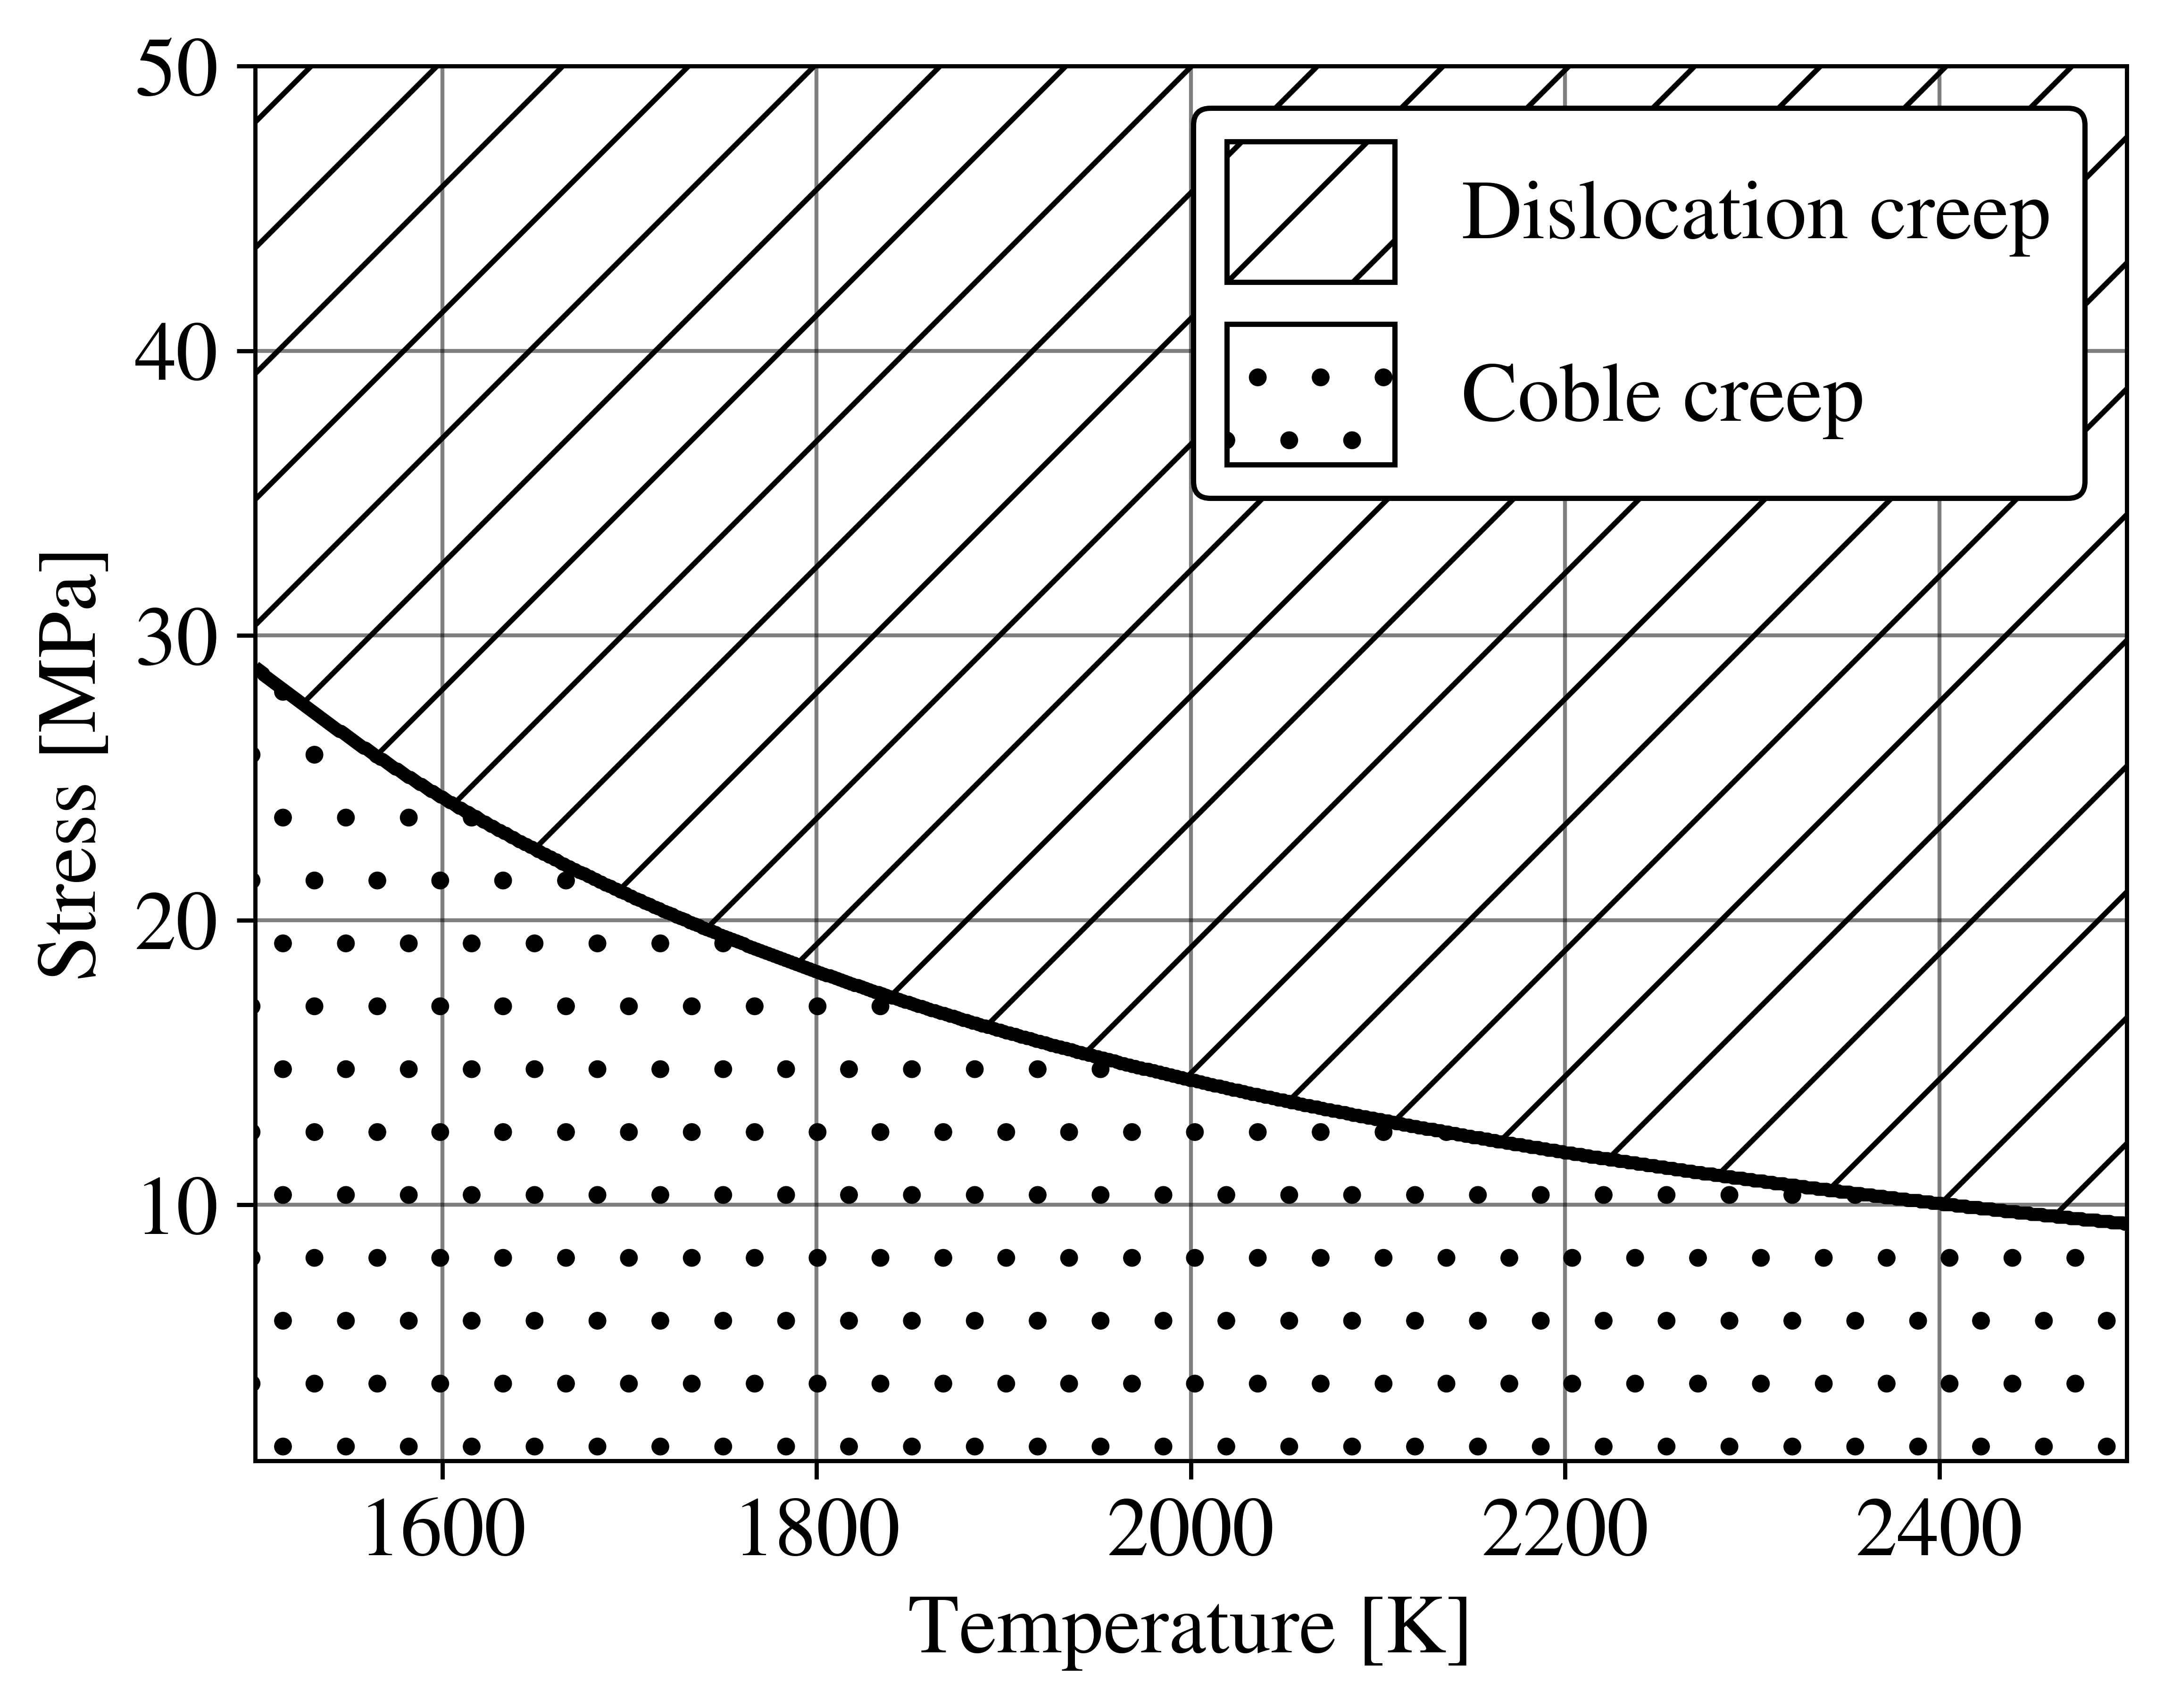
Interestingly, at = 10 m, the upper limit of the optimum UN grain sizes [14], and the stress range of 20-30 MPa, within which the Hayes correlation was fitted, Coble creep is more dominant than dislocation creep at 1800 K, and both are nearly equally present at 2200 K. Thus, a contribution of both creep mechanisms will be observed with the contribution of the dislocation creep increasing with increasing temperature or increasing the grain size. Similar deformation mechanism maps for = 10 and 20 m are shown in Figs.˜6(c) and 6(d), respectively, for different temperatures and stresses. For a stress of 20 MPa and = 10 m, dislocation creep becomes apparent at about = 2200 K, whereas for = 20 m, Coble creep is only present at temperatures below = 1700 K, where the creep rate is small anyway. The most general thermal creep correlation for UN should be a sum of both contributions:
| (15) |
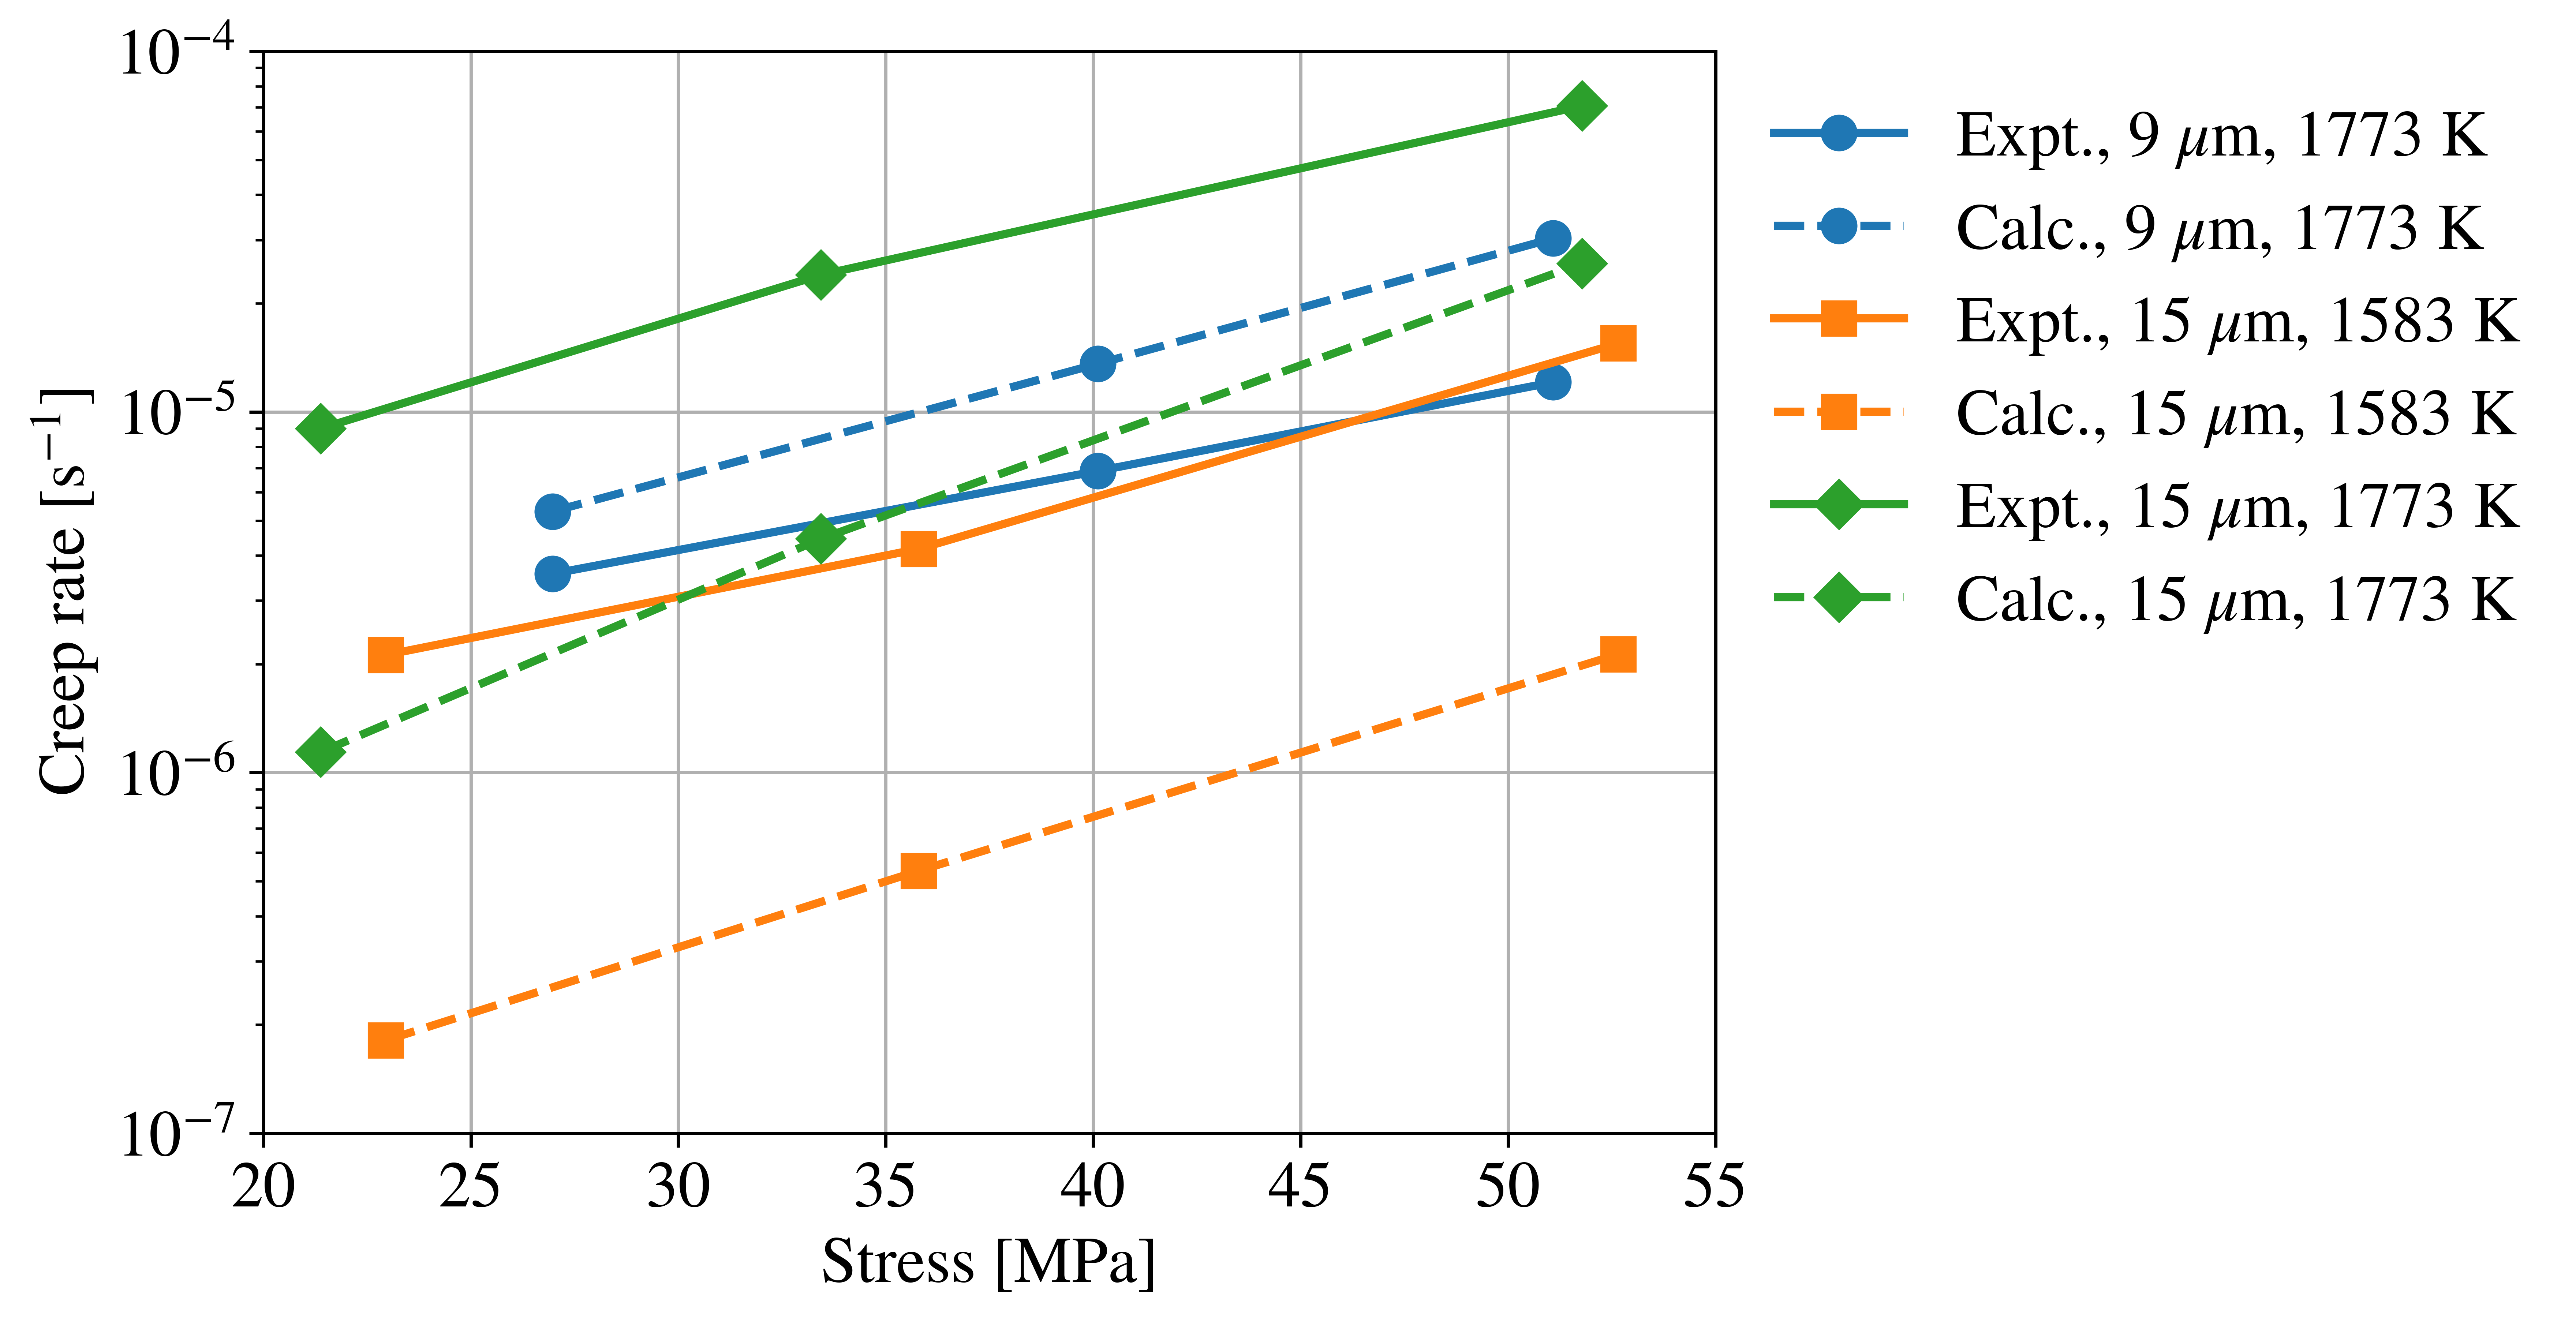
where is in K, is in MPa, and is in m. To test this final correlation, we compare it to the experimental data of Uchida and Ichikawa [8] in Fig.˜7. For the grain size of 9 m, the correlation gives an excellent prediction of the experimental creep rate. For the grain size of 15 m, Eq.˜15 underestimates the creep rate by at most an order of magnitude, which can be considered fair qualitative agreement taking into account that the 15-m samples of Uchida and Ichikawa [8] experienced a significant hot-pressing effect.
5 Conclusions
In this study, we employed MD simulations to investigate specific aspects of the mechanical behavior of UN. The diffusional creep simulations were conducted using nanometer-sized polycrystals with realistic microstructural features. Results indicate that Nabarro-Herring creep is not active within the studied temperature range and time scale. Instead, Coble creep emerges as the dominant diffusional creep mechanism, exhibiting an activation energy of 2.28 eV. A method is introduced to compute the diffusional GB width and its temperature dependence in polycrystals. The diffusional GB width of UN is observed to follow an Arrhenius behavior with an activation energy of 0.74–0.82 eV. The value of the diffusional GB width at the melting point is estimated as 2.69 nm which we treat as an effective GB width to be used in the Coble creep formula. This value shows an excellent prediction of the prefactor of the phenomenological Coble creep formula. The parameter-based model of Coble creep in UN agrees with the simulation model and shows less uncertainty at less computational cost. It is shown that the most general thermal creep correlation of UN is a sum of our Coble creep correlation and the Hayes et al. dislocation creep correlation.
6 Acknowledgements
The authors thank Khadija Mahbuba and Mahmoud Hawary for the fruitful discussions and useful suggestions. This work is funded by Westinghouse Electric Company. This research made use of the resources of the High-Performance Computing Center at Idaho National Laboratory, which is supported by the Office of Nuclear Energy of the U.S. Department of Energy and the Nuclear Science User Facilities under Contract No. DE-AC07-05ID14517. Mohamed AbdulHameed dedicates this work to Ayman AbdulRaheem.
Appendix A Derivation of the diffusional GB width formula
An estimate of the diffusional GB width can be made based on the formula [44]:
| (16) |
where is the number of atoms existing within the GBs, is the atomic volume, and is the GB area. The number of GB atoms can be defined as [24] where is defined as the fraction of atoms that have undergone non-affine displacements of at least one nearest-neighbor distance in the limit of infinite simulation time, and is the total number of atoms in the supercell. The atomic volume is , where is the number of grains in the supercell (in our case, = 16), and is the grain volume. Because the grains are space-filling, the supercell volume . The GB area is , where is the grain surface area, which for a truncated octahedron is given by [55]:
| (17) |
where is the truncated octahedron’s edge length, which can be calculated from [55]:
| (18) |
Thus, for the case of a supercell containing truncated-octahedral grains of uniform size and shape, the diffusional GB width is:
| (19) |
where is a shape factor that depends on the grain shape. For truncated-octahedral grains:
| (20) |
This derivation assumes that the grains are space-filling and of uniform shape and size. It is interesting to note in Eq.˜19 that while the GB width, , depends on the grain volume-to-surface ratio, , which increases with increasing the grain size, also depends on , which increases both with increasing the temperature and the grain surface-to-volume ratio. That is, this definition of the GB width takes into account both structural and diffusional aspects.
References
- [1] C. Ekberg, D. R. Costa, M. Hedberg, M. Jolkkonen, Nitride fuel for Gen IV nuclear power systems, Journal of Radioanalytical and Nuclear Chemistry 318 (2018) 1713–1725. doi:10.1007/s10967-018-6316-0.
- [2] J. Wallenius, Nitride fuels, Comprehensive Nuclear Materials 5 (2020) 88–101. doi:10.1016/B978-0-12-803581-8.11694-7.
- [3] M. Uno, T. Nishi, M. Takano, Thermodynamic and thermophysical properties of the actinide nitrides, Comprehensive Nuclear Materials: Second Edition (2020) 202–231doi:10.1016/B978-0-12-803581-8.11749-7.
- [4] D. Frazer, B. Maiorov, U. Carvajal-Nuñez, J. Evans, E. Kardoulaki, J. Dunwoody, T. A. Saleh, J. T. White, High temperature mechanical properties of fluorite crystal structured materials (CeO2, ThO2, and UO2) and advanced accident tolerant fuels (U3Si2, UN, and UB2), Journal of Nuclear Materials 554 (2021). doi:10.1016/j.jnucmat.2021.153035.
- [5] S. L. Hayes, J. K. Thomas, K. L. Peddicord, Material property correlations for uranium mononitride II. mechanical properties, Journal of Nuclear Materials 171 (1990) 271–288.
- [6] M. Fassler, F. Huegel, M. DeCrescente, The compressive creep of UC and UN, Tech. Rep. PWAC-482, Pratt & Whitney Aircraft Co. (1965).
- [7] R. Vandervoort, W. Barmore, C. Cline, Compressive creep of polycrystalline uranium mononitride in nitrogen, Transactions of the Metallurgical Society of AIME 242 (1968) 1466–1467.
- [8] M. Uchida, M. Ichikawa, Compressive creep of sintered UC-UN solid solutions, Journal of Nuclear Materials 49 (1973). doi:10.1016/0022-3115(73)90065-2.
- [9] B. D. Rogozkin, N. M. Stepennova, A. A. Proshkin, Mononitride fuel for fast reactors, Atomic Energy 95 (2003). doi:10.1023/B:ATEN.0000007886.86817.32.
- [10] M. Meyers, K. Chawla, Mechanical Behavior of Materials, 2nd Edition, Cambridge University Press, 2009.
- [11] E. A. Kotomin, Y. A. Mastrikov, S. N. Rashkeev, P. V. Uffelen, Implementing first principles calculations of defect migration in a fuel performance code for UN simulations, Journal of Nuclear Materials 393 (2009) 292–299. doi:10.1016/j.jnucmat.2009.06.016.
- [12] I. I. Konovalov, B. A. Tarasov, E. M. Glagovsky, Structural-phase state and creep of mixed nitride fuel, in: IOP Conference Series: Materials Science and Engineering, Vol. 130, 2016. doi:10.1088/1757-899X/130/1/012030.
- [13] J. Adachi, K. Kurosaki, M. Uno, S. Yamanaka, M. Takano, M. Akabori, K. Minato, Mechanical properties at sub-microscale and macroscale of polycrystalline uranium mononitride, Journal of Nuclear Materials 384 (2009) 6–11. doi:10.1016/j.jnucmat.2008.09.019.
- [14] K. D. Johnson, D. A. Lopes, Grain growth in uranium nitride prepared by spark plasma sintering, Journal of Nuclear Materials 503 (2018). doi:10.1016/j.jnucmat.2018.02.041.
- [15] K. Yang, E. Kardoulaki, D. Zhao, A. Broussard, K. Metzger, J. T. White, M. R. Sivack, K. J. Mcclellan, E. J. Lahoda, J. Lian, Uranium nitride (UN) pellets with controllable microstructure and phase - fabrication by spark plasma sintering and their thermal-mechanical and oxidation properties, Journal of Nuclear Materials 557 (2021). doi:10.1016/j.jnucmat.2021.153272.
- [16] L. He, M. Khafizov, C. Jiang, B. Tyburska-Püschel, B. J. Jaques, P. Xiu, P. Xu, M. K. Meyer, K. Sridharan, D. P. Butt, J. Gan, Phase and defect evolution in uranium-nitrogen-oxygen system under irradiation, Acta Materialia 208 (2021). doi:10.1016/j.actamat.2021.116778.
- [17] J. C. Mauro, Materials Kinetics: Transport and Rate Phenomena, 1st Edition, Elsevier, 2020.
- [18] T. Courtney, Mechanical Behavior of Materials, 2nd Edition, Waveland Press, Inc., 2005.
- [19] S. L. Hayes, J. K. Thomas, K. L. Peddicord, Material property correlations for uranium mononitride III. transport properties, Journal of Nuclear Materials 171 (1990) 289–299.
- [20] P. Keblinski, D. Wolf, H. Gleiter, Molecular-dynamics simulation of grain-boundary diffusion creep, Interface Science 6 (1998). doi:10.1023/A:1008664218857.
- [21] V. Yamakov, D. Wolf, S. R. Phillpot, H. Gleiter, Grain-boundary diffusion creep in nanocrystalline palladium by molecular-dynamics simulation, Acta Materialia 50 (2002). doi:10.1016/S1359-6454(01)00329-9.
- [22] T. G. Desai, P. C. Millett, D. Wolf, Molecular dynamics study of diffusional creep in nanocrystalline UO2, Acta Materialia 56 (2008). doi:10.1016/j.actamat.2008.02.052.
- [23] C. O. Galvin, D. A. Andersson, R. T. Sweet, L. Capolungo, M. W. Cooper, Diffusional creep model in UO2 informed by lower-length scale simulations (2024).
- [24] A. J. Haslam, V. Yamakov, D. Moldovan, D. Wolf, S. R. Phillpot, H. Gleiter, Effects of grain growth on grain-boundary diffusion creep by molecular-dynamics simulation, Acta Materialia 52 (2004). doi:10.1016/j.actamat.2003.12.048.
- [25] M. W. Cooper, K. A. Gamble, L. Capolungo, C. Matthews, D. A. Andersson, B. Beeler, C. R. Stanek, K. Metzger, Irradiation-enhanced diffusion and diffusion-limited creep in U3Si2, Journal of Nuclear Materials 555 (2021). doi:10.1016/j.jnucmat.2021.153129.
- [26] V. I. Tseplyaev, S. V. Starikov, The atomistic simulation of pressure-induced phase transition in uranium mononitride, Journal of Nuclear Materials 480 (2016) 7–14. doi:10.1016/j.jnucmat.2016.07.048.
- [27] V. Kocevski, M. W. Cooper, A. J. Claisse, D. A. Andersson, Development and application of a uranium mononitride (UN) potential: Thermomechanical properties and Xe diffusion, Journal of Nuclear Materials 562 (2022). doi:10.1016/j.jnucmat.2022.153553.
- [28] M. AbdulHameed, B. Beeler, C. O. Galvin, M. W. Cooper, Assessment of uranium nitride interatomic potentials, Journal of Nuclear Materials (2024) 155247doi:https://doi.org/10.1016/j.jnucmat.2024.155247.
- [29] M. AbdulHameed, B. Beeler, A. Claisse, Atomistic investigation of plastic deformation and dislocation motion in uranium mononitride, Applied Sciences 15 (2025) 2666. doi:https://doi.org/10.3390/app15052666.
- [30] A. P. Thompson, H. M. Aktulga, R. Berger, D. S. Bolintineanu, W. M. Brown, P. S. Crozier, P. J. in ’t Veld, A. Kohlmeyer, S. G. Moore, T. D. Nguyen, R. Shan, M. J. Stevens, J. Tranchida, C. Trott, S. J. Plimpton, LAMMPS–a flexible simulation tool for particle-based materials modeling at the atomic, meso, and continuum scales, Computer Physics Communications 271 (2022). doi:10.1016/j.cpc.2021.108171.
- [31] P. Hirel, Atomsk: A tool for manipulating and converting atomic data files, Computer Physics Communications 197 (2015). doi:10.1016/j.cpc.2015.07.012.
- [32] A. Stukowski, Visualization and analysis of atomistic simulation data with OVITO–the open visualization tool, Modelling and Simulation in Materials Science and Engineering 18 (2010). doi:10.1088/0965-0393/18/1/015012.
- [33] A. K. Mukherjee, An examination of the constitutive equation for elevated temperature plasticity, Materials Science and Engineering: A 322 (2002). doi:10.1016/S0921-5093(01)01115-7.
- [34] N. Dowling, S. Kampe, M. Kral, Mechanical Behavior of Materials: Engineering Methods for Deformation, Fracture, and Fatigue, 5th Edition, Pearson Education Limited, 2020.
- [35] R. L. Coble, A model for boundary diffusion controlled creep in polycrystalline materials, Journal of Applied Physics 34 (1963). doi:10.1063/1.1702656.
- [36] Y. J. Wang, A. Ishii, S. Ogata, Transition of creep mechanism in nanocrystalline metals, Physical Review B - Condensed Matter and Materials Physics 84 (2011). doi:10.1103/PhysRevB.84.224102.
- [37] D. R. Olander, A. T. Motta, Light Water Reactor Materials Volume I: Fundamentals, American Nuclear Society, 2017.
- [38] S. L. Hayes, J. K. Thomas, K. L. Peddicord, Material property correlations for uranium mononitride IV. thermodynamic properties, Journal of Nuclear Materials 171 (1990) 300–318.
- [39] P. M. Larsen, Revisiting the common neighbour analysis and the centrosymmetry parameter (2020). arXiv:2003.08879.
- [40] C. L. Kelchner, S. Plimpton, Dislocation nucleation and defect structure during surface indentation, Physical Review B - Condensed Matter and Materials Physics 58 (1998). doi:10.1103/PhysRevB.58.11085.
- [41] V. Bulatov, W. Cai, Computer Simulations of Dislocations, Oxford University Press, 2006.
- [42] A. Stukowski, V. V. Bulatov, A. Arsenlis, Automated identification and indexing of dislocations in crystal interfaces, Modelling and Simulation in Materials Science and Engineering 20 (2012). doi:10.1088/0965-0393/20/8/085007.
- [43] W. Cai, W. Nix, Imperfections in Crystalline Solids, 1st Edition, Cambridge University Press, 2016. doi:10.1017/cbo9781316389508.
- [44] P. Keblinski, D. Wolf, S. R. Phillpot, H. Gleiter, Self-diffusion in high-angle FCC metal grain boundaries by molecular dynamics simulation, Philosophical Magazine A: Physics of Condensed Matter, Structure, Defects and Mechanical Properties 79 (1999). doi:10.1080/01418619908212021.
- [45] K. L. Murty, I. Charit, An Introduction to Nuclear Materials, 1st Edition, Wiley-VCH Verlag GmbH & Co. KGaA, 2013.
- [46] V. Yamakov, D. Wolf, M. Salazar, S. R. Phillpot, H. Gleiter, Length-scale effects in the nucleation of extended dislocations in nanocrystalline Al by molecular-dynamics simulation, Acta Materialia 49 (2001). doi:10.1016/S1359-6454(01)00167-7.
- [47] R. S. Gordon, Ambipolar diffusion and its application to diffusion creep, Materials Science Research 9 (1974). doi:10.1007/978-1-4684-3150-6_30.
- [48] M. Kizilyalli, J. Corish, R. Metselaar, Definitions of terms for diffusion in the solid state, Pure and Applied Chemistry 71 (1999). doi:10.1351/pac199971071307.
- [49] E. W. Hart, On the role of dislocations in bulk diffusion, Acta Metallurgica 5 (1957). doi:10.1016/0001-6160(57)90127-X.
- [50] A. A. Riet, J. A. V. Orman, D. J. Lacks, A molecular dynamics study of grain boundary diffusion in mgo, Geochimica et Cosmochimica Acta 292 (2021). doi:10.1016/j.gca.2020.09.012.
- [51] T. Arima, K. Yoshida, K. Idemitsu, Y. Inagaki, I. Sato, Molecular dynamics analysis of diffusion of uranium and oxygen ions in uranium dioxide, IOP Conference Series: Materials Science and Engineering 9 (2010).
- [52] D. Prokoshkina, V. A. Esin, G. Wilde, S. V. Divinski, Grain boundary width, energy and self-diffusion in nickel: Effect of material purity, Acta Materialia 61 (2013). doi:10.1016/j.actamat.2013.05.010.
- [53] A. Cheniour, M. R. Tonks, B. Gong, T. Yao, L. He, J. M. Harp, B. Beeler, Y. Zhang, J. Lian, Development of a grain growth model for U3Si2 using experimental data, phase field simulation and molecular dynamics, Journal of Nuclear Materials 532 (2020). doi:10.1016/j.jnucmat.2020.152069.
- [54] Z. Zeng, Y. Pan, X. Chen, C. Zhang, C. Yin, S. Gao, Y. Zhou, J. Zhang, X. He, C. Yuan, Three-dimensional modeling of thermal-mechanical behavior of accident tolerant fuels, Frontiers in Energy Research 9 (2021). doi:10.3389/fenrg.2021.636502.
-
[55]
E. W. Weisstein, Truncated octahedron, MathWorld: A Wolfram Web Resource.
URL https://mathworld.wolfram.com/TruncatedOctahedron.html