The hot accretion flow evolution in the black hole X-ray binary MAXI J1348-630
Abstract
MAXI J1348-630 as a low-mass black hole binary system in the Galaxy showed an X-ray outburst in 2019. We analyzed the Insight-HXMT spectral data in the low hard state (LHS) and intermediate state (IS) during the outburst from MJD 58510 to 58519 at the energy band from 2 keV to 100 keV. During the entire process, a thin disk extending to the innermost stable circular orbit (ISCO) from a large truncated disk (truncated radius ISCO) suggests the corona geometry evolution. There exist time lags between radio and hard X-ray flux peaks: the 30 - 100 keV flux about 5 days ahead of radio flux, 11-30 keV flux about 4 days ahead, and reflection fraction about 2 days ahead, the accretion disk approaching the ISCO about 1 day before radio peak. This disk-corona-jet coupling and evolution suggest the corona containing two phases of cold dense material and hot gas, with high temperature region of corona cooling fast. The strong radio emission accompanying with a thin accretion disk of a relatively high accretion rate favors magnetic tower jet mechanism.
1 Introduction
Low-mass black hole X-ray binaries (LMBHXB) consist of a black hole (BH) accreting material from its low-mass comparison star through Roche lobe overflow (Savonije, 1978; Abramowicz et al., 1988; Lovelace et al., 1999). The primary radiation of this system can be characterized by multi-temperature black body spectra in soft X-ray range within 7 keV (Shakura & Sunyaev, 1973; Novikov & Thorne, 1973), while at the hard X-ray range, the spectra can be modeled by a cutoff power-law component that is attributed to the high-temperature plasma (up to , named as corona based on Sunyaev & Titarchuk 1980, 1985). With the high-resolution spectra, the cutoff power-law component can’t model the hump over 20 keV, and the iron emission lines, which can be well explained by the Comptonized photons reflected from the accretion disk (Fabian, 2016). Besides, the relativistic effects would make the iron emission line broad and asymmetric (Fabian et al., 1989; Reynolds & Nowak, 2003). These spectral components would help to understand the geometry and the motion of the disk-corona near the BH(Niedźwiecki et al., 2016).
At the duration of the LMBHXB outburst, the flux in X-ray bands could change over an order of magnitude, the shape of the hardness intensity diagram (HID) usually obeys the ’Q’ feature evolving from the low hard state (LHS) to the high soft state (HSS), through the intermediate state (IS) divided into hard intermediate state (HIS) and soft intermediate state (SIS) (McClintock et al., 2006; Belloni et al., 2000; Fender et al., 2004). The intensity of the source rises sharply from the LHS to HIS and continues into HSS, then, the intensity falls back into LHS before vanishing into quiescence. With state change, the spectra component of the disk and the corona evolve in different patterns. The power-law component produced by the corona decreases from LHS to HSS and the multi-temperature black body component made by the disk increases from LHS to HSS (Done et al., 2007).
The Monitor of All-sky X-ray Image (MAXI) using the onboard Gas Slit Camera (GSC) (Matsuoka et al., 2009) discovered the X-ray source MAXI J1348-630 on 2019 January 26 (Yatabe et al., 2019), which is classified as LMBHXB candidate by the spectral features, the mass of the central celestial body, and the intensity evolution (Carotenuto et al., 2019; Denisenko et al., 2019; Jana et al., 2019; Kennea & Negoro, 2019; Russell et al., 2019; Sanna et al., 2019; Yatabe et al., 2019; Belloni et al., 2020; Tominaga et al., 2020). The MAXI J1348-630 shows the ’Q’-shape spectral feature during the main outburst in 2019 from the Swift/XRT data (Tominaga et al., 2020), the NICER data (Zhang et al., 2020a), and the Insight-HXMT data (Chen et al., 2019). Lamer et al. (2021) discovered a giant dust scattering ring centered on MAXI J1348-630 based on the SRG/eROSITA image, and estimated the mass of black hole with at the distance of by joint analysis of the XMM-Newton, MAXI, Gaia data. The Swift and MAXI data during the 2019 main outburst was modeled by a two-component advective flow model estimating the black hole mass to be (Jana et al., 2020). The radio data from the Australian Square Kilometre Array Pathfinder (ASKAP) and MeerKAT suggested the distance at by modeling the HI absorption spectra (Chauhan et al., 2021). Radio observations give the eject speed , and the open angle of the jet (Carotenuto et al., 2021), furthermore, the modeling of this jet’s synchrotron emission shows the initial Lorentz factor with the kinetic energy which is greater than most LMBHXBs(Carotenuto et al., 2022a). In hard state and hard intermediate states, the magnetic launching disk wind is discovered by an absorption line around coming from highly ionized iron with a velocity of (Wu et al., 2023a), and the disk wind of the velocity is also discovered in soft state with optical and infrared energy band (Panizo-Espinar et al., 2022).
The inclination angle of this source has also been studied widely. Carotenuto et al. (2022b) estimated a inclination by modeling the jet using the radio data, and Carotenuto et al. (2021) obtained an upper limit of a inclination from the radio image. The analysis of the reflection component in the X-ray spectra gave a range of inclination from to (Jia et al., 2022; Kumar et al., 2022; Mall et al., 2022; Wu et al., 2023a), and the same way to study the second outburst in 2019 obtained a same range of . The research of quasi-periodic oscillations (QPOs) suggested an inclination of (Liu et al., 2022). Due to the study of the inclination, the black hole mass, and the distance, the moderate spin of the BH ( ) is estimated using the continuum-fitting (CF) model (Wu et al., 2023b).
Furthermore, the timing analysis of MAXI J1348-630 showed all of the type-A, type-B, and type-C QPOs appearing in the duration of the main outburst (Belloni et al., 2020; Alabarta et al., 2022; Liu et al., 2020; Zhang et al., 2023). A type-C QPO with 0.9 Hz and a type-A QPO with 7 Hz were found in NICER and AstroSat observation (Jithesh et al., 2021). Furthermore, the Comptonized region extends to 2300 km during the period when type-A QPO appeared (Zhang et al., 2023). For type-C QPO, the fractional rms amplitude increased in the energy band of 2-3 keV. The type-B QPO was discovered in which may suggest the instability of the disk-jet structure (Liu et al., 2020), and about a decrease of half percent in fractional rms below 2 keV (at 1.5 keV) was first observed (Belloni et al., 2020). Besides, the radiative properties were explained by the two-component Comptonization model (Garc´ıa et al., 2021). Weng et al. (2021) illustrated the time lag between the multi-temperature black body component produced by the disk and the power-law component made by the corona in the energy band between 0.5 to 80 keV.
In this work, we provide a broad-band spectral view of MAXI J1348-630 during the hard and intermediate states observed by Insight-HXMT, concentrating on the non-thermal and reflection component evolution. In Section 2, the Insight-HXMT observations and data processes are introduced. In Section 3, we present the spectral analysis results and show the time lags between hard X-ray and radio emissions in Section 4. In Section 5, The physical implications of the spectral evolution and time lags of the multiwavelength bands are discussed. The brief summary and conclusion are given in Section 6.
2 observations and data reduction
The first X-ray astronomy satellite of China, Insight Hard X-ray Modulation Telescope (Insight-HXMT, Zhang et al. 2020b), which launched on June 15 2017, observed the whole outburst of MAXI J1348-630 (Yatabe et al., 2019) from 2019 January 27 to 2019 July 29 (Chen et al., 2019). The entire energy range 1-250 keV of Insight-HXMT is based on three telescopes, namely, Low Energy X-ray telescope (LE) with 384 effective area from 1 keV to 15 keV Chen et al. (2020), Medium Energy X-ray telescope (ME) with 952 from 5 keV to 30 keV (Cao et al., 2020), and High Energy X-ray telescope (HE) with 5100 from 20 keV to 250 keV (Liu et al., 2020). The pile-up effects of Insight-HXMT are low enough to study the peak flux of this source ( percent @ 18000 , see Chen et al. 2020). There are no contaminating sources within the field of view (FOV) near MAXI J1348-630.
The Insight-HXMT Data was extracted to the spectra by using HXMTDAS (the Insight-HXMT Data Analysis software) v2.05 111http://hxmtweb.ihep.ac.cn/software.jhtml. We jointly analyze three telescopes including 2 keV to 9 keV from LE telescope due to the low net count rate above 9 keV and the calibration uncertainties below 2 keV (Li et al., 2023), 11 keV to 21 keV and 24 keV to 30 keV from ME telescope due to the instrumental feature 21 keV to 24 keV and the low net count rate below 10 keV as well as above 30 keV (Cao et al., 2020), the 30 keV to 100 keV from HE telescope because of the background noises at the same level with the net count rate below 30 keV and above 100 keV(Liu et al., 2020). To normalize these three telescopes, we insert three cross-normalization constants (the constant model in XSPEC), then, freeze the ME constant and let the LE and HE constants vary freely. We use the recommended criteria: the elevation angle 10 deg, the pointing offset angle 0.1 deg, the geomagnetic cutoff rigidity 8 GeV, and the good time intervals (GTIs) 300s away from the South Atlantic Anomaly (SAA), and generate the background files by LEBKGMAP for LE data, MEBKGMAP for ME data, HEBKGMAP for HE data to estimate the background count rates (Liao et al., 2020). The LELCGEN, MELCGEN, and HELCGEN tasks extract light curves from LE, ME, HE screened files. We used the ftgrouppha within FTOOLS to rebin the spectra data with a 40 minimum signal-to-noise ratio from 2.6 keV to 10 keV to promote precision at the iron emission line. A systematic error of 0.5% was added to account for the calibration uncertainties.
3 Spectral analysis
The X-ray spectra were investigated by the XSPEC v12.13.0c222https://heasarc.gsfc.nasa.gov/xanadu/xspec/. We fixed the galactic neutral hydrogen column density at in TBabs composition (Tominaga et al., 2020; Chakraborty et al., 2021; Saha et al., 2021; Cangemi et al., 2022; Zdziarski et al., 2022) of the all following model. The cross-normalization constants among LE, ME, and HE data were inserted in all models, freezing the ME constant as standard and letting the LE and HE constants vary freely. If the confidence level of parameters isn’t mentioned in the following, it will be set to 90 percent to produce the error range and the statistic set to chi-squared statistic.
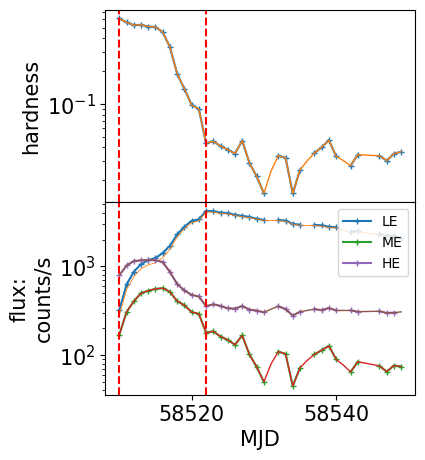
The main outburst of MAXI J1348-630 was observed by the Insight-HXMT from MJD 58510 to MJD 58693 and the HID of this source follows a ’q’ pattern (Yatabe et al., 2019; Wu et al., 2023b). In this research, we analyze the observational data in LHS and HIS illustrated in Fig. 1 between the two red lines. During LHS the hardness is near constant around 0.5-0.6, and the flux rises rapidly until MJD 58517, then the flux rises slowly, and the hardness drops from to 0.03 in HIS. In LHS and HIS, there are 28 times of observations from MJD 58510 to MJD 58522 provided by Insight-HXMT including all of the LE spectrum, ME spectrum, and HE spectrum, which are illustrated in Table 2 of the appendix, including observation ID, observation date, exposure time, and abbreviation of every observation. All the observational data we investigated have a hardness greater than 0.06, the HE data count rate greater than 400 counts/s and the ME data count rate greater than 200 counts/s (see Fig. 1).
In the most spectra of LMBHXB, there exist three components: the multi-temperature black body from the disk, the cutoff power-law from the corona, the board iron line, and the hump over 20 keV from the reflection by disk (Remillard & McClintock, 2006). At first, we use the phenomenological test models: power law and thermal Compton to fit the spectra. The first one is
which includes a cross-normalization constant among LE, ME, HE telescopes with the standard as the ME telescope, an interstellar absorption model Tbabs with Wilms et al. (2000) abundances and Verner et al. (1996) cross-section, a multicolor disk blackbody model diskbb (Mitsuda et al., 1984; Makishima et al., 1986) which is produced by the thin disk, and a power-law with high energy exponential cutoff component the component of which is produced by the corona.
The thermal Compton model is:
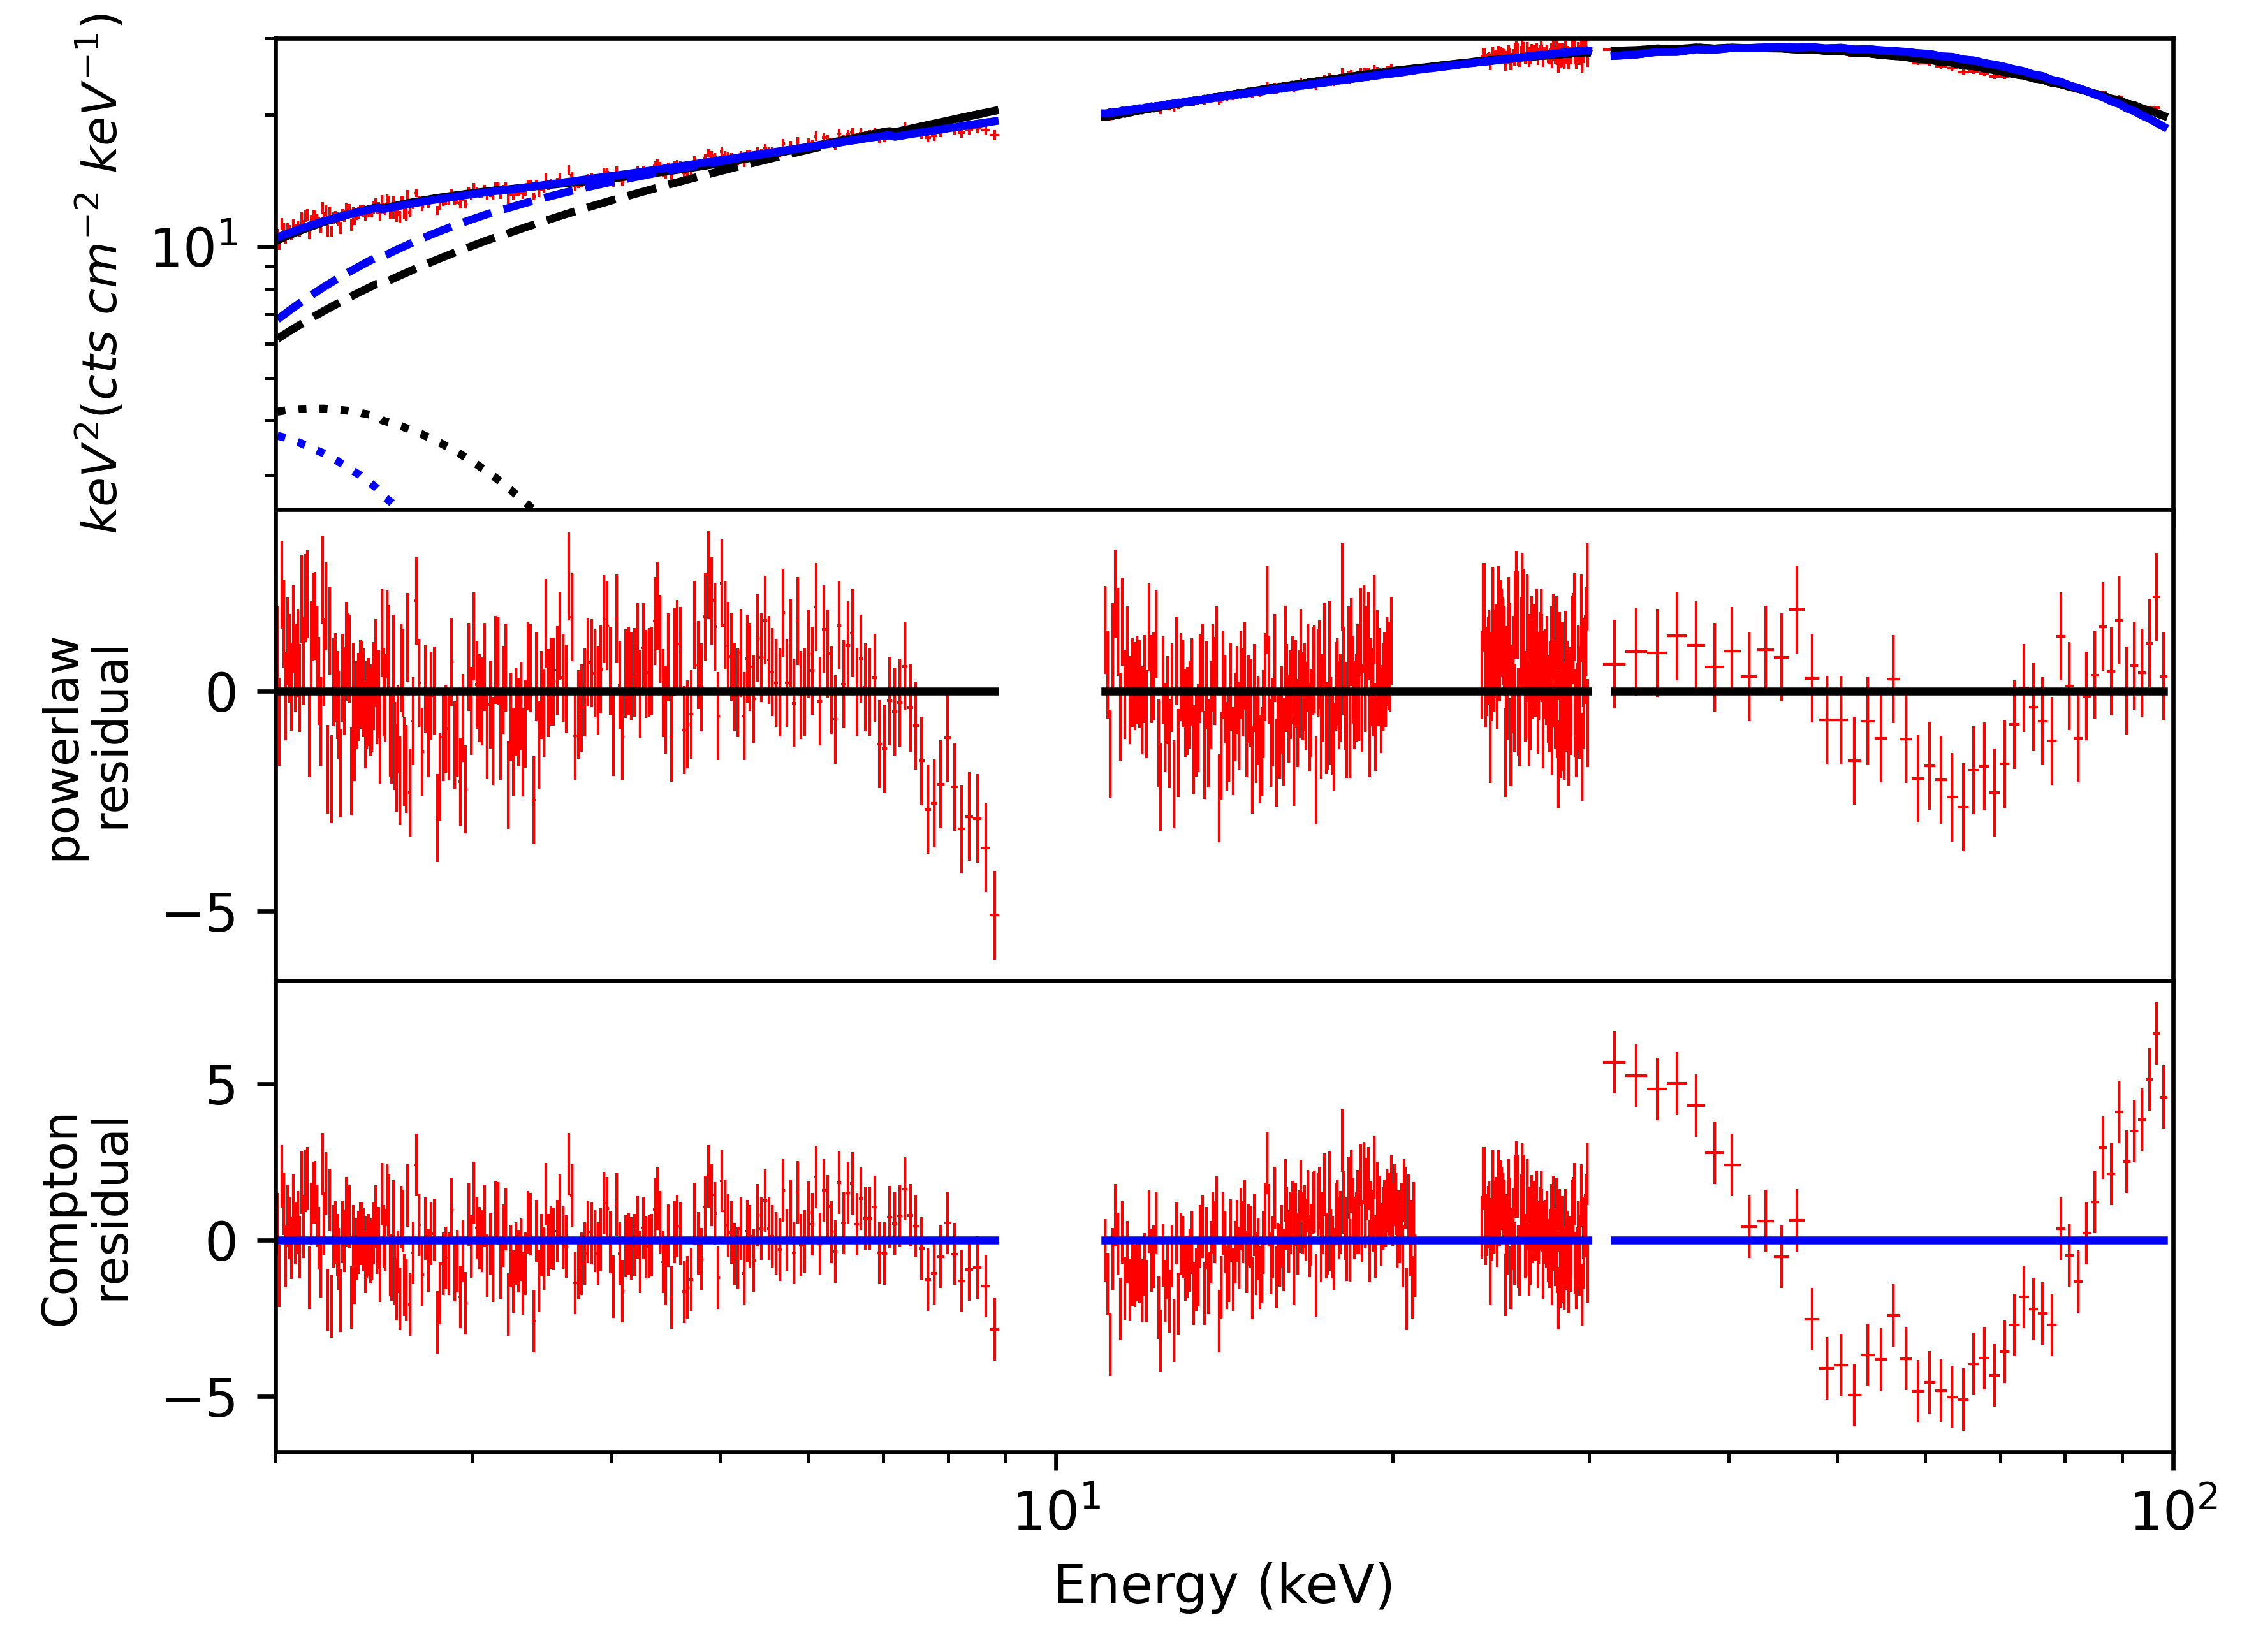
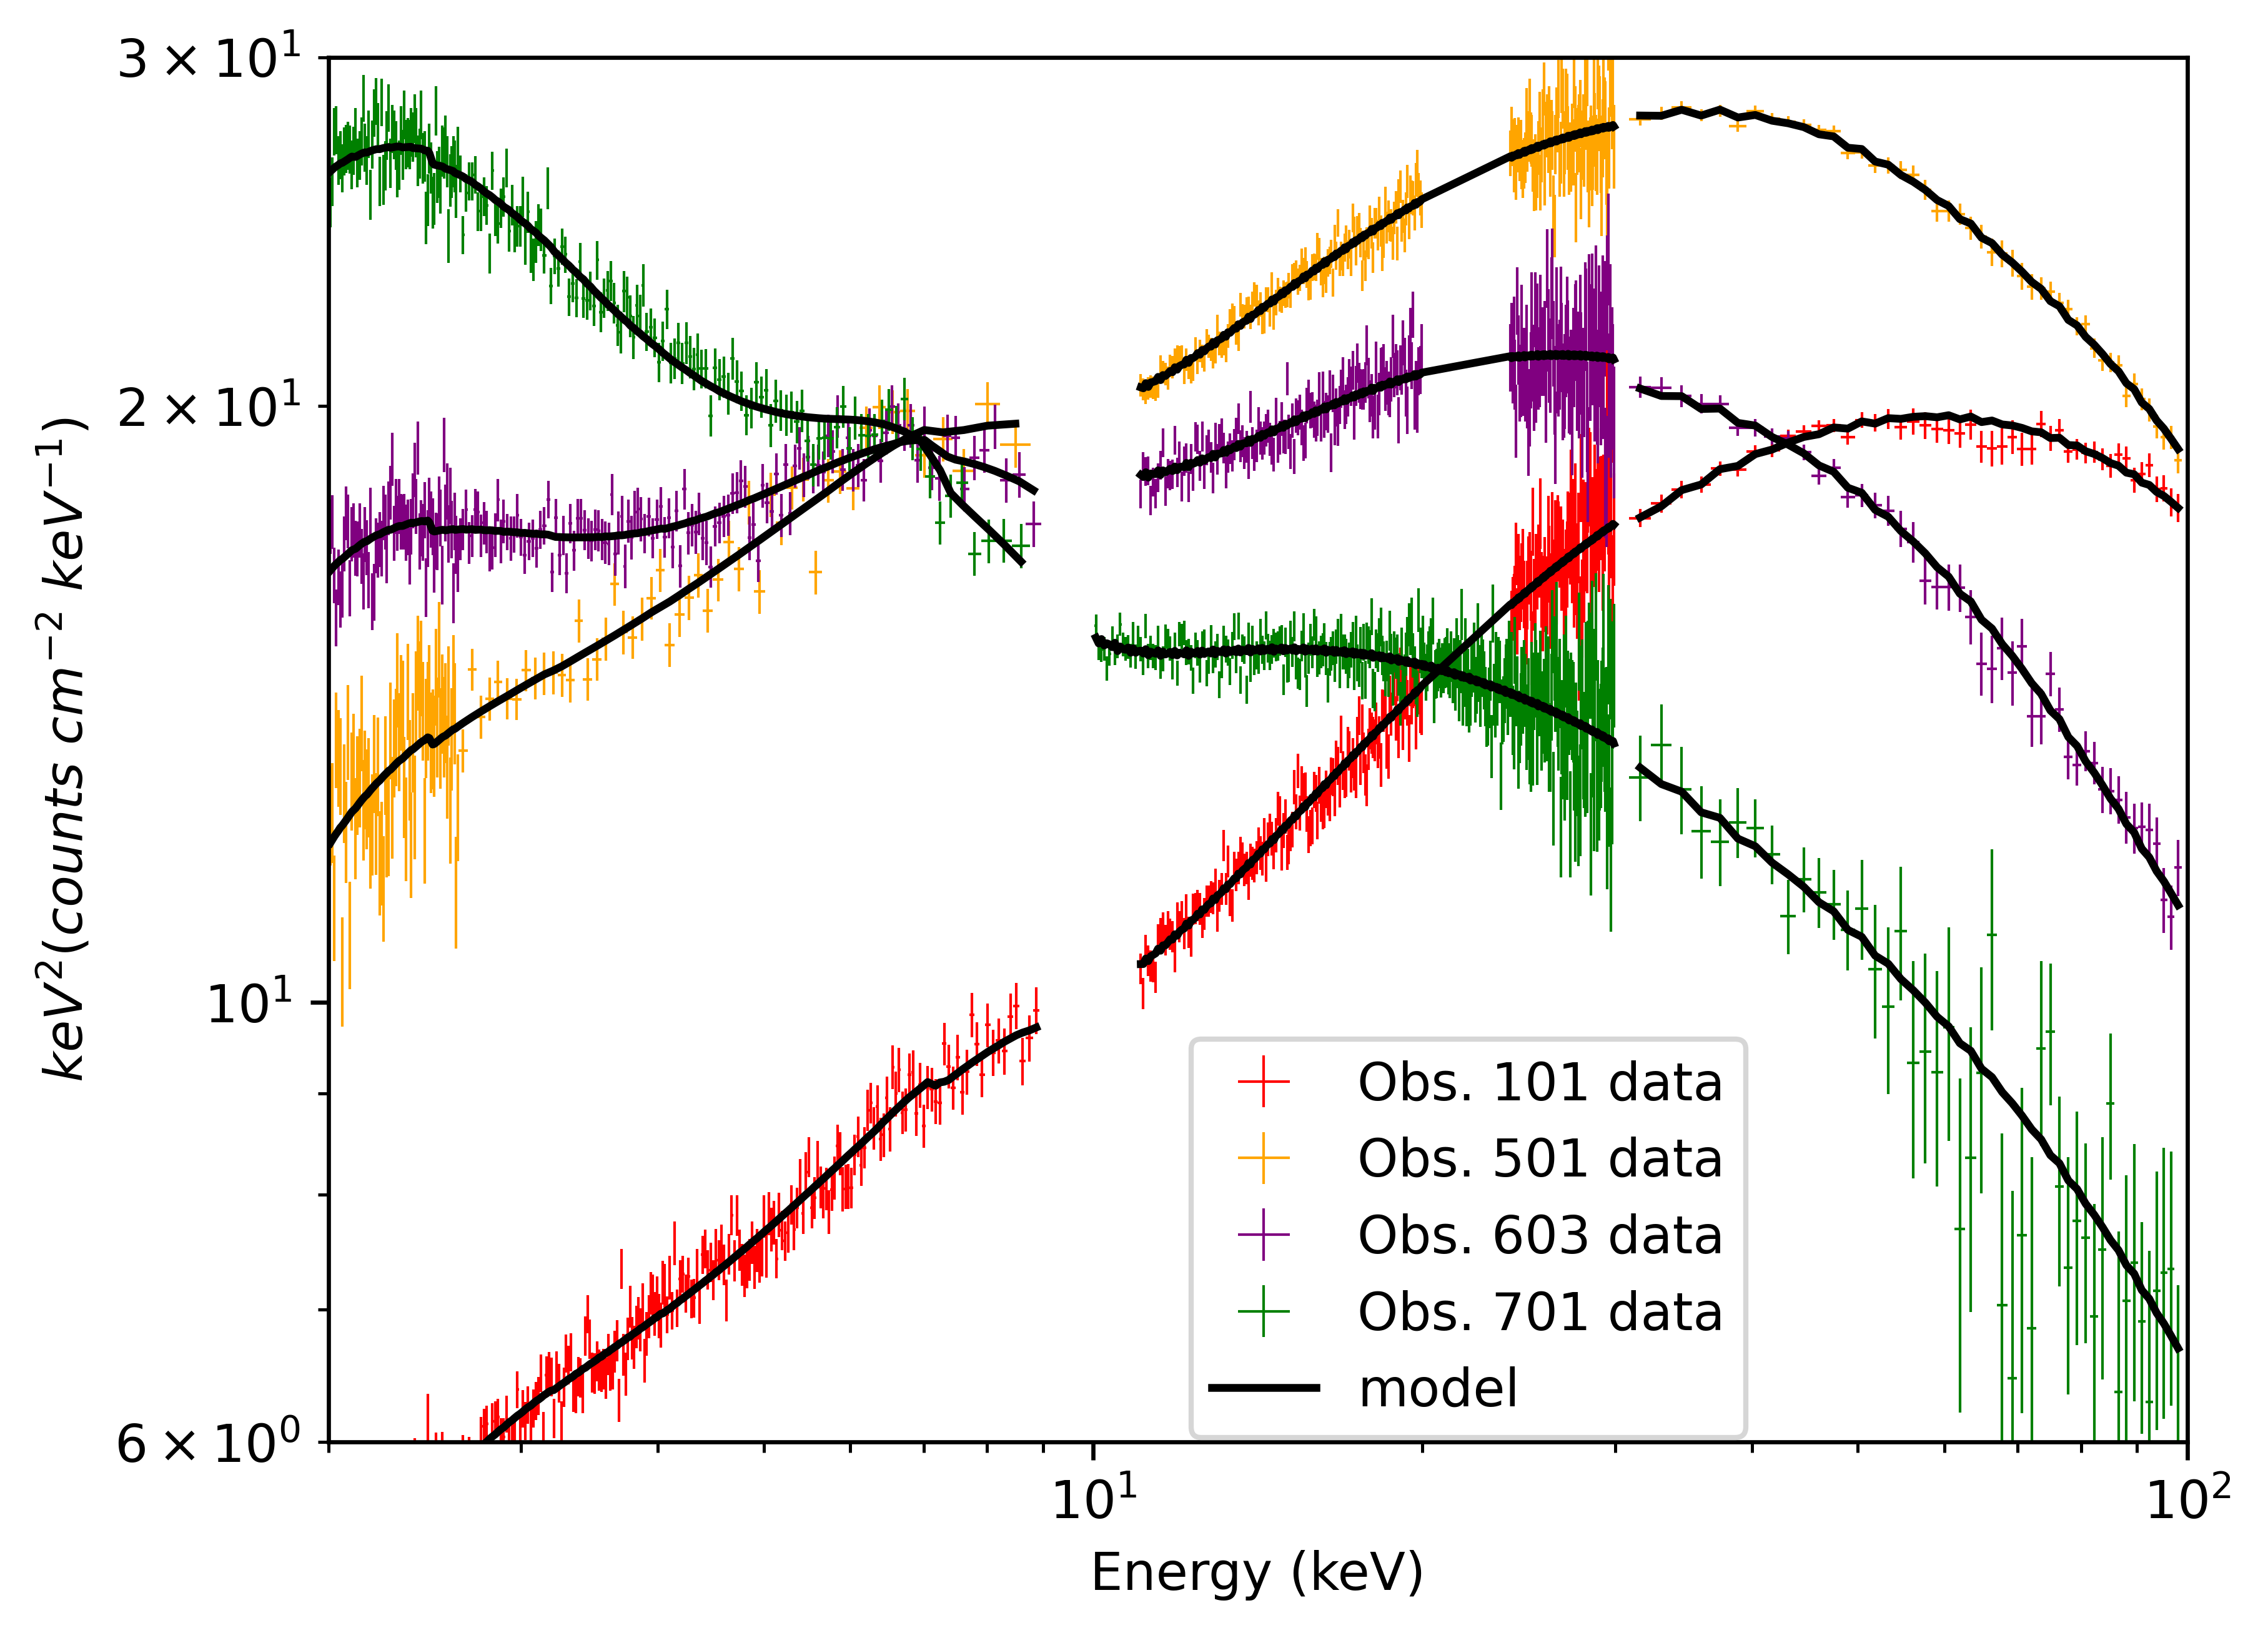
where the nthcomp is the model describing the continuum shape component that is produced by the corona, this component is a thermal comptonization evolving a seed photon field which is part of disk flux scattering by corona (Zdziarski et al., 1996; Życki et al., 1999). In the entire studied period, the broad iron lines and the Compton hump could be noticed, which indicates the existence of a reflection component (see the example spectra and residuals in Fig. 2 and the dotted lines represent the disk component, the dashed lines for the corona component).
Therefore, in the following, we use the reflection model:
to fit all the data for further studies. We use the relxillCp v2.0333https://www.sternwarte.uni-erlangen.de/ dauser/research/relxill/. The relxillCp model could explain a broad iron line by assuming a primary thermal Compton spectrum (Dauser et al., 2014; Garc´ıa et al., 2015). It should be pointed out that the corona source assumed by the lamppost model simplifies the corona as a point-like source staying beyond the black hole. Though this theoretical assumption is not realistic, the lamppost model still somehow approximates a realistic situation of the corona by some reasons, and can explain the spectral properties of BH X-ray binaries (Garc´ıa et al., 2015).
The part of flux from the corona could radiate on the accretion disk and be reflected by the accretion disk, then, it forms the reflected component that can be studied by the relxillCp model. The incident spectrum on the disk is assumed as a thermal Compton spectrum. In the fitting, we set the inclination at 30 degrees and the spin at 0.4 as a likely value, because the data can’t estimate these two parameters with other parameters at the same time and these two parameters of this source have been studied well in other research (Wu et al., 2023b; Chakraborty et al., 2021; Carotenuto et al., 2021). Chakraborty et al. (2021) pointed out that the disk density of this source exceeds . Due to the limitation of the maximum value , we set the density of the disk as . The abundance of the iron can’t be constrained around 1, and the generally gives a systematically large iron abundance due to the limitation of the model (Chakraborty et al., 2021), so we fix in units of the solar abundance. The outer edge of the accretion disk and the emissivity are fixed at a maximum value of 400 and 3 respectively.
The fitted parameters are shown together in Table 1. The relxillCp parameters include for the inner edge of the accretion disk in the unity of the ISCO, for the photon index, for the ionization parameter in logarithmic units of , for the temperature of the high energy electron (corona) in the unity of keV, for the density of the accretion disk in logarithmic units of , for the reflection friction (ratio of intensity emitted to the disk to escaping to infinity), for an incident flux to the disk (Dauser et al., 2016). We set the upper limit of as 20 ISCO.
| diskbb | relxillCp | ||||||||
| Obs. | |||||||||
| (keV) | (ISCO) | (keV) | |||||||
| 101 | |||||||||
| 201 | |||||||||
| 301 | |||||||||
| 401 | |||||||||
| 403 | |||||||||
| 404 | |||||||||
| 405 | |||||||||
| 407 | |||||||||
| 408 | |||||||||
| 410 | |||||||||
| 411 | |||||||||
| 412 | |||||||||
| 415 | |||||||||
| 416 | |||||||||
| 417 | |||||||||
| 418 | |||||||||
| 419 | |||||||||
| 420 | |||||||||
| 501 | |||||||||
| 601 | |||||||||
| 602 | |||||||||
| 603 | |||||||||
| 701 | |||||||||
| 702 | |||||||||
| 804 | |||||||||
| 904 | |||||||||
| 1101 | |||||||||
| constant | constant | ||||||||
| Obs. | Obs. | ||||||||
| 101 | 437.23/480 | 0.91 | 417 | 481.51/529 | 0.91 | ||||
| 201 | 540.95/562 | 0.96 | 418 | 429.57/532 | 0.81 | ||||
| 301 | 593.54/666 | 0.89 | 419 | 542.33/562 | 0.97 | ||||
| 401 | 769.44/763 | 1.01 | 420 | 352.56/411 | 0.86 | ||||
| 403 | 604.68/601 | 1.01 | 501 | 427.20/414 | 1.03 | ||||
| 404 | 548.55/555 | 0.99 | 601 | 403.43/467 | 0.86 | ||||
| 405 | 457.02/463 | 0.99 | 602 | 552.27/572 | 0.97 | ||||
| 407 | 460.92/463 | 1.00 | 603 | 462.68/491 | 0.94 | ||||
| 408 | 586.71/616 | 0.95 | 701 | 562.59/572 | 0.98 | ||||
| 410 | 515.98/501 | 1.03 | 702 | 625.64/612 | 1.02 | ||||
| 411 | 690.55/694 | 1.00 | 804 | 723.51/663 | 1.09 | ||||
| 412 | 538.60/579 | 0.93 | 904 | 577.30/509 | 1.13 | ||||
| 415 | 432.65/471 | 0.92 | 1101 | 866.20/688 | 1.26 | ||||
| 416 | 605.82/642 | 0.94 |
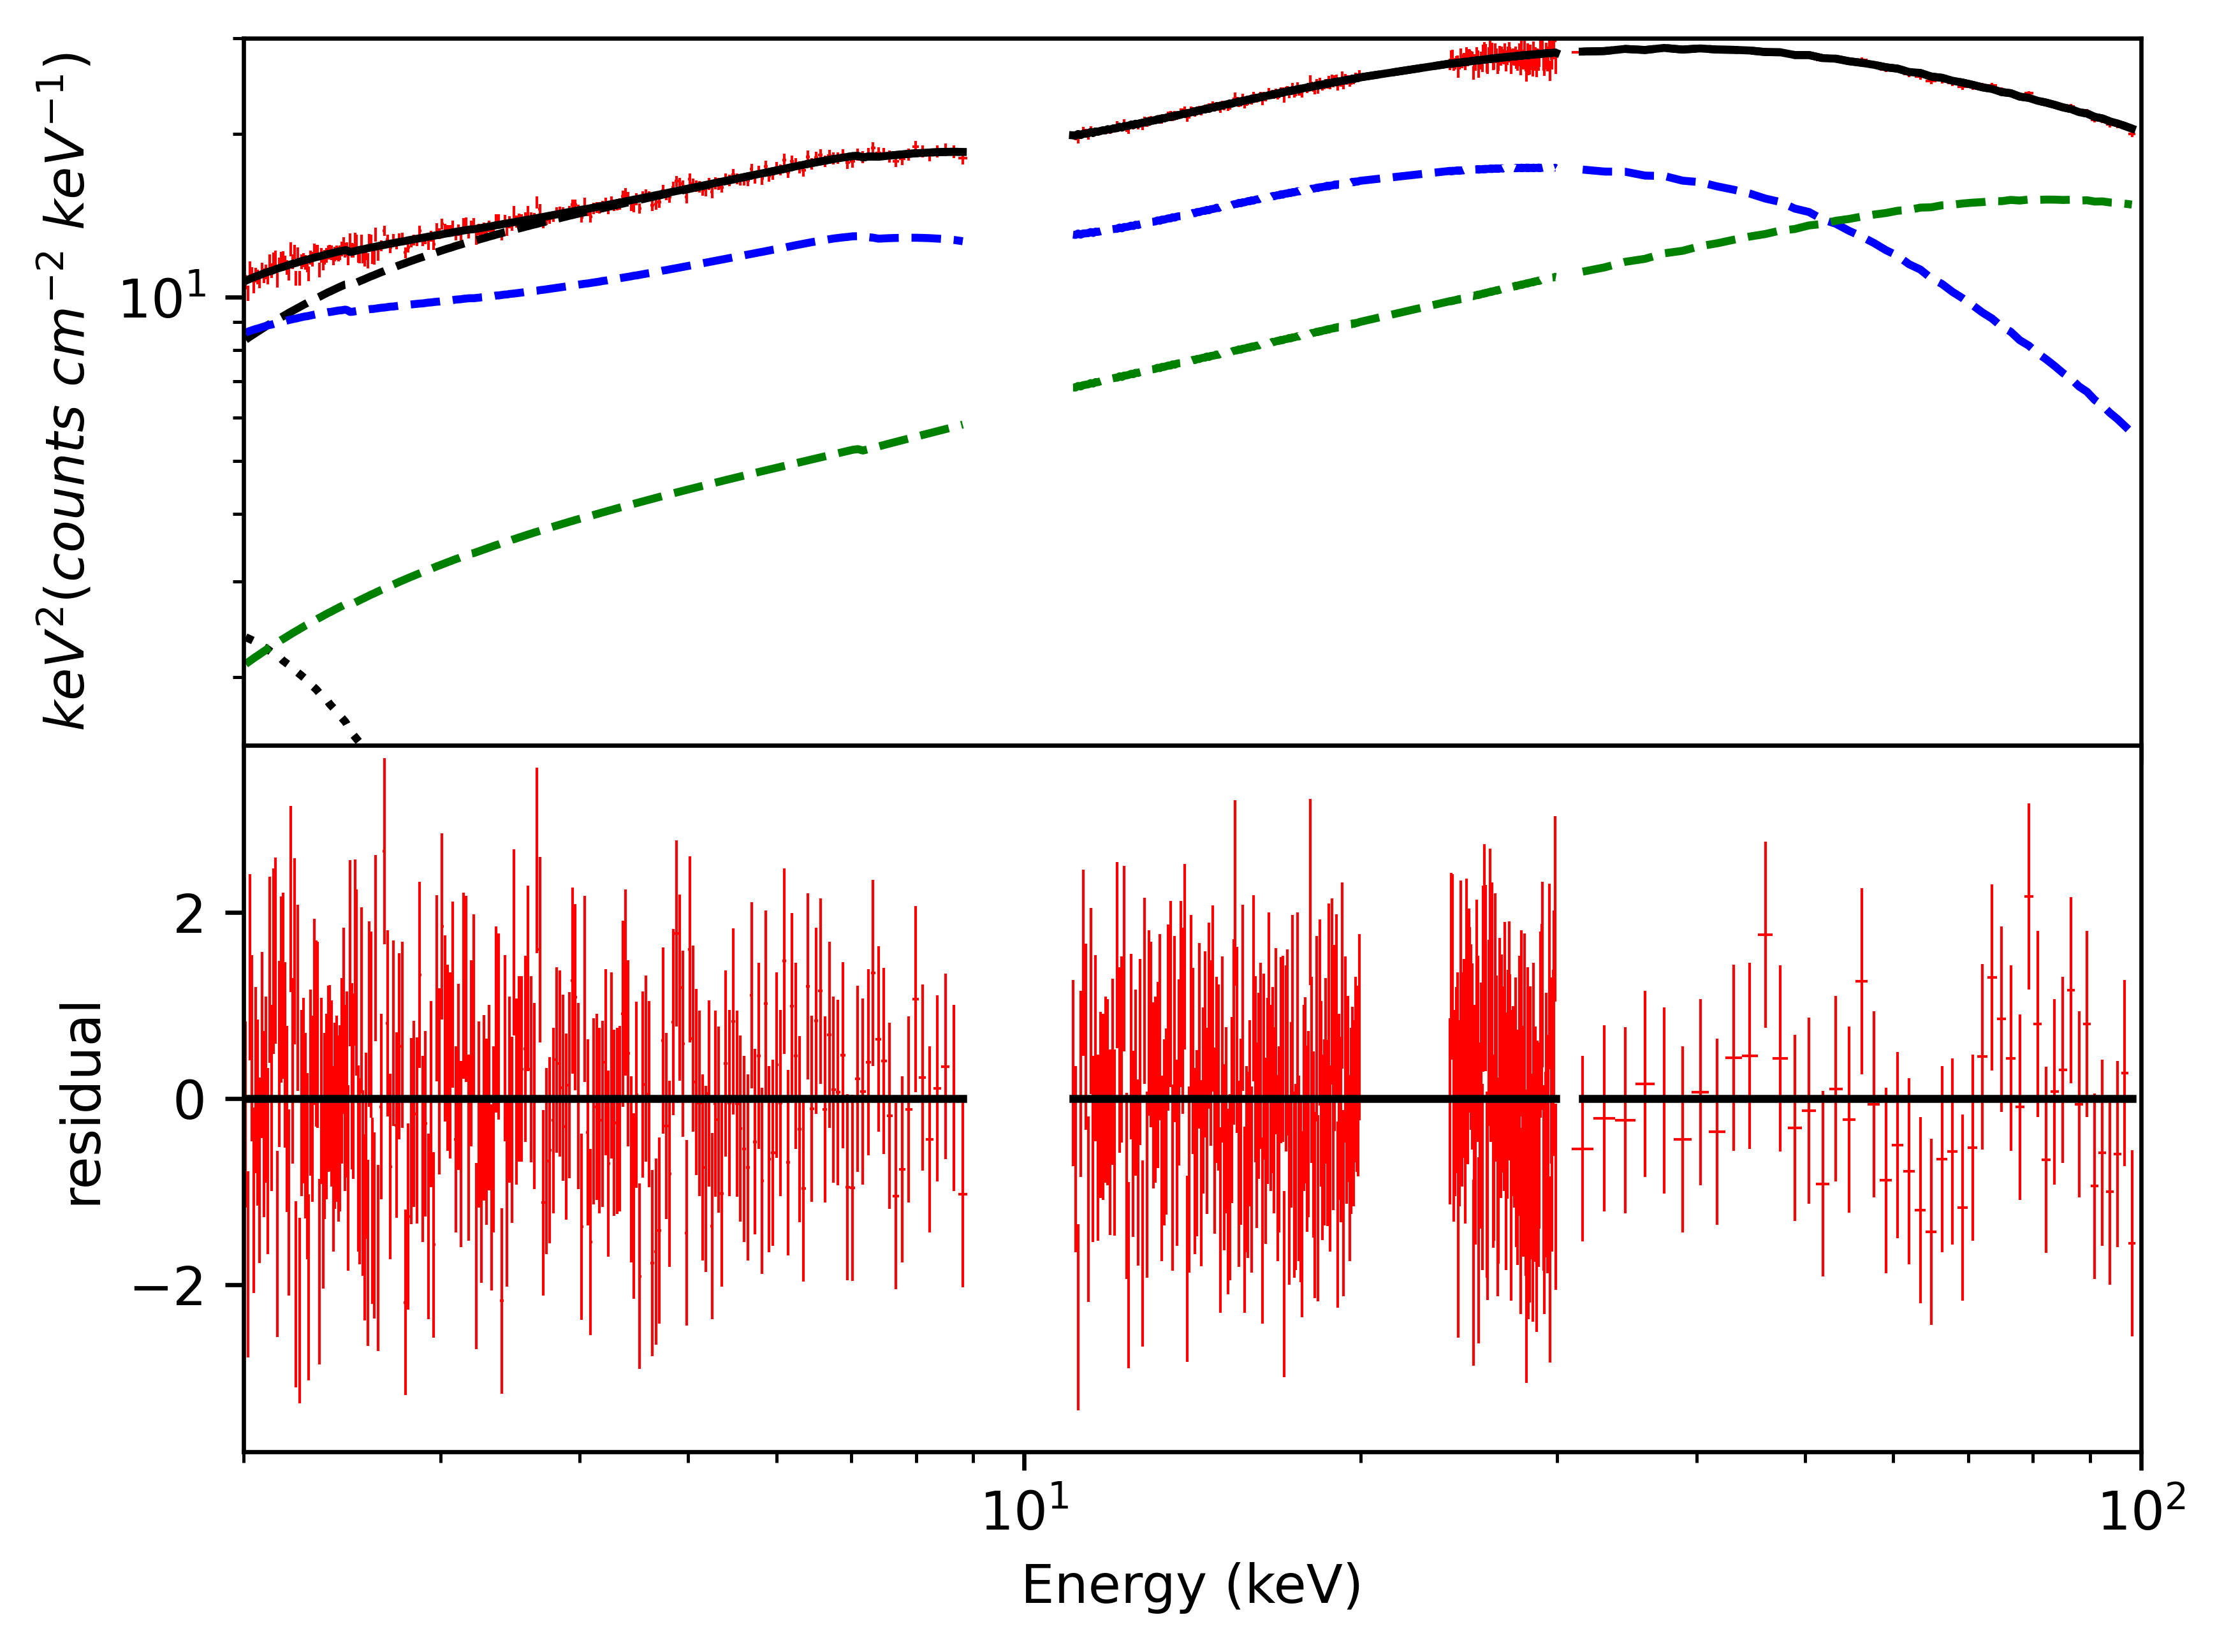
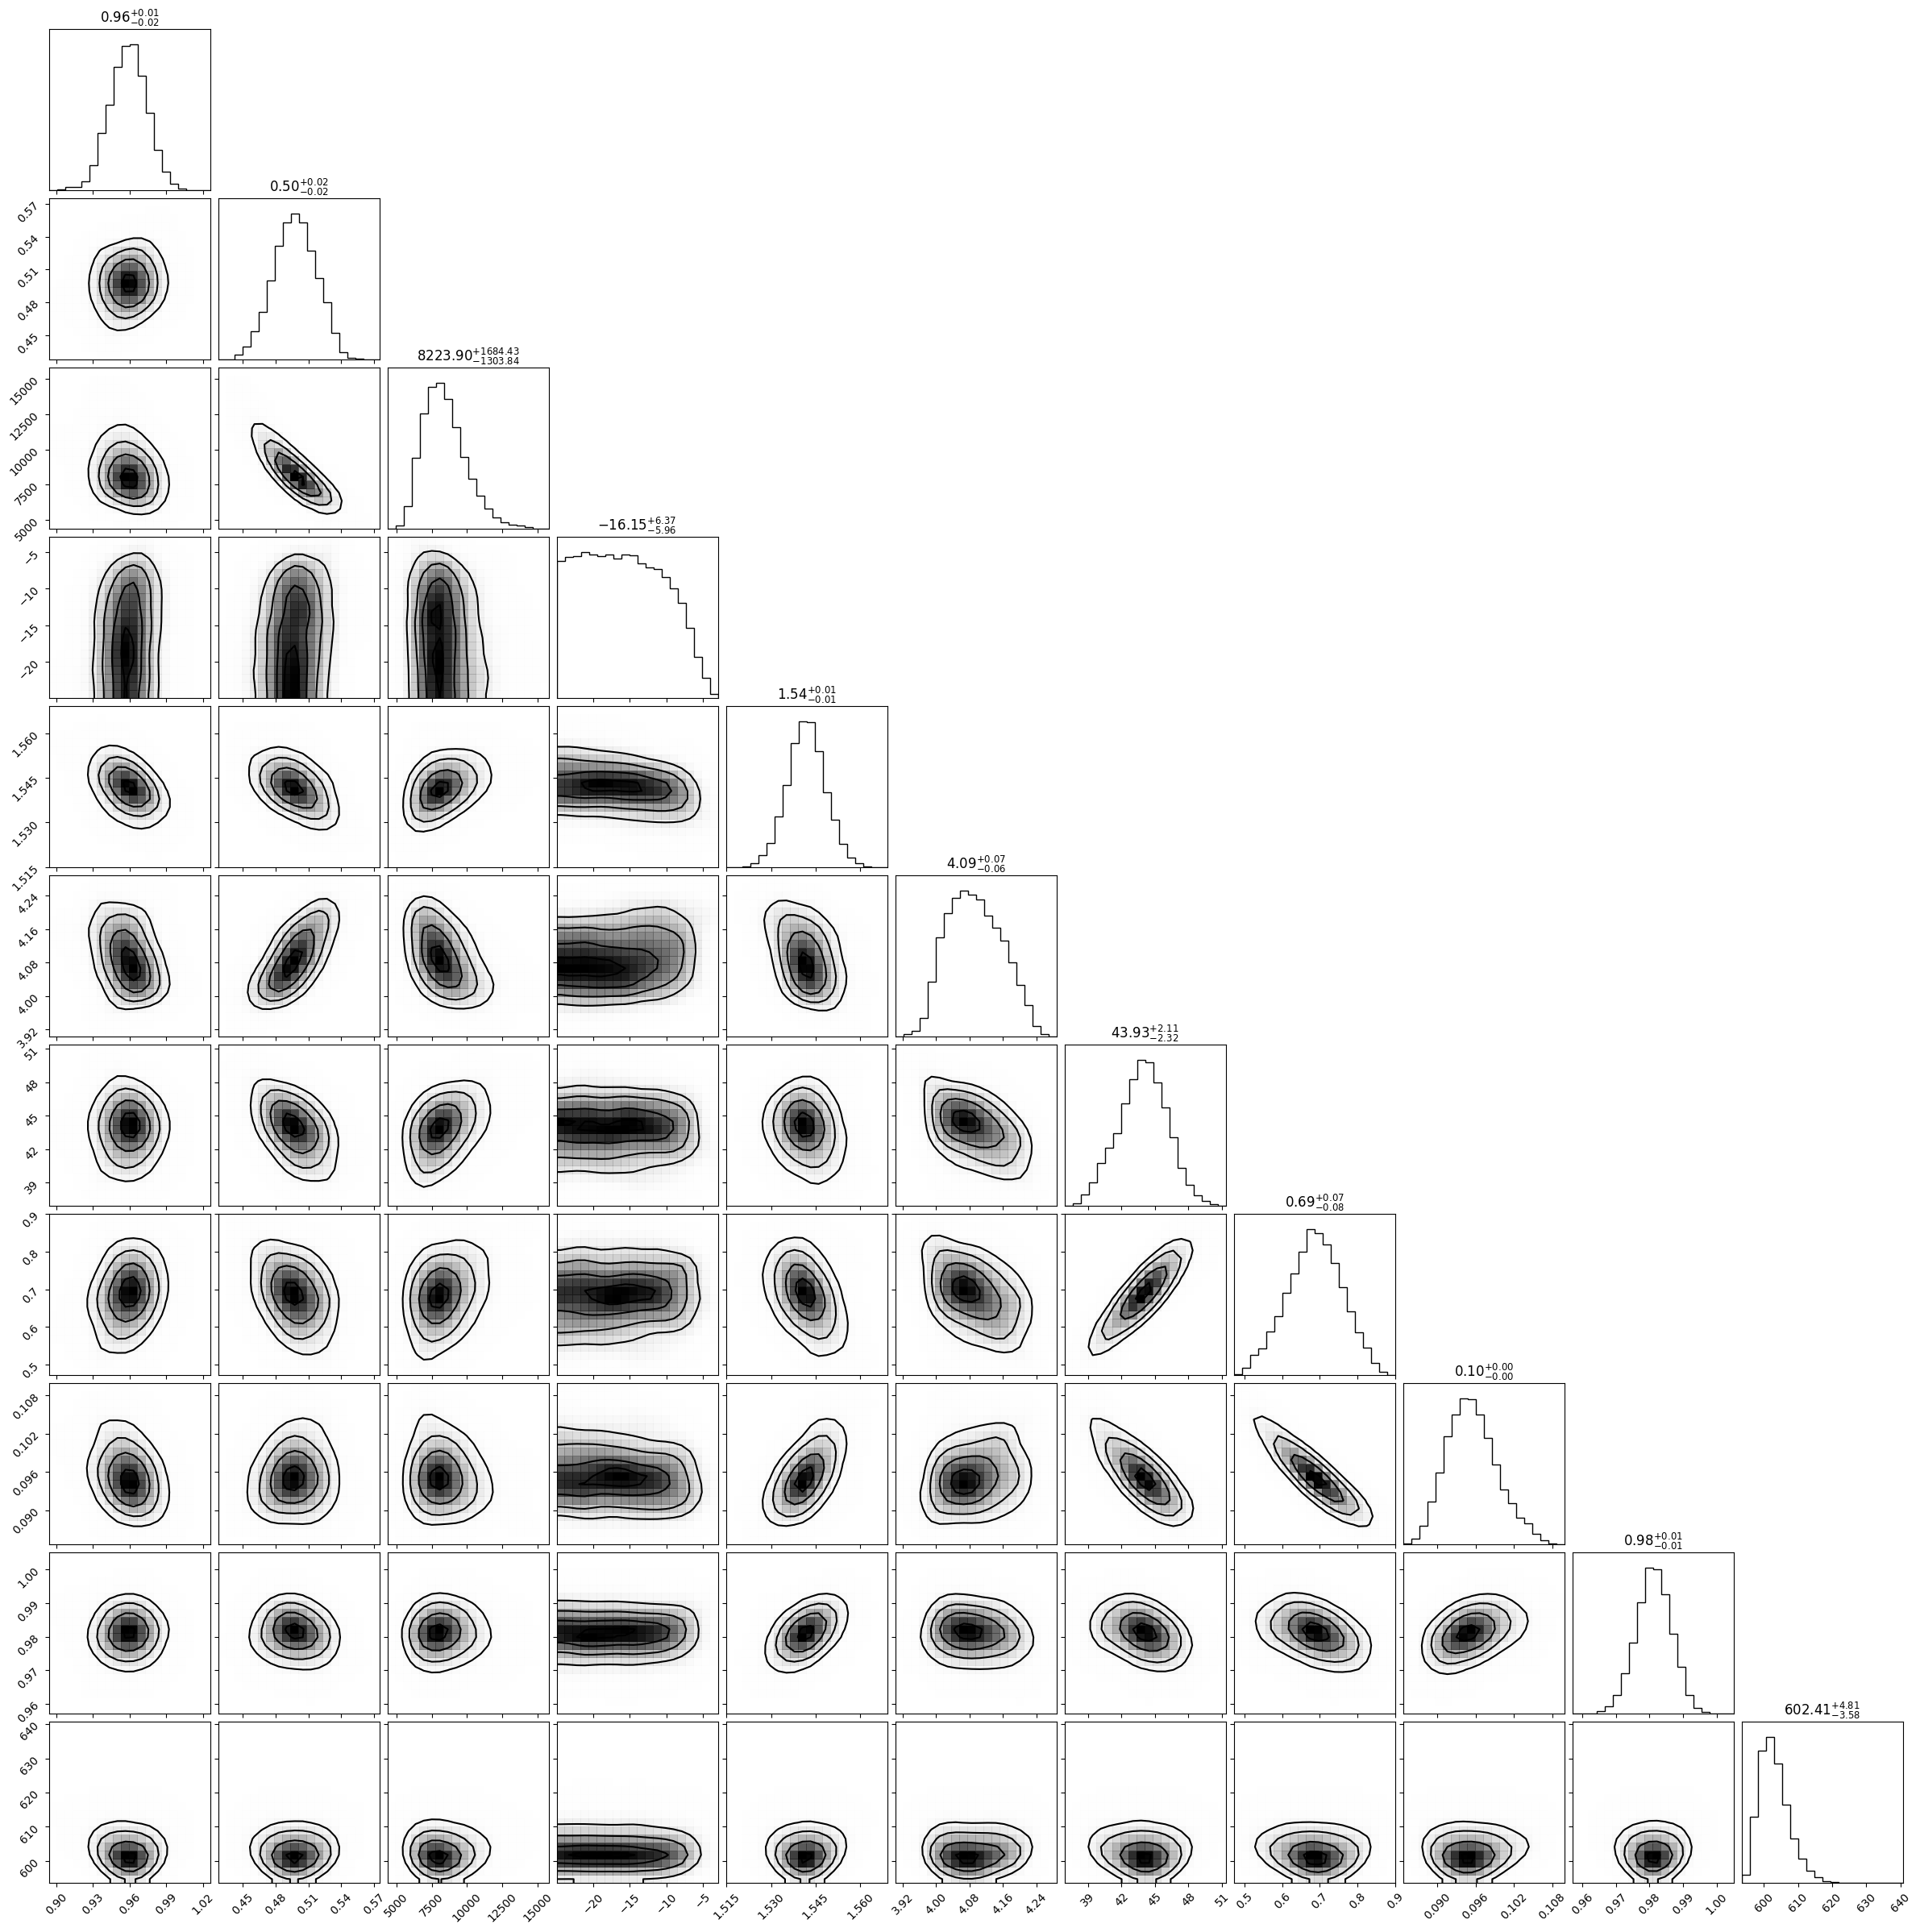
The reflection model can well fit the spectra with reduced around 1 and there is no structure on the residuals of all observations (the example spectrum and residual of observation 418 are shown in Fig. 3), besides, the cross normalization of three telescopes (LE, ME, HE) is at 0.95 to 1.05. The MCMC method with the Metropolis-Hastings algorithm is used to calculate the results and uncertainties by applying burning steps and steps length with 10 walkers (the example contour diagrams are illustrated in Fig. 4).
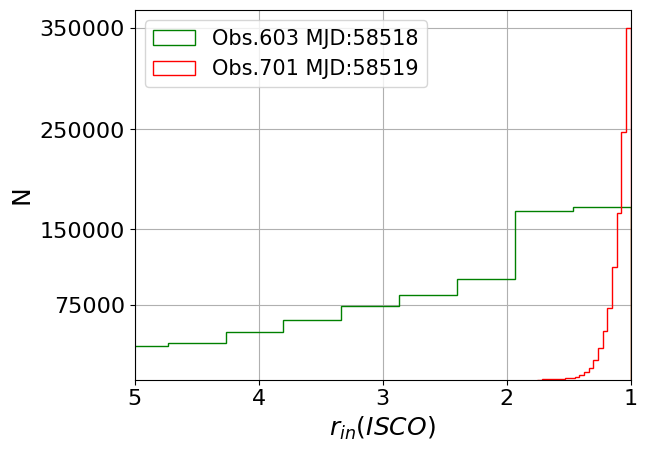
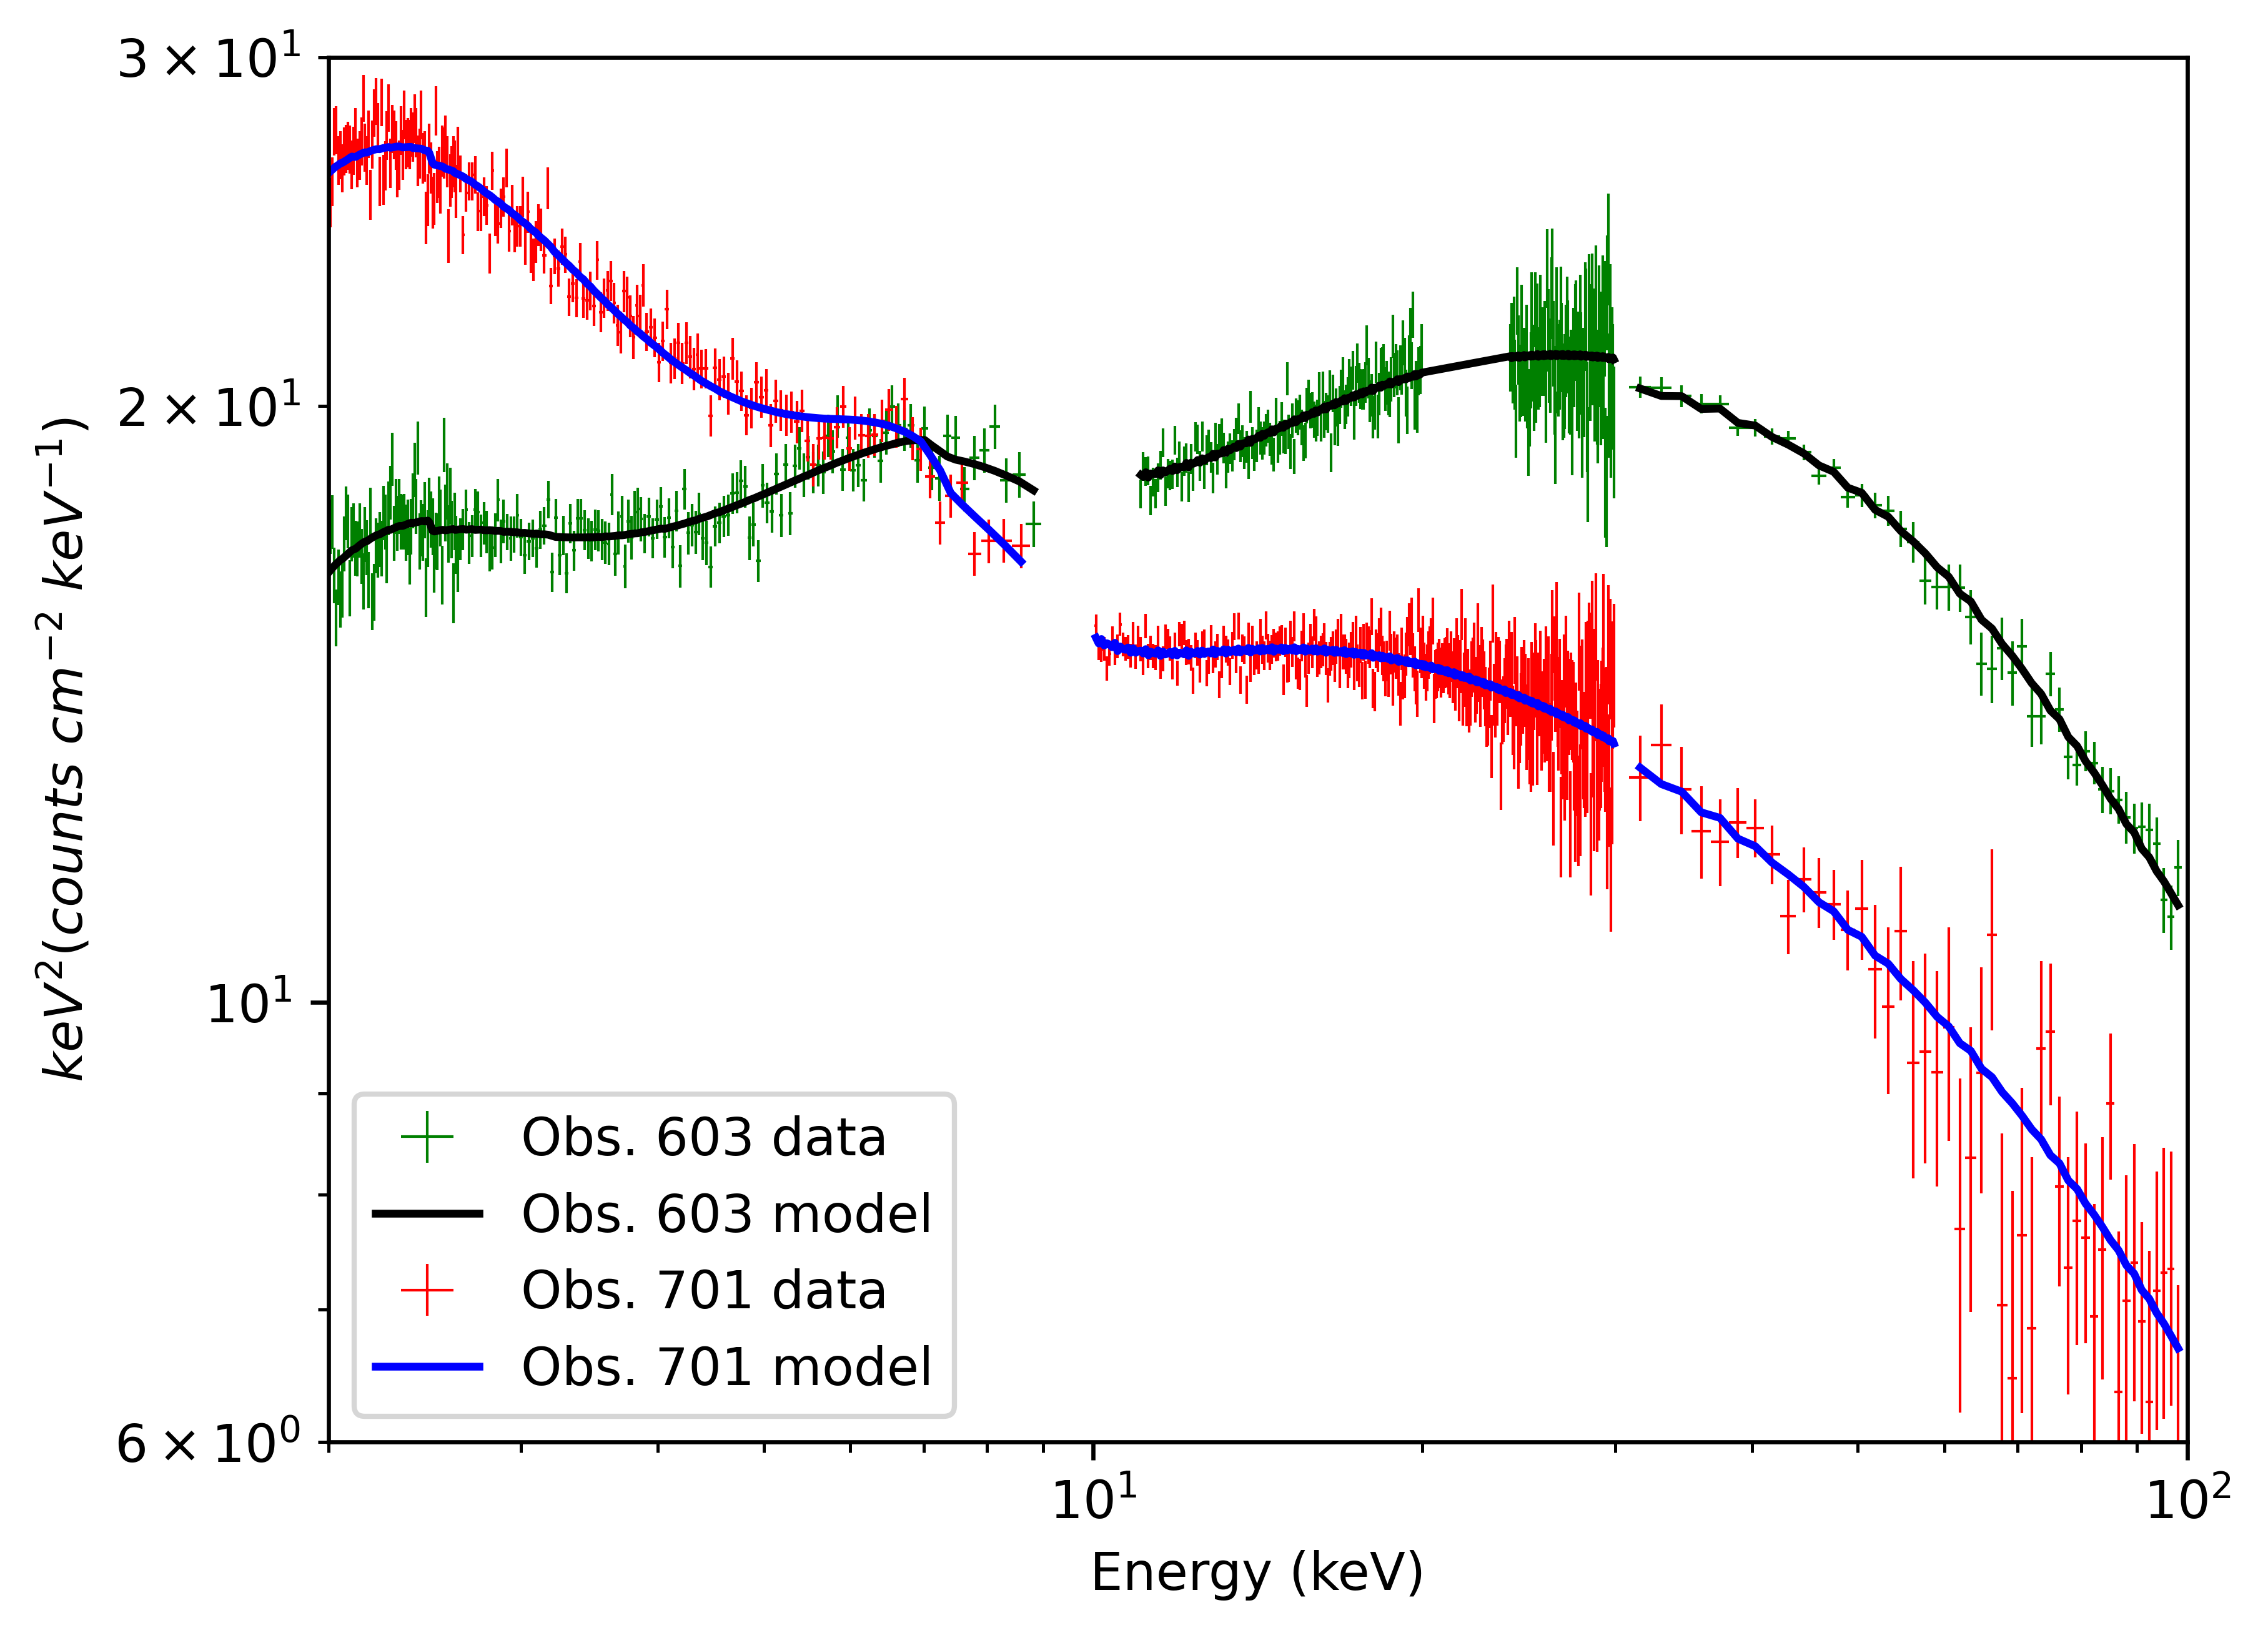
The results of the reflection model indicate that after observation 603 (at the observation 603, is very close to the ISCO) at MJD 58518, the inner edge of the accretion disk reaches the ISCO, and before that date has the low limit around 5 ISCO as illustrated in the row of Table 1. Fig. 5 shows the MCMC results after marginalizing the other parameters, and illustrates that in Obs. 603 (MJD 58518), presses within 2 ISCO and in Obs. 701 (MJD 58519), reaches ISCO. The spectra of these two observations shown in Fig. 6 also implied that when the accretion disk reaches the ISCO, the relatively soft flux (below 7 keV) becomes the dominant compared to the flux beyond 7 keV, and the flux at the energy band around iron emission line (near 7 keV) is invariable.
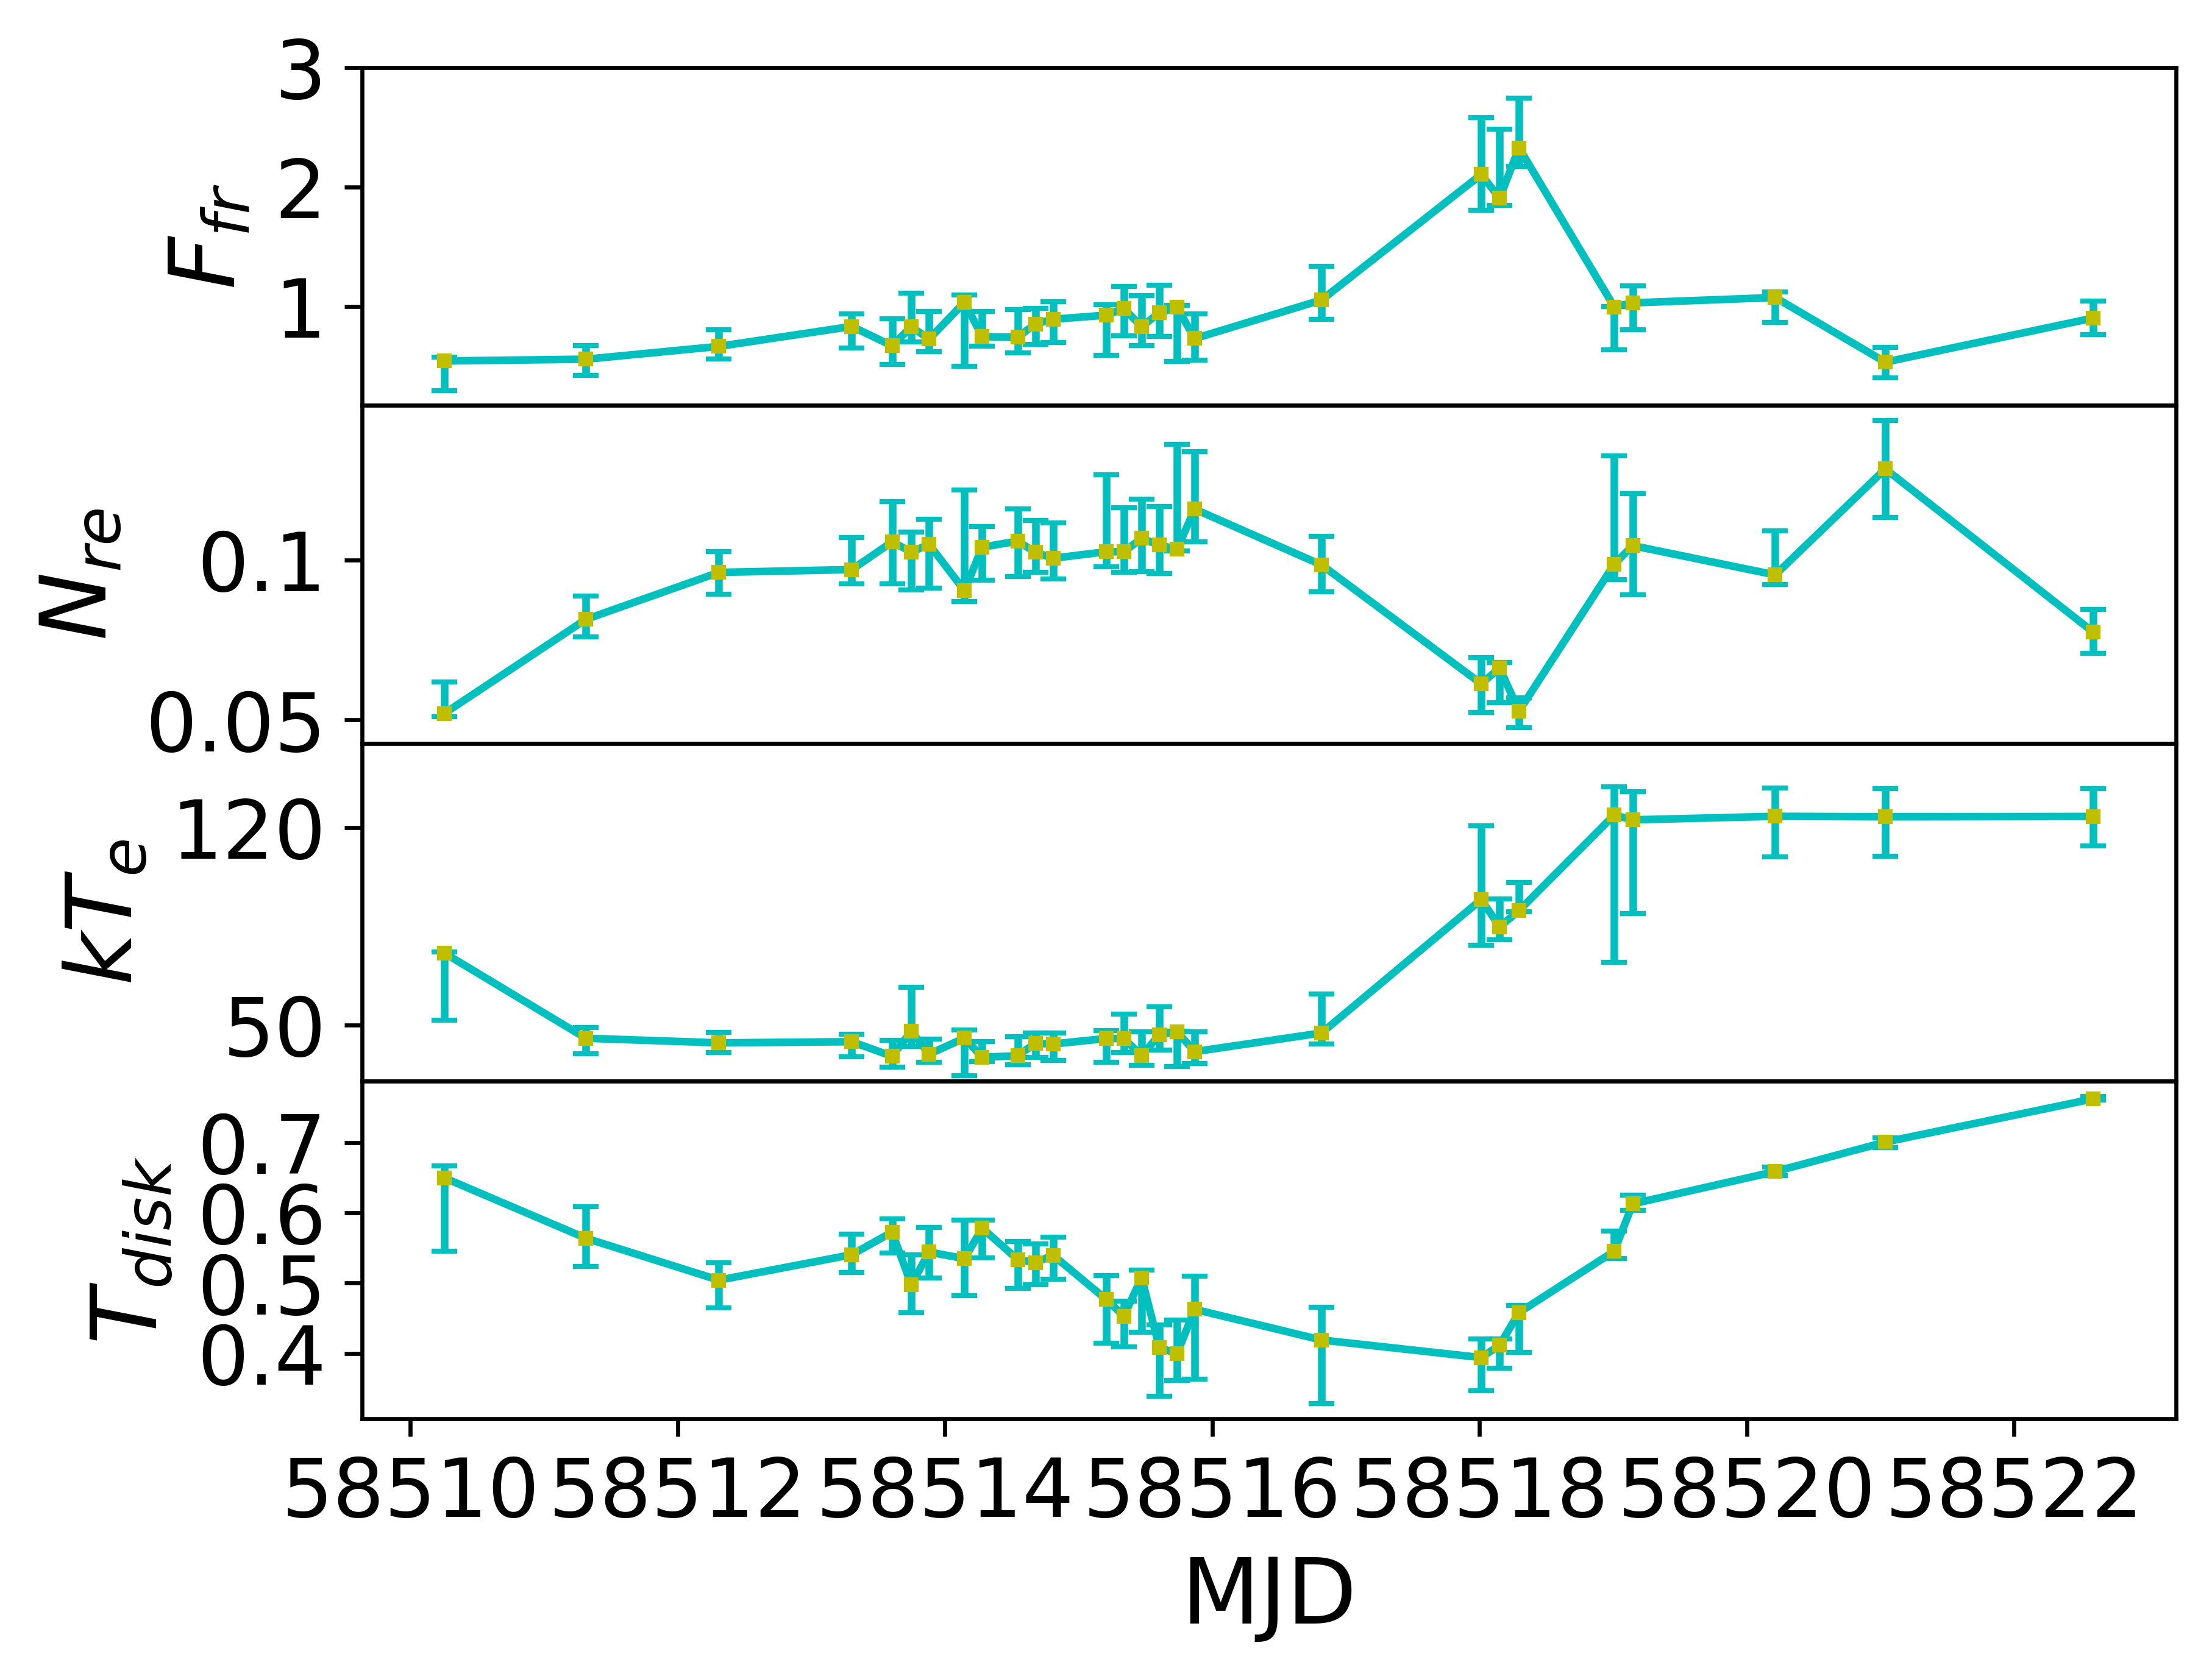
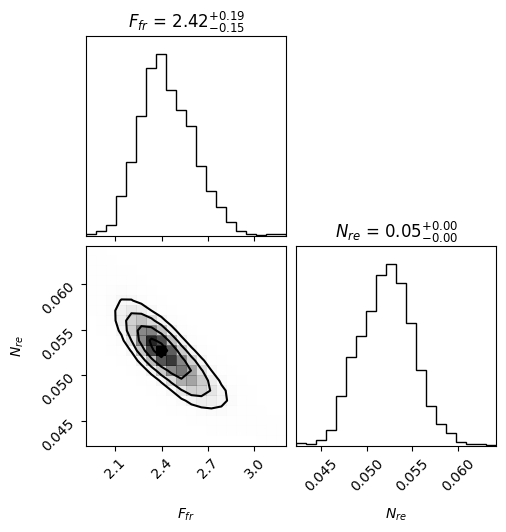
The top 2 panels of Fig. 7 illustrate the reflection fraction (ratio of intensity emitted to the disk and to escaping to infinity) and the normalization of reflection for the incident spectrum flux (, where is the flux and fix at , , see Dauser et al. 2016). The is generally below 1, except MJD 58517, 58518 when rises in MJD 58517 and reaches over 2, and then decays to less than 1 during HIS. For the reflection normalization , at the beginning of the outburst, the reflection normalization increases from 0.05 to 0.1 from MJD 58510 to 58512 and drops down to 0.05 around MJD 58518, rises above 0.1 in HIS. The MCMC results show that there is no apparent parameter degeneration between and (Fig. 8). The change in and implies the corona evolution. The temperature of corona in the range of keV, and in LHS the corona cools down to 50 keV, when the state to IS, the corona is heated back to 100 keV.
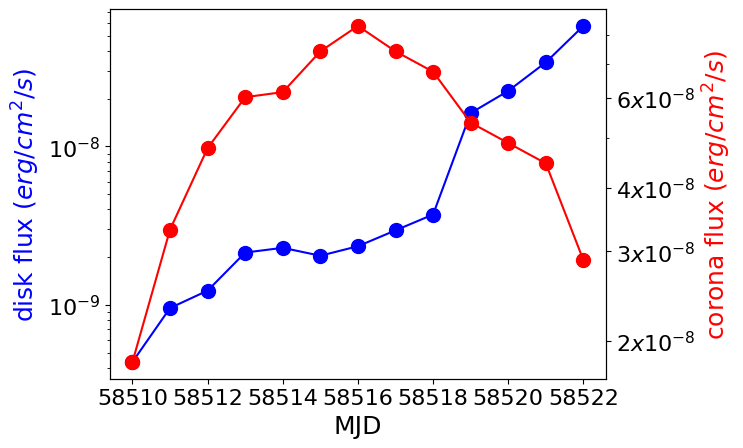
The unabsorbed fluxes in both disk and corona components are calculated which are obtained from the integral of diskbb and relxillCp in 2 keV to 100 keV as shown in Fig. 9. The disk flux continued to increase during the observations, from to during LHS, and rise fast during HIS from to within 3 days. At the beginning of the outburst, the corona flux around is one magnitude higher than the disk flux, and increases faster than that of the disk flux during the HIS. The corona component shows the peak flux around , and drops with the state evolving from LHS to HIS. At the end of HIS, the corona flux is about half of the disk flux. We also present the spectral changes in the state transitions in Fig. 10. With the state transitions, the flux below the 7 keV continued to increase, but the flux above 7 keV increased to a peak, then returned to drop, and the hump around 30 - 50 keV disappeared.
4 time lag of the radio peak
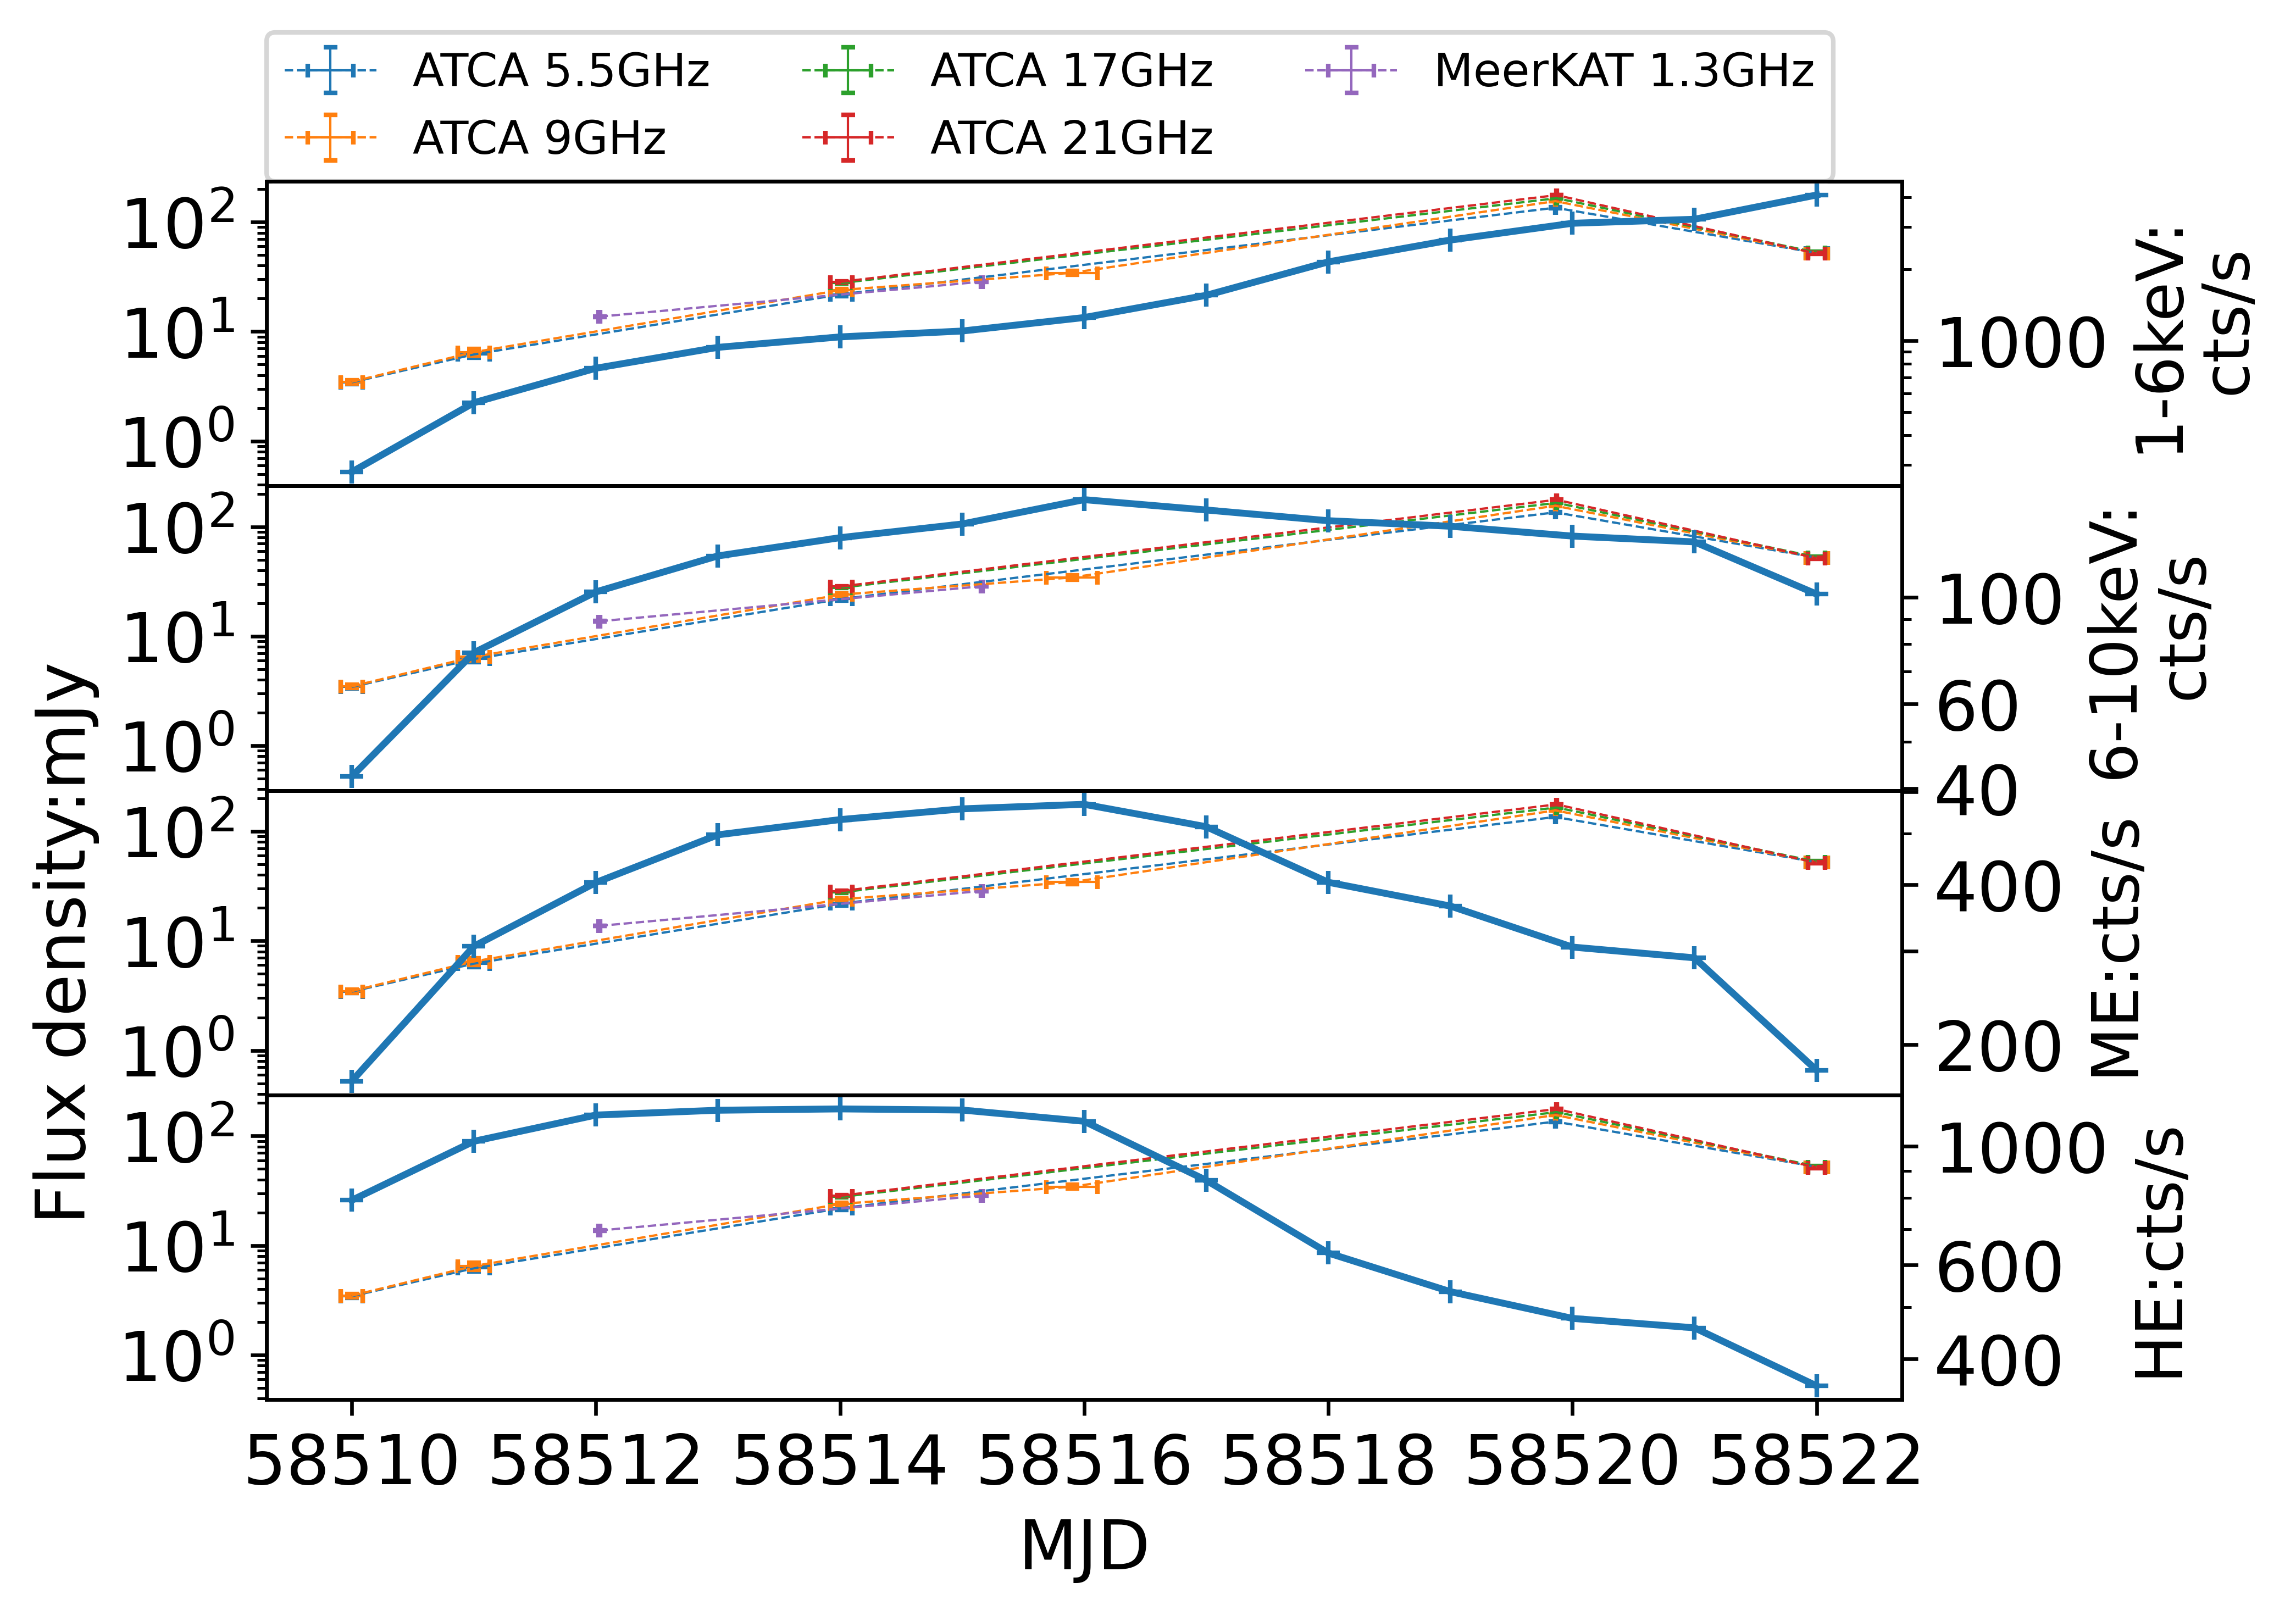
The MeerKAT and ATCA (Jonas & Team, 2016; Carotenuto et al., 2020) observed the source during the entire period we studied (Carotenuto et al., 2021), which illustrated a radio peak at MJD 58520. In Fig. 11, we compare the light curves of the radio flux density and X-rays in different energy bands. The light curve of the soft X-rays from 1 - 6 keV didn’t reach the peak flux until MJD 58522, then the disk emission continued to increase during the observations (also see Fig. 9). The harder X-ray photon emission above 6 keV reached the peak in the order from high energy band to low energy band. The 6-10 keV photon flux reaches a peak at around MJD 58516, and decreases slowly. The photon flux 11-30 keV (collected by ME telescopes) rises rapidly from the beginning of the outburst and reaches the peak at around MJD 58515-58516, and then drops to one-third within a week. For the 30-100 keV photons, the flux rises smoothly, reaches a peak phase around MJD 58512-58514, then decreases to one-third within six days. The radio flux density evolution presents a similar pattern in the radio bands from 1.3 GHz to 21 GHz observed by MeerKAT and ATCA, and the flux density increases smoothly from 3 mJy to the peak of over 100 mJy at MJD 58520, and then drops. Thus the radio emission shows a time lag compared with hard X-ray emissions.
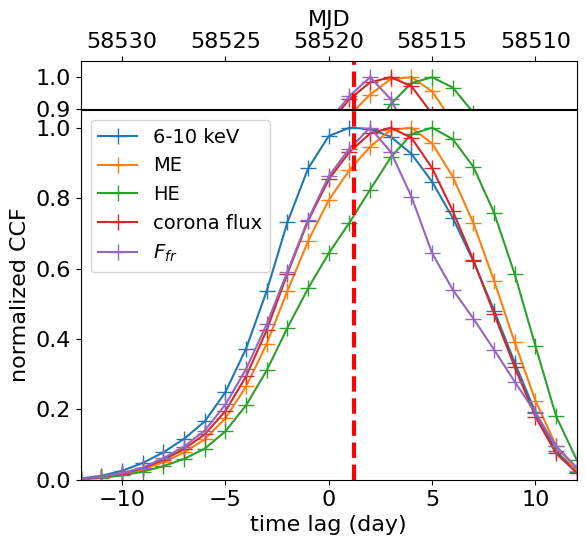
We used the cross-correlation function (CCF) to investigate the time lags of radio emission (shown in Fig. 12). Due to the radio flux density peak after all other curves, we set the other curves as zero point to study the radio time lag, thus, the bottom X-axis of Fig. 12 set as the radio peak time lag compared to other band curves in unity of day and the top X-axis of Fig. 12 represents MJD (the radio peak at MJD 58520 is aligned with the zero-day time lag). We normalized the CCF with the max bin of CCF results. The results of time lag analysis illustrate that the different photon fluxes of different physical origins reach the peak at various times. The radio flux density peak has the longest time lag (about 5 days) compared to the highest X-ray energy band (30 - 100 keV) peak. For a lower X-ray energy band, the radio flux density has a shorter time lag (e.g., 11 - 30 keV of 4 days, and 6- 10 keV of day). The time lag gradually becomes indistinct for the X-ray light curves below 10 keV.
The X-ray flux in different bands would be distinguished by the different physical origins: disk emission, reflection component, and corona emission. The corona flux variation shown in 9 also illustrates a peak in LHS, thus, we also compared the radio curve with the corona flux curve. The red line of Fig. 12 shows that the time lag of radio flux compared to the corona flux is about three days. The reflection fraction has the evolution, also presents a peak pattern at MJD 58518, and the radio time lag from the curve is about two days. Thus, the evolution curves of different components reach the peak in the time order: the highest energy X-ray photons from the corona emission (30 - 100 keV), relatively lower energy X-ray photons from the corona emission (11 - 30 keV), the total corona flux (including the photons reflected by the disk), and a reflection component fraction, then reaching ISCO about 1 day before the radio peak.
5 discussion
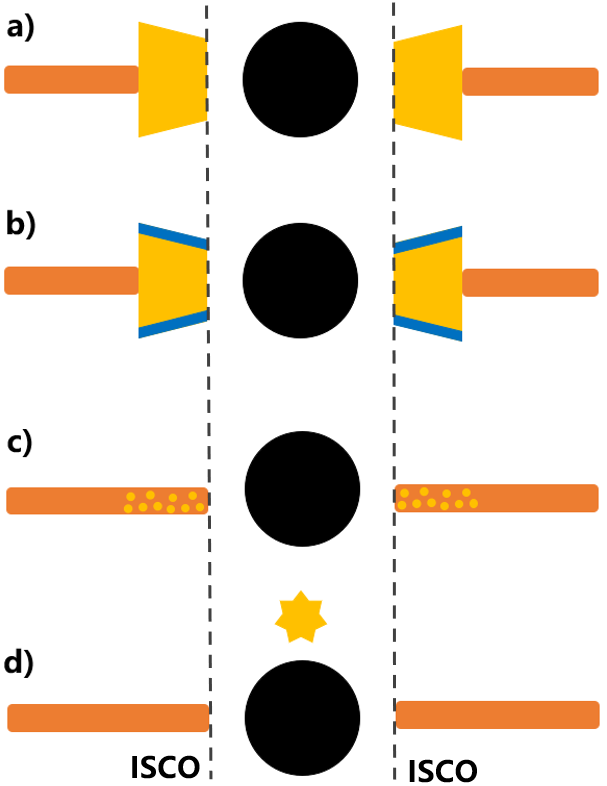
The evolution of the reflection fraction and corona emission suggested a transition in the geometry of the corona during the LHS and HIS based on the Insight-HXMT observations. The corona near the BH (Yuan & Narayan, 2014) could be advection-dominated accretion flows (ADAF, inside the accretion disk) or suitable for the lamppost model. The wide band X-ray spectral analysis finds that in the early stage of LHS, the inner edge of the accretion disk ISCO, and after MJD 58518, is near ISCO. Therefore, ADAF that occupied the region within the inner edge of the accretion disk in the early stage, which is shown in Fig. 13 (a), disappeared after MJD 58518 with disk component flux of and corona flux of . If we assume the black hole mass of 8 (Jana et al., 2020) and the distance of this source is 2.2 kpc (Chauhan et al., 2021), then when reaches ISCO with the total emission of 10% of Eddington luminosity, the disk component contributes to 2% of Eddington luminosity, and the corona component contributes to 8% of Eddington luminosity.
In LHS, ADAF could also change to luminous hot accretion flows (LHAF), due to the increase of the accretion rate. For LHAF, despite the strong cooling process, compressional heating (the energy advection plays this role) can keep the accretion flow hot, which also requires a higher accretion rate. The maximum accretion rate of ADAF and LHAF are and respectively, where means the maximum accretion rate of this kind of accretion, for the Eddington accretion rate, for the dimensionless viscosity coefficient parameter(Narayan, 1995; Nakamura et al., 1996; Yuan, 2001). This source has strong disk winds in LHS with a velocity (Wu et al., 2023a), and despite 0.1 in general assumption, the simulation works (Igumenshchev & Abramowicz, 2000) suggest that could reach and exceed 0.3 when there is a strong disk wind. In this source, the high-velocity wind comes from the inner region of the disk, which allows a higher , then the critical accretion rate of LHAF and ADAF is 10% and 4%, respectively. The luminosity range of the corona component in LHS and HIS increases from 3% Eddington luminosity to 10% Eddington luminosity, which exceeds the limitation of ADAF, and close to the limitation of LHAF. And when reaches ISCO (corona still has about 8% Eddington luminosity), the high accretion rate of the thin disk would destroy LHAF.
When the thin disk reaches ISCO, there is still strong reflection from the disk, which implies the corona will not be located along the plane of the accretion disk. Thus, the corona could be explained by the lamppost model above the black hole. increases from MJD 58517 and reaches 2 in MJD 58518 , while the incident flux decreases ( represents the incident flux on the disk from the corona), therefore rises due to the flux directly from corona dropping rapidly more than the flux incident on the disk, which implies that the obscuration of the corona by the material leads to the rapidly dropping off of the flux direct on the observer. The surface of the corona cooled down so that the cooled surface shaded more flux of the corona to the observer directly than the incident flux on the disk from the corona as shown in Fig. 13(b) about one day before the thin disk occupying ISCO. In addition, the contribution of the reflected spectral component is higher than that of the direct emission, except in the highest energy band (see Fig. 3).
The radio flux increased and reached the peak about one day after the thin disk reached ISCO, whereas, the jets always company with the hot accretion flows. The hot accretion flow begins to cool and vanish probably as following physical picture(Yuan, 2003): the cooling process of hot accretion flows would lead to the transition into two phases of the cold dense disk embedding hot gas in Fig. 13 (c). The cold dense disk provides enough optical depth to reflect, and the hot gas as the ADAF continues to supply the material to jets through the jet-ADAF model (Yuan et al., 2002). The different temperature parts of the corona may cool at different speeds: the higher temperature part corresponds to the faster cooling. Thus, there exist different time lags between X-ray and radio curves as illustrated in Fig. 12. Furthermore, the radio flux density peak lags the time of getting ISCO over one day, demonstrating that the two-phase cooling process lasts for about one day. After MJD 58520, the radio flux decreased which means that the jet weakens, however, the reflection still exists and the disk extended to ISCO, the corona could be explained by the lamppost geometry as shown in Fig. 13 (d).
Comparing the multiwavelength X-ray and radio flux evolution, with radio flux increasing to the peak, the accretion rate of the BH is around 10% Eddington accretion rate or higher, which would help to understand radio origin and jet production mechanism. Magnetically arrested disk (MAD), as a kind of hot accretion flow that can exist within the accretion disk, is proposed to possibly produce radio emission in the BH systems (Xie & Zdziarski, 2019). However, the inner radius of the accretion disk reaches near ISCO when the radio flux density is still high, thus the region of the hot accretion has disappeared, which suggests that the radio flux cannot come from the MAD. In addition, MAD also requires the maximum accretion rate at 3% Eddington accretion rate (Xie & Zdziarski, 2019), which is lower than the Insight-HXMT observations during LHS and HIS. The radio emission should have the origin of jets (Blandford & Königl, 1979).
In this source during outburst, the observations may not support the BP jet mechanism (Blandford & Payne, 1982; Komissarov et al., 2007) and the BZ jet mechanism (Penna et al., 2013; Blandford & Znajek, 1977; Komissarov & McKinney, 2007) in MAX J13480-630. The BP jet mechanism produces the jet by extracting energy from the accretion disk, which needs the magnetic field through the accretion disk. The BZ process needs a high magnetic flux threading the horizon to extract the energy from the fast-rotating BH (however, only a moderate spin BH located in MAX J13480-630, Wu et al. 2023b). The favorable situation of both mechanisms needs the magnetic flux of the disk near the limitation of MAD corresponding to a magnetic field strength , which would lead the magnetic pressure to dominate the gas pressure and radiation pressure when the magnetic field would make thin disk thicker and the dissipation advect to the BH(Sadowski, 2016). Our scenario prefers the magnetic tower mechanism (Lynden-Bell, 2003; Hawley & Krolik, 2006) in which the differential rotation accretion flows produce the high magnetic pressure gradient driving the gas accelerated away from the surface of the accretion disk to form the jet. The magnetic tower forms at a relatively high height and the high magnetic pressure gradient behaves in the normal direction of the accretion disk so that this mechanism has a small influence on the thin disk, allowing the existence of a relatively high accretion rate.
6 summary
In this paper, we report the spectral analysis of MAXI J1348-630 during the LHS and HIS of the 2019 outburst from 2 keV to 100 keV based on Insight-HXMT data. We have tested the spectrum with the power law and thermal Compton models, and there exist the obvious board iron line and Compton hump, which imply a strong reflection. The reflection model can well describe the spectra during the entire period. The inner edge of the accretion disk exceeded 5 ISCO during the LHS, and reaches at ISCO at MJD 58518 when the source was in HIS. The corona radiation showed a strong evolution during the LHS and HIS. The corona temperature evolved from to in LHS, and after MJD 58517 returned to . During most periods of LHS and HIS, the reflection fraction stayed below 1, after MJD 58517, the reflection fraction increased to and reached at MJD 58518. The disk emission continued to increase during the observation, while the corona emission rose at first and decreased in HIS, showing a peak around MJD 58516.
Radio emission shows the time lags compared to hard X-ray emissions and reflection features. The high energy X-ray flux (30 - 100 keV) arrives at peak earliest about 5 days ahead of radio flux, and X-ray flux of 11-30 keV about 4 days ahead of radio flux, the reflection fraction () also show a peak about 2 days ahead of radio flux. In addition, the inner radius of the accretion disk reaches the ISCO about 1 day before the radio peak. These disk-corona-jet coupling and evolution provide the clues of understanding corona geometry and jet production process. The hot inner accretion flow along the plane evolves from ADAF to LHAF, transiting to the corona explained by the lamppost model when is near ISCO. With the shrinkage of the hot accretion flow, the accretion rate increases to 10% Eddington rate and radio emission also increases, favoring the magnetic tower jet mechanism instead of the MAD formation, which requires a lower accretion rate than 3%.
We also propose a scenario for the disk-corona-jet coupling during the state transitions from LHS, HIS to SIS for this source. In LHS, the ADAF/LHAF corona exists within the inner edge of the accretion disk. With the surface of the corona cooling (HIS), the cooled surface shaded more flux of the corona to the observer directly than the incident flux on the disk from the corona. Around the start of SIS, the disk extends to ISCO, the jet is still powerful, the cooling process of hot accretion flows would lead to the transition into two phases of the cold dense clumps embedding hot gas. During the SIS, the jet weakens, the disk is near ISCO but the reflection could be explained by the lamppost geometry. The present scenario based on the reflection models has some simple theoretical assumptions, thus the more realistic model is expected in future.
Acknowledgements
We are grateful to the referee for the useful comments and suggestions to improve the manuscript. This work is supported by the National Key Research and Development Program of China (Grants No. 2021YFA0718503 and 2023YFA1607901), the NSFC (12133007). This work has made use of data from the Insight-HXMT mission, a project funded by the China National Space Administration (CNSA) and the Chinese Academy of Sciences (CAS).
Observational information is listed in Table 2 including the observation ID, observation date (UTC & MJD), the exposure time of three telescopes (LE, ME, HE), and the abbreviation of each observation.
| Obs. ID | Obs. date | Obs. date | LE Exposure(s) | ME Exposure(s) | HE Exposure(s) | Abbreviation |
|---|---|---|---|---|---|---|
| (yyyy-mm-dd) | (MJD) | |||||
| P021400200101 | 2019-01-27 | 58510 | 2327.461 | 2327.461 | 2848.061 | 101 |
| P021400200201 | 2019-01-28 | 58511 | 1609.949 | 1609.949 | 2547.424 | 201 |
| P021400200301 | 2019-01-29 | 58512 | 2652.155 | 2652.155 | 3668.126 | 301 |
| P021400200401 | 2019-01-30 | 58513 | 2567.898 | 2567.898 | 3454.549 | 401 |
| P021400200403 | 2019-01-30 | 58513 | 2281.115 | 2281.115 | 3115.648 | 403 |
| P021400200404 | 2019-01-30 | 58513 | 1942.241 | 1942.241 | 2787.582 | 404 |
| P021400200405 | 2019-01-30 | 58513 | 1753.85 | 1753.85 | 2481.715 | 405 |
| P021400200407 | 2019-01-31 | 58514 | 1312.408 | 1312.408 | 797.5142 | 407 |
| P021400200408 | 2019-01-31 | 58514 | 1933.67 | 1933.67 | 2466.319 | 408 |
| P021400200410 | 2019-01-31 | 58514 | 1644.985 | 1644.985 | 2044.544 | 410 |
| P021400200411 | 2019-01-31 | 58514 | 2023.728 | 2023.728 | 2830.101 | 411 |
| P021400200412 | 2019-01-31 | 58514 | 1981.533 | 1981.533 | 2797.051 | 412 |
| P021400200415 | 2019-02-01 | 58515 | 1767.28 | 1767.28 | 2664.21 | 415 |
| P021400200416 | 2019-02-01 | 58515 | 1462.672 | 1462.672 | 1538.375 | 416 |
| P021400200417 | 2019-02-01 | 58515 | 1066.87 | 1066.87 | 847.3768 | 417 |
| P021400200418 | 2019-02-01 | 58515 | 2131.231 | 2131.231 | 3102.183 | 418 |
| P021400200419 | 2019-02-01 | 58515 | 2043.387 | 2043.387 | 2918.853 | 419 |
| P021400200420 | 2019-02-01 | 58515 | 1485.255 | 1485.255 | 2103.471 | 420 |
| P021400200501 | 2019-02-02 | 58516 | 1598.218 | 1598.218 | 2308.631 | 501 |
| P021400200601 | 2019-02-04 | 58518 | 1364.654 | 1364.654 | 378.9088 | 601 |
| P021400200602 | 2019-02-04 | 58518 | 2162.398 | 2162.398 | 2790.599 | 602 |
| P021400200603 | 2019-02-04 | 58518 | 1010.76 | 1010.76 | 1106.21 | 603 |
| P021400200701 | 2019-02-05 | 58519 | 239.40 | 1608.515 | 101.413 | 701 |
| P021400200702 | 2019-02-05 | 58519 | 325.18 | 2140.116 | 2910.508 | 702 |
| P021400200804 | 2019-02-06 | 58520 | 624.43 | 1911.50 | 2117.33 | 804 |
| P021400200904 | 2019-02-07 | 58521 | 239.40 | 1332.88 | 839.89 | 904 |
| P021400201101 | 2019-02-08 | 58522 | 638.4 | 2454.94 | 3210.02 | 1101 |
References
- Abramowicz et al. (1988) Abramowicz, M., Czerny, B., Lasota, J., & Szuszkiewicz, E. 1988, Astrophysical Journal, Part 1 (ISSN 0004-637X), vol. 332, Sept. 15, 1988, p. 646-658. Research supported by Observatoire de Paris and NASA., 332, 646
- Alabarta et al. (2022) Alabarta, K., Méndez, M., García, F., et al. 2022, Monthly Notices of the Royal Astronomical Society
- Belloni et al. (2000) Belloni, T., Klein-Wolt, M., Méndez, M., Van Der Klis, M., & Van Paradijs, J. 2000, arXiv preprint astro-ph/0001103
- Belloni et al. (2020) Belloni, T. M., Zhang, L., Kylafis, N. D., Reig, P., & Altamirano, D. 2020, Monthly Notices of the Royal Astronomical Society, 496, 4366
- Blandford & Königl (1979) Blandford, R., & Königl, A. 1979, Astrophysical Journal, Part 1, vol. 232, Aug. 15, 1979, p. 34-48., 232, 34
- Blandford & Payne (1982) Blandford, R., & Payne, D. 1982, Monthly Notices of the Royal Astronomical Society, 199, 883
- Blandford & Znajek (1977) Blandford, R. D., & Znajek, R. L. 1977, Monthly Notices of the Royal Astronomical Society, 179, 433
- Cangemi et al. (2022) Cangemi, F., Rodriguez, J., Belloni, T., et al. 2022, arXiv preprint arXiv:2210.08561
- Cao et al. (2020) Cao, X., Jiang, W., Meng, B., et al. 2020, SCIENCE CHINA Physics, Mechanics & Astronomy, 63, 1
- Carotenuto et al. (2022a) Carotenuto, F., Corbel, S., & Tzioumis, A. 2022a, Monthly Notices of the Royal Astronomical Society: Letters, 517, L21
- Carotenuto et al. (2022b) Carotenuto, F., Tetarenko, A., & Corbel, S. 2022b, Monthly Notices of the Royal Astronomical Society, 511, 4826
- Carotenuto et al. (2019) Carotenuto, F., Tremou, E., Corbel, S., et al. 2019, The Astronomer’s Telegram, 12497, 1
- Carotenuto et al. (2020) Carotenuto, F., Corbel, S., Tremou, E., et al. 2020, The Astronomer’s Telegram, 14029, 1
- Carotenuto et al. (2021) —. 2021, Monthly Notices of the Royal Astronomical Society, 504, 444
- Chakraborty et al. (2021) Chakraborty, S., Ratheesh, A., Bhattacharyya, S., et al. 2021, Monthly Notices of the Royal Astronomical Society, 508, 475
- Chauhan et al. (2021) Chauhan, J., Miller-Jones, J., Raja, W., et al. 2021, Monthly Notices of the Royal Astronomical Society: Letters, 501, L60
- Chen et al. (2020) Chen, Y., Cui, W., Li, W., et al. 2020, Science China Physics, Mechanics & Astronomy, 63, 1
- Chen et al. (2019) Chen, Y. P., Ma, X., Huang, Y., et al. 2019, The Astronomer’s Telegram, 12470, 1
- Dauser et al. (2014) Dauser, T., García, J., Parker, M., Fabian, A., & Wilms, J. 2014, Monthly Notices of the Royal Astronomical Society: Letters, 444, L100
- Dauser et al. (2016) Dauser, T., García, J., Walton, D., et al. 2016, Astronomy & Astrophysics, 590, A76
- Denisenko et al. (2019) Denisenko, D., Denisenko, I., Evtushenko, M., et al. 2019, The Astronomer’s Telegram, 12430, 1
- Done et al. (2007) Done, C., Gierliński, M., & Kubota, A. 2007, The Astronomy and Astrophysics Review, 15, 1
- Fabian (2016) Fabian, A. 2016, Astronomische Nachrichten, 337, 375
- Fabian et al. (1989) Fabian, A., Rees, M., Stella, L., & White, N. E. 1989, Monthly Notices of the Royal Astronomical Society, 238, 729
- Fender et al. (2004) Fender, R. P., Belloni, T. M., & Gallo, E. 2004, Monthly Notices of the Royal Astronomical Society, 355, 1105
- Garc´ıa et al. (2021) García, F., Méndez, M., Karpouzas, K., et al. 2021, Monthly Notices of the Royal Astronomical Society, 501, 3173
- Garc´ıa et al. (2015) García, J. A., Dauser, T., Steiner, J. F., et al. 2015, The Astrophysical Journal Letters, 808, L37
- Hawley & Krolik (2006) Hawley, J. F., & Krolik, J. H. 2006, The Astrophysical Journal, 641, 103
- Igumenshchev & Abramowicz (2000) Igumenshchev, I. V., & Abramowicz, M. A. 2000, The Astrophysical Journal Supplement Series, 130, 463
- Jana et al. (2019) Jana, A., Debnath, D., Chatterjee, D., et al. 2019, The Astronomer’s Telegram, 12505, 1
- Jana et al. (2020) —. 2020, The Astrophysical Journal, 897, 3
- Jia et al. (2022) Jia, N., Zhao, X., Gou, L., et al. 2022, Monthly Notices of the Royal Astronomical Society, 511, 3125
- Jithesh et al. (2021) Jithesh, V., Misra, R., Maqbool, B., & Mall, G. 2021, Monthly Notices of the Royal Astronomical Society, 505, 713
- Jonas & Team (2016) Jonas, J., & Team, M. 2016, MeerKAT Science: On the Pathway to the SKA, 1
- Kennea & Negoro (2019) Kennea, J., & Negoro, H. 2019, The Astronomer’s Telegram, 12434, 1
- Komissarov et al. (2007) Komissarov, S. S., Barkov, M. V., Vlahakis, N., & Königl, A. 2007, Monthly Notices of the Royal Astronomical Society, 380, 51
- Komissarov & McKinney (2007) Komissarov, S. S., & McKinney, J. C. 2007, Monthly Notices of the Royal Astronomical Society: Letters, 377, L49
- Kumar et al. (2022) Kumar, R., Bhattacharyya, S., Bhatt, N., & Misra, R. 2022, Monthly Notices of the Royal Astronomical Society, 513, 4869
- Lamer et al. (2021) Lamer, G., Schwope, A., Predehl, P., et al. 2021, Astronomy & Astrophysics, 647, A7
- Li et al. (2023) Li, X., Chen, Y., Song, L., et al. 2023, arXiv preprint arXiv:2302.10714
- Liao et al. (2020) Liao, J.-Y., Zhang, S., Chen, Y., et al. 2020, Journal of High Energy Astrophysics, 27, 24
- Liu et al. (2020) Liu, C., Zhang, Y., Li, X., et al. 2020, SCIENCE CHINA Physics, Mechanics & Astronomy, 63, 1
- Liu et al. (2022) Liu, H., Huang, Y., Bu, Q., et al. 2022, The Astrophysical Journal, 938, 108
- Lovelace et al. (1999) Lovelace, R., Li, H., Colgate, S., & Nelson, A. 1999, The Astrophysical Journal, 513, 805
- Lynden-Bell (2003) Lynden-Bell, D. 2003, Monthly Notices of the Royal Astronomical Society, 341, 1360
- Makishima et al. (1986) Makishima, K., Maejima, Y., Mitsuda, K., et al. 1986, The Astrophysical Journal, 308, 635
- Mall et al. (2022) Mall, G., Vadakkumthani, J., & Misra, R. 2022, Research in Astronomy and Astrophysics
- Matsuoka et al. (2009) Matsuoka, M., Kawasaki, K., Ueno, S., et al. 2009, Publications of the Astronomical Society of Japan, 61, 999
- McClintock et al. (2006) McClintock, J. E., Shafee, R., Narayan, R., et al. 2006, The Astrophysical Journal, 652, 518
- Mitsuda et al. (1984) Mitsuda, K., Inoue, H., Koyama, K., et al. 1984, Publications of the Astronomical Society of Japan, 36, 741
- Nakamura et al. (1996) Nakamura, K. E., Matsumoto, R., Kusunose, M., & Kato, S. 1996, Publications of the Astronomical Society of Japan, 48, 761
- Narayan (1995) Narayan, R. 1995, arXiv preprint astro-ph/9510028
- Niedźwiecki et al. (2016) Niedźwiecki, A., Zdziarski, A. A., & Szanecki, M. 2016, The Astrophysical Journal Letters, 821, L1
- Novikov & Thorne (1973) Novikov, I. D., & Thorne, K. S. 1973, Black holes (Les astres occlus), 1, 343
- Panizo-Espinar et al. (2022) Panizo-Espinar, G., Padilla, M. A., Muñoz-Darias, T., et al. 2022, arXiv preprint arXiv:2205.09128
- Penna et al. (2013) Penna, R. F., Narayan, R., & Sadowski, A. 2013, Monthly Notices of the Royal Astronomical Society, 436, 3741
- Remillard & McClintock (2006) Remillard, R. A., & McClintock, J. E. 2006, Annu. Rev. Astron. Astrophys., 44, 49
- Reynolds & Nowak (2003) Reynolds, C. S., & Nowak, M. A. 2003, Physics Reports, 377, 389
- Russell et al. (2019) Russell, T., Anderson, G., Miller-Jones, J., et al. 2019, The astronomer’s telegram, 12456, 1
- Sadowski (2016) Sadowski, A. 2016, Monthly Notices of the Royal Astronomical Society, 459, 4397
- Saha et al. (2021) Saha, D., Pal, S., Mandal, M., & Manna, A. 2021, arXiv preprint arXiv:2104.09926
- Sanna et al. (2019) Sanna, A., Uttley, P., Altamirano, D., et al. 2019, The astronomer’s telegram, 12447, 1
- Savonije (1978) Savonije, G. 1978, Astronomy and Astrophysics, vol. 62, no. 3, Jan. 1978, p. 317-338. Research supported by the Nederlandse Organisatie voor Zuiver-Wetenschappelijk Onderzoek and Universiteit van Amsterdam., 62, 317
- Shakura & Sunyaev (1973) Shakura, N. I., & Sunyaev, R. A. 1973, Astronomy and Astrophysics, Vol. 24, p. 337-355, 24, 337
- Sunyaev & Titarchuk (1980) Sunyaev, R., & Titarchuk, L. 1980, Astronomy and Astrophysics, vol. 86, no. 1-2, June 1980, p. 121-138., 86, 121
- Sunyaev & Titarchuk (1985) —. 1985, Astronomy and Astrophysics (ISSN 0004-6361), vol. 143, no. 2, Feb. 1985, p. 374-388., 143, 374
- Tominaga et al. (2020) Tominaga, M., Nakahira, S., Shidatsu, M., et al. 2020, The Astrophysical Journal Letters, 899, L20
- Verner et al. (1996) Verner, D., Ferland, G. J., Korista, K., & Yakovlev, D. 1996, arXiv preprint astro-ph/9601009
- Weng et al. (2021) Weng, S.-S., Cai, Z.-Y., Zhang, S.-N., et al. 2021, The Astrophysical Journal Letters, 915, L15
- Wilms et al. (2000) Wilms, J., Allen, A., & McCray, R. 2000, The Astrophysical Journal, 542, 914
- Wu et al. (2023a) Wu, H., Wang, W., & Sai, N. 2023a, Journal of High Energy Astrophysics, 37, 25
- Wu et al. (2023b) Wu, H., Wang, W., Sai, N., Zhu, H., & Chen, J. 2023b, Monthly Notices of the Royal Astronomical Society, 522, 4323
- Xie & Zdziarski (2019) Xie, F.-G., & Zdziarski, A. A. 2019, The Astrophysical Journal, 887, 167
- Yatabe et al. (2019) Yatabe, F., Negoro, H., Nakajima, M., et al. 2019, The Astronomer’s Telegram, 12425, 1
- Yuan (2001) Yuan, F. 2001, Monthly Notices of the Royal Astronomical Society, 324, 119
- Yuan (2003) —. 2003, The Astrophysical Journal, 594, L99
- Yuan et al. (2002) Yuan, F., Markoff, S., & Falcke, H. 2002, Astronomy & Astrophysics, 383, 854
- Yuan & Narayan (2014) Yuan, F., & Narayan, R. 2014, Annual Review of Astronomy and Astrophysics, 52, 529
- Zdziarski et al. (1996) Zdziarski, A. A., Johnson, W. N., & Magdziarz, P. 1996, Monthly Notices of the Royal Astronomical Society, 283, 193
- Zdziarski et al. (2022) Zdziarski, A. A., You, B., Szanecki, M., Li, X.-B., & Ge, M. 2022, The Astrophysical Journal, 928, 11
- Zhang et al. (2020a) Zhang, L., Altamirano, D., Cúneo, V., et al. 2020a, Monthly Notices of the Royal Astronomical Society, 499, 851
- Zhang et al. (2023) Zhang, L., Méndez, M., García, F., et al. 2023, Monthly Notices of the Royal Astronomical Society, 526, 3944
- Zhang et al. (2020b) Zhang, S.-N., Li, T., Lu, F., et al. 2020b, Science China Physics, Mechanics & Astronomy, 63, 1
- Życki et al. (1999) Życki, P. T., Done, C., & Smith, D. A. 1999, Monthly Notices of the Royal Astronomical Society, 309, 561