Noise-induced cycles in the Togashi-Kaneko model with species-dependent degradation
Abstract
The two-state Togashi-Kaneko model demonstrates how, at finite system sizes, autocatalysis can lead to noise-induced bistability between different molecular species. By allowing the export rates to be species-dependent, we find that the nascent stochastic switching between molecular species is coupled to periods of growth or decay in the system size, , leading to a type of noise-induced cycle. Since there is no oscillatory behavior in the underlying deterministic dynamics, this behavior is distinct from other types of noisy cycle. By combining piecewise-deterministic-Markov and linear-noise approximations, we find analytic expressions for the stationary distributions of the different molecular species when stochastic switching is faster than molecular import or export. We envisage that other models in the voter class— including spin systems, flocking and opinion dynamics— will also exhibit noise-induced cycles, as well as be amenable to similar techniques.
I Introduction
In the last two decades, it has become increasingly evident that proper consideration of intrinsic noise is integral for a complete understanding of many biochemical, ecological, and sociological systems [1, 2, 3, 4, 5, 6]. Of particular interest is the phenomenon of noise-induced bistability, which has been observed in the collective behavior of ants [2] and fish [3], and has been hypothesized to drive consensus in opinion dynamics [7, 4]. In the context of molecular biology, noise-induced bistability was popularized by Togashi and Kaneko (TK), and their eponymous model of autocatalytic chemical reactions in a cell [8, 9].
Noise-induced bistability arises from intrinsic, finite-size fluctuations that are state-dependent, leading to bimodal probability distributions whose extrema do not coincide with the fixed points of the system’s deterministic, dynamics. This gives rise to a stochastic switching between the states localized at either of these extrema, mimicking conventional bistability in systems that have two deterministic fixed points and additive noise. (In one dimension the latter correspondence can be made exact).
In this context, we revisit the TK model and, in particular, species-dependent fluxes. These aim to reflect the biological reality that rates transport, synthesis and /or degradation are, generally speaking, dependent on the specific molecule at hand. Notably, however, whilst the subject of species-dependent influx has been studied [10, 11], the subject of species-dependent degradation and/or removal has remained open.
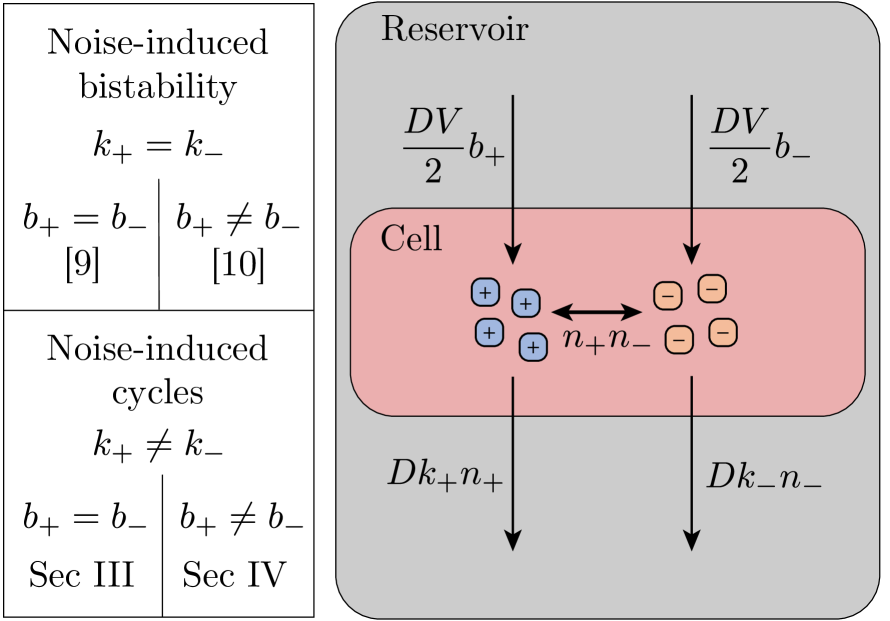
A potential reason for this, we argue, is that such a parameter choice acts to break the mold of most existing models of noise-induced bistability. These models broadly fall into one of three possible scenarios, characterized in terms of the dynamics of the finite system size, . In the first, and simplest, case, the system is closed, so is a constant [2, 3, 4, 12, 13]. In the second case, undergoes trivial, Gaussian fluctuations [9, 10, 11, 8, 14]. Finally, in the third case, increases in time according to some growth protocol [7, 15, 16, 17]. In all three cases, the model setup typically ensures that the dynamics of is independent of the noise-induced switching.
By contrast, taking the degradation rates of the TK model to be species-dependent couples the rate of change of to the relative proportion of each species. As a result, we observe that the usual bistable switching between two metastable points is replaced with two alternating metastable flows of growth and decay in the system size. We refer to the typical path traced out by this novel oscillatory behavior in the dynamic system size as a “noise-induced cycle”. Such emergent oscillations are interesting because there is no oscillatory behavior in the underlying deterministic dynamics. This distinguishes them from other types of stochastic cycle, such as stochastic limit cycles and cycles due to stochastic amplification; the former involves deterministic limit cycles, and the latter deterministic sprials (or damped oscillations) [18, 19].
In this article, we use a Van Kampen expansion of the Master equation to find coupled stochastic differential equations (SDEs) for the total population and relative proportion. We find that, when stochastic switching is faster than molecular import or export, the changing metastable flows in total population can be approximated as a Piecewise Deterministic Markov Process (PDMP) [20], with fast switches in the relative proportion controlling the direction of the metastable flow. Combining this insight with with recent developments in the study of PDMPs for finite populations [20, 21, 22], we are able to solve for the stationary distribution in this fast-switching regime. We then extend our method to the case of both asymmetric degradation and asymmetric influx. In the PDMP limit, the stationary expectation of the relative proportion of each species, , is shown to differ from the deterministic limit, a result not seen in typical noise-induced bistable systems. We find strong agreement with stochastic Gillespie simulations [23] up to a point where the expected value of transitions to the deterministic limit.
II Two species Togashi-Kaneko model
The general Togashi Kaneko model considers a hypothetical cell in which a number of molecular species interact through autocatalytic reactions. Here, we consider the two-species case (TK2) and denote the species by . The autocatalytic reactions can thus be written as . It is assumed that the cell is connected to an infinite bath such that the chemical concentration outside of the cell is constant for each species. Thus we write the rate of influx as where is the scaling parameter associated with molecular transport, sets the total population scale and are species-dependent dimensionless rates. Transport out of the cell is assumed to be concentration dependent with rate where are also species-dependent dimensionless rates and are the molecular counts of in the cell.
It is convenient to express the abundances relative to the characteristic system size, , by introducing the scaled species populations, . Writing as transition rates from to with , we can express the dynamics of each molecular species population in the form of a Master equation:
| (1) |
where the possible transitions are given by
| (2) | ||||
Bistability is generally observed in the TK model when the transport, or diffusion, parameter is small, whilst the volume is taken to be large. Following [9] we choose a joint scaling and perform a Van Kampen expansion in to probe the impact of asymmetric degradation on bistability. Truncating this expansion at second order, we obtain a Fokker Planck equation for the evolution of the species populations which is statistically equivalent to the following Itô SDEs,
| (3) |
where the noise correlation is given by , with
for .

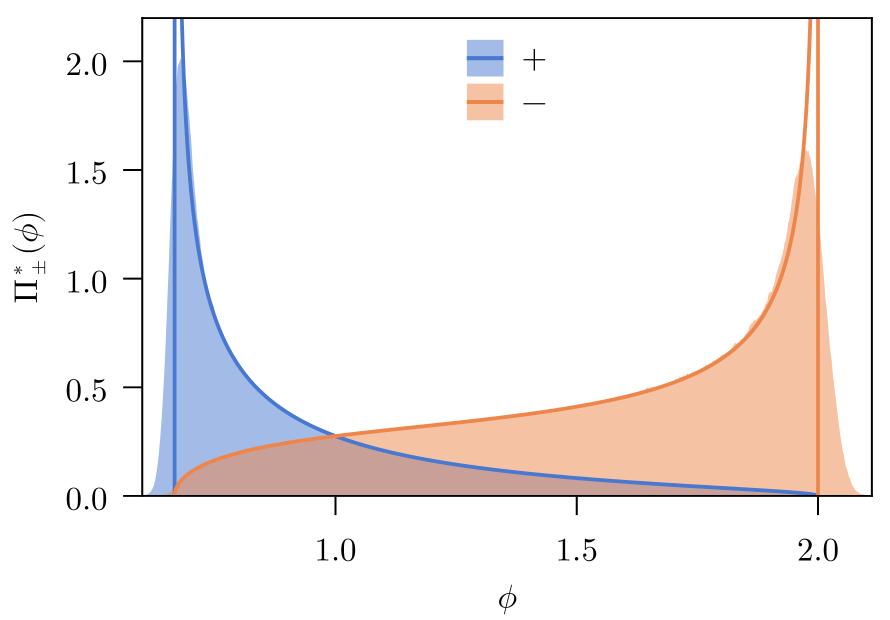
As fig. 1 indicates, the TK model has invariably been examined for symmetric degradation rates . Exact and approximate stationary distributions have been found for symmetric [9] and asymmetric [10] influx rates, where the general behavior of noise-induced bistability for these cases can be seen in fig. 2 (a-c). Here, we choose with , which is the key departure from previous work. In section IV, the combined effects of asymmetry in the influx and degradation rates are examined by writing for . However, until then we focus on the novel asymmetric degradation rates and so set .
To isolate the changes in species dominance from the total population, we transform to the scaled total population (where is the total population) and the complementary relative proportion of the species, . Using Itô’s lemma and after rescaling time to , we obtain the following SDEs
| (4a) | ||||
| (4b) | ||||
where correlation in the white noise terms is given by , with
| (5) | ||||
As we increase the population scale () while keeping the transport rate, , constant, the noise terms become negligible and the SDEs reduce to two coupled ordinary differential equations. The flow fields for the resulting dynamical system are shown in fig. 2 (b,e), with a single stable node at , where
| (6) |
In metastable systems such as the TK model, however, the fixed point is not representative of the behavior as the noise strength increases.
Equations 4a and 4b show how this system is also significantly different from typical noise-induced bistable systems. If , the system can no longer be captured by the single parameter — with trivial fluctuations in — since the drift in eq. 4a carries an explicit dependence on . Because of this, the total population is impacted by the relative proportion of the species. In the next section, we explore the extent to which these two state variables can be separated and understand how bistability in is impacted through coupling to the total population, .
III Identical species influx rates
Stochastic simulations of the system with and small display fast stochastic switches in comparable to the previously studied case. Figure 2 (c) presents an example of such switches but also exhibits dynamic behavior in the total population, , on a slower timescale. These periods of slow growth and decay are clearly coupled to the fast switches in the relative make-up of the molecules. Anticipating a separation of timescales, we wish to understand the instantaneous rate at which these switches occur by considering the transition times for to change from -1 to 1 for a fixed . By taking the limit , this timescale separation becomes apparent, with the switching time reducing to the case considered in [2]. In the next section we detail how the switching time can be approximated in this limit, leading to the following switching rate:
| (7) |
In section III.2, this rate is used with a simplified picture of the relative proportion to understand the behavior of these cycles and the stationary distributions seen in fig. 2(e,f).
III.1 Mean Switching time
In the noise-dominated regime, we propose that the SDE for (4b) can be approximated by
| (8) |
where
| (9) | ||||
At a first glance, the terms in the drift have been neglected in as we assume is large. For the noise term, we must be more careful as neglecting all terms in eq. 5 results in vanishing noise at the boundaries. Only by keeping a small correction term in the noise, , can we keep the switching time finite. It is only at the end that we can consider the behavior as this term becomes vanishingly small.
This small additional term in the noise strength can be shown to vanish as by considering its behavior close to the boundaries. Away from the boundaries, the noise in is dominated by the second term in and so has little impact. As approaches the boundaries, however, the term vanishes. Taking an arbitrary point close to the boundary with and Taylor expanding for large , we compare the full noise strength and the proposed reduced noise strength
Hence, captures the behavior in the noise-dominated case with .
To find the rate at which a switch in the dominant species occurs, we find the expected transition time for the system to leave and reach for a fixed . The inverse of this time, , is the instantaneous rate at which transitions occur. Treating as a reflecting boundary and as an absorbing boundary, [24] gives the expected transition time for a general SDE of the form eq. 8 as
| (10) |
where
| (11) |
Substituting eq. 9 into eq. 11, we find that where
| , |
are the symmetric and asymmetric components, respectively. As , the symmetric component, , remains finite and non-zero for whereas . In this limit, then, we can calculate the switching time from
In summary, for sufficiently small , we need only consider the symmetric components in the switching time. We note that this reduced integral for the switching time is exactly the same form as in [2] which considers a similar noise-induced bistable system. This integral can be solved for any but, remembering that this approximation only holds for small , we take its limiting value
| (12) |
Hence, taking , the rate of switching is given by eq. 7.
III.2 Piece-wise Deterministic Markov Process
Here we use the switching behavior discussed in the previous section to inform our analysis of the dynamics. Fluctuations in either decay rapidly or cause a fast, macroscopic switch in the population proportions. At the coarsest level, then, we can think of the system as being in two states, either all or all with Markovian switches between the two. We can now begin to describe the dynamics of the total population in terms of these approximate states, ignoring any fluctuations besides those in which result in switches. Practically this involves taking for fixed in eq. 4a. We denote the total population at this level as to distinguish it from the finite-volume total population, , and write
| (13) |
where refers to the state of the relative proportion. Because the flow of depends on the Markov process , this is known as a Piecewise Deterministic Markov Process. The probability of observing the system with a total population and in a state , is written as . All probability distributions resulting from a PDMP are denoted in this way, with the dependence on time suppressed for notational convenience. We write the evolution of this probability as a Forward Kolmogorov equation
| (14) | ||||
where, for now, we have left the switching rates between the two states as distinct functions of the population, . The stationary distribution for this PDMP — which we generally denote with an asterisk — is given in [21] as
| (15) |
The normalization constant, , is defined such that the probability of being in either state, , is normalized
| (16) |
A full derivation of the stationary distribution is given in [21] and Appendix A, but it can be verified simply by substituting eq. 15 into eq. 14 at stationarity. We find that it is a solution if
The required form of is thus
| (17) |
Here, we use the symmetric switching rate, , found in section III.1. Substituting this into eq. 17 along with the expressions for the flows eq. 13 we find, after splitting into partial fractions and integrating,
The normalization constant can also be determined analytically, leading to the full solution:
| (18) |
with the marginal distribution for the total population given by
| (19) |
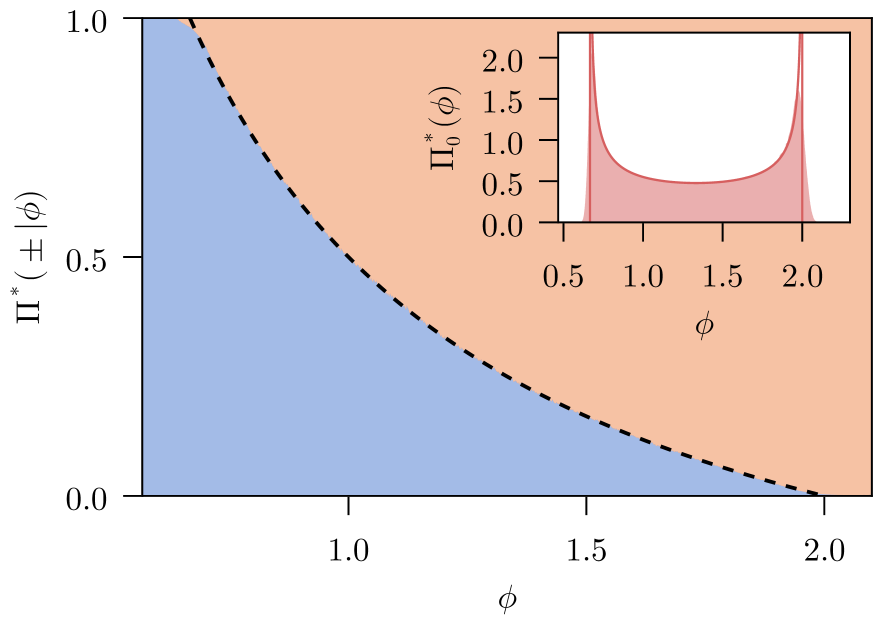
The probability of finding the system in a state given a population, , is independent of the switching rate: . In this case we have
| (20) |
which is shown in fig. 3.
III.3 Finite volume fluctuations
In fig. 3, there are clear deviations from the PDMP solution. These discrepancies are most obvious at the extremities of the stationary distribution, where the total population has a nonzero probability of being outside of the bounds predicted by the PDMP. The cause can be traced back to eq. 13, where we assumed the total population was deterministic outside of the macroscopic changes in composition. In reality, the stochasticity in the exchange of molecules between the cell and reservoir causes the total population to fluctuate, and is the cause of the macroscopic switches, as has been accounted for in [4, 9]. In other words, we imposed the limit when in reality the effect of finite population sizes is significant. To account for this, we still consider the system to be in one of the dominant states, but we now readmit the fluctuations in eq. 4a. As decreases (while keeping fixed), the fluctuations about the deterministic flow used in eq. 13 become more significant. We write , and employ a linear noise approximation (LNA) about eq. 4a as has been done for the study of other systems with intrinsic noise subject to fluctuating environments [21]. To zeroth order in , we recover the deterministic flow (13) but at the level we find
| (21) |
where and . While this may at first seem like a simple Ornstein-Ulhenbeck process [24], we must consider the Markov switching in the state dependent flow and diffusion terms. To do so formally would require solving the Fokker Planck equation for the joint distribution of the state, the resulting flow and the fluctuation . Dropping the dependence on the fluctuation and flows for notational simplicity, the Fokker Plank equation is
| (22) | ||||
However, we assume that , which is true for fluctuations attributed to influx events, as these occur at a constant rate. This is strictly not the case for degradation events, on the other hand, since these occur at state-dependent rates and would only hold if , but this source of error is not significant for small . Practically, this enables us to separate considerations of the fluctuations from the macroscopic state switches by writing . Substituting this assumption into eq. 22 at stationarity gives
Summing over the two states and substituting eq. 20 — and noticing that ensures the terms cancel — we have
This ordinary differential equation can be solved directly, with as boundary conditions. Alternatively, we recognize that this is equivalent to the stationary Fokker Planck equation for an Ornstein-Ulhenbeck process and thus the solution is a zero-mean Gaussian distribution with variance given by
Upon substitution for the flow and noise strength, the variance reduces to . The total population can be constructed as the probability of the system being in a state , which can be calculated by evaluating
This can be found by numerically integrating
| (23) |
IV Asymmetric influx rates
The case of , has been studied in [10] but for symmetric . With the theory discussed above, we can now elucidate the fully asymmetric case by allowing both and . Since the influx rates are constant, the drift in the SDE (4a) for is unchanged. The drift for in (8) is now
and the effect on the noise structure is all on the scale of and so we leave unchanged. However, this minor change still renders the transition time analytically intractable. To circumvent this problem, we propose a heuristic argument for how the switching rate is altered by this asymmetry. For models with a fixed system size , exact transition times can be calculated directly from the discrete transition to , described by the Master Equation [12, 14]. In this context, when the equivalent limit is taken, the leading order term found for the transition time arises from the inverse of the expected residence time in the () state. The higher order terms relate to the time to transition from the to states as well as corrections to the residence time in due to additional and infrequent spontaneous reactions. Returning to the general TK2 model, to leading order in , the switching time for the transition is proportional to the residence time in the state. Since the residence time is inversely proportional to the rate at which the system leaves — and the only way the system leaves such a state is from an influx of — it follows that the switching time is proportional to . Hence, we propose that the instantaneous rates for leaving the states are
Following the the same procedure as section III.2 (see appendix A), the stationary state of the PDMP can be determined. After substituting the expressions for and into eq. 17 we find,
| (24) |
which leads to the following closed form solution for the PDMP steady state distribution,
| (25) |
In this case, the normalization constant is given explicitly by
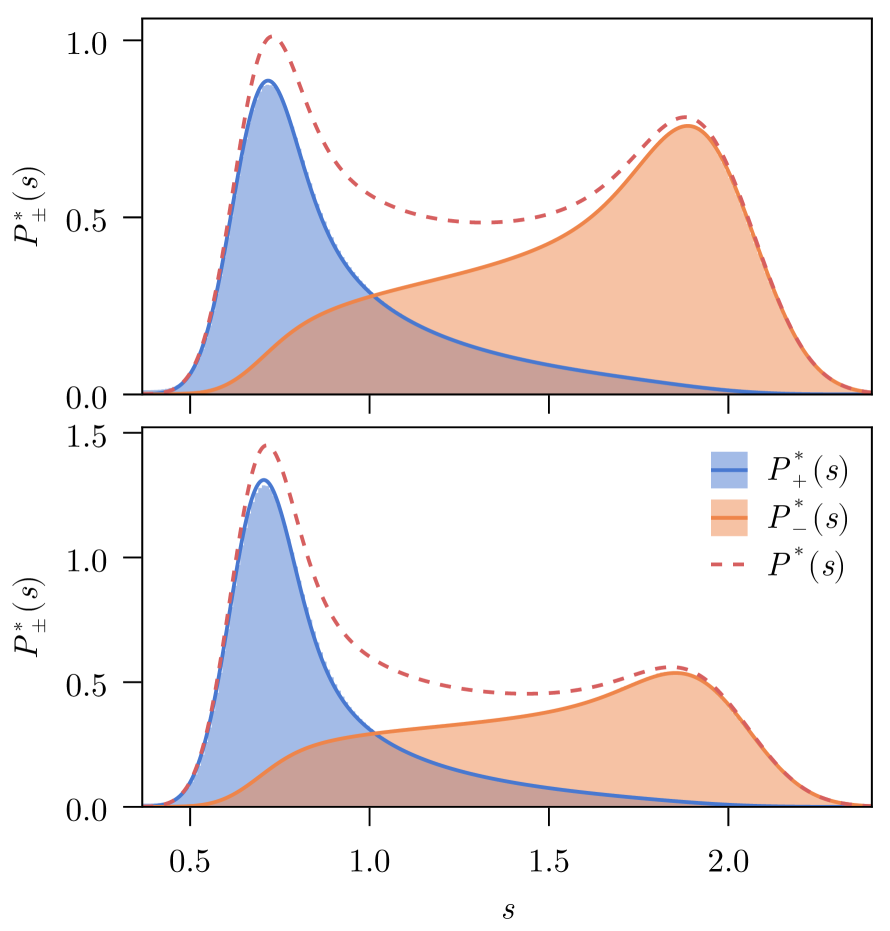
with a full derivation given in appendix B. As fig. 4 shows, when the LNA approximation is combined with this more general PDMP solution, we can still observe bistable distributions in .
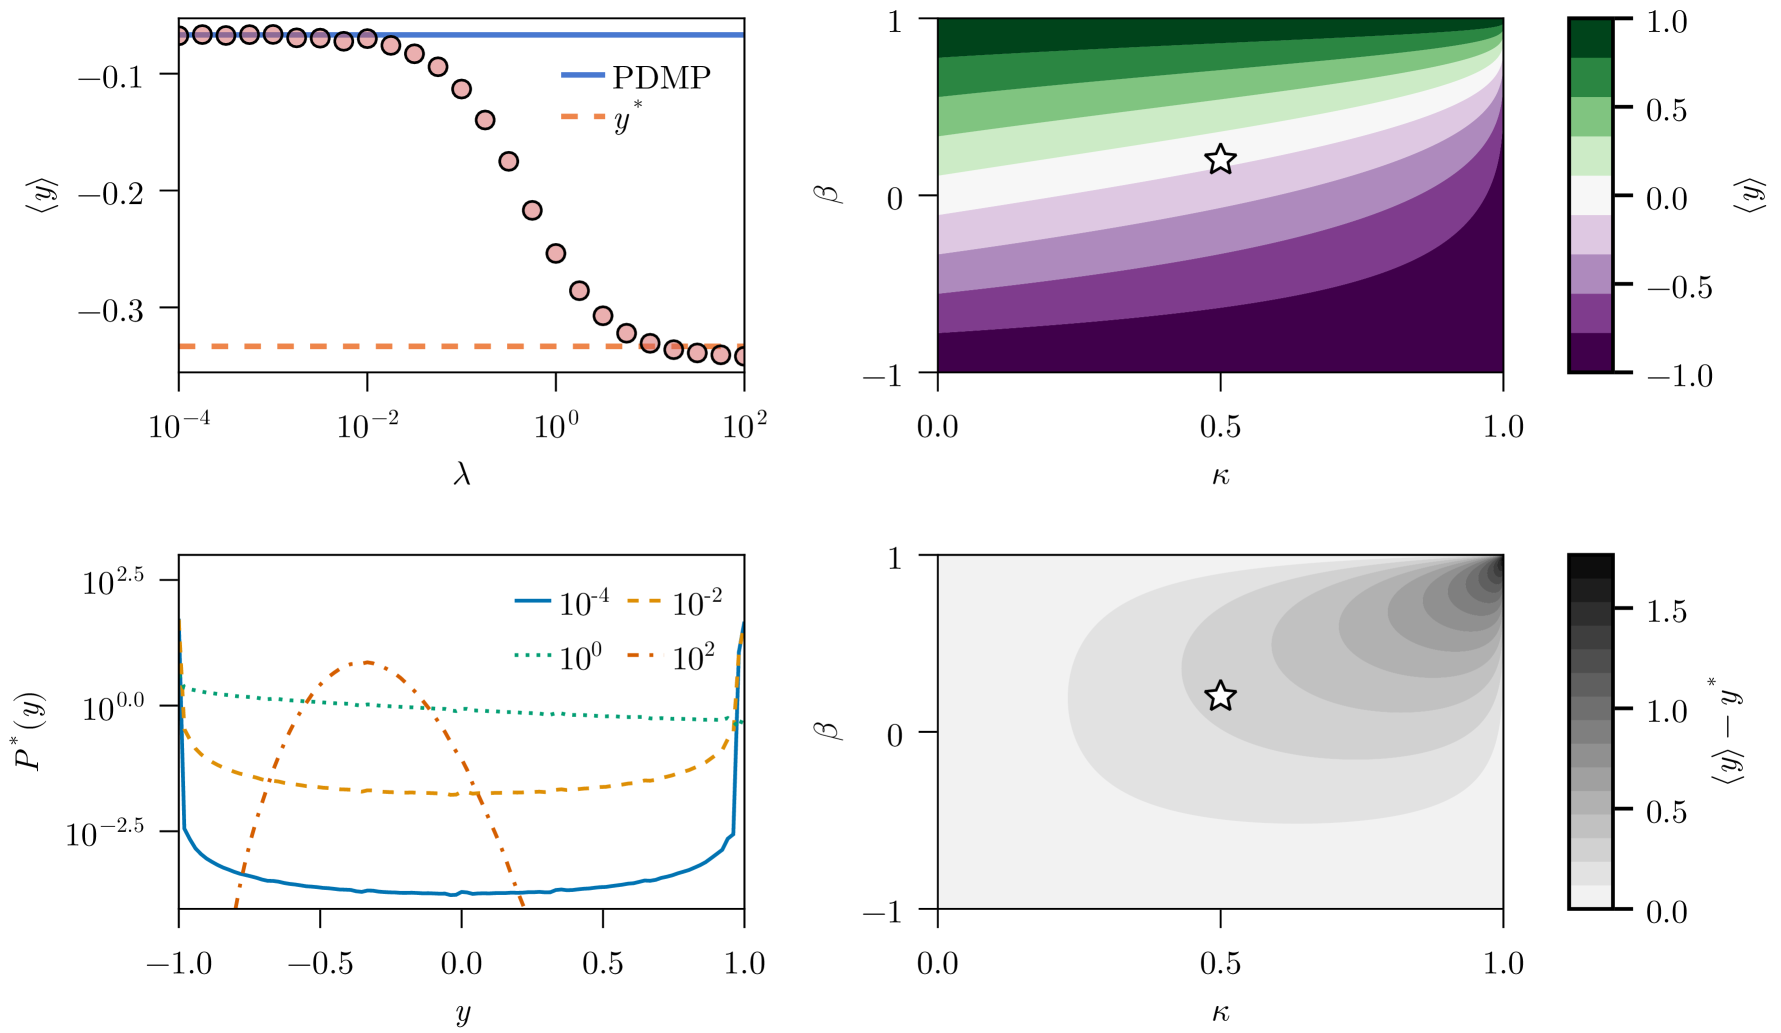
IV.1 Effect of Noise-induced cycles on average population and relative proportion
The TK2 system displays drastically different stationary distributions depending on the value of , as both and can display bistability when is sufficiently small but both distributions are Gaussian when becomes very large. In this section, we quantify the changes in the expectation values as changes, which enables us to find the transition region between the noise-induced and deterministic limits.
Initially, we consider the stationary expectation of the total population, . We define and carry out the integration in a similar manner to finding the normalization constant eq. 32 (see appendix C). We find that
matching the deterministic limit (6). We also note that the LNA approximation does not alter this expectation, since the convolution with the Gaussian fluctuations in eq. 23 does not impact the mean and so .
The relative proportion, on the other hand, does not stay constant with changing . In terms of the PDMP approximation, the relative proportion is assumed to be in one of two states, , and so its expectation is given by where
| (26) |
Again, this can be calculated analytically (see appendix C) to give
The difference of these two probabilities is thus
| (27) |
It is clear that, in general, with eq. 27 and the difference from shown in fig. 5. This difference becomes particularly stark for , as the deterministic limit predicts a positive value but the PDMP limit shows that the system is at for significant proportion of the time. For , however, the noise-induced cycles reduce to noise-induced bistability since the behavior in decouples from . Without the deterministic flow in eq. 14, the forward Kolmogorov equation becomes a simple telegraph process with the probability of being in either state given by
The expected relative proportion in this case is just , which is the same as the setting in the deterministic limit eq. 6.
In general, whilst the total population is controlled as varies, the average relative proportion transitions from the deterministic limit to the noise-induced limit, as can be seen from the simulations depicted in fig. 5. This demonstrates the ranges for which this system can be characterized, with an intermediate range of that is neither predominantly noise-driven nor deterministically driven with trivial fluctuations. In this region, we observe relatively flat distributions in the relative proportion (see fig. 5), similar to the exactly flat distribution found in the symmetric TK model [9].
V Discussion
By taking the degradation rates of in the TK2 model to be species-dependent, we have extended its applicability to more biologically relevant scenarios. In doing so, we revealed the existence of noise-induced cycles, which we contrasted with the typical noise-induced metastability observed in systems with fixed, fluctuating, or trivially growing population size. In our analysis, we exploited a separation of timescales, captured by the limit , to arrive at a simple expression for the instantaneous rate of switching. We note, however, that this provides a useful approximation up to , with the stationary distribution calculated from the PDMP and LNA convolution matching simulations with good accuracy. At or above this point, the marginal probability distribution of becomes too diffuse to consider the system in one of two macrostates. A more complete understanding of the weakly bistable regime would be of interest but presents a great deal of mathematical complexity.
Notably, the type of stochastic oscillation that we observe is seemingly novel. All other types of noisy oscillation, including stochastic limit cycles and stochastic amplification, involve oscillations (either persistent, or damped) in the underlying deterministic dynamics. We speculate that, although developed in the context of TK’s model of an idealized cell, such a mechanism— by which autocatalysis coupled with species-dependent degradation and/or removal drives oscillations— may be potentially relevant for the behavior of organelles in the endomembrane system, including but not limited to the lysosome.
In terms of our precise approach, whilst examples of noise-induced multi-stability in biological settings have been attributed stochastic gene expression [25, 26, 27, 28] as well as second order mass-action degradation [6], PDMPs have been only been employed effectively to model the former [20, 29, 22]. As far as the authors of this article are aware, until now they have not been used to describe switches from intrinsic autocatalytic reactions.
Moreover, since the original mathematical treatment of the TK model has been applied to various other systems that display noise-induced metastability [2, 4, 13, 3], we anticipate that this work may provide a similar launching point for the modification and subsequent analysis of a variety of models— typically referred-to as the voter class— from the fields of opinion dynamics and collective behavior. Indeed, as our methodology is not limited to studying variable population sizes, and any system that contains secondary state variables which depend on the noise-induced metastable variable could be subjected to the same analysis presented here. We therefore welcome further work in the area.
Declarations
The authors have no competing interests to declare.
Acknowledgements.
JRW and RGM acknowledge funding from the EMBL Australia program. RGM acknowledges funding from the Australian Research Council Centre of Excellence for Mathematical Analysis of Cellular Systems (CE230100001).Appendix A PDMP Stationary distribution derivation
Here we derive the stationary distribution to the Forward Kolmogorov equation given in (14) for the PDMP. A similar derivation of this can be found in [21] and an alternative, more rigorous analysis is given in [20]. First, we assume each flow has a fixed point , and for convenience choose and that . From this, we find zero-current boundary conditions:
| (28) |
Now, taking eq. 14 at stationarity and summing over the two states we have
Hence, integrating from the left boundary and using (28), this gives
and thus
| (29) |
Next, we substitute this into the state of eq. 14 at stationarity,
The solution to this ordinary differential equation becomes clearer by writing
where we have introduced
| (30) |
and is a normalization constant whose significance and exact form will become clear subsequently. This can be solved by separation of variables which gives us
| (31) |
Hence, the stationary distribution for either state can be summarized by combining eq. 30 and (29) to give
Since the stationary distribution is a probability density, we require it to be normalized over both and the states , which means that
and so
| (32) |
Appendix B Normalization constant for the PDMP
Substituting the explicit form of from eq. 24, into eq. 32, we have that
| (33) |
where . To solve this integral, we first transform to the unit interval by introducing
| (34) |
Rearranging for , we have
Substituting these into eq. 33 and after some simplification, we have
Upon further rearrangement, it can be shown that the normalization constant is given by
| (35) |
where the integral,
| (36) |
remains to be solved for . We compare this to the integral form for Euler’s Beta function which, in terms of the Gamma function, is
| (37) |
where we identify , , and . We also use the identity along with standard trigonometric rules to obtain
Hence, substituting this back into eq. 35, the closed form expression for the normalization constant is
Appendix C Mean of the PDMP stationary distribution
Here we show that the mean population size calculated from the stationary PDMP solution matches the expectation of the van Kampen expansion SDEs (4a). We consider the two contributions to the mean of , from the two macrostates by writing where
It is important to notice that the contributions themselves are not a measurement of the mean of each state since the integral is implicitly dependent on the probability of being in such a state: . Performing the same transformation as in Appendix B using eq. 34, we find that
where we have introduced
Substituting the expression for the normalization constant (35) and simplifying, the contributions to the mean are
| (38) |
Similarly to Appendix B, we compare to eq. 37 in for both states . For , we identify and for we have . As a result, we obtain
where we have used that . Substituting this result into eq. 38 we have
The overall mean, is thus the sum of these two contributions
Appendix D Mean relative proportion
To find the average value of of the relative proportion, , from the PDMP approximation, we first calculate the probability of being in the + state at stationarity, , defined in eq. 26. The expectation is then given by . Using the PDMP solution (25) and using the same substitution (34), we have
| (39) |
where
This integral is also in the form of Euler’s integral formula for the Beta function, but in this case we have
where is the hypergeometric function. Substituting this, along with eq. 35, into eq. 39, the expression for the probability reduces to
This can be written explicitly by recognizing that
Hence, we arrive at
from which the relative proportion is readily obtained:
References
- Horsthemke and Lefever [2006] W. Horsthemke and R. Lefever, Noise-Induced Transitions: Theory and Applications in Physics, Chemistry, and Biology, Springer Series in Synergetics (Springer Berlin Heidelberg, 2006).
- Biancalani et al. [2014] T. Biancalani, L. Dyson, and A. J. McKane, Physical Review Letters 112, 038101 (2014).
- Jhawar et al. [2020] J. Jhawar, R. G. Morris, U. R. Amith-Kumar, M. Danny Raj, T. Rogers, H. Rajendran, and V. Guttal, Nature Physics 16, 488 (2020).
- Herrerías-Azcué and Galla [2019] F. Herrerías-Azcué and T. Galla, Physical Review E 100, 022304 (2019).
- Constable et al. [2016] G. W. A. Constable, T. Rogers, A. J. McKane, and C. E. Tarnita, Proceedings of the National Academy of Sciences of the United States of America 113, E4745 (2016).
- Sardanyés et al. [2018] J. Sardanyés, A. Arderiu, S. F. Elena, and T. Alarcón, Journal of The Royal Society Interface 15, 20180129 (2018).
- Morris and Rogers [2014] R. G. Morris and T. Rogers, Journal of Physics A: Mathematical and Theoretical 47, 342003 (2014).
- Togashi and Kaneko [2001] Y. Togashi and K. Kaneko, Physical Review Letters 86, 2459 (2001).
- Biancalani et al. [2012] T. Biancalani, T. Rogers, and A. J. McKane, Physical Review E 86, 010106 (2012).
- Bibbona et al. [2020] E. Bibbona, J. Kim, and C. Wiuf, Journal of The Royal Society Interface 17, 20200243 (2020).
- Gallinger and Popovic [2024] C. Gallinger and L. Popovic, Royal Society Open Science 11, 231878 (2024).
- Houchmandzadeh and Vallade [2015] B. Houchmandzadeh and M. Vallade, Physical Review E 91, 022115 (2015).
- Jafarpour et al. [2015] F. Jafarpour, T. Biancalani, and N. Goldenfeld, Physical Review Letters 115, 158101 (2015).
- Saito and Kaneko [2015] N. Saito and K. Kaneko, Physical Review E 91, 022707 (2015).
- Cremer et al. [2011] J. Cremer, A. Melbinger, and E. Frey, Physical Review E 84, 051921 (2011).
- Crosato et al. [2023] E. Crosato, J. N. Philippson, S. Thutupalli, and R. G. Morris, Physical Review Research 5, 013093 (2023).
- Melbinger et al. [2010] A. Melbinger, J. Cremer, and E. Frey, Physical Review Letters 105, 178101 (2010).
- Butler and Goldenfeld [2011] T. Butler and N. Goldenfeld, Physical Review E 84, 011112 (2011).
- Biancalani et al. [2010] T. Biancalani, D. Fanelli, and F. Di Patti, Physical Review E 81, 046215 (2010).
- Faggionato et al. [2009] A. Faggionato, D. Gabrielli, and M. Ribezzi Crivellari, Journal of Statistical Physics 137, 259 (2009).
- Hufton et al. [2016] P. G. Hufton, Y. T. Lin, T. Galla, and A. J. McKane, Physical Review E 93, 052119 (2016).
- Hufton et al. [2019] P. G. Hufton, Y. T. Lin, and T. Galla, Physical Review. E 99, 032122 (2019).
- Gillespie [1977] D. T. Gillespie, The Journal of Physical Chemistry 81, 2340 (1977).
- Gardiner [1985] C. W. Gardiner (Springer Berlin Heidelberg, Berlin, Heidelberg, 1985).
- Gander et al. [2007] M. J. Gander, C. Mazza, and H. Rummler, Journal of Mathematical Biology 55, 249 (2007).
- Raj and van Oudenaarden [2008] A. Raj and A. van Oudenaarden, Cell 135, 216 (2008).
- Visco et al. [2010] P. Visco, R. J. Allen, S. N. Majumdar, and M. R. Evans, Biophysical Journal 98, 1099 (2010).
- Dubnau and Losick [2006] D. Dubnau and R. Losick, Molecular Microbiology 61, 564 (2006).
- Zeiser et al. [2010] S. Zeiser, U. Franz, and V. Liebscher, Journal of Mathematical Biology 60, 207 (2010).