Glassy Behavior and Anomalous Transport in Chimney Ladder Crystals
Induced by Soft Optical Phonons
Abstract
Nowotny chimney ladder (NCL) crystals present physical properties in between the contrasting paradigms of ideal crystal and amorphous solid, making them promising candidates for thermoelectric applications due to their inherently low thermal conductivity. Here, we report an extensive experimental characterization of the thermodynamic and thermoelectric transport properties of a large class of NCL materials, focusing on the intermetallic compound Ru2Sn3-δ. We show that the heat capacity of these NCL compounds exhibits a boson-peak-like glassy anomaly between K and K. By combining experimental measurements with density functional theory (DFT), we attribute its microscopic origin to extremely soft optical phonons that universally appear as a consequence of the chimney ladder sublattice structure. Additionally, the measured thermal conductivity and the thermoelectric response present distinct anomalous glass-like features that strongly correlate with the dynamics of the abundant soft optical phonons revealed by DFT. Our work demonstrates that soft modes in ordered crystals can induce glassy behavior, outlining a pathway to design metallic materials with low thermal conductivity and unique thermoelectric properties without the need for disorder or strong electronic correlations.
Introduction – The theoretical description of vibrational, thermodynamic, and transport properties in solids has traditionally been structured around two extremes: the idealized ordered crystal and its opposite, the fully disordered amorphous solid. While the former is successfully rationalized by well-established paradigms such as Debye theory and Fermi liquid theory Kittel and McEuen (2018), the latter is known to present characteristic glassy anomalies that are usually ascribed to the underlying structural disorder Ramos (2022).
Complex crystals present an intricate interplay of order and disorder at different length scales that might lead to the coexistence of crystal-like and glass-like features. In fact, since the first observation in 1981 Ackerman et al. (1981), there are now many known examples of crystals with minimal or even absent structural disorder that display glass-like features, such as a boson-peak-like anomaly in the heat capacity normalized by Debye law, , or a low-thermal conductivity with a robust plateau in the same temperature range. Examples of crystalline systems exhibiting glassy anomalies can be found in ferroelectric materials Hegenbarth (1995); Ishii et al. (2019, 2021), superionic conductors Kobayashi et al. (1996), incommensurate crystals Etrillard et al. (1996); Reményi et al. (2015); Cano and Levanyuk (2004a, b), thermoelectrics Takasu et al. (2008); Avila et al. (2006); Takabatake et al. (2014); Qiu et al. (2014); Akhbarifar et al. (2020); Bux et al. (2014); Liu et al. (2021); Avila et al. (2008); Bhattacharya (2019); Chazallon et al. (2002); Christensen et al. (2008); Delaire et al. (2011); Lanigan-Atkins et al. (2020); Li et al. (2015); Tse et al. (2005); Ma et al. (2013), and more Ren et al. (2021); Moratalla et al. (2019); Wu et al. (2024); Krivchikov et al. (2006); Ramos et al. (1997); Talón et al. (1998, 2002); Vdovichenko et al. (2015); Vispa et al. (2017); Romanini et al. (2012); Jeżowski et al. (2018); Szewczyk et al. (2024).
The appearance of these anomalies in crystalline systems indicates that structural disorder is a sufficient but not necessary ingredient for the emergence of glassy physics and calls for alternative explanations that do not rely on it. The most promising proposal to explain the microscopic origin of glassiness in complex crystals invokes the presence of exceptionally soft and abundant optical modes Cano and Levanyuk (2004a, b); Moratalla et al. (2019); Krivchikov et al. (2022); Baggioli and Zaccone (2021); Schliesser and Woodfield (2015); Baggioli and Zaccone (2019). From a macroscopic perspective, but certainly not at the microscopic level, this scenario bears strong similarities with the idea of the flat boson peak mode discussed and experimentally observed in amorphous solids Hu and Tanaka (2022, 2023); Tømterud et al. (2023); Jiang et al. (2024); Jiang and Baggioli (2024).
Despite some preliminary positive tests of the soft optical phonon hypothesis, a convincing proof is still missing and its universality has still to be verified. Moreover, since only a few of the so far explored compounds are metallic, the impact of these glass-like soft modes on thermoelectric transport properties and the interplay between glassiness and electronic transport in these complex crystals has not been investigated yet, rendering impossible a comparison to the anomalous thermoelectric properties reported in metallic glasses Howson and Gallagher (1988); Pryadun et al. (2015); Kuo et al. (2006).
In this work, we examine a large set of materials from the Nowotny chimney ladder (NCL) family Schwomma et al. (1963); Lu et al. (2002), intermetallic complex crystals with weakly coupled helical sublattices, with particular focus on the case of Ru2Sn3-δ. The intricate NCL structure can generate exotic ground states ranging from chiral ferromagnetism Han et al. (2016) to one-dimensional topological surface states Gibson et al. (2014), and a very rich and complex vibrational spectrum. Moreover, extremely low and glassy thermal conductivity has been reported in some of these materials Kawasoko et al. (2014); Chen et al. (2015) and associated with the existence of anomalously soft optical modes arising from the sliding of the helical sublattices and the large -axis Chen et al. (2015).
In summary, NCL materials are ideal candidates for exploring emergent glassy behavior within complex crystal structures, with the added potential to extend this analysis to thermoelectric transport properties due to their metallic nature. This work aims to determine whether these complex crystals display glassy thermodynamic and transport properties, and, if so, to uncover the microscopic origin of this behavior.
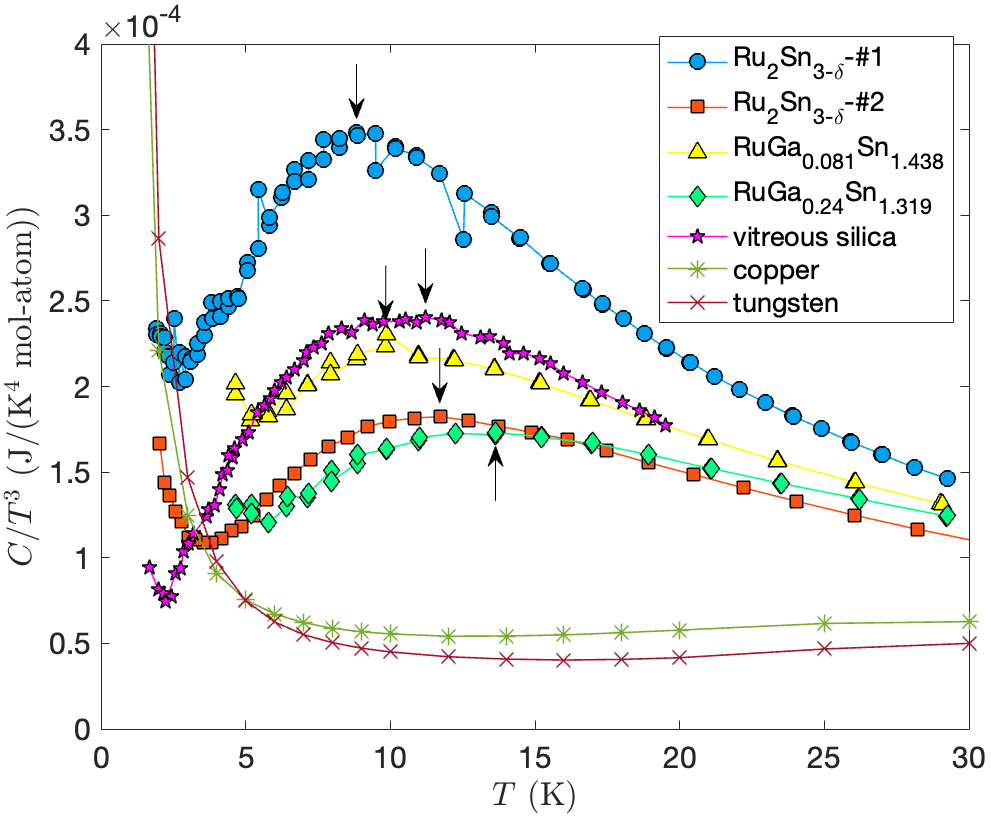
Glassy heat capacity and its origin – In Fig. 1, we report the experimental results for the heat capacity of Ru2Sn3-δ and other NCL materials divided by . More details on the synthesis and characterization of the materials can be found in the Supplementary Material (SM).
First, all the NCL materials exhibit an upturn of at low temperatures, which is due to the Sommerfeld electronic contribution Kittel and McEuen (2018). We notice that the upturn in the experimental data for vitreous silica (SiO2) is not of the same nature, since this glass is a good insulator, but rather a manifestation of two-level states typical of amorphous solids Ramos (2022). More importantly, all the compounds reveal a clear excess peak over the Debye law (), strongly resembling the boson peak anomalies seen in amorphous compounds Ramos (2022). The location of this peak varies with the chemical composition of the compound in a range between K and K, and it is compatible with that of SiO2, a prototypical amorphous solid (displayed for comparison in Fig. 1). In contrast, ideal crystalline metals, such as copper and tungsten (displayed for comparison in Fig. 1), show perfect agreement with Debye’s law in the same temperature range. Finally, in the SM, we show that by normalizing the data to the intensity and the position of the peak, all the data exhibiting a peak collapse onto a universal curve that shows significant deviations only at large temperatures, suggesting the universal character of this boson-peak-like feature.
X-ray diffraction analysis (see SM) confirms that our samples are fully crystalline and there is trace of anti-site disordering. As a direct consequence, the glass-like excess in the heat capacity cannot be attributed to the presence of structural disorder as assumed in the typical theoretical frameworks for glasses Ramos (2022) (e.g., soft potential model or heterogeneous elasticity theory).
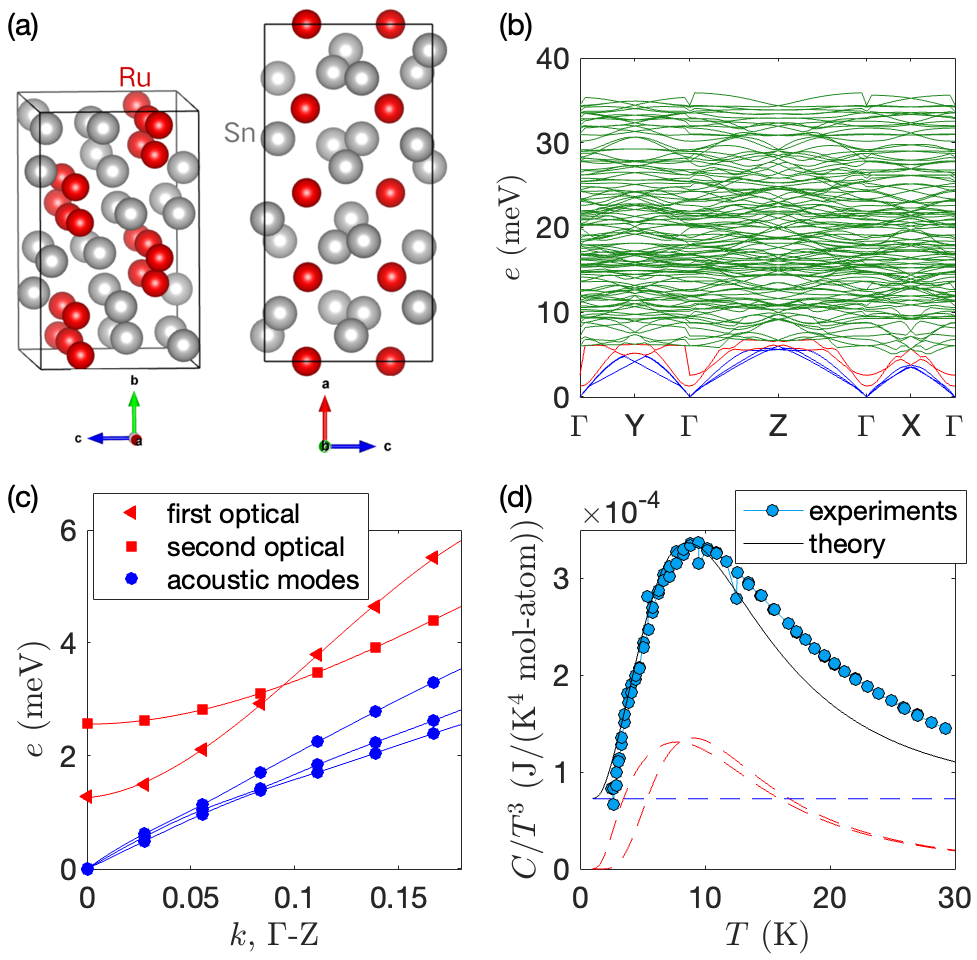
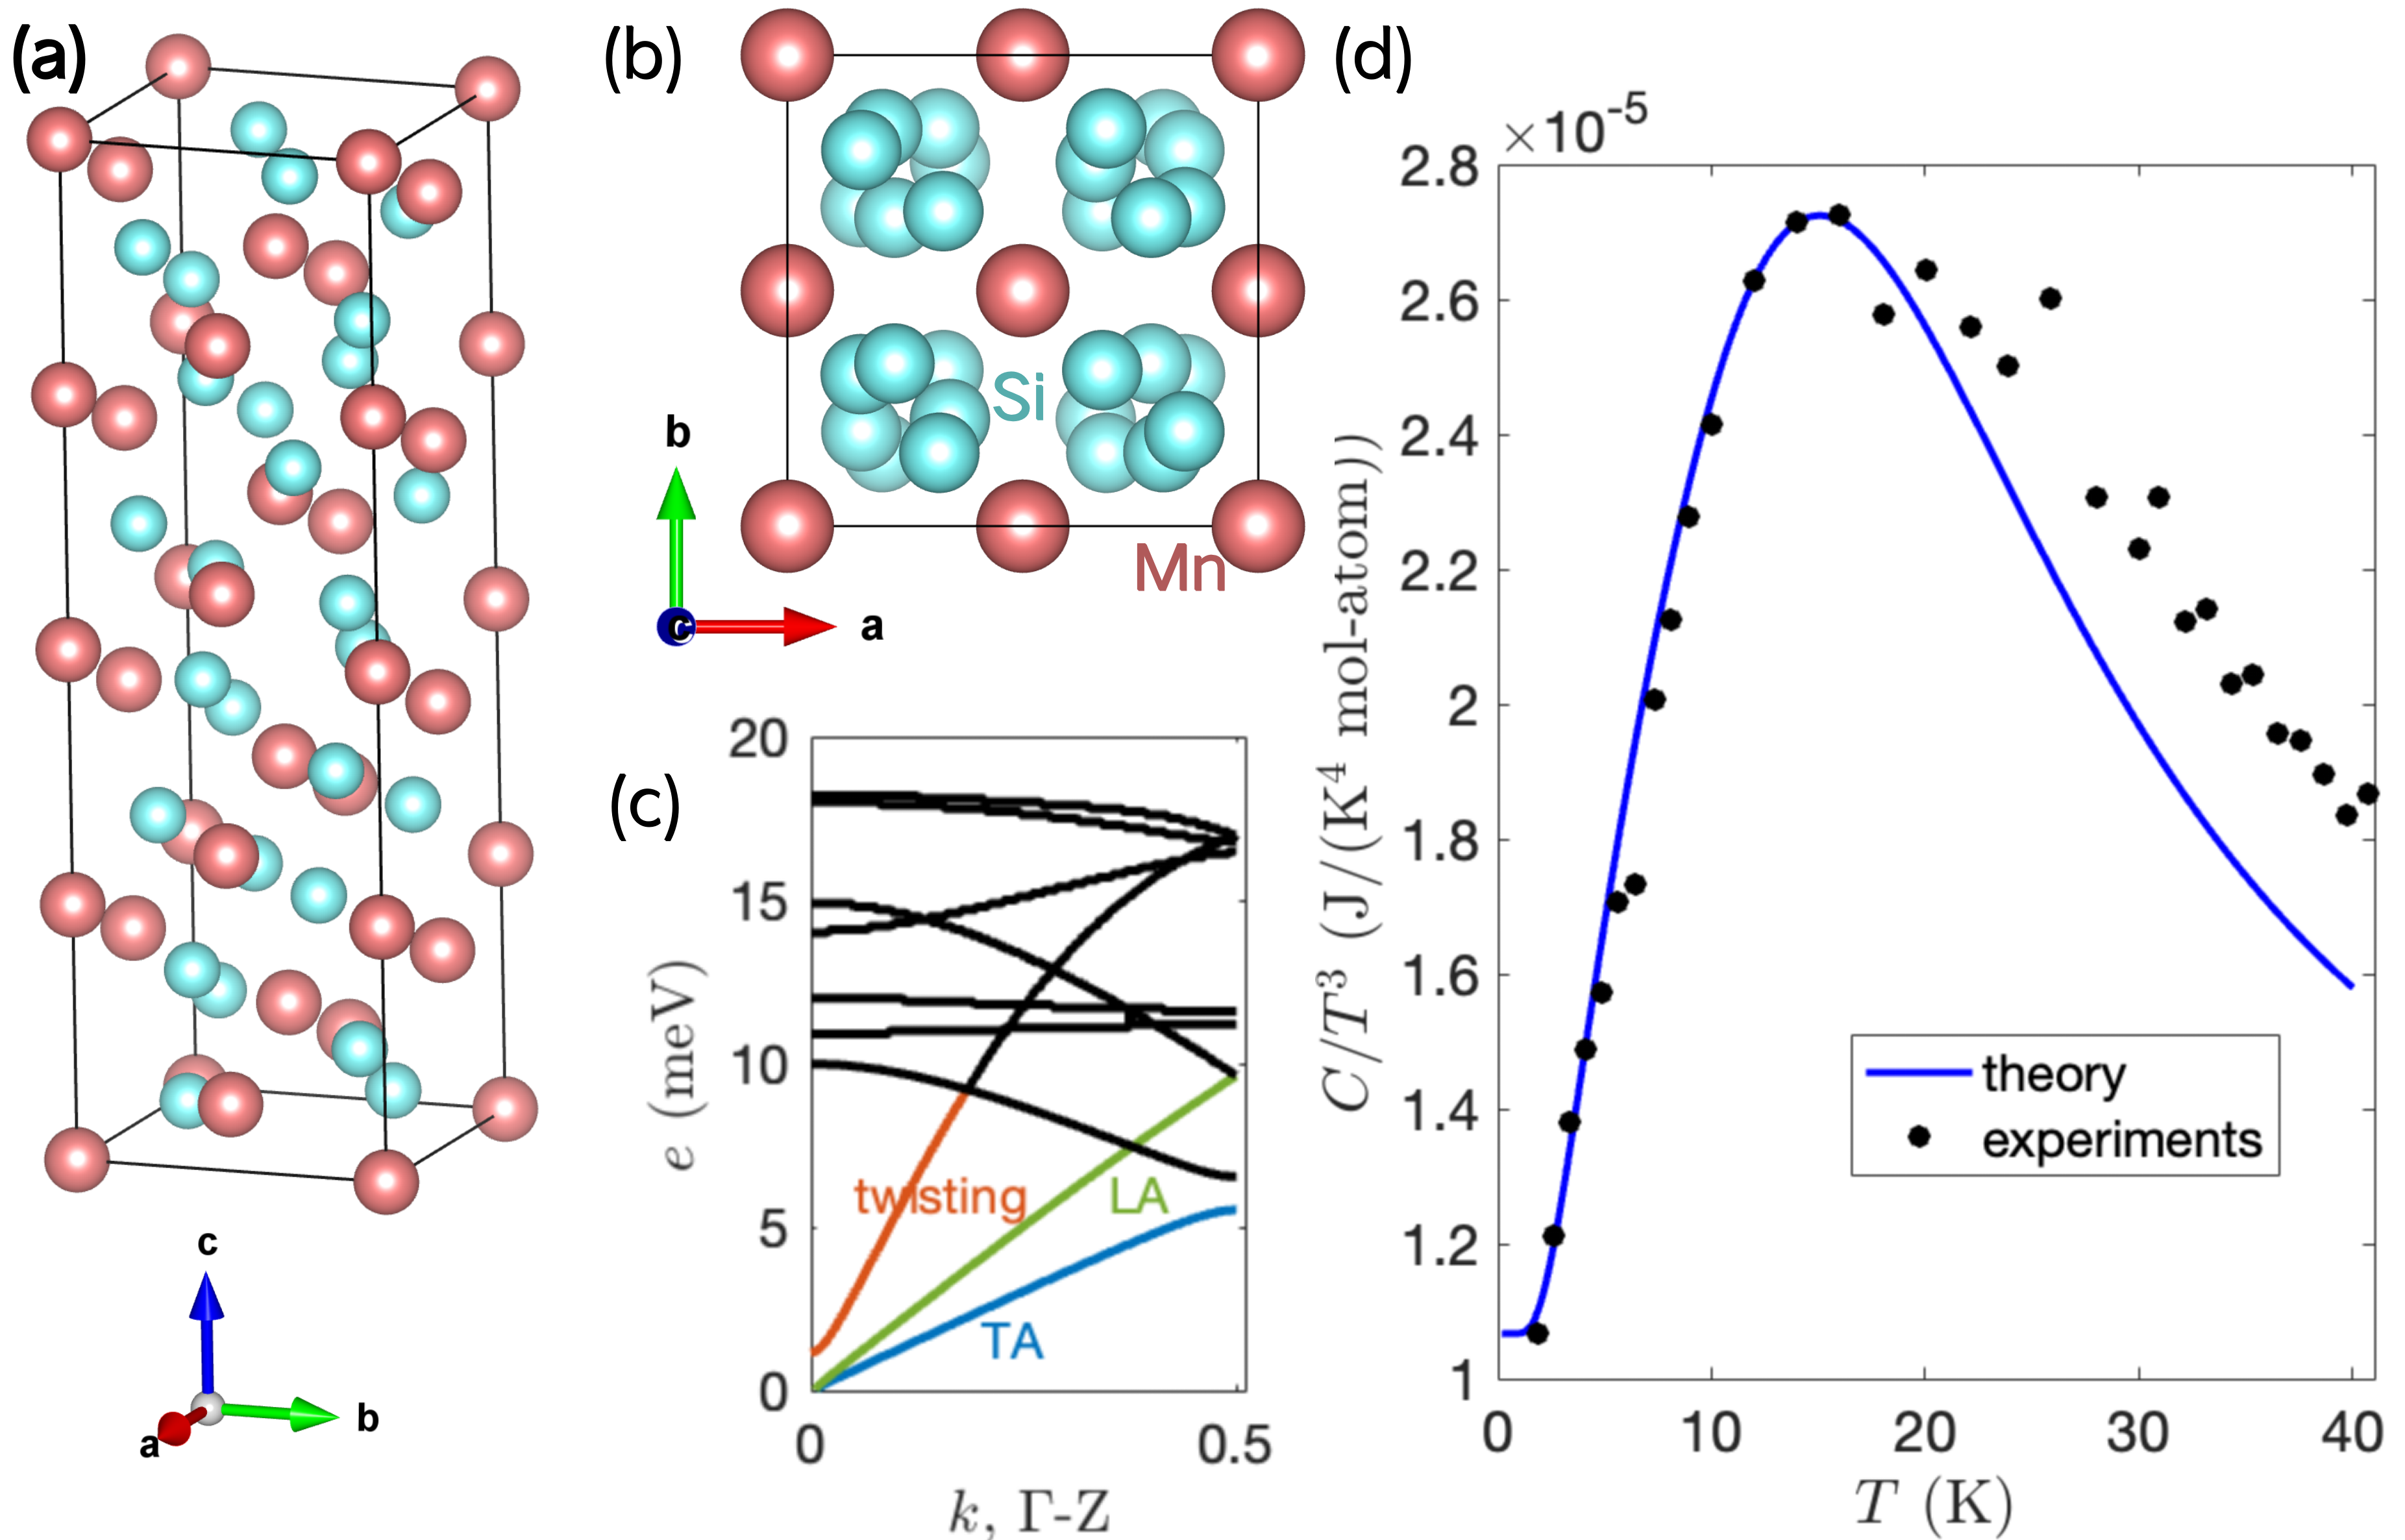
To gain better insight on the microscopic origin of the boson-peak-like anomaly in NCL materials, we resort to density functional theory (DFT), and we focus on two benchmark cases: Ru2Sn3-δ (in the main text) and Mn4Si7 (in the End Matter). In panel (a) of Fig. 2, we provide a schematic illustration of the crystalline structure of Ru2Sn3-δ that makes the chimney ladder sublattice structure along the -axis evident. Panel (b) in the same figure shows the vibrational spectrum from DFT simulations. In blue color, we observe the dispersion of the acoustic modes.
In red color, we emphasize the presence of two exceptionally soft optical modes whose energy is comparable to that of the acoustic modes. These branches were analyzed using animation software to understand the associated vibration patterns (see details in SM). The first branch corresponds to a canting of Sn atoms within a relatively static Ru host and presents a pattern characterized by an oscillation between the atomic positions of the low-temperature orthorhombic phase and those of the high-temperature tetragonal phase Poutcharovsky et al. (1975). This soft mode is related to a structural phase transition that appears at higher temperatures (- K depending on composition) and is highly dispersive, with an associated group velocity larger than that of the acoustic modes (see panel (c) of Fig. 2 for a zoom). The second low-energy optical branch corresponds to the Sn helix corkscrewing through the Ru lattice, while the Ru lattice slides rigidly in the opposite direction. This mode aligns with the previously observed ‘twisting’ mode in Mn4Si7 Chen et al. (2015). More details on the nature of the soft modes are presented in SM.
Panel (c) of Fig. 2 presents a zoom on the dispersion relation of the two soft optical phonons along the - direction, giving an estimate for their energy at the point of 1.26, 2.56 meV. We notice that among all the NCL materials considered, only Ru2Sn3-δ displays two anomalously soft optical modes since other compounds do not present any high-temperature structural phase transition.
Finally, in panel (b) of Fig. 2 (green color), we observe a large number of quasi-localized dispersionless optical modes with energy in between and meV that emerge because of the complex structure of Ru2Sn3-δ and its large unit cell.
We theoretically model the heat capacity within the harmonic approximation,
| (1) |
where is the vibrational density of states. By neglecting the effects of damping, the density of states can be written as , where is the dispersion relation of the -th mode as a function of the wavevector . For simplicity, we retain only the acoustic modes and the two anomalously soft optical branches and we assume isotropy. The dispersion of all these modes is taken from DFT and shown in detail in panel (c) of Fig. 2. In panel (d) of Fig. 2, we present the comparison between the theoretical prediction and the experimental data after subtracting the electronic contribution with mJ/K2 mol-atom. The Debye contribution is derived by using where , with the propagation speed of the acoustic branches (blue data in panel (c) of Fig. 2) and m/s. The Debye level resulting from this computation is shown with a blue dashed line in panel (d) of Fig. 2 and agrees well with the experimental data at low temperatures. In the same panel, the contribution from the two low optical modes using Eq. (1) multiplied by a normalization constant is shown with dashed red lines. The final theoretical prediction, involving only the acoustic modes and the two soft optical modes, is shown by the solid black line in panel (d) of Fig. 2. The theoretical estimate shows good agreement with the experimental data up to K and reproduces the boson-peak-like excess appearing around K. The discrepancy between theory and data above K is due to neglecting the other optical modes (green curves in panel (b)) whose contribution becomes important at larger temperatures. We also emphasize that the effects of damping, that usually broaden all features, are neglected for simplicity. Finally, we notice that the theoretical model involves one single unknown fitting parameter, corresponding to the intensity of the optical mode contribution, that is adjusted in panel (d) of Fig. 2 to match the experimental intensity. The value of this fitting parameter does not affect the position of the peak, that is predicted by the theory without free parameters.
Similar agreement between theory and experiments is found also using the phonon dispersion along the - direction and for another NCL compound Mn4Si7 (see End Matter). Our theoretical analysis proves that the glassy boson-peak-like anomaly in NCL materials is caused by the extremely soft optical mode arising because of the chimney sublattice structure.
We notice a rather strong variation of for the two samples of Ru2Sn3-δ synthesized. This suggests that this compound is very sensitive to stoichiometry, a property that allows for a future exploration of its glassy properties in a wider ‘parameter space’. We anticipate that this could be caused by the sensitivity of the soft mode and other vibrational excitations on defect density. Finally, back to the doped samples in Fig. 1, we notice that by partially replacing Sn with Ga in Ru2Sn3-δ the energy of the excess peak moves to larger temperatures and its intensity decreases. Since this dramatically tunes the size of the unit cell (replacing even % of Sn with Ga increases the -axis by an order of magnitude, see SM), we conclude that incommensuration is not the dominant factor determining the gap of the soft mode. On the contrary, defects and pinning, which are enhanced by doping the system, might be the most relevant factors.
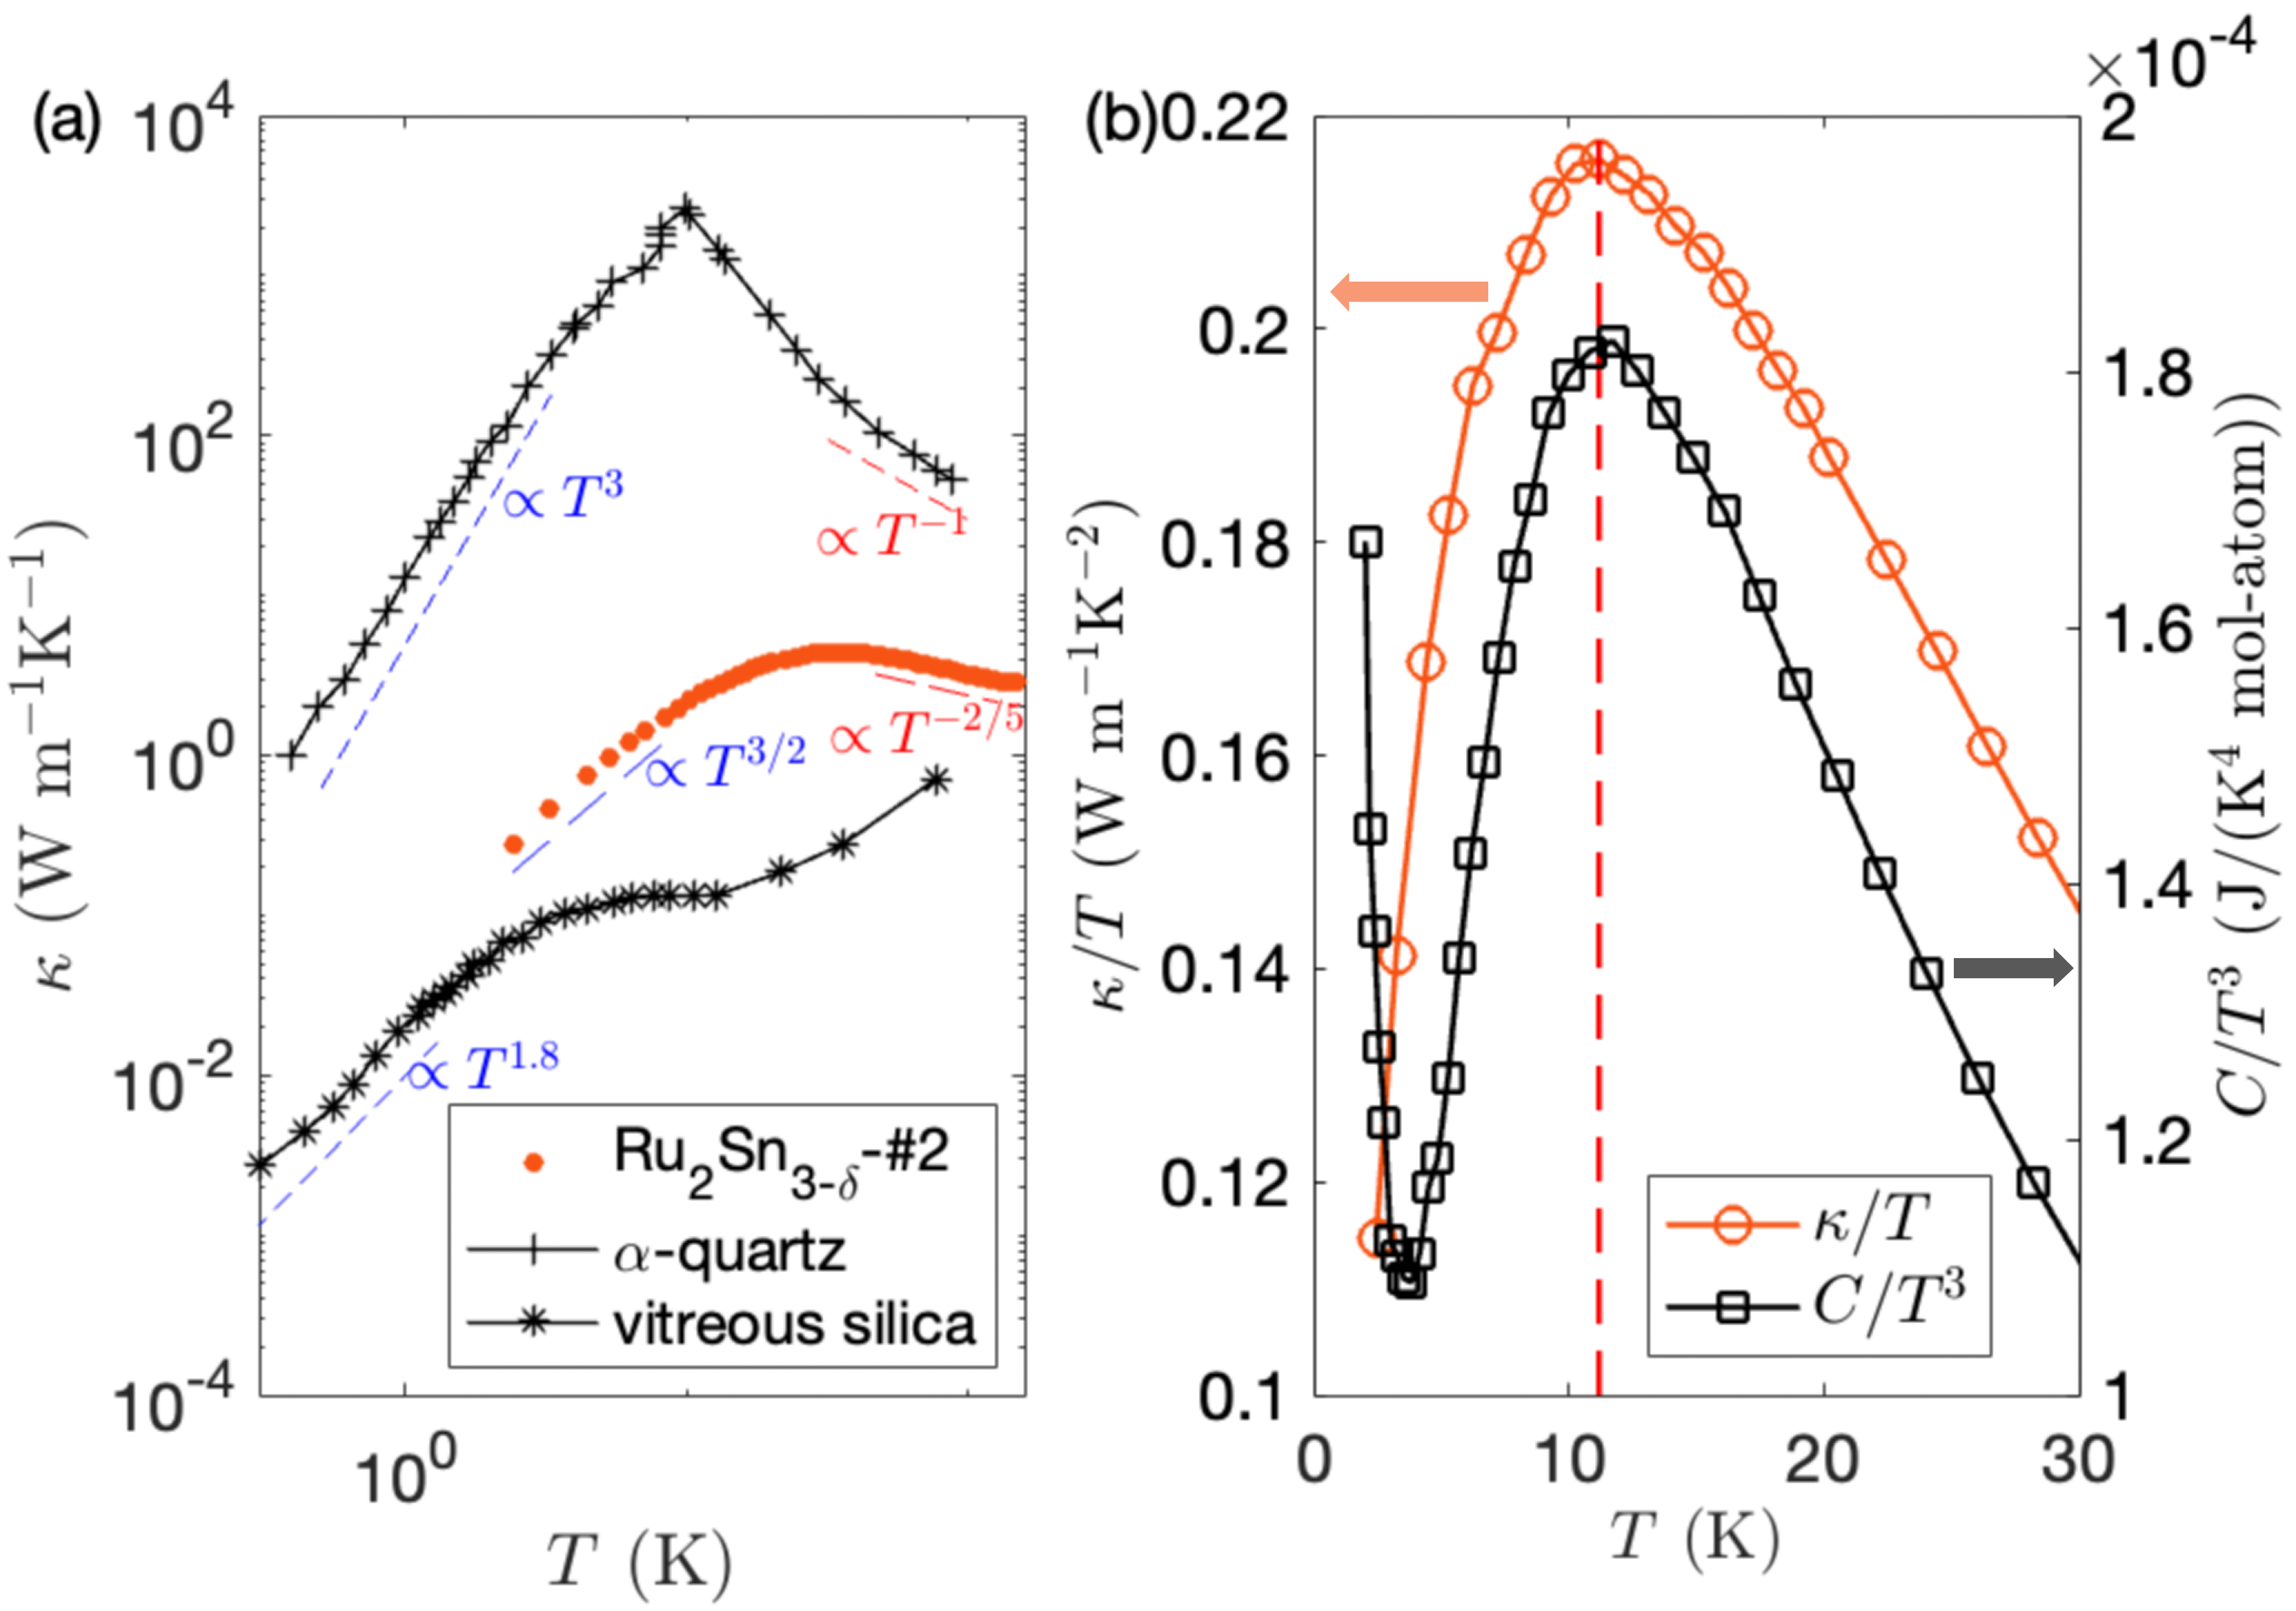
Transport properties and the role of abundant optical phonons –Anomalies in the thermal conductivity, with respect to the textbook ideal crystal, are another hallmark of glassy physics Zeller and Pohl (1971). In panel (a) of Fig. 3, we present the measured thermal conductivity of Ru2Sn3-δ. For comparison, we also display experimental data for an ideal crystal (-quartz) and an ideal glass (vitreous silica) from Ref. Zeller and Pohl (1971), with the corresponding low and high temperatures limits. We first note that the thermal conductivity, , of Ru2Sn3-δ is remarkably low – at least one to two orders of magnitude smaller than that of an ideal crystal – and is, in fact, comparable to the values typically observed in ideal glasses. Furthermore, the phonon peak in our thermal conductivity measurements of RuSn3-δ is notably weak and broad, a significant departure from the sharp, well-defined peaks expected for ideal crystals Tritt (2005) (for comparison, see data for -quartz).
Most strikingly, we observe a low-temperature scaling of , which deviates significantly from the Debye scaling characteristic of ideal crystals Tritt (2005). Intriguingly, this scaling is closer to the glassy limit, , observed in materials like vitreous silica (with ) Ramos (2022). This anomalous behavior occurs in the same temperature range where the contribution of the two soft modes to the heat capacity is most pronounced (see Fig. 2(d)), suggesting a potential connection between these modes and the observed thermal properties. Finally, we observe the absence of the characteristic high-temperature scaling typically associated with ideal crystals. Instead, we find a softer decay, , which appears to correlate with the energy scale of the abundant, dispersionless optical modes (depicted as green modes in Fig. 2(b)).
On the other hand, offers a complementary self-consistency check. The total thermal conductivity is the sum of both phononic (p) and electronic (e) contributions, i.e. . Since both terms are proportional to the specific heat of their respective heat carriers and are also weighted by the carrier velocity and mean free path , we can express the total thermal conductivity as . In a simple scenario, when and do not exhibit apparent temperature dependence (as usually the case at low temperatures), the thermal conductivity is an effective transport measurement of specific heat. In this case, adopts the temperature dependence solely from that of the specific heat. In panel (b) of Fig. 3, we examined the temperature dependence of , in which the factor removes the temperature dependence of a typical electronic specific heat such that the temperature dependence of can be revealed. Interestingly enough, a well-pronounced round peak in was identified at K, which traces closely the peak temperature in ( K), found in Fig. 1. Since thermal conductivity is selectively sensitive to heat carrier as apposed to the case of specific heat which accounts for all degrees of freedom, the observation of identical peak temperatures in both and provided solid evidence of the existence of a boson-peak anomaly.
The analysis of the experimental thermal conductivity in Ru2Sn3-δ confirmed the idea that NCL complex crystals present thermal transport features in between the ideal crystal and ideal glass paradigms. Taking advantage of the metallic nature of Ru2Sn3-δ, we expand our analysis to thermoelectric transport by measuring the electric resistivity , Seebeck coefficient and Nernst signal .
Panel (a) of Fig. 4 shows the measured resistivity for the two samples of Ru2Sn3-δ. Both NCL materials exhibit a -square to -linear crossover at the characteristic temperatures of K ( meV) for Ru2Sn and K ( meV) for Ru2Sn. Interestingly, the linear in regime is very robust and extends to very low temperatures. Moreover, the energy range of this linear regime strongly correlates with the energy of the flat optical modes in the spectrum, indicating that the scattering between electrons and these abundant soft optical modes are the origin of this behavior, as recently discussed in Das Sarma and Tu (2024) (see also Ochoa and Fernandes (2023); Caprara et al. (2022) for a derivation of linear in resistivity from overdamped phason modes).
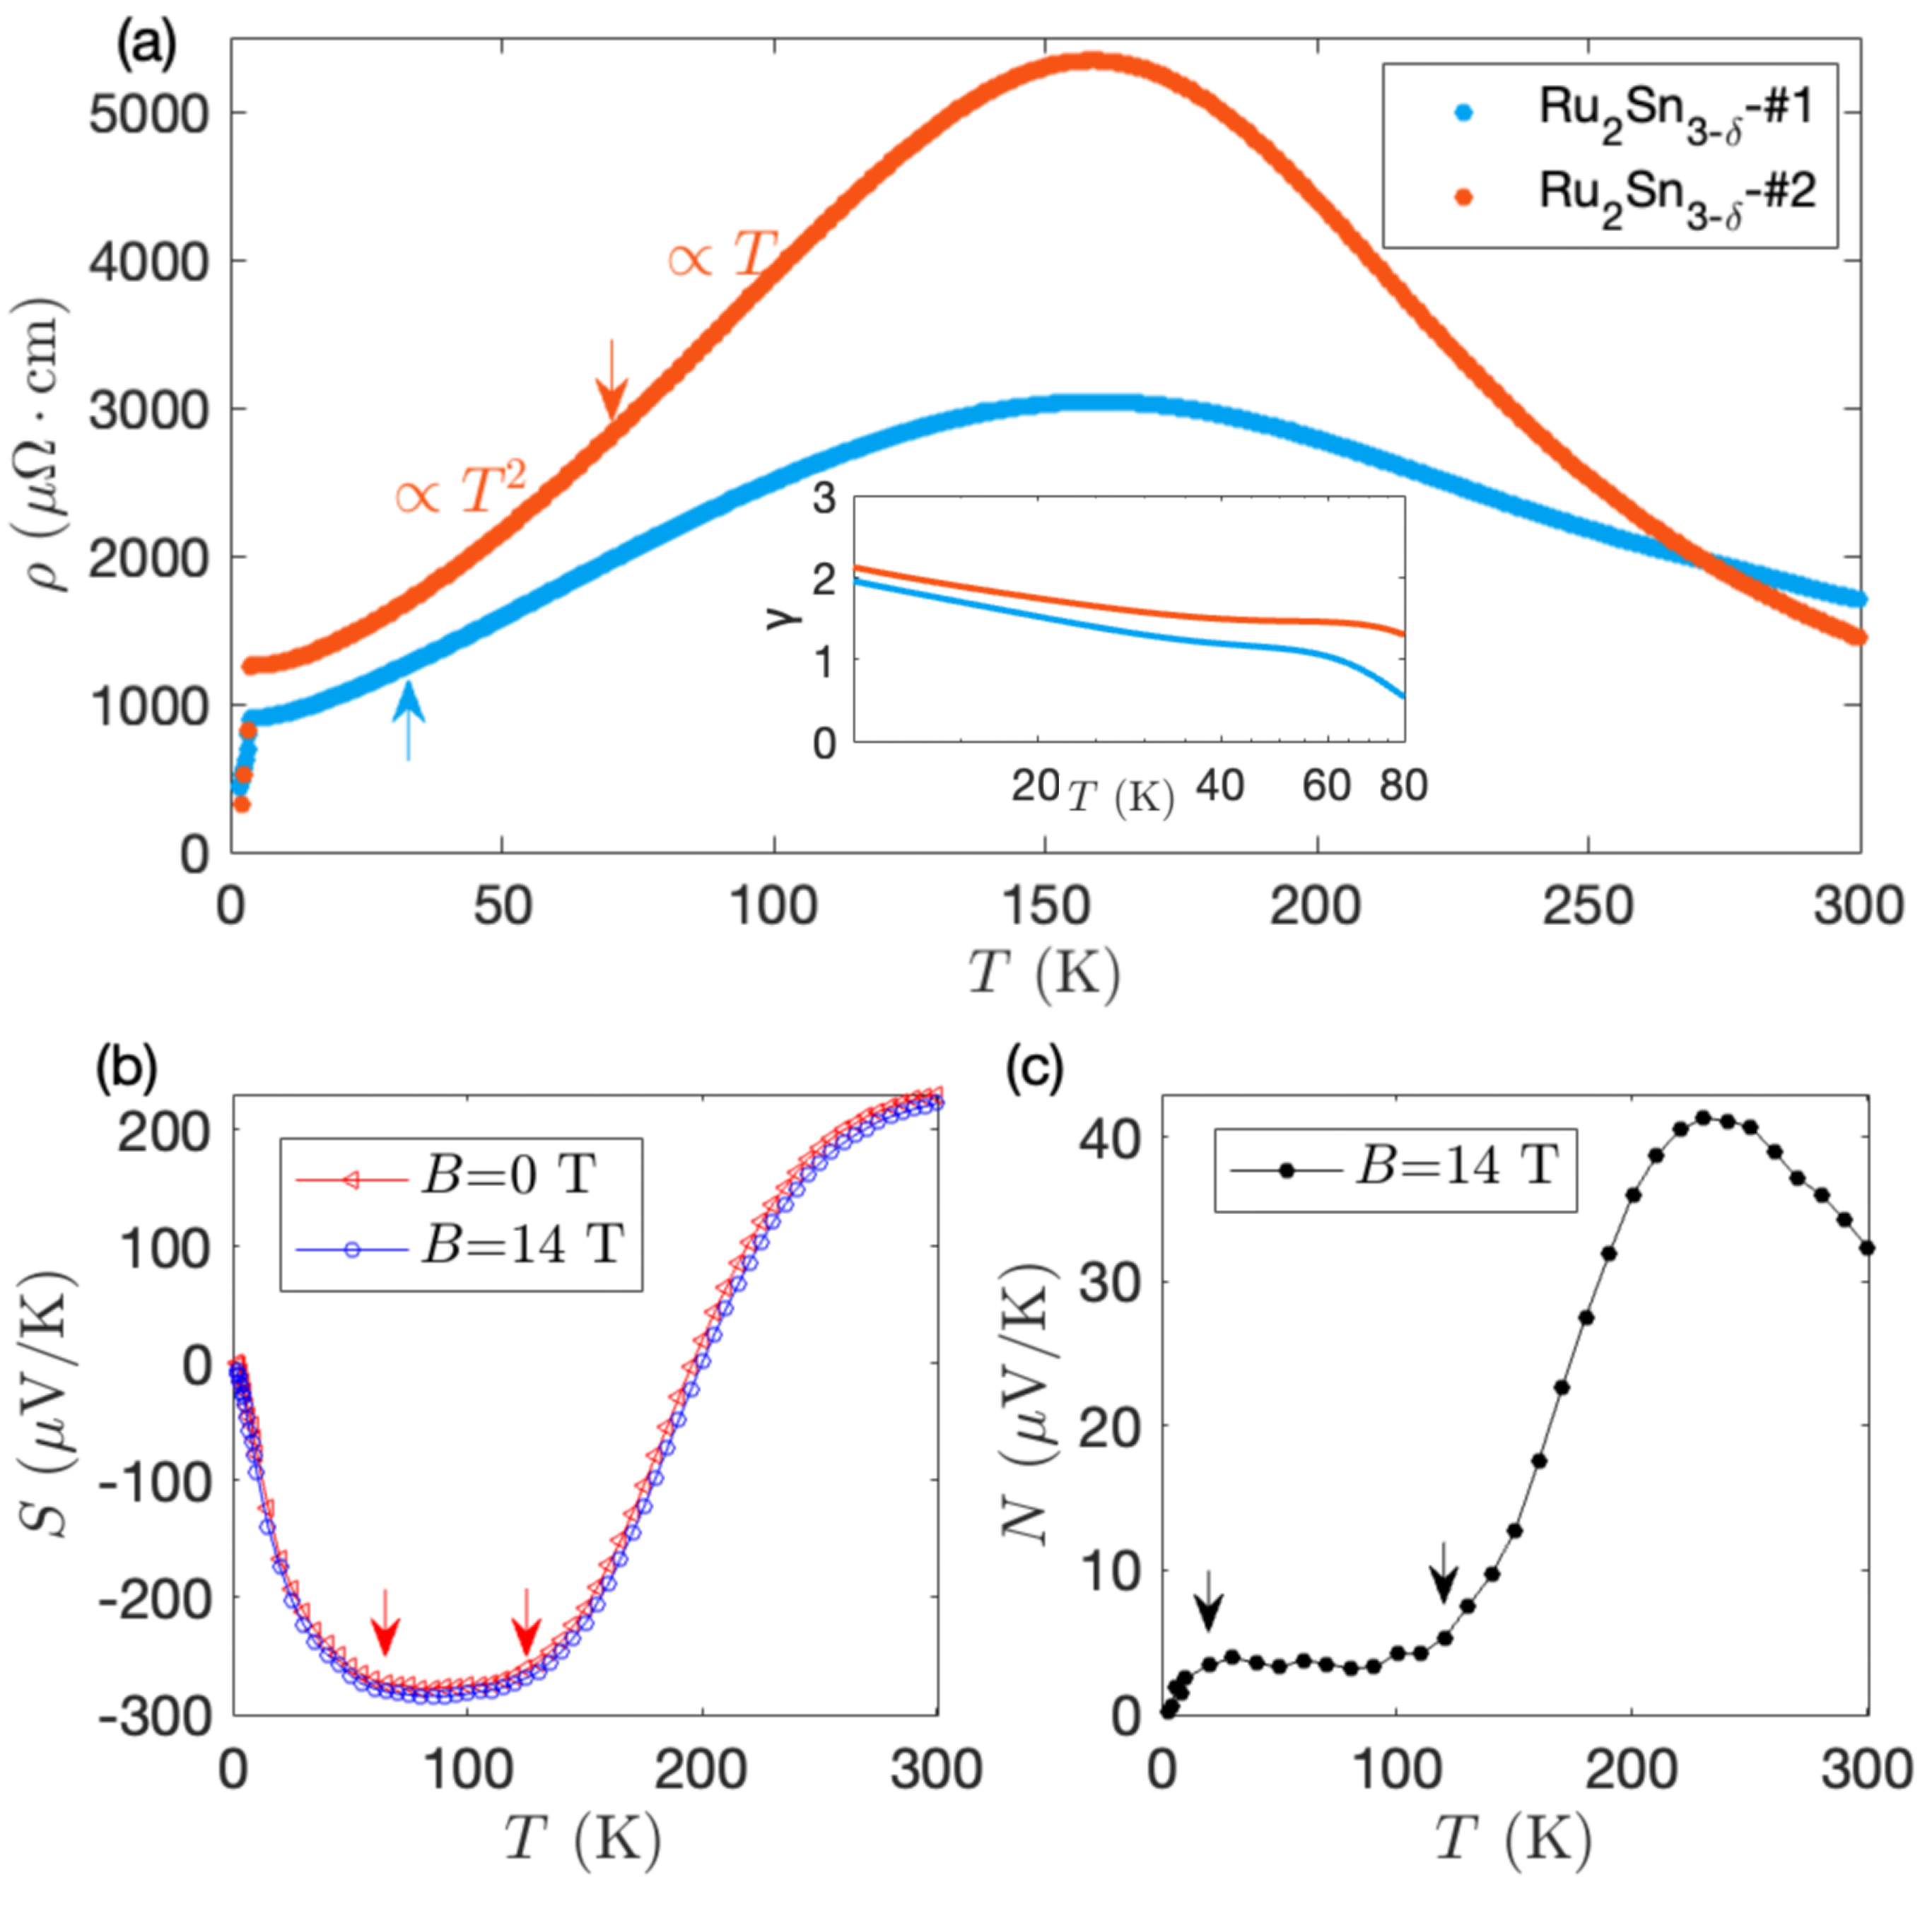
By fitting the low-temperature data to the Fermi liquid prediction , we obtain extremely large (compared to the trends reported in other metallic compounds Behnia (2022)) T-square coefficients n cm/K2 for Ru2Sn and n cm/K2 for Ru2Sn. A similar value of n cm/K2 is found for Mn4Si7 using the data in Ref. Chen et al. (2015) (see SM). We then test the scaling of the electric resistivity using the phenomenological expression . The temperature dependence of is shown in the inset of Fig. 4(a). Interestingly, in both compounds we do not see any trace of a scaling regime, as expected at low-temperatures from standard electron-phonon scattering Mizutani (2001), and compatible with an anomalously large contribution. In the End Matter, we show that the presence of overdamped acoustic modes could explain this anomaly by producing a novel contribution to the low-temperature resistivity, in place of the standard term, that adds up to the electronic part. The overdamped nature of the acoustic modes could be a direct consequence of the low-lying optical modes and the enhanced anharmonicity and scattering induced by them.
Panels (b-c) of Fig. 4 report experimental measurements of thermoelectric response in Ru2Sn. Both the Seebeck coefficient and Nernst signal display an anomalous plateau in temperature. The plateau is particularly robust in and it strongly correlates with the energy scale of the lowest optical modes ( K or meV) and the energy range in which abundant optical phonons appear ( K or meV). This observation highlights the possibility of dominant electron-phonon scattering in the electron transport process. We advance the idea that the interaction between the electron and the low-lying optical modes is the microscopic origin of the anomalous thermoelectric transport properties as well although a more precise picture is beyond the scope of the present measurements. Interestingly, a plateau in the Seebeck coefficient has been reported in Au-based and Cu-based metallic glasses Pryadun et al. (2015); Kuo et al. (2006) where it is associated with low-energy glassy excitations, suggesting another striking similarity between NCL compounds and structural glasses.
Conclusions – Combining experimental measurements of the heat capacity, thermal conductivity, electric resistivity, and thermoelectric transport coefficients, we have reported the emergence of glassy thermodynamic and transport properties in NCL compounds, whose crystalline nature is confirmed by means of structural characterization. Exploiting DFT simulations, our theoretical analysis suggests that the anomalous glassy nature of these crystalline materials is induced by low-lying optical phonons.
Importantly, the striking similarities with structural glasses extend beyond thermal transport and appear also in the electric and thermoelectric transport properties. It is interesting to notice that a linear magnetoresistance has been reported in Ru2Sn3-δ Wu et al. (2020) similarly to many strongly correlated electronic systems, such as cuprates, pnictides, and moire materials, where it is rationalized with the emergence of glassy orders Kim et al. (2024).
In conclusion, this large set of experimental and theoretical observations hints towards the emergence of surprising connections between complex crystals, glasses, and strange metals. In particular, there is increasing evidence that glassy physics can emerge without structural disorder and that strange metallic physics can arise without strong electronic correlations. In this direction, NCL complex crystals represent a perfect platform to reveal the microscopic origin of these exotic phenomena.
Acknowledgments – WD and MB acknowledge the support of the Shanghai Municipal Science and Technology Major Project (Grant No.2019SHZDZX01). MB acknowledges the support of the sponsorship from the Yangyang Development Fund. XY and HX acknowledge the support of National Natural Science Foundation of China (Grant No. 12274283) and Science and Technology Commission of Shanghai Municipality (Grant No. 24LZ1401000). This work is supported by the National Key RD Program of China (Grant Nos. 2024YFA1409002, 2019YFA0308602), the National Natural Science Foundation of China (Grant No. 12074425), and the Fundamental Research Funds for the Central Universities, and the Research Funds of Renmin University of China (No. 23XNKJ22).
References
- Kittel and McEuen (2018) C. Kittel and P. McEuen, Introduction to solid state physics (John Wiley & Sons, 2018).
- Ramos (2022) M. A. Ramos, Low-Temperature Thermal and Vibrational Properties of Disordered Solids (World Scientific (Europe), 2022).
- Ackerman et al. (1981) D. A. Ackerman, D. Moy, R. C. Potter, A. C. Anderson, and W. N. Lawless, Phys. Rev. B 23, 3886 (1981).
- Hegenbarth (1995) E. Hegenbarth, Ferroelectrics 168, 25 (1995).
- Ishii et al. (2019) Y. Ishii, Y. Ouchi, S. Kawaguchi, H. Ishibashi, Y. Kubota, and S. Mori, Phys. Rev. Mater. 3, 084414 (2019).
- Ishii et al. (2021) Y. Ishii, A. Yamamoto, N. Sato, Y. Nambu, S. Ohira-Kawamura, N. Murai, T. Mori, and S. Mori, arXiv e-prints , arXiv:2104.01969 (2021), arXiv:2104.01969 [cond-mat.mtrl-sci] .
- Kobayashi et al. (1996) M. Kobayashi, T. Tomoyose, and M. Aniya, Physica B: Condensed Matter 219-220, 460 (1996), PHONONS 95.
- Etrillard et al. (1996) J. Etrillard, J. C. Lasjaunias, K. Biljakovic, B. Toudic, and G. Coddens, Phys. Rev. Lett. 76, 2334 (1996).
- Reményi et al. (2015) G. Reményi, S. Sahling, K. Biljaković, D. Starešinić, J.-C. Lasjaunias, J. E. Lorenzo, P. Monceau, and A. Cano, Phys. Rev. Lett. 114, 195502 (2015).
- Cano and Levanyuk (2004a) A. Cano and A. P. Levanyuk, Phys. Rev. Lett. 93, 245902 (2004a).
- Cano and Levanyuk (2004b) A. Cano and A. P. Levanyuk, Phys. Rev. B 70, 212301 (2004b).
- Takasu et al. (2008) Y. Takasu, T. Hasegawa, N. Ogita, M. Udagawa, M. A. Avila, K. Suekuni, and T. Takabatake, Phys. Rev. Lett. 100, 165503 (2008).
- Avila et al. (2006) M. A. Avila, K. Suekuni, K. Umeo, H. Fukuoka, S. Yamanaka, and T. Takabatake, Phys. Rev. B 74, 125109 (2006).
- Takabatake et al. (2014) T. Takabatake, K. Suekuni, T. Nakayama, and E. Kaneshita, Rev. Mod. Phys. 86, 669 (2014).
- Qiu et al. (2014) W. Qiu, L. Xi, P. Wei, X. Ke, J. Yang, and W. Zhang, Proceedings of the National Academy of Sciences 111, 15031 (2014).
- Akhbarifar et al. (2020) S. Akhbarifar, W. Lutze, N. A. Mecholsky, and I. L. Pegg, Materials Letters 275, 128153 (2020).
- Bux et al. (2014) S. K. Bux, A. Zevalkink, O. Janka, D. Uhl, S. Kauzlarich, J. G. Snyder, and J.-P. Fleurial, J. Mater. Chem. A 2, 215 (2014).
- Liu et al. (2021) Z. Liu, W. Zhang, W. Gao, and T. Mori, Energy Environ. Sci. 14, 3579 (2021).
- Avila et al. (2008) M. A. Avila, K. Suekuni, K. Umeo, H. Fukuoka, S. Yamanaka, and T. Takabatake, Applied Physics Letters 92, 041901 (2008).
- Bhattacharya (2019) A. Bhattacharya, J. Mater. Chem. C 7, 13986 (2019).
- Chazallon et al. (2002) B. Chazallon, H. Itoh, M. Koza, W. F. Kuhs, and H. Schober, Phys. Chem. Chem. Phys. 4, 4809 (2002).
- Christensen et al. (2008) M. Christensen, A. B. Abrahamsen, N. B. Christensen, F. Juranyi, N. H. Andersen, K. Lefmann, J. Andreasson, C. R. H. Bahl, and B. B. Iversen, Nature Materials 7, 811 (2008).
- Delaire et al. (2011) O. Delaire, J. Ma, K. Marty, A. F. May, M. A. McGuire, M.-H. Du, D. J. Singh, A. Podlesnyak, G. Ehlers, M. D. Lumsden, and B. C. Sales, Nature Materials 10, 614 (2011).
- Lanigan-Atkins et al. (2020) T. Lanigan-Atkins, S. Yang, J. L. Niedziela, D. Bansal, A. F. May, A. A. Puretzky, J. Y. Y. Lin, D. M. Pajerowski, T. Hong, S. Chi, G. Ehlers, and O. Delaire, Nature Communications 11, 4430 (2020).
- Li et al. (2015) C. W. Li, J. Hong, A. F. May, D. Bansal, S. Chi, T. Hong, G. Ehlers, and O. Delaire, Nature Physics 11, 1063 (2015).
- Tse et al. (2005) J. S. Tse, D. D. Klug, J. Y. Zhao, W. Sturhahn, E. E. Alp, J. Baumert, C. Gutt, M. R. Johnson, and W. Press, Nature Materials 4, 917 (2005).
- Ma et al. (2013) J. Ma, O. Delaire, A. F. May, C. E. Carlton, M. A. McGuire, L. H. VanBebber, D. L. Abernathy, G. Ehlers, T. Hong, A. Huq, W. Tian, V. M. Keppens, Y. Shao-Horn, and B. C. Sales, Nature Nanotechnology 8, 445 (2013).
- Ren et al. (2021) S. Ren, H.-X. Zong, X.-F. Tao, Y.-H. Sun, B.-A. Sun, D.-Z. Xue, X.-D. Ding, and W.-H. Wang, Nature Communications 12, 5755 (2021).
- Moratalla et al. (2019) M. Moratalla, J. F. Gebbia, M. A. Ramos, L. C. Pardo, S. Mukhopadhyay, S. Rudic, F. Fernandez-Alonso, F. J. Bermejo, and J. L. Tamarit, Phys. Rev. B 99, 024301 (2019).
- Wu et al. (2024) J. Wu, Y. Lin, M. Shu, Y. Liu, Y. Ma, G. Lin, C. Zhang, P. Jiao, F. Zhu, Y. Wu, R. A. Ewings, H. C. Walker, G. Deng, S. Chi, S. Jiang, M. Baggioli, M. Jin, H. Wang, W. Xie, T.-R. Wei, J. Yang, X. Shi, and J. Ma, Nature Communications 15, 6248 (2024).
- Krivchikov et al. (2006) A. I. Krivchikov, A. N. Yushchenko, V. G. Manzhelii, O. A. Korolyuk, F. J. Bermejo, R. Fernández-Perea, C. Cabrillo, and M. A. González, Phys. Rev. B 74, 060201 (2006).
- Ramos et al. (1997) M. A. Ramos, S. Vieira, F. J. Bermejo, J. Dawidowski, H. E. Fischer, H. Schober, M. A. González, C. K. Loong, and D. L. Price, Phys. Rev. Lett. 78, 82 (1997).
- Talón et al. (1998) C. Talón, M. A. Ramos, S. Vieira, G. J. Cuello, F. J. Bermejo, A. Criado, M. L. Senent, S. M. Bennington, H. E. Fischer, and H. Schober, Phys. Rev. B 58, 745 (1998).
- Talón et al. (2002) C. Talón, M. A. Ramos, and S. Vieira, Phys. Rev. B 66, 012201 (2002).
- Vdovichenko et al. (2015) G. A. Vdovichenko, A. I. Krivchikov, O. A. Korolyuk, J. L. Tamarit, L. C. Pardo, M. Rovira-Esteva, F. J. Bermejo, M. Hassaine, and M. A. Ramos, The Journal of Chemical Physics 143, 084510 (2015).
- Vispa et al. (2017) A. Vispa, M. Romanini, M. A. Ramos, L. C. Pardo, F. J. Bermejo, M. Hassaine, A. I. Krivchikov, J. W. Taylor, and J. L. Tamarit, Phys. Rev. Lett. 118, 105701 (2017).
- Romanini et al. (2012) M. Romanini, P. Negrier, J. L. Tamarit, S. Capaccioli, M. Barrio, L. C. Pardo, and D. Mondieig, Phys. Rev. B 85, 134201 (2012).
- Jeżowski et al. (2018) A. Jeżowski, M. A. Strzhemechny, A. I. Krivchikov, N. A. Davydova, D. Szewczyk, S. G. Stepanian, L. M. Buravtseva, and O. O. Romantsova, Phys. Rev. B 97, 201201 (2018).
- Szewczyk et al. (2024) D. Szewczyk, M. Moratalla, G. Chajewski, J. F. Gebbia, A. Jeżowski, A. I. Krivchikov, M. Barrio, J. L. Tamarit, and M. A. Ramos, Phys. Rev. B 110, 174204 (2024).
- Krivchikov et al. (2022) A. I. Krivchikov, A. Jeżowski, D. Szewczyk, O. A. Korolyuk, O. O. Romantsova, L. M. Buravtseva, C. Cazorla, and J. L. Tamarit, The Journal of Physical Chemistry Letters 13, 5061 (2022).
- Baggioli and Zaccone (2021) M. Baggioli and A. Zaccone, International Journal of Modern Physics B 35, 2130002 (2021).
- Schliesser and Woodfield (2015) J. M. Schliesser and B. F. Woodfield, Journal of Physics: Condensed Matter 27, 285402 (2015).
- Baggioli and Zaccone (2019) M. Baggioli and A. Zaccone, Journal of Physics: Materials 3, 015004 (2019).
- Hu and Tanaka (2022) Y.-C. Hu and H. Tanaka, Nature Physics 18, 669 (2022).
- Hu and Tanaka (2023) Y.-C. Hu and H. Tanaka, Phys. Rev. Res. 5, 023055 (2023).
- Tømterud et al. (2023) M. Tømterud, S. D. Eder, C. Büchner, L. Wondraczek, I. Simonsen, W. Schirmacher, J. R. Manson, and B. Holst, Nature Physics 19, 1910 (2023).
- Jiang et al. (2024) C. Jiang, Z. Zheng, Y. Chen, M. Baggioli, and J. Zhang, Phys. Rev. Lett. 133, 188302 (2024).
- Jiang and Baggioli (2024) C. Jiang and M. Baggioli, Journal of Physics: Condensed Matter 36, 505101 (2024).
- Howson and Gallagher (1988) M. Howson and B. Gallagher, Physics Reports 170, 265 (1988).
- Pryadun et al. (2015) V. V. Pryadun, D. Louzguine-Luzgin, L. V. Shvanskaya, and A. N. Vasiliev, JETP letters 101, 465 (2015).
- Kuo et al. (2006) Y. K. Kuo, K. M. Sivakumar, C. A. Su, C. N. Ku, S. T. Lin, A. B. Kaiser, J. B. Qiang, Q. Wang, and C. Dong, Phys. Rev. B 74, 014208 (2006).
- Schwomma et al. (1963) O. Schwomma, H. Nowotny, and A. Wittmann, Monatshefte fur Chemie und verwandte Teile anderer Wissenschaften 94, 681 (1963), publisher: Springer.
- Lu et al. (2002) G. Lu, S. Lee, J. Lin, L. You, J. Sun, and J. T. Schmidt, Journal of Solid State Chemistry 164, 210 (2002).
- Han et al. (2016) H. Han, L. Zhang, X. Zhu, H. Du, M. Ge, L. Ling, L. Pi, C. Zhang, and Y. Zhang, Scientific Reports 6, 39338 (2016).
- Gibson et al. (2014) Q. D. Gibson, D. Evtushinsky, A. N. Yaresko, V. B. Zabolotnyy, M. N. Ali, M. K. Fuccillo, J. Van den Brink, B. Buchner, R. J. Cava, and S. V. Borisenko, Scientific Reports 4, 5168 (2014).
- Kawasoko et al. (2014) H. Kawasoko, T. Takayama, and H. Takagi, Applied Physics Express 7, 115801 (2014).
- Chen et al. (2015) X. Chen, A. Weathers, J. Carrete, S. Mukhopadhyay, O. Delaire, D. A. Stewart, N. Mingo, S. N. Girard, J. Ma, D. L. Abernathy, J. Yan, R. Sheshka, D. P. Sellan, F. Meng, S. Jin, J. Zhou, and L. Shi, Nature Communications 6, 6723 (2015).
- Buchenau et al. (1986) U. Buchenau, M. Prager, N. Nücker, A. J. Dianoux, N. Ahmad, and W. A. Phillips, Phys. Rev. B 34, 5665 (1986).
- White and Collocott (1984) G. K. White and S. J. Collocott, Journal of Physical and Chemical Reference Data 13, 1251 (1984).
- Poutcharovsky et al. (1975) D. J. Poutcharovsky, K. Yvon, and E. Parthé, Journal of the Less Common Metals 40, 139 (1975).
- Zeller and Pohl (1971) R. C. Zeller and R. O. Pohl, Phys. Rev. B 4, 2029 (1971).
- Tritt (2005) T. M. Tritt, Thermal Conductivity: Theory, Properties, and Applications (2005).
- Das Sarma and Tu (2024) S. Das Sarma and Y.-T. Tu, Phys. Rev. B 109, 235118 (2024).
- Ochoa and Fernandes (2023) H. Ochoa and R. M. Fernandes, Phys. Rev. B 108, 075168 (2023).
- Caprara et al. (2022) S. Caprara, C. D. Castro, G. Mirarchi, G. Seibold, and M. Grilli, Communications Physics 5, 10 (2022).
- Behnia (2022) K. Behnia, Annalen der Physik 534, 2100588 (2022).
- Mizutani (2001) U. Mizutani, Introduction to the Electron Theory of Metals (Cambridge University Press, 2001).
- Wu et al. (2020) B. Wu, V. Barrena, F. Mompeán, M. García-Hernández, H. Suderow, and I. Guillamón, Phys. Rev. B 101, 205123 (2020).
- Kim et al. (2024) J. Kim, E. Altman, and S. Chatterjee, Proceedings of the National Academy of Sciences 121, e2405720121 (2024).
- Chaikin and Lubensky (1995) P. M. Chaikin and T. C. Lubensky, Principles of condensed matter physics, Vol. 10 (Cambridge university press Cambridge, 1995).
- Coleman (2015) P. Coleman, Introduction to Many-Body Physics (Cambridge University Press, 2015).
- Shiomi and Saitoh (2017) Y. Shiomi and E. Saitoh, AIP Advances 7, 035011 (2017).
- Dolomanov et al. (2009) O. V. Dolomanov, L. J. Bourhis, R. J. Gildea, J. A. K. Howard, and H. Puschmann, Journal of Applied Crystallography 42, 339 (2009).
- Spek (2003) A. L. Spek, Journal of Applied Crystallography 36, 7 (2003).
End Matter
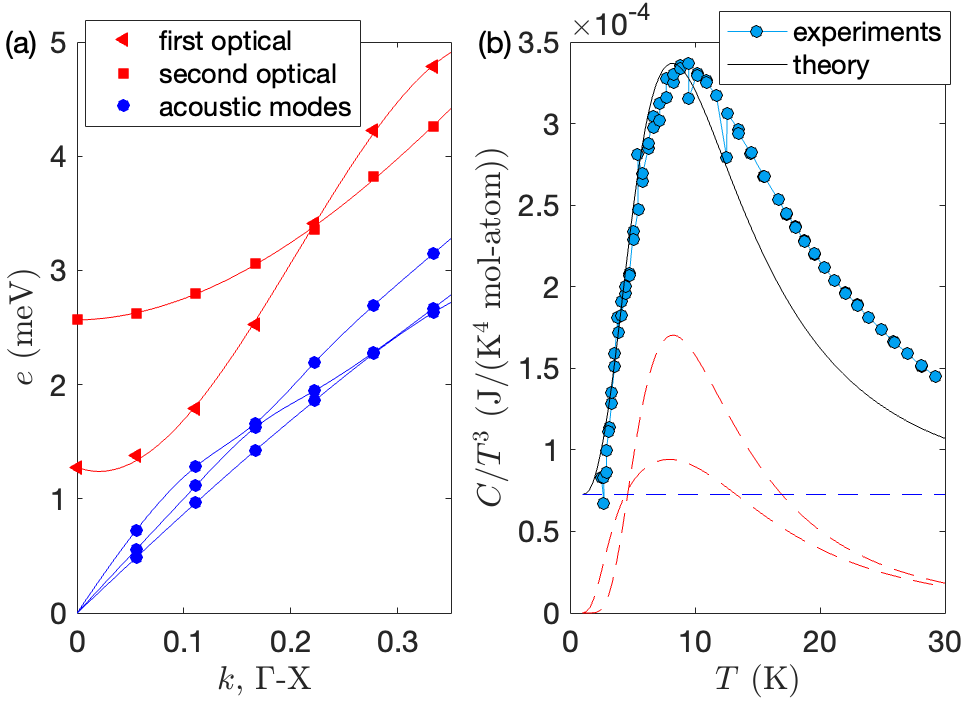
Appendix A: Heat capacity of Mn4Si7 - In panels (a-c) of Fig. 5, we provide the schematic crystalline structure and the vibrational spectrum from DFT simulations for Mn4Si7 provided in Ref. Chen et al. (2015). We notice the typical chimney ladder sublattice structure of this compound, very similar to that of Ru2Sn3-δ reported in the main text, panel (c) in Fig. 2. Panel (c) of Fig. 5 shows the vibrational spectrum along the . A twisting optical mode with low energy is observed. We then theoretically predict the heat capacity using the formulae in the main text and the dispersion of the ‘twisting’ mode and additional acoustic contribution shown in panel (c). In panel (d) of Fig. 5, we show the comparison with the experimental data after subtracting the electronic contribution with mJ/K2 mol-atom. The agreement between the theory and the experimental data is excellent. The discrepancy at high temperature is due to the fact that the theoretical model considers only the low-energy modes (TA, LA and twisting in panel (c)).
Appendix B: Extended analysis of the heat capacity of Ru2Sn3-δ - In the main text, we show a positive agreement between the experimental data for the heat capacity of Ru2Sn and the theoretical predictions using the soft optical modes and acoustic modes along , which is shown in Fig. 2. Here, we present a similar analysis using the spectrum along . The results are reported in Fig. 6, proving that the theoretical framework correctly describes the experimental data and the position of the peak. The results are similar because the anisotropy along the two directions is not so strong. The theoretical framework is flexible and could account also for strong anisotropy by considering the dispersion along the various directions. This could be necessary for other compounds where the dispersion of the soft modes is highly anisotropic.
Appendix C: Anomalous quadratic resistivity from overdamped phonons - Let us consider the Green’s function of a single phononic mode with frequency and wave-vector ,
| (2) |
Here, is the line-width of this mode and its energy. For acoustic phonons Chaikin and Lubensky (1995), and at low , where is the propagation speed and the damping coefficient. From the Green’s function, one can also define the corresponding spectral function Coleman (2015).
The electron-phonon contribution to the electric resistivity can then be estimated using the Baym formula Mizutani (2001). Assuming that the Fourier transform of the single ionic potential is a constant, we can rewrite such formula as
| (3) |
where , is the dynamical structure factor and is the Debye wave-vector. Here, is an undetermined normalization constant that is microscopically determined by the volume per atom, the ionic potential, the Fermi velocity and Fermi wave number (see Mizutani (2001)). For convenience, we define the Debye temperature and the damping temperature scale .
In the large damping regime, , we obtain:
| (4) |
where coincides with the scale of the crossover between underdamped and overdamped phonon behavior.
In the small damping regime, , we obtain:
| (5) |
where and . When , all the three temperature scales coincide, , marking the transition between the two regimes. Fig. 7(a) proves the validity of these analytical scalings when compared to the numerical solutions of Eq. (3). Fig. 7(b) summarizes these scaling behaviors on the plane (notice the similarities with the results in Ochoa and Fernandes (2023)).
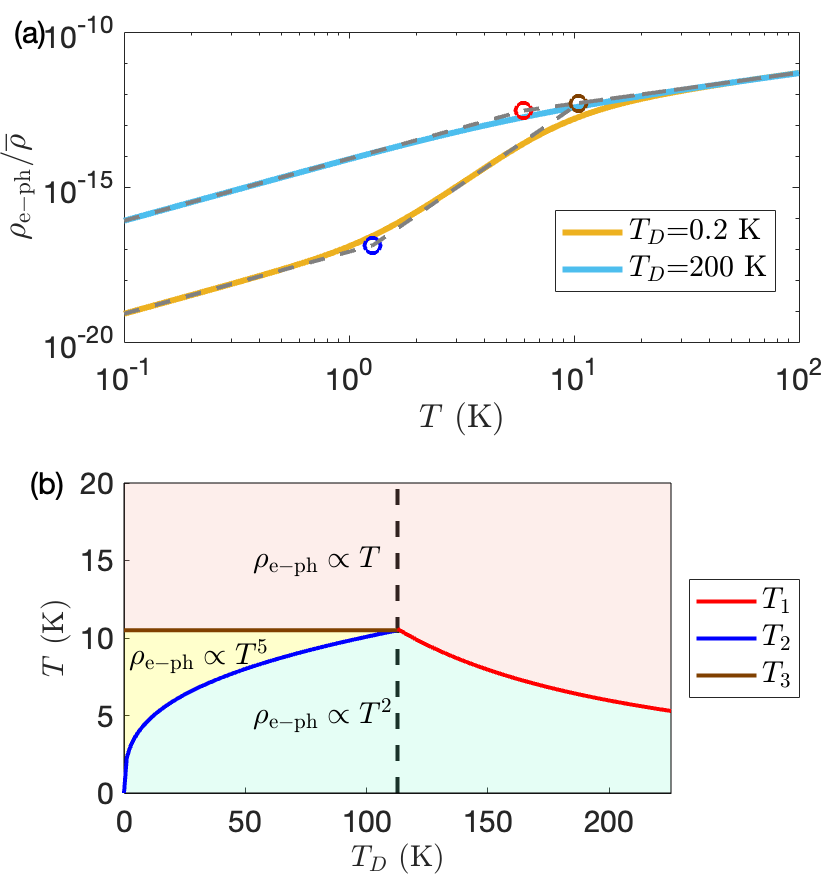
Two important physical observations emerge from this analysis: (I) The scattering between electrons and overdamped phonons induces a term in the resistivity that adds up to the standard electron-electron contribution. (II) The high-temperature linear in regime extends to low temperatures up to an emergent scale that is governed by the phonon damping and can be parametrically smaller than the Bloch-Gruneisen temperature.
We then apply this framework to the case of Ru2Sn3-δ. In panel (a) of Fig. 8, we show the calculated spectral function including the acoustic modes and low optical modes, where . The dispersion of these modes is taken from the DFT data, panel (c) of Fig. 2. The damping coefficient is set to K. In panel (b) of Fig. 8, we calculate from Eq. (3), using the spectral function shown in panel (a). The frequency integral is performed up to a cutoff meV to exclude the other abundant optical modes (green curves in Fig. 2(b)). For simplicity, and to reduce the number of free parameters, we have set the damping coefficient to be the same for all branches with and 6.124 . We notice that for optical mode, a independent damping term could also appear.
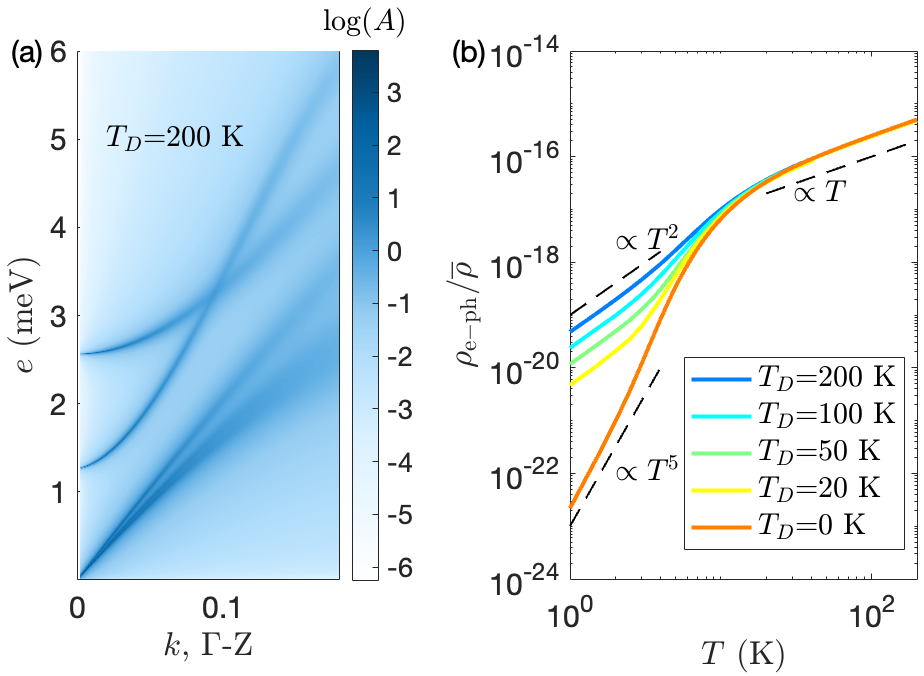
In the absence of damping, , the contribution from acoustic modes exhibits a transition from a to dependence, as expected from Bloch-Gruneisen formula Mizutani (2001). When , displays a clear quadratic scaling at low , while the behavior disappears in favor of a quadratic scaling.
Unfortunately, we are not able to estimate the line-width of the phonon modes from DFT, hence, we take as a free parameter in this theoretical model. Nevertheless, we find that a reasonable value of produces a crossover between and that is of the same order of that observed in the experimental data. This analysis suggests that the anomalous contribution and the extended linear in resistivity regime in Ru2Sn3-δ could be explained by the presence of overdamped phonons.
Supplementary Material
SM1 Synthesis and structural characterization
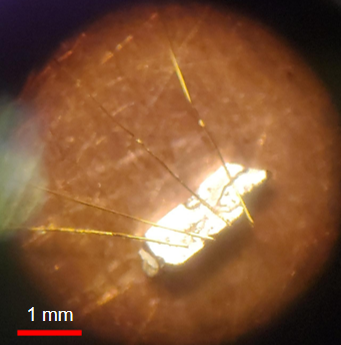
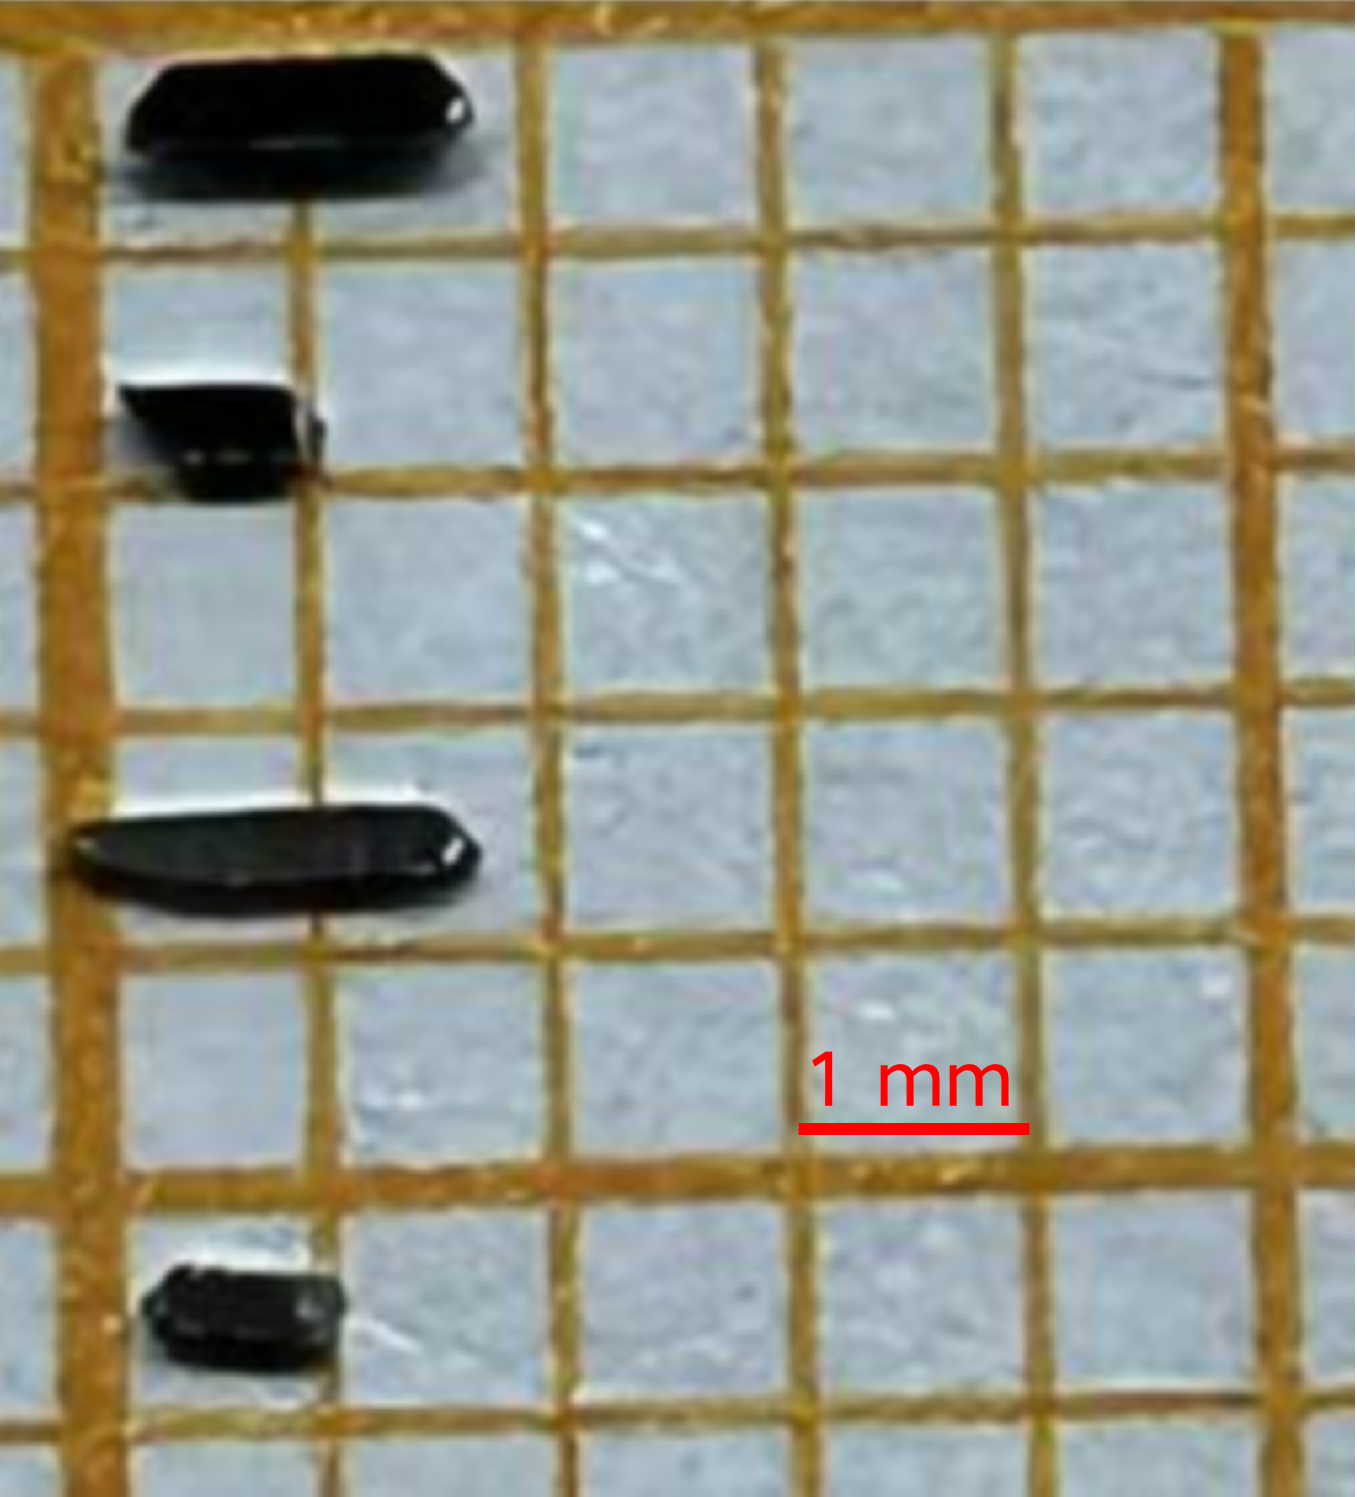
Growth Method Ru2Sn – Single crystals of (see Fig. S1 for a picture of the sample) were synthesized by a Bi flux method as in Shiomi and Saitoh (2017) Shiomi and Saitoh (2017). Pure elemental Ru powder (99.95%, Alfa Aesar), Sn pellets (99.99%, Alfa Aesar) and Bi ingots (99.99%, Alfa Aesar) were mixed in a molar ratio of Ru : Sn : Bi = 2 : 3 : 67 and loaded into an alumina crucible. Subsequently, the crucible was sealed into a quartz tube with a pressure less than Pa. The tube was then put into a furnace, which was heated to 800 °C at 2 °C per minute and then kept there for 12 hours. The tube was then cooled to 100 °C over 70 hours. Single crystals were obtained by soaking the product in dilute HNO3 acid.
Growth Method Ru2Sn – High-quality Ru2Sn3-δ single crystals were grown by a Bi flux method. See Fig. S1 for a picture of the sample. Pure elements of Ru powder, Sn powder and Bi granular were mixed in a molar ratio of Ru : Sn : Bi = 2 : 3 : 67 and loaded into a corundum crucible. Subsequently, the corundum crucible was sealed into a quartz tube with a pressure less than Pa. The tube was then put into a furnace, which was heated to 1100 °C over 15 h and held at 1100 °C for 20 h before the temperature was decreased to 500 °C at 3 °C/h. Eventually, the single crystals with metallic luster were obtained by centrifugation at 500 °C to remove excess flux. Energy dispersive X-ray spectroscopy (EDX, Oxford X-Max 50) was performed to determine the chemical composition, which is consistent with the composition of Ru2Sn3-δ within instrumental error. The single crystal X-ray diffraction (XRD) pattern was carried out by a Bruker D8 Advance X-ray diffractometer using Cu Kα radiation.
Growth Method polycrystalline Ga-doped – Polycrystalline Ga-doped was synthesized as in Lu et al. Lu et al. (2002). Ru powder (99.95%, Alfa Aesar), Sn pellets (99.99%, Alfa Aesar), and Ga ingots (99.99 %, Alfa Aesar) were ground together before being placed in an alumina crucible and sealed in a quartz tube. The samples were heated to 950 °C in a furnace at a rate of 2 °C per minute. They were baked for 100 hours and then cooled at a rate of 0.5 °C to room temperature.
Structural Analysis Ru2Sn – Powder XRD measurements of the samples, Ru2Sn, RuGa0.081Sn1.438, and RuGa0.24Sn1.319 were performed at room temperature, and find that they are indeed crystalline with negligible disorder. Lattice parameters are reported in table 1.
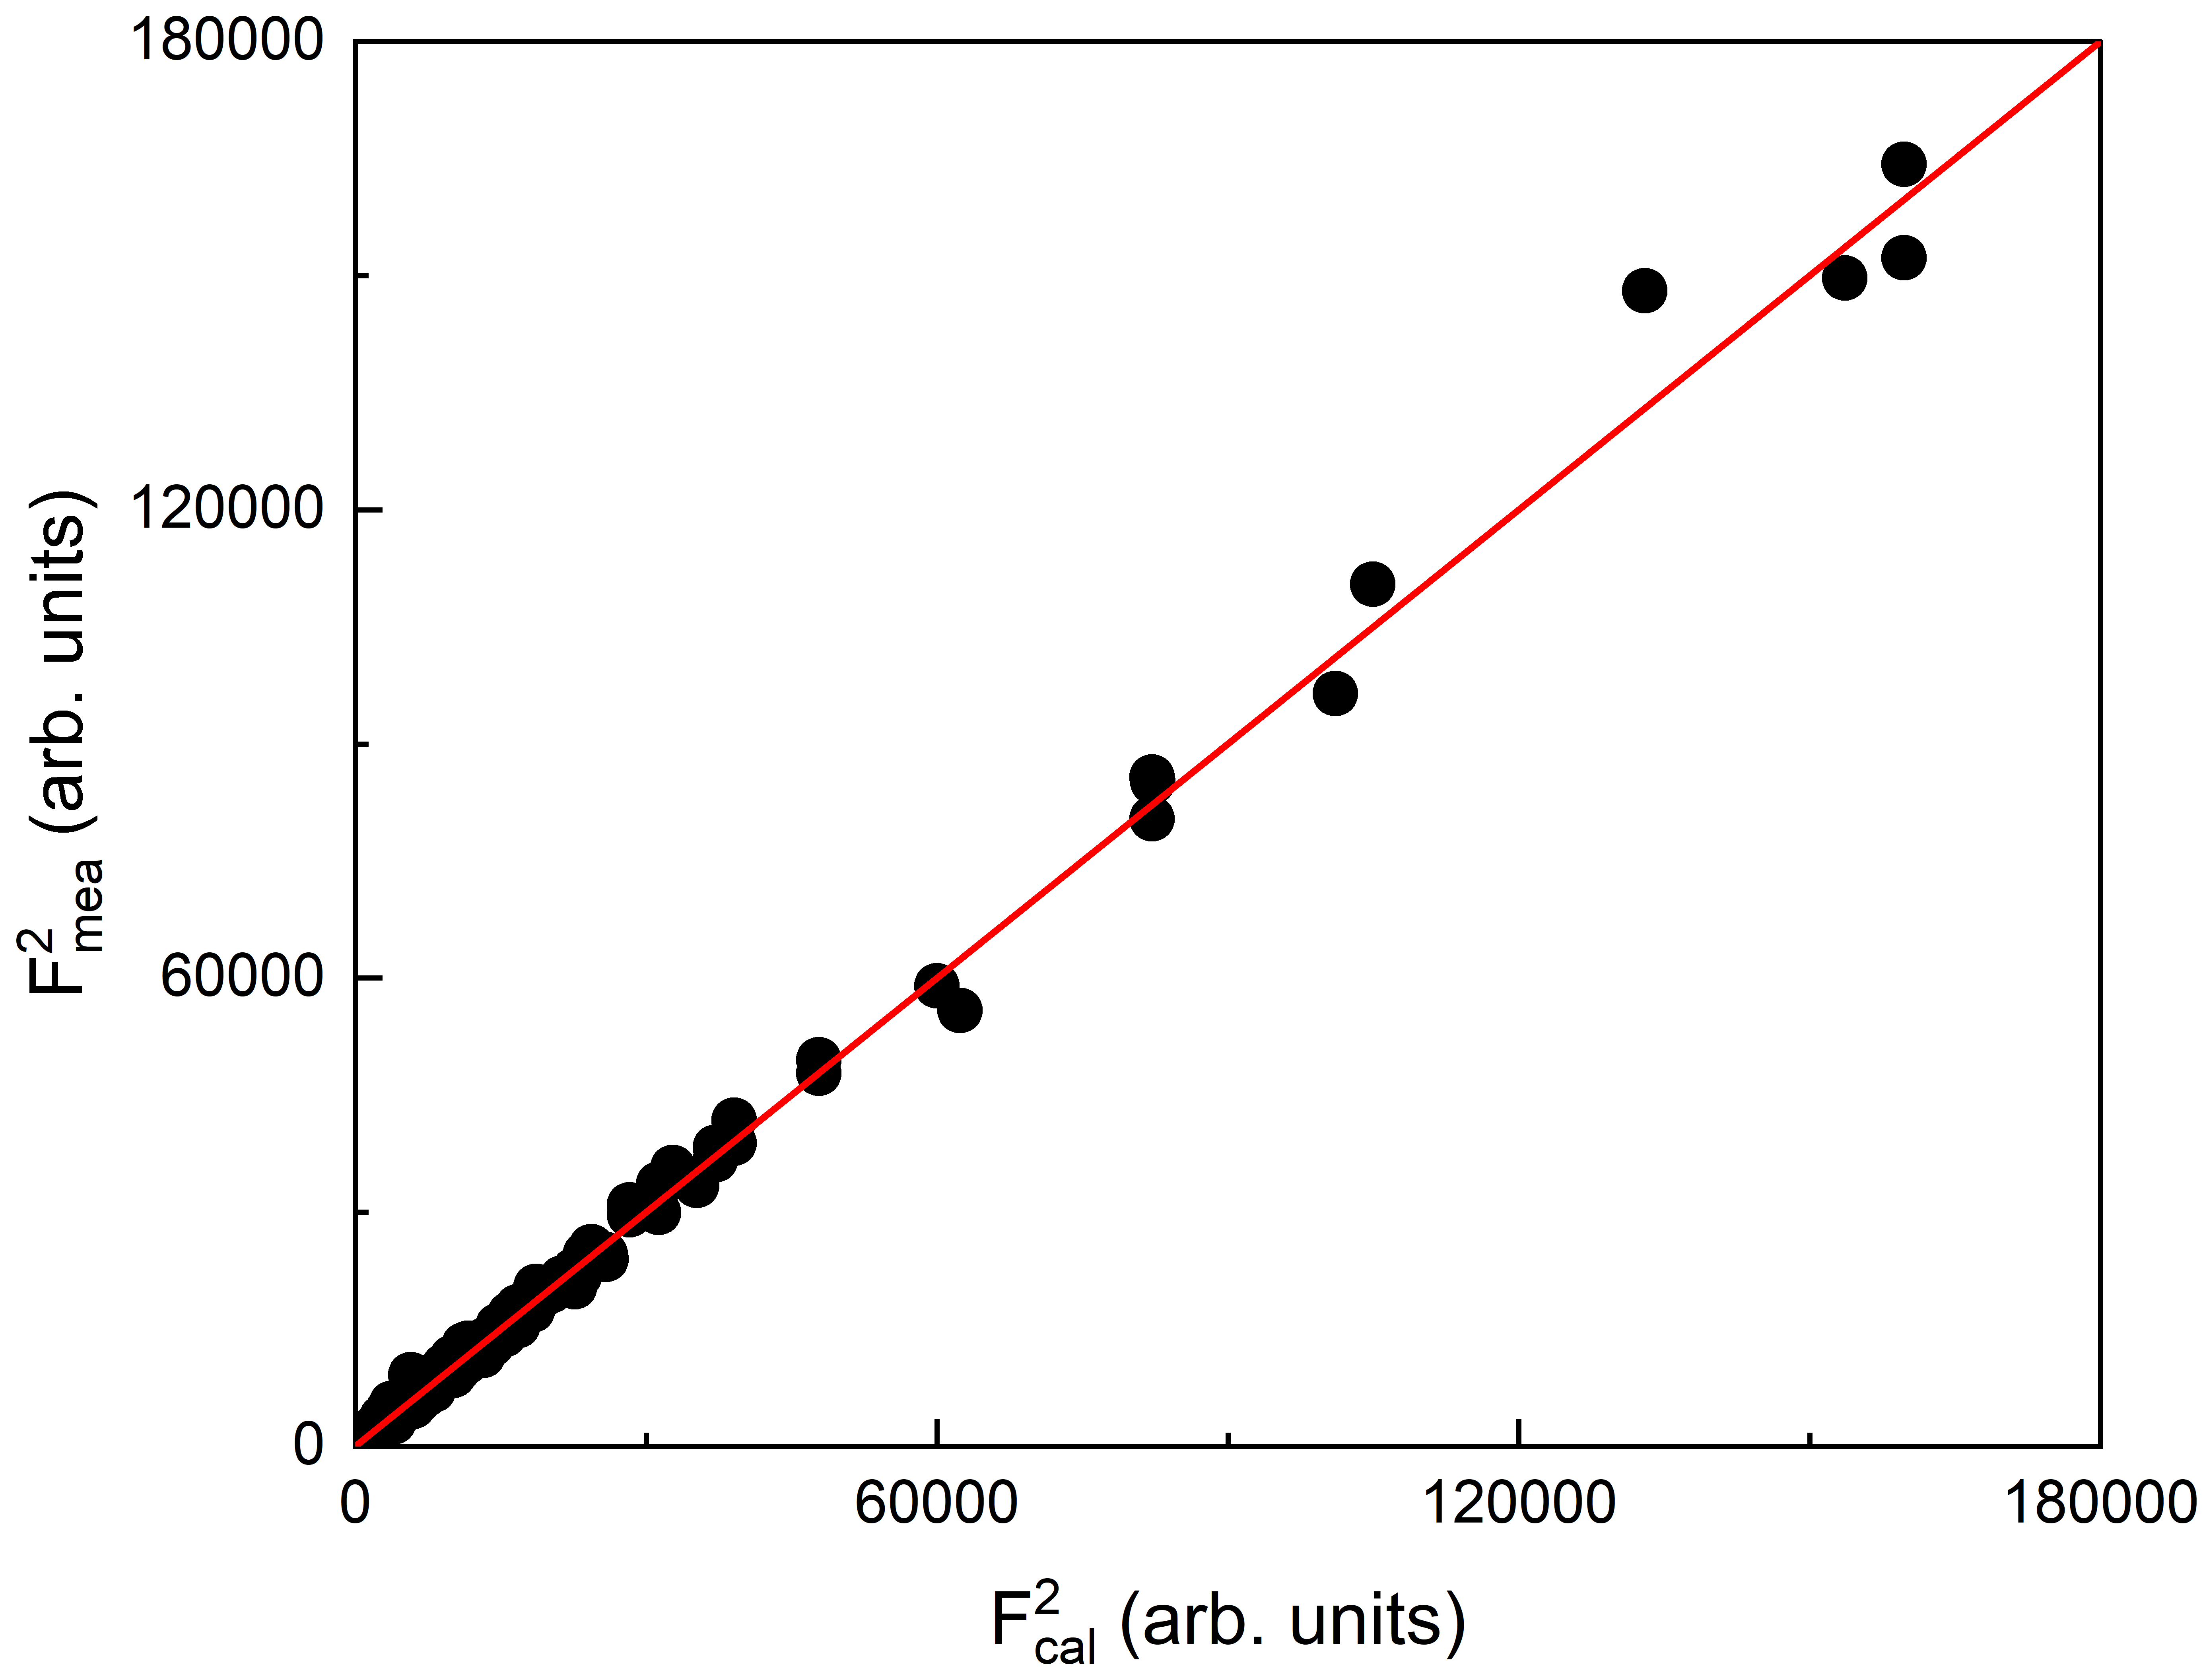
Structural Analysis Ru2Sn – Good-quality single crystal diffraction was performed by XRD measurements. The diffraction data were collected by a XtaLAB Synergy R, HyPix four-circle diffractometer with a graphite-monochromated Mo-K radiation ( = 0.71073 ) at 100 K. The structure was refined by Olex2 software Dolomanov et al. (2009), and the final information was checked by PLATON Spek (2003). Lattice parameters are reported in table 1
| a () | c () | |
|---|---|---|
| Ru2Sn | 6.172 | 9.918 |
| Ru2Sn | 6.1653(1) | 9.9176(2) |
| RuGa0.081Sn1.438 | 6.180 | 94.060 |
| RuGa0.24Sn1.319 | 6.159 | 123.330 |
SM2 Experimental details
Experimental measurements for sample – Measurements of four-terminal AC electrical transport and heat capacity were performed on a Physical Properties Measurement System (Quantum Design). Powder X-ray diffraction measurements were performed at room temperature on a Bruker Advance D8 diffractometer. Structural refinements were performed using TOPAS software.
Experimental measurements for sample – Heat capacity measurement for Ru2Sn in 2 - 100 K was performed by thermal relaxation method using the physical property measurement system (Quantum Design, PPMS). Thermoelectric and thermal transport measurements are performed on the same sample in a Quantum Design PPMS, using the same contacts made of silver paste Dupont 4929N. For thermal measurements, a constant heat current applied by a chip resistance was sent in the basal plane of the single crystal, generating a longitudinal temperature gradient , where is the spacing between the two temperature measurement points along the x-axis. The thermal conductivity along the x-axis can be given by , where is the width of the sample (alone y-axis), is the thickness of the sample. The thermoelectric coefficients are given by measuring the electric potential difference generated by the longitudinal temperature gradient . The Seebeck coefficient (longitudinal thermoelectric coefficient) can be given by , where is the voltage difference between two points parallel to the x-axis and is the distance between the two points. Like the Seebeck coefficient, the Nernst coefficient (transverse thermoelectric coefficient) is given by with applied magnetic field along the z-axis, where is the voltage difference between two points perpendicular to the x-axis and is the distance between the two points.
SM3 Density functional theory
Density functional theory (DFT) calculations were performed on orthorhombic Ru2Sn3-δ (using CASTEP on the Cambridge CSD-3 cluster. Structural relaxation was performed via the Broyden-Fletcher-Goldfarb-Shanno algorithm, with a force tolerance of 0.001 . Final relaxed lattice parameters were (in Angstroms) a=12.271031, b= 9.867111, and c =6.123902. Phonon frequencies were sampled from an interpolated 3x3x5 q-point grid, with a plane-wave cutoff of 700 eV. Note that by convention, the orthorhombic b axis corresponds to the c axis of the high-temperature tetragonal phase. Fig 2 is labeled with orthorhombic a, b, and c axes corresponding to X, Y, and Z respectively.
SM4 Extended data: heat capacity
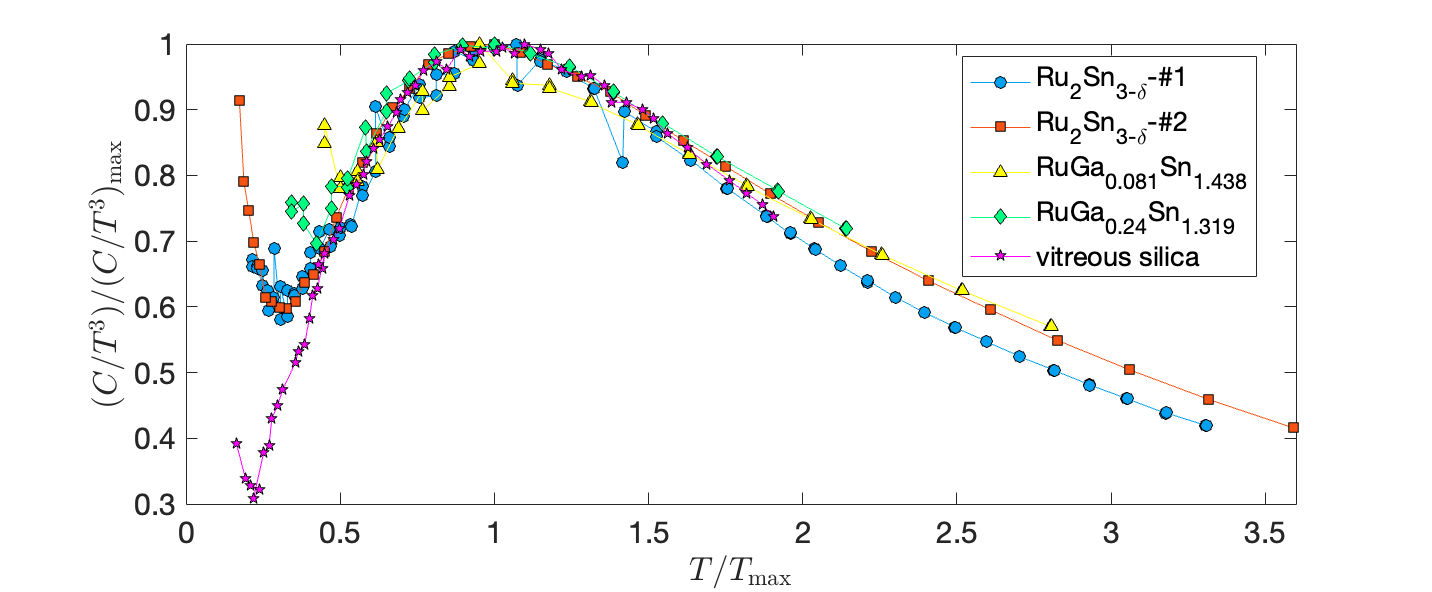
In Fig. S3, we reproduce the experimental data shown in Fig. 1 in the main text after normalizing the temperature by the position of the peak and the heat capacity by its value at . We remind the Reader that:
| Ru2Sn: | ||||
| Ru2Sn: | ||||
| RuGa0.081Sn1.438: | ||||
| RuGa0.24Sn1.319: | ||||
| vitreous silica: | (S1) |
Interestingly, we notice that all the experimental curves collapse into a single curve in the interval . The discrepancy below is due to the different electronic (or, in the case of vitreous silica, two-level systems) contributions that are not subtracted from the experimental data. On the other hand, the discrepancies above are due to the high-energy optical modes, that reflect the microscopic properties of each material, and differ in the various compounds. One can see this explicitly in panel (b) of Fig. 2 in the main text for the case of Ru2Sn: the band of abundant and flat higher optical modes appears at an energy that is approximately twice that of the two soft modes responsible for the peak in the heat capacity at point. In summary, the collapse around the heat-capacity peak evident in Fig. S3 suggests a possible universal and general description of this phenomenon that goes beyond the structural differences between these materials, and even between crystals and glasses.
SM5 Extended analysis: electric resistivity
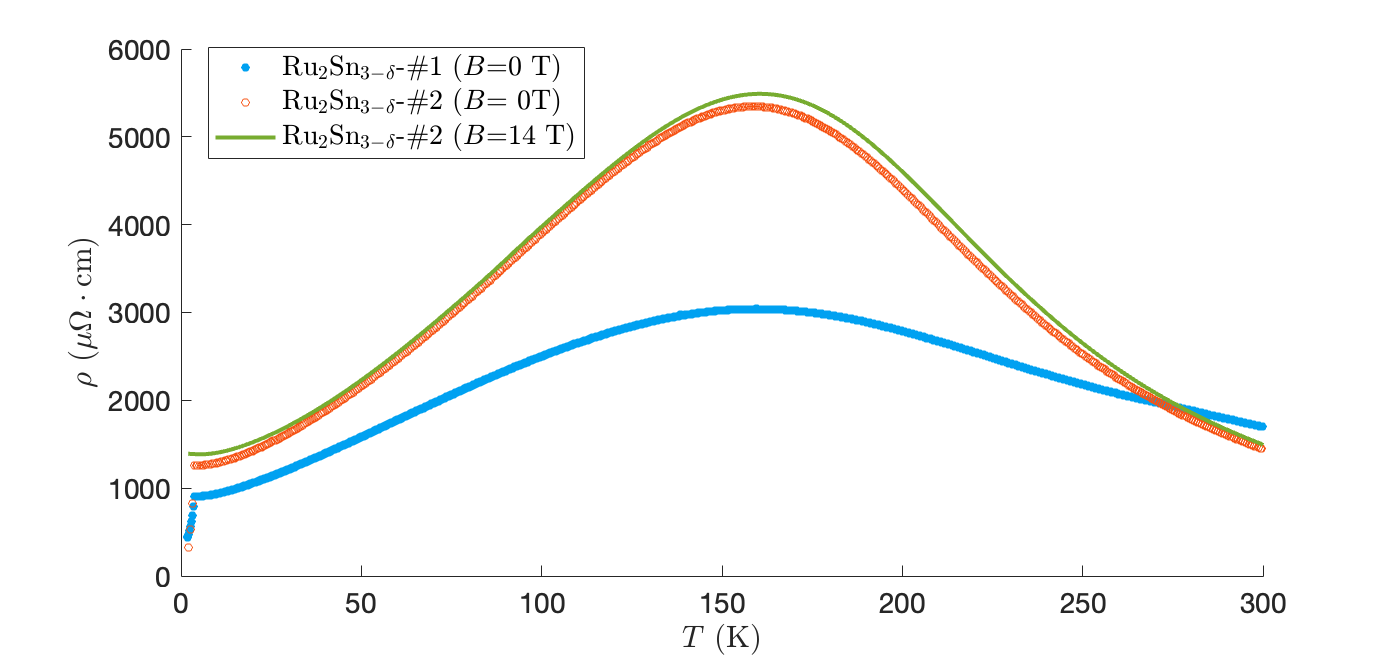
In Fig. S4, we show the measured electric resistivity for Ru2Sn at zero magnetic field (orange) and T magnetic field (green). Two points are worth to be noticed. First, at zero magnetic field, the material exhibits a superconducting phase transition around K that is signaled by a sudden drop in the electric resistivity. Moreover, both measurements show a peak at 160 K, which is consistent with a structural phase transition from orthorhombic at low T to tetragonal at high T and also reported in Refs. Shiomi and Saitoh (2017); Gibson et al. (2014); Wu et al. (2020). As discussed in the main text, this structural phase transition is responsible for one of the two anomalously soft optical modes in Ru2Sn3-δ.
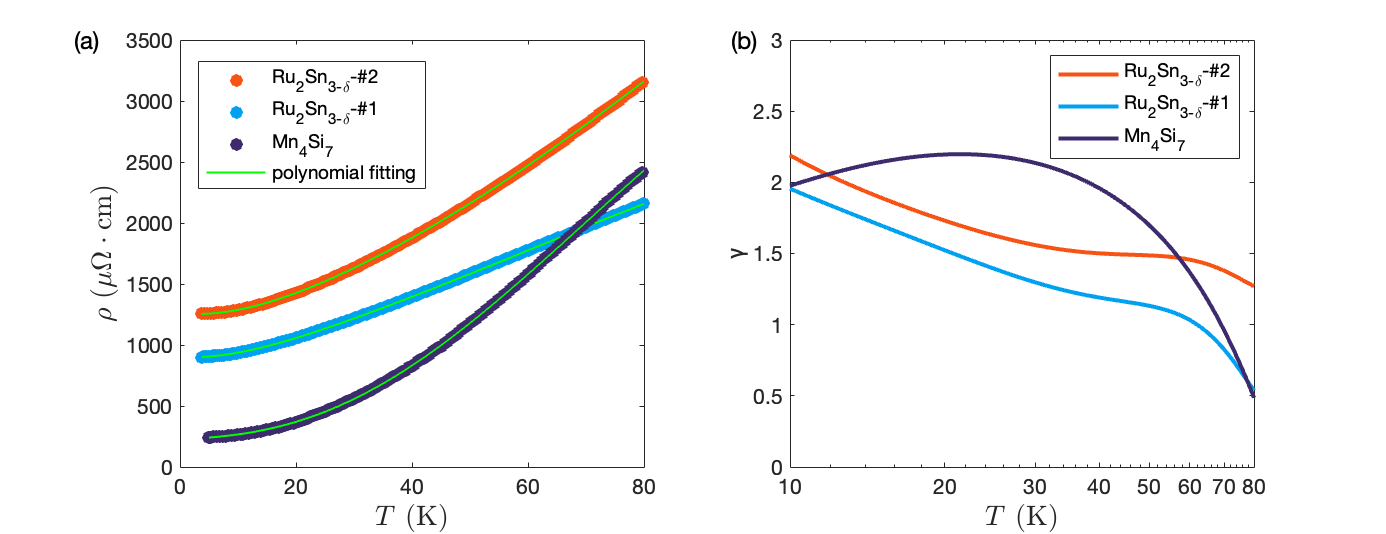
In Fig. S5(a), we show the measured resistivity for Ru2Sn, Ru2Sn and Mn4Si7. We show that all three NCL compounds show a clear to linear crossover and an extended and robust linear in regime. We use a polynomial fit to describe the experimental data and extract the phenomenological scaling parameter:
| (S2) |
The trend of this scaling parameter as a function of temperature is shown in Fig. S5(b).
SM6 Extended analysis: soft modes in Ru2Sn3-δ
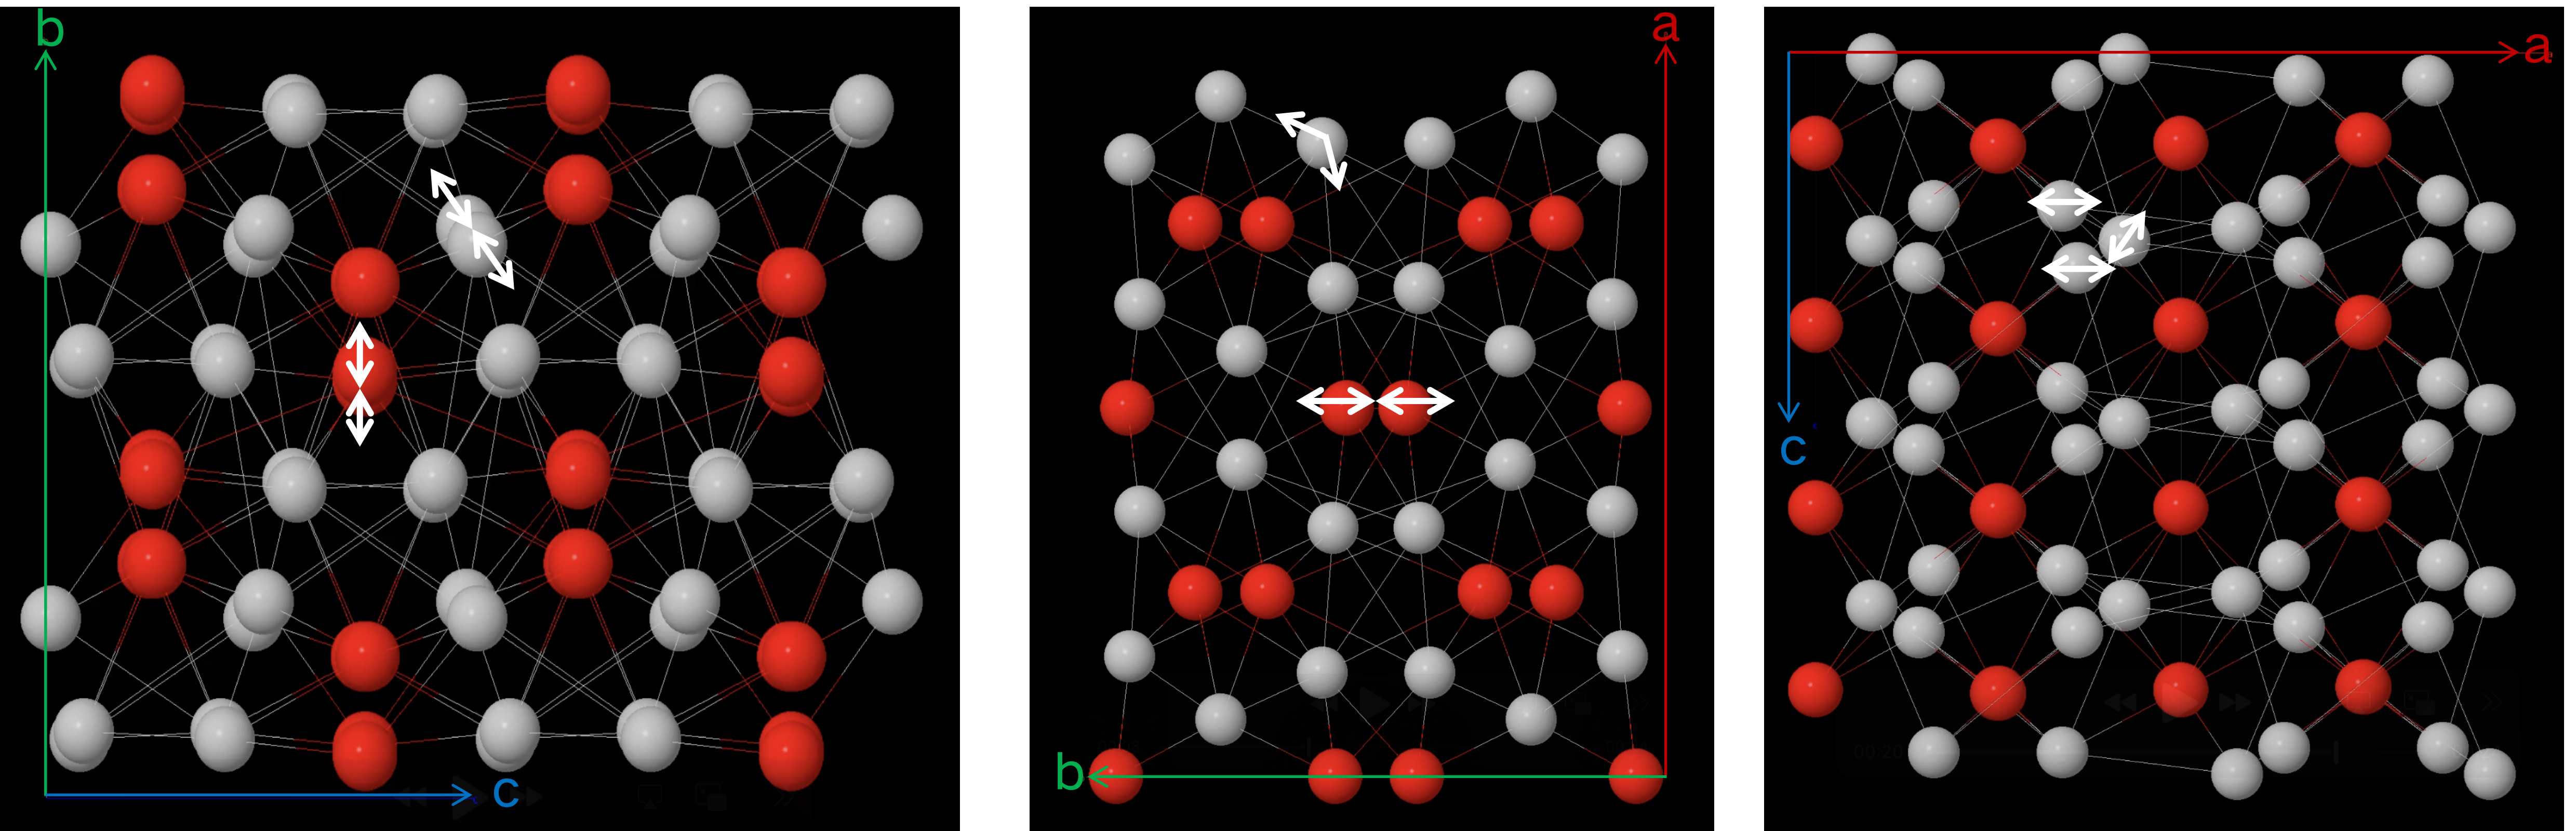
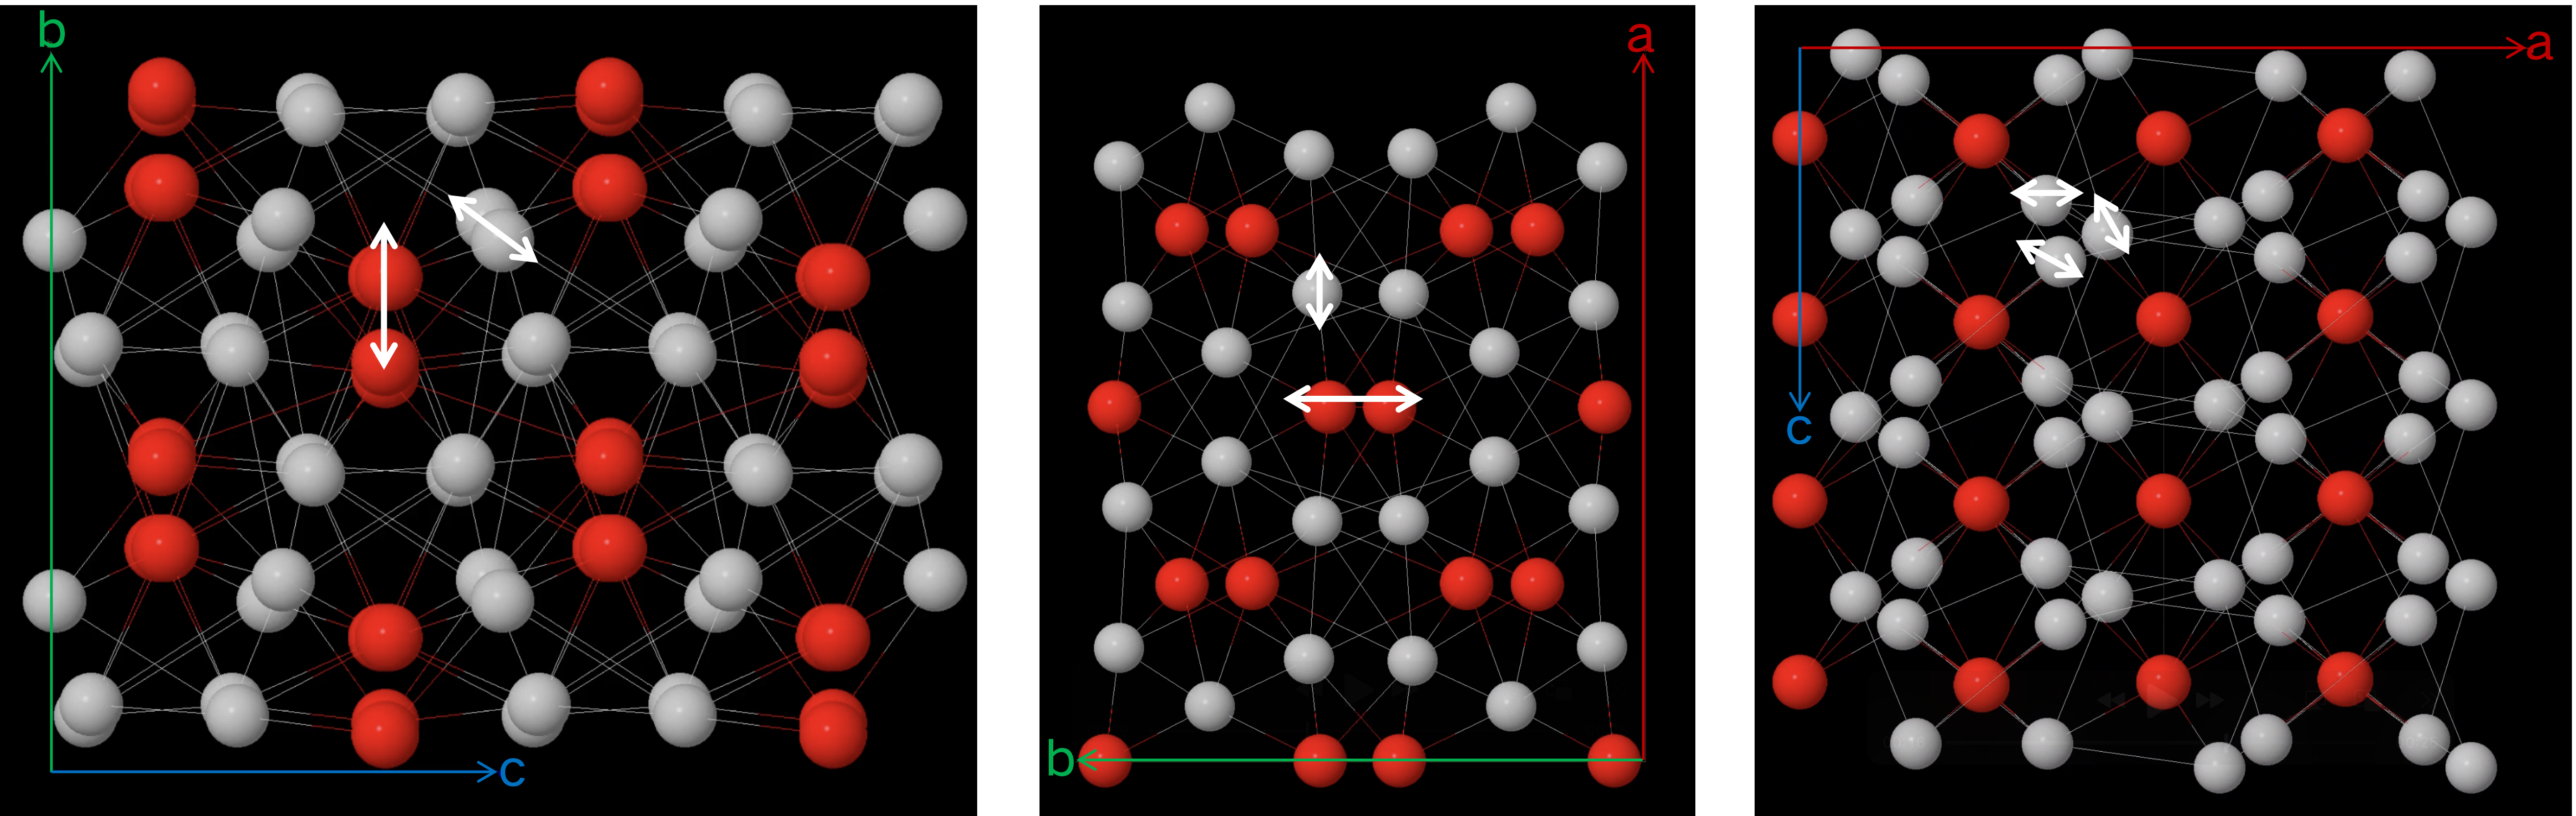
In Figs. S6-S7, we provide three snapshots of the video animation for the two soft optical modes in Ru2Sn3-δ, corresponding to the dispersion relations shown in red color in Fig. 2(c). Animation videos are provided as well in the attachment to this manuscript.
For the Ru2Sn3-δ soft mode (referred to as ’first optical’ in the main text), Sn atoms (silver) oscillate between the positions they hold in the low-temperature orthorhombic phase and the high-temperature tetragonal phase. Ru atoms (red) are mostly static. On the other hand, for the Ru2Sn3-δ twisting mode (referred to as ’second optical’ in the main text), Sn atoms (silver) corkscrew through the lattice of mostly static Ru atoms (red). This second mode is analogous to the twisting mode reported in Mn4Si7 in Ref. Chen et al. (2015) (see also End Matter). Finally, the soft mode has Ag symmetry, while the twisting mode has B1u symmetry.