Insight-HXMT, NICER and NuSTAR views to the newly discovered black hole X-ray binary Swift J151857.0–572147
Abstract
The systematic properties are largely unknown for the black hole X-ray binary Swift J151857.0–572147 newly discovered in the 2024 outburst. The nature of a black hole can be completely defined by specifying the mass and dimensionless spin parameter. Therefore, accurate measurement of the two fundamental parameters is important for understanding the nature of black holes. The joint spectral fitting of a reflection component with simultaneous observations from Insight-HXMT, NICER and NuSTAR reveals for the first time a black hole dimensionless spin of and an inclination angle of degree for this system. Monitoring of the soft state by NICER results in disk flux and temperature following . For the standard thin disk, , so the relationship between the flux and temperature of the disk we measured indicates that the inner radius of the disk is stable and the disk is in the Innermost Stable Circular Orbit. With an empirical relation built previously between the black hole outburst profile and the intrinsic power output, the source distance is estimated as kpc according to the outburst profile and peak flux observed by Insight-HXMT and NICER. Finally, a black hole mass of can be inferred from a joint diagnostic of the aforementioned parameters measured for this system. This system is also consistent with most black hole X-ray binaries with high spin and a mass in the range of 5–20
1 Introduction
Black hole (BH) low-mass X-ray binaries consist of a companion star with a mass less than and a BH. Most of the BH low-mass X-ray binaries can only be observed by X-ray telescopes when they enter into outbursts, during which their different spectral states can be observed and traced in the Hardness-Intensity diagram (HID) (Homan et al., 2001; Fender et al., 2004; Motta et al., 2012). For the Low Hard State (LHS), the emission is dominated by non-thermal emission from the corona/jet, accompanied by a relatively low percentage of thermal emission from the disk (Belloni et al., 2005). The accretion disk is commonly thought to be truncated, but as of now, there is no definitive observational evidence that the accretion disk is truncated in the LHS (Miller et al., 2006; Reynolds & Miller, 2013; Draghis et al., 2024). As the accretion rate increases, the source passes through the intermediate states (hard and soft intermediate states) to the High Soft State (HSS). In the HSS, where the inner edge of the disk is expected to lie at the Innermost Stable Circular Orbit (ISCO) and dominate the emission in the form of thermal. The non-thermal emission in HSS is relatively weak, usually accounting for less than 25% of the total (Esin et al., 1997; Gierliński et al., 2008).
The nature of a black hole can be completely defined by specifying two parameters: mass and dimensionless spin . Therefore, accurate measurement of the two fundamental parameters is important for understanding the nature of black holes. The spin of a black hole fundamentally changes the geometry of spacetime. The gravitational well of an extreme Kerr black hole of the same mass is significantly deeper compared to a spinless black hole, resulting in a much harder X-ray spectrum and significantly enhancing its efficiency in converting the accreted rest mass into radiant energy. And the spin of black holes plays an important role in the mechanism of jets, core collapse of gamma-ray bursts, gravitational-wave astronomy in predicting the waveforms of merging black holes, and so on. (Blandford & Znajek, 1977; Woosley, 1993; Zhang et al., 1997; McClintock et al., 2006; Campanelli et al., 2006; Steiner et al., 2011) The mass of a black hole provides a physical scale. The mass distribution of such black holes can provide important clues to the end stages of the evolution of massive stars.
The BH spin can be inferred from fitting the continuum and reflection spectra. The continuum spectrum approach requires an inner disk to stay around ISCO, independent mass, inclination, and distance measurements, and an assumption about the color correction factor, and many models can be used to estimate BH spin e.g. kerrbb, kerrbb2 (Zhang et al., 1997; Li et al., 2005), while the reflection spectrum, approach deals with the broadened iron line and the Compton hump around 20 keV (Brenneman & Reynolds, 2006; Miller et al., 2009), commonly used models are the relxill family, etc.(Dauser et al., 2016). The BH mass measurement is usually a tough task. The most reliable BH mass estimation comes from the mass function obtained from observing the orbital modulation of the line emission from the companion (Kalogera & Baym, 1996; Tetarenko et al., 2016). BH mass can also be constrained from the merger of the compact objects, and BHs discovered by the Laser Interferometer Gravitational-Wave Observatory and its Virgo interferometer (LIGO/Virgo) cover a rather wide mass range of (Bodensteiner et al., 2022). For other approaches, Peng et al. (2023, 2024) reported the BH mass of SLX 1746–331 by assuming its HSS reaches 30% , which results in a BH mass similar to that derived from an empirical relation of BH mass with disk temperature.
Swift J151857.0–572147 is a new black hole X-ray binary first observed by SWIFT/BAT. A spectral fit to the combined Swift/XRT data shows a power-law slope with a photon index of 1.780.02 (Kennea et al., 2024a). Cowie et al. (2024) found that the radio spectrum of the source is inverted with a preliminary spectral index of +0.5, where flux density as a function of frequency () is proportional to . This inverted index and the reported X-ray photon index of +1.78 are consistent with an X-ray binary in the hard state, suggesting that Swift J151857.0–572147 is either a black hole or (radio-bright) neutron star X-ray binary. An extremely bright radio flare was detected by ATCA On March 9, which is usually suggestive of having discrete ejecta from a BH X-ray binary during the transition between hard and soft X-ray states (Carotenuto & Russell, 2024). Subsequently, Swift/XRT observation of Swift J151857.0–572147 confirmed a likely transition to the soft state on March 10 (Del Santo et al., 2024). The HI spectroscopic distance constraints for Swift J151857.0–572147 give a rather large range of 4.48–15.64 kpc (Burridge et al., 2024). By taking a distance of 10 kpc, Mondal et al. (2024) fitted the joint IXPE and NuSTAR spectra and reported rather broad parameter coverages: for BH spin, °° for disk inclination, for BH mass. Chatterjee et al. (2024) detected type C quasi-periodic oscillations (QPOs) in Swift J151857.0–572147 with Insight-HXMT data.
With the observations from Insight-HXMT, NICER, and NuSTAR we perform the first detailed investigation upon the systematic properties of Swift J151857.0–572147. In Section 2, we describe the observations and data reduction. The detailed results are presented in Section 3. The results are then discussed, and the conclusions are presented in Section 4.
2 Observations and Data reduction
| NICER | Observed date | Exposure Time |
|---|---|---|
| ObsID | (MJD) | (s) |
| 7204220111 | 60387.55 | 4193 |
| 7661010101 | 60404.18 | 3907 |
| 7204220112 | 60405.22 | 569 |
| 7204220113 | 60408.90 | 228 |
| 7204220114 | 60409.16 | 404 |
| 7661010103 | 60412.06 | 2682 |
| 7204220115 | 60412.77 | 262 |
| 7204220116 | 60413.67 | 799 |
| 7204220117 | 60414.06 | 1411 |
| 7204220118 | 60415.41 | 1065 |
| 7204220119 | 60416.25 | 1265 |
| 7204220120 | 60417.29 | 565 |
| 7661010104 | 60417.41 | 3218 |
| 7661010105 | 60425.09 | 2474 |
| 7661010107 | 60433.02 | 2021 |
2.1 NICER
NICER was launched by the Space X Falcon 9 rocket on 3 June 2017 (Gendreau et al., 2016). NICER has a large effective area and high temporal resolution in soft X-ray band (0.2–12 keV), which may allow us to study black body components at low temperatures better. We selected NICER observations during the soft state of Swift J151857.0–572147, covering a time zone from MJD 60387–MJD 60433.
We use the official software HEASOFT V6.33/NICERDAS v012 with the latest CALDB xti20240216 for NICER data analysis. NICER data are reduced using the standard pipeline tool nicerl2111https://heasarc.gsfc.nasa.gov/lheasoft/ftools/headas/nicerl2.html. We extract light curves using nicerl3-lc222https://heasarc.gsfc.nasa.gov/docs/software/lheasoft/ftools/headas/nicerl3-lc.html in 1–4 keV, 4–10 keV and 1–10 keV. To extract the spectrum, we utilize nicerl3-spect333https://heasarc.gsfc.nasa.gov/docs/software/lheasoft/help/nicerl3-spect.html, employing the ”nibackgen3C50444https://heasarc.gsfc.nasa.gov/docs/nicer/analysis_threads/background/” model to estimate the background for spectral analysis. We select an energy range of 2–10 keV for spectrum fitting. Additionally, nicerl3-spect automatically applies the systematic error using niphasyserr. In the energy range of 0.3–10 keV, the systematic error is about 1.5%.
2.2 NuSTAR
NuSTAR is the first mission to employ two focusing techniques for detecting hard X-rays at 3–79 keV. It was launched on June 13, 2012, at 9 am PDT. (Harrison et al., 2013). As shown in Table LABEL:observation, NuSTAR conducted two observations of Swift J151857.0–572147. For NuSTAR data analysis, we employ the software HEASOFT V6.33/NuSTARDAS v2.1.2 with the calibration database (CALDB 20230613) to reduce the data. We extract NuSTAR-filtered data using the standard pipeline program nupipeline, The spectrum is extracted from a 120′′ circle region centered on the source and the background is generated from a 60′′ circle region away from the source. We utilized FPMA and FPMB 3–78 keV data for spectral analysis.
2.3 Insight-HXMT
Insight-HXMT, the first Chinese X-ray astronomy satellite, was successfully launched on June 15, 2017 (Zhang et al., 2014, 2018, 2020). The satellite is equipped with three scientific payloads: the low-energy X-ray telescope (LE) featuring an SCD detector operating in the 1–15 keV range with an effective area of 384 (Chen et al., 2020), the medium-energy X-ray telescope (ME) equipped with a Si-PIN detector covering 5–35 keV with an effective area of 952 (Cao et al., 2020), and the high-energy X-ray telescope (HE) utilizing a phoswich NaI(CsI) detector for the 20–250 keV energy range with an effective area of 5100 (Liu et al., 2020).
The Insight-HXMT began observing Swift J151857.0–572147 on March 4, 2024 and ended on March 17. However, due to contamination by Cir X–1 which is located in the field of view at a position close to Swift J151857.0–572147, only the Insight-HXMT HE and ME observations simultaneous with NICER are adopted for joint spectral analysis (Table LABEL:observation). This is because during the joint observations, Cir X–1 was in dip phase with a rather soft energy spectrum and hence the expected count rates at ME and HE bands are rather small.
We extract the data from LE ME and HE using the Insight-HXMT Data Analysis software HXMTDAS v2.06. The data are filtered with the criteria recommended by the Insight-HXMT Data Reduction Guide v2.06 555http://hxmtweb.ihep.ac.cn/SoftDoc/648.jhtml. Due to the relatively high impact of Cir X–1 on LE, the energy bands considered for spectral analysis are ME 8–28 keV and HE 28–100 keV. One percent systematic error is added to data (Liao et al., 2020), and errors are estimated via Markov Chain Monte-Carlo (MCMC) chains with a length of 20000.
3 Results
3.1 Light curve and Hardness-intensity diagram
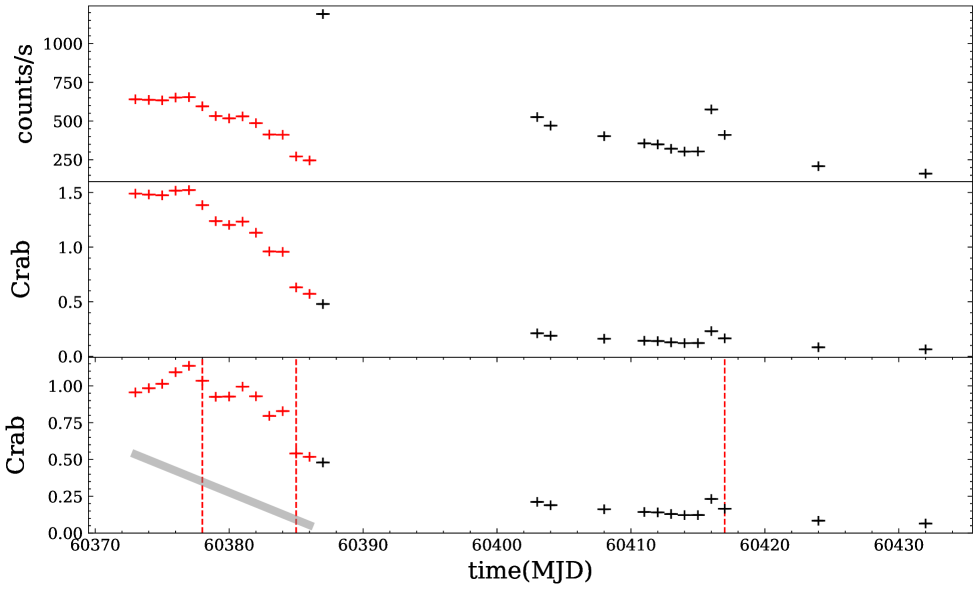
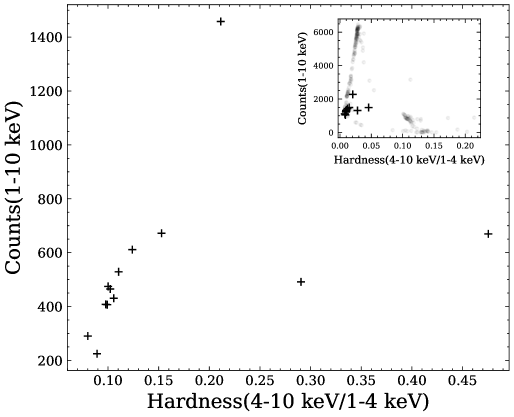
Figure 1 shows the light curves of Swift J151857.0–-572147 observed by Insight-HXMT and NICER during the 2024 outburst. The red dots represent Insight-HXMT observations and the black dots represent NICER observations. We normalized the light curves to the Crab Nebula by using the count rate ratios between Insight-HXMT and NICER. Since Swift J151857.0–572147 is 0.3 degrees away from Cir X–1, both sources are enclosed in the field of view of Insight-HXMT. Fortunately, Cir X–1 has a relatively stable profile for flux evolution over its orbital period of 16.6 days, the overall flux evolution trend at the LE band can be constructed with Insight-HXMT observations outside the outburst of Swift J151857.0–572147. So we extract the Cir X–1 LE light curve at LE 2-12 keV, then normalize it with the counts of Crab in the same energy band and fit it to get the flux evolution trend. (see the grey shading in the bottom panel of Figure 1). Then we subtract off the Cir X–1 and get the LE light curve of the Swift J151857.0–572147 at 2–12 keV.
The HID is built with NICER light curves in 1–4, 4–10, and 1–10 keV. The hardness is defined as the count rate ratio of 4–10 keV to 1–4 keV, while the intensity takes the count rate of 1–10 keV. As shown in Figure 2, the source was in a soft state during almost the whole NICER observations.
3.2 The spectral analysis
| NICER | Observed date | Exposure Time | |
|---|---|---|---|
| ObsID | (MJD) | (s) | |
| 7204220111 | 60387.5 | 4193 | |
| Insight-HXMT | Observed date | Exposure time | Exposure time |
| ME | HE | ||
| ObsID | (MJD) | (s) | (s) |
| P061437400802 | 60386.7 | 3704 | 1925 |
| NuSTAR | Observed date | Exposure time | Exposure time |
| FPMA | FPMB | ||
| ObsID | (MJD) | (s) | (s) |
| 91001311002 | 60386.7 | 13880 | 14300 |
| 91001311004 | 60387.6 | 9195 | 9449 |
| Model | Parameter | 91001311002+HXMT | NICER+91001311004 | |
| tbabs | ||||
| diskbb | ||||
| norm | ||||
| relxill | ||||
| [°] | ||||
| index1 | ||||
| index2 | ||||
| logxi | ||||
| norm[] | ||||
| constant | con[NICER] | |||
| con[NFPMA] | ||||
| con[NFPMB] | ||||
| con[ME] | ||||
| con[HE] | ||||
| /(d.o.f.) | 1.06 | 1.01 |
-
•
Note:
**These parameters are fixed during the fitting.
As shown in Table LABEL:observation, there are two sets of simultaneous joint observations from Insight-HXMT, NICER, and NuSTAR. One set is from Insight-HXMT and NuSTAR at the time around MJD 60386 and another set is from NICER and NuSTAR at the time around MJD 60387. Accordingly, joint spectral fittings are carried out for each of the observational sets.
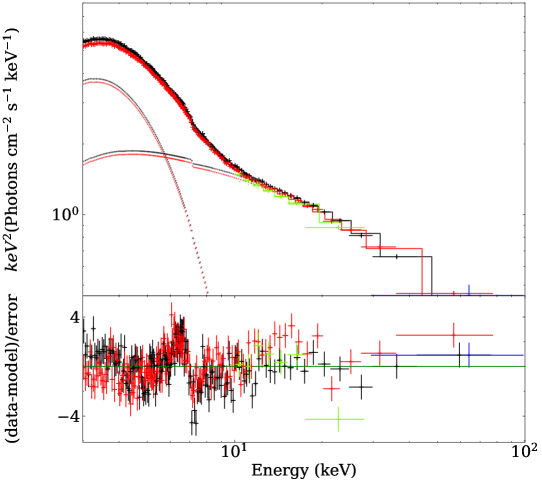
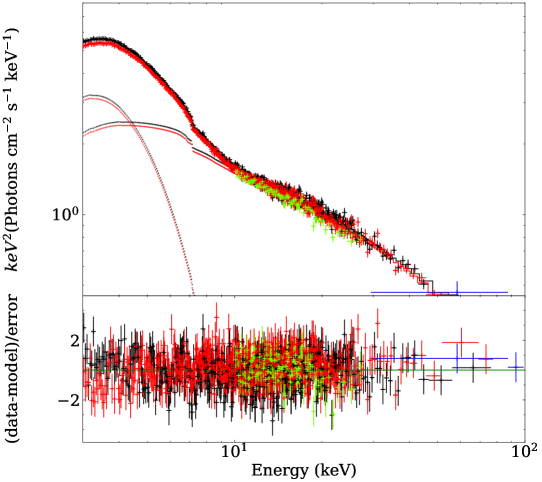
We account for interstellar absorption with the tbabs model (Wilms et al., 2000), where photoelectric cross sections were given in Verner et al. (1996). We fit the multi-temperature blackbody component of the accretion disk with diskbb (Mitsuda et al., 1984). Cutoffpl is used to fit non-thermal emission. Constant is introduced to balance the calibration discrepancies between different telescopes. In order to take into account the differences between the different spectral indices of NICER and NuSTAR, we allow the temperature of the disk and spectral index to vary. At this step, We find a poor-fitting result with /(d.o.f)=1.34, and a significant reflection component in the residuals (Figure 3). Therefore, we replace cutoffpl with the relxill V2.3 model to fit the reflectance component of the spectrum (Dauser et al., 2016), which results in a much improved fit, /(d.o.f) = 1.06 (Figure 4). Therefore our fitting model M1 is: constant*tbabs*(diskbb+relxill). We fix at -1 and the disk at ISCO. The break radius and the outer radius of the disk are fixed at 15 and 400, respectively, and both emission indices are fixed at 3. The spectral parameters are shown in Tabel LABEL:parameter. The BH spin and disk inclination averaged over the two observational sets are and degree, respectively. The reflection fraction is relatively small and is defined in the frame of the primary source as the ratio of intensity emitted towards the disk compared to escaping to infinity. This indicates that the corona is less illuminated by the disk. The normalization of relxill is also smaller, indicating a lower percentage of reflected fluxes. The ionization of the accretion disk and the iron abundance of the material in the accretion disk are also higher which is related to the lower electron number density () of the relxill. This relatively high metal abundance has also appeared in other BH X-ray binaries such as MAXI J1820+070, GX 339–4 and Cyg X–1 (Fürst et al., 2015; Parker et al., 2015; You et al., 2021). We replace relxill with the reflection model relxillcp for higher density disks, so our model M1* is: constant*tbabs(diskbb+relxillcp), The parameters are shown in Table LABEL:relxillcp. The BH spin and disk inclination averaged over the two observational sets are and degree, respectively, which is consistent with the results obtained for M1. Both the ionization parameters and the iron abundance have also decreased, but the iron abundance is still high because the density of the disk is , which is lower than the typical values in the standard thin disk model (Shakura & Sunyaev, 1973).
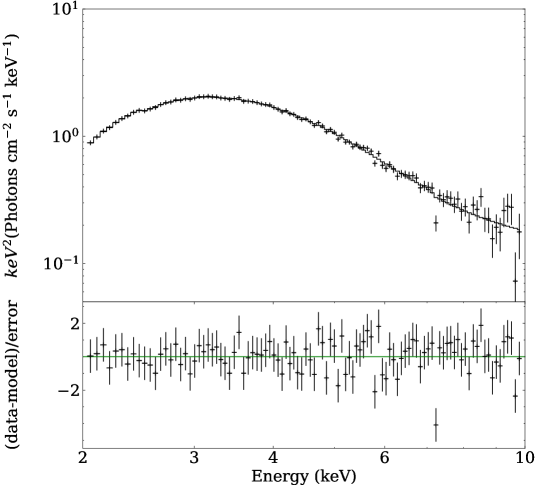
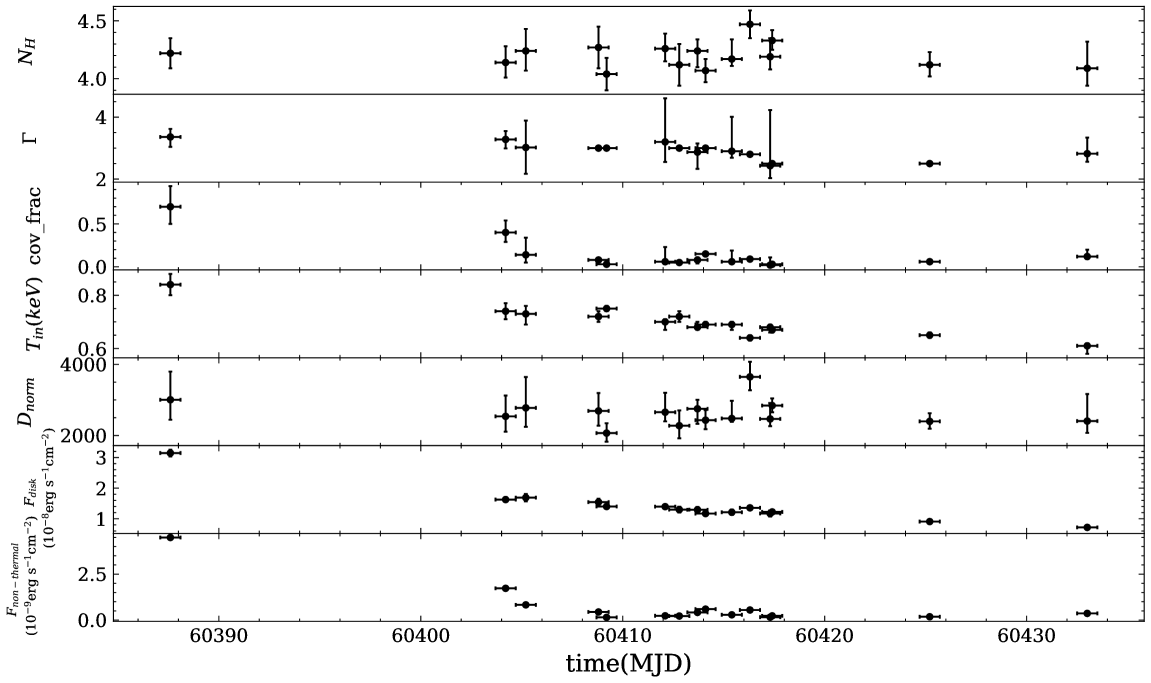
Since the NICER observations are in the soft state of the outburst, we fit the NICER spectrum by removing the relxill in M1. We find that the fit is poor, with /(d.o.f)=1.41, due to the existence of a significant Compton component in the residuals. By introducing an additional thcomp model to account for the Compton component, the fit is largely improved with /(d.o.f)=0.85 (Figure 5). So our model M2 is tbabs*thcomp*diskbb and the fluxes of the disk and non-thermal in the 0.001–100 keV are estimated with cflux. The evolution of the spectral parameters is shown in Figure 6, where the percentage of non-thermal emission is as low as less than 10%, consistent with having a soft state of BHXRBs. Additionally, the normalization of diskbb remains almost unchanged during the outburst.
3.3 Properties of the system and the compact object
| (MJD) | (Crab) | (days) | (days) | (days) | ( ergs) | kpc | |
|---|---|---|---|---|---|---|---|
| Swift J151857.0-572147 | 60377 | ||||||
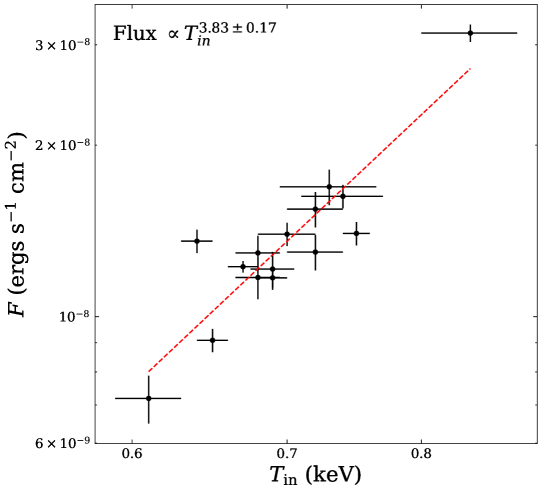
As shown in Figure 7, we fit the temperature and flux of the disk obtained with M2 using the formula , and we find that . For the standard thin disk, the luminosity of the disk is approximately given by , where , , and represent the inner radius, the temperature of the disk, and the Stefan-Boltzmann constant, respectively. So the formula between the flux and temperature of the disk we measured indicates that the inner radius of the disk is stable and the disk is in the ISCO during the HSS of the outburst. From diskbb we have , where is the inner disk radius, is the distance of the source in units of 10 kpc, and is the inclination angle. With an inclination angle of degree as aforementioned in the spectral analysis, the inner disk radius can be deduced as km. However, the previous rough estimation of the distance kpc prevents from further constraining the .
For the distance measurements, Yan & Yu (2015) have statistically investigated the properties of 110 bright X-ray outbursts out of 36 low-mass X-ray binary transients observed by the All-Sky Monitor on RXTE from 1996–2011. They derived a number of outburst characteristics, including peak X-ray luminosity, change rate of luminosity on a daily timescale, e-folding rise and decay timescales, outburst duration, and total radiated energy. They built the relationships between the total radiated energy and the peak luminosity as , and the relationship between the total radiated energy and the e-folding rise and decay timescales as , , , , , and . For Swift J151857.0–572147, we choose , , and from the light curve where the fluxes are about 90%, 50%, and 10% of the peak flux (red dashed lines in Figure 1). The three e-folding decay timescales are then calculated using the formula (Yan & Yu, 2015) and the corresponding three total radiated energies are obtained from the relationship between the total radiated energy and the e-folding decay timescales (Table LABEL:E). The peak flux of Swift J151857.0–572147 is about 1.41 Crab, corresponding to a flux of about . As shown in Table LABEL:E, we can estimate the three distances based on the three total radiated energies obtained. Accordingly, the average distance can be deduced as kpc. With this distance we have km. Since the inner disk shall hold at for a BH spin of , the mass of the BH harbored in Swift J151857.0–572147 can be finally inferred as .
4 discussion and conclusion
We have carried out a spectral analysis of the Swift J151857.0–572147 outburst using data from NICER, Insight-HXMT and NuSTAR. Almost the entire fundamental parameters (e.g. the BH spin, BH mass, disk inclination, and source distance, etc.) of this newly discovered XRB system are largely uncovered for the first time.
As a newly discovered BH low-mass X-ray binary system, the fundamental parameters of Swift J151857.0–572147 are largely unknown despite a few reports claiming some rough estimations. To simultaneously constrain the spin, inclination, and mass solely with kerrbb is usually challenging and heavily influenced by whether the distance parameter is properly set. BH spin and disk inclination can be measured in the absence of the knowledge of the BH mass and the source distance, in an approach by fitting the disk reflection feature and the broadened iron line. Fortunately, the joint Insight-HXMT, NICER and NuSTAR observations of Swift J151857.0–572147 provide data with high quality and broad energy coverage, essential for disentangling in the spectrum the reflection component. As a result, the BH spin and the disk inclination Swift J151857.0–572147 are precisely refined as and degree, respectively. As shown in Table LABEL:parameter, adoption of the flavor of relxill can well account for the reflection component. We notice that an alternative flavor of relxillcp can also fit the spectrum and have little influence on the measurements of BH spin and inclination angle. An unusually high abundance is required from the measured , which is also reported in outbursts of some other BH XRB systems of e.g. MAXI J1820+070, GX 339–4 and Cyg X–1 (Fürst et al., 2015; Parker et al., 2015; You et al., 2021). We try a version of relxill with a high disk density (relxllcp) and find the strange abundance value is an artifact of assuming a low density. Another uncertainty comes from the manner we eliminate the calibration difference by allowing the parameters to vary across instruments of NICER and NuSTAR. We try as well instead with constant and find that, while the fitting gets worse the BH spin and disk inclination can be inferred with fewer changes. Hence we think the BH spin and inclination angle are measured more or less robust.
Swift J151857.0–572147 was observed to have an outburst on March 3, 2024 (MJD 60372), and enter a soft state on March 10, 2024 (MJD 60379) (Kennea et al., 2024b; Del Santo et al., 2024). The peak flux was caught by Insight-HXMT and the soft state was monitored by NICER. Our spectral analysis of the NICER data reveals that in the soft state, the disk flux is proportional to , indicating an inner disk staying around ISCO. Since with a BH spin of and a disk normalization of for Swift J151857.0–572147 we have km, the BH mass can in principle be directly inferred once the source distance is known. A distance of kpc claimed previously in Burridge et al. (2024) highlights the huge uncertainty in distance measurement. As a result, BH mass can fall in a range of , with a notable range of uncertainty. Obviously, refined source distance would be essential for further probing the mass of the BH harbored in Swift J151857.0–572147.
Yan & Yu (2015) conducted a statistical analysis of 110 bright X-ray outbursts from 36 low-mass X-ray binary transients observed by the All-Sky Monitor on RXTE between 1996 and 2011. They measured several outburst characteristics, including peak X-ray luminosity, daily rate of change of luminosity, e-folding rise and decay timescales, outburst duration, and total radiated energy. Since the peak X-ray luminosity is a function of disk mass, which is expected from the disk instability model (DIM) (King & Ritter, 1998; Lasota, 2001), disk mass plays a major role in determining outburst properties (Yu & Dolence, 2007). If one can assume as an approximation that the radiation efficiency is constant, the total radiant energy E should correspond to the disk mass accreted during the outburst. Therefore, they found a positive correlation between the total radiative energy and the peak X-ray luminosity, as well as a positive correlation between the total radiative energy and the time scale of e-folding rise or decay in the outburst. With these relations, distances were estimated for SLX 1746–331, SWIFT J1539.2–6227, SWIFT J1842.5–1124, XTE J1755–324 and XTE J2012+381. By taking the approach in Yan & Yu (2015), and the outburst profile monitored jointly by Insight-HXMT and NICER at 2–12 keV, a distance of kpc can be assigned to Swift J151857.0–572147. Finally, the joint diagnostic upon the systematic properties of Swift J151857.0–572147 ends with a BH mass measured as .
We would like to note that, such an estimation of BH mass may suffer from a few aspects in measuring the inner disk radius with a simplistic version of diskbb. (1) The diskbb model does not include a zero-torque inner boundary condition. Using a model that includes this important physical effect tends to reduce radii by a factor of about 2.2 (See e.g., Zimmerman et al. (2005)), which may reduce the BH mass from to . (2) There is a color correction factor that aims to account for scattering in the disk atmosphere. The color correction factor is 1.70.2 and is minimally affected by mass and accretion rate, indicating a weak dependence of on black hole spin (Shimura & Takahara, 1995). (3) Additionally, there are also relativistic corrections to the diskbb results. Zhang et al. (1997) found that the uncertainty in is 10%, which will cause an error of no more than 20% in the inner radius of the disk. Therefore, the final conservative estimation of BH mass is . We find that, with such a BH mass and aforementioned distance, the outburst gets a peak flux of , and the disk is expected to be described as a thin disk that is not truncated, and not too thick at its smallest radius.
As addressed in Draghis et al. (2023, 2024), BH spin has a series of impacts on our understanding of the outburst behavior for emissions in different energy bands and as well the possible originations of the BH. For the former, the inner disk can reach around the event horizon with high radiation efficiency for an extremely spinning BH. For the latter, it seems that so far we have two populations of BH: the group from observing the BH mergers with the gravitational wave experiments has slow spin, while those observed from XRB outbursts are always highly spinning Draghis et al. (2024). The causality of the different BH populations is not yet known and the discovery of a BH spin in Swift J151857.0–572147 enlarges the BH spin sample, which so far consists of only about 40 BHs held with XRBs, and thus helps to disentangle the models at work in understanding the possible formations of these two BH populations.
References
- Belloni et al. (2005) Belloni, T., Homan, J., Casella, P., et al. 2005, A&A, 440, 207, doi: 10.1051/0004-6361:20042457
- Blandford & Znajek (1977) Blandford, R. D., & Znajek, R. L. 1977, MNRAS, 179, 433, doi: 10.1093/mnras/179.3.433
- Bodensteiner et al. (2022) Bodensteiner, J., Heida, M., Abdul-Masih, M., et al. 2022, The Messenger, 186, 3, doi: 10.18727/0722-6691/5255
- Brenneman & Reynolds (2006) Brenneman, L. W., & Reynolds, C. S. 2006, ApJ, 652, 1028, doi: 10.1086/508146
- Burridge et al. (2024) Burridge, B. J., Miller-Jones, J. C. A., Bahramian, A., et al. 2024, The Astronomer’s Telegram, 16538, 1
- Campanelli et al. (2006) Campanelli, M., Lousto, C. O., & Zlochower, Y. 2006, Phys. Rev. D, 74, 041501, doi: 10.1103/PhysRevD.74.041501
- Cao et al. (2020) Cao, X., Jiang, W., Meng, B., et al. 2020, Science China Physics, Mechanics, and Astronomy, 63, 249504, doi: 10.1007/s11433-019-1506-1
- Carotenuto & Russell (2024) Carotenuto, F., & Russell, T. D. 2024, The Astronomer’s Telegram, 16518, 1
- Chatterjee et al. (2024) Chatterjee, K., Pujitha Suribhatla, S., Mondal, S., & Singh, C. B. 2024, arXiv e-prints, arXiv:2406.17629, doi: 10.48550/arXiv.2406.17629
- Chen et al. (2020) Chen, Y., Cui, W., Li, W., et al. 2020, Science China Physics, Mechanics, and Astronomy, 63, 249505, doi: 10.1007/s11433-019-1469-5
- Cowie et al. (2024) Cowie, F. J., Carotenuto, F., Fender, R. P., et al. 2024, The Astronomer’s Telegram, 16503, 1
- Dauser et al. (2016) Dauser, T., García, J., & Wilms, J. 2016, Astronomische Nachrichten, 337, 362, doi: 10.1002/asna.201612314
- Del Santo et al. (2024) Del Santo, M., Russell, T. D., Marino, A., & Motta, S. 2024, The Astronomer’s Telegram, 16519, 1
- Draghis et al. (2024) Draghis, P. A., Miller, J. M., Costantini, E., et al. 2024, ApJ, 969, 40, doi: 10.3847/1538-4357/ad43ea
- Draghis et al. (2023) Draghis, P. A., Miller, J. M., Zoghbi, A., et al. 2023, ApJ, 946, 19, doi: 10.3847/1538-4357/acafe7
- Esin et al. (1997) Esin, A. A., McClintock, J. E., & Narayan, R. 1997, ApJ, 489, 865, doi: 10.1086/304829
- Fender et al. (2004) Fender, R. P., Belloni, T. M., & Gallo, E. 2004, MNRAS, 355, 1105, doi: 10.1111/j.1365-2966.2004.08384.x
- Fürst et al. (2015) Fürst, F., Nowak, M. A., Tomsick, J. A., et al. 2015, ApJ, 808, 122, doi: 10.1088/0004-637X/808/2/122
- Gendreau et al. (2016) Gendreau, K. C., Arzoumanian, Z., Adkins, P. W., et al. 2016, in Society of Photo-Optical Instrumentation Engineers (SPIE) Conference Series, Vol. 9905, Space Telescopes and Instrumentation 2016: Ultraviolet to Gamma Ray, ed. J.-W. A. den Herder, T. Takahashi, & M. Bautz, 99051H, doi: 10.1117/12.2231304
- Gierliński et al. (2008) Gierliński, M., Done, C., & Page, K. 2008, MNRAS, 388, 753, doi: 10.1111/j.1365-2966.2008.13431.x
- Harrison et al. (2013) Harrison, F. A., Craig, W. W., Christensen, F. E., et al. 2013, ApJ, 770, 103, doi: 10.1088/0004-637X/770/2/103
- Homan et al. (2001) Homan, J., Wijnands, R., van der Klis, M., et al. 2001, ApJS, 132, 377, doi: 10.1086/318954
- Kalogera & Baym (1996) Kalogera, V., & Baym, G. 1996, ApJ, 470, L61, doi: 10.1086/310296
- Kennea et al. (2024a) Kennea, J. A., Lien, A. Y., D’Elia, V., et al. 2024a, The Astronomer’s Telegram, 16500, 1
- Kennea et al. (2024b) —. 2024b, The Astronomer’s Telegram, 16500, 1
- King & Ritter (1998) King, A. R., & Ritter, H. 1998, MNRAS, 293, L42, doi: 10.1046/j.1365-8711.1998.01295.x
- Lasota (2001) Lasota, J.-P. 2001, New A Rev., 45, 449, doi: 10.1016/S1387-6473(01)00112-9
- Li et al. (2005) Li, L.-X., Zimmerman, E. R., Narayan, R., & McClintock, J. E. 2005, ApJS, 157, 335, doi: 10.1086/428089
- Liao et al. (2020) Liao, J.-Y., Zhang, S., Lu, X.-F., et al. 2020, Journal of High Energy Astrophysics, 27, 14, doi: 10.1016/j.jheap.2020.04.002
- Liu et al. (2020) Liu, C., Zhang, Y., Li, X., et al. 2020, Science China Physics, Mechanics, and Astronomy, 63, 249503, doi: 10.1007/s11433-019-1486-x
- McClintock et al. (2006) McClintock, J. E., Shafee, R., Narayan, R., et al. 2006, ApJ, 652, 518, doi: 10.1086/508457
- Miller et al. (2006) Miller, J. M., Homan, J., Steeghs, D., et al. 2006, ApJ, 653, 525, doi: 10.1086/508644
- Miller et al. (2009) Miller, J. M., Reynolds, C. S., Fabian, A. C., Miniutti, G., & Gallo, L. C. 2009, ApJ, 697, 900, doi: 10.1088/0004-637X/697/1/900
- Mitsuda et al. (1984) Mitsuda, K., Inoue, H., Koyama, K., et al. 1984, PASJ, 36, 741
- Mondal et al. (2024) Mondal, S., Pujitha Suribhatla, S., Chatterjee, K., Singh, C. B., & Chatterjee, R. 2024, arXiv e-prints, arXiv:2404.09643, doi: 10.48550/arXiv.2404.09643
- Motta et al. (2012) Motta, S., Homan, J., Muñoz Darias, T., et al. 2012, MNRAS, 427, 595, doi: 10.1111/j.1365-2966.2012.22037.x
- Parker et al. (2015) Parker, M. L., Tomsick, J. A., Miller, J. M., et al. 2015, ApJ, 808, 9, doi: 10.1088/0004-637X/808/1/9
- Peng et al. (2023) Peng, J.-Q., Zhang, S., Wang, P.-J., et al. 2023, ApJ, 955, 96, doi: 10.3847/1538-4357/acf461
- Peng et al. (2024) Peng, J.-Q., Zhang, S., Shui, Q.-C., et al. 2024, ApJ, 965, L22, doi: 10.3847/2041-8213/ad3640
- Reynolds & Miller (2013) Reynolds, M. T., & Miller, J. M. 2013, ApJ, 769, 16, doi: 10.1088/0004-637X/769/1/16
- Shakura & Sunyaev (1973) Shakura, N. I., & Sunyaev, R. A. 1973, A&A, 24, 337
- Shimura & Takahara (1995) Shimura, T., & Takahara, F. 1995, ApJ, 445, 780, doi: 10.1086/175740
- Steiner et al. (2011) Steiner, J. F., Reis, R. C., McClintock, J. E., et al. 2011, MNRAS, 416, 941, doi: 10.1111/j.1365-2966.2011.19089.x
- Tetarenko et al. (2016) Tetarenko, B. E., Sivakoff, G. R., Heinke, C. O., & Gladstone, J. C. 2016, ApJS, 222, 15, doi: 10.3847/0067-0049/222/2/15
- Verner et al. (1996) Verner, D. A., Ferland, G. J., Korista, K. T., & Yakovlev, D. G. 1996, ApJ, 465, 487, doi: 10.1086/177435
- Wilms et al. (2000) Wilms, J., Allen, A., & McCray, R. 2000, ApJ, 542, 914, doi: 10.1086/317016
- Woosley (1993) Woosley, S. E. 1993, ApJ, 405, 273, doi: 10.1086/172359
- Yan & Yu (2015) Yan, Z., & Yu, W. 2015, ApJ, 805, 87, doi: 10.1088/0004-637X/805/2/87
- You et al. (2021) You, B., Tuo, Y., Li, C., et al. 2021, Nature Communications, 12, 1025, doi: 10.1038/s41467-021-21169-5
- Yu & Dolence (2007) Yu, W., & Dolence, J. 2007, ApJ, 667, 1043, doi: 10.1086/521011
- Zhang et al. (2014) Zhang, S., Lu, F. J., Zhang, S. N., & Li, T. P. 2014, in Society of Photo-Optical Instrumentation Engineers (SPIE) Conference Series, Vol. 9144, Space Telescopes and Instrumentation 2014: Ultraviolet to Gamma Ray, ed. T. Takahashi, J.-W. A. den Herder, & M. Bautz, 914421, doi: 10.1117/12.2054144
- Zhang et al. (2018) Zhang, S., Zhang, S. N., Lu, F. J., et al. 2018, in Society of Photo-Optical Instrumentation Engineers (SPIE) Conference Series, Vol. 10699, Space Telescopes and Instrumentation 2018: Ultraviolet to Gamma Ray, ed. J.-W. A. den Herder, S. Nikzad, & K. Nakazawa, 106991U, doi: 10.1117/12.2311835
- Zhang et al. (1997) Zhang, S. N., Cui, W., & Chen, W. 1997, ApJ, 482, L155, doi: 10.1086/310705
- Zhang et al. (2020) Zhang, S.-N., Li, T., Lu, F., et al. 2020, Science China Physics, Mechanics, and Astronomy, 63, 249502, doi: 10.1007/s11433-019-1432-6
- Zimmerman et al. (2005) Zimmerman, E. R., Narayan, R., McClintock, J. E., & Miller, J. M. 2005, ApJ, 618, 832, doi: 10.1086/426071