11email: first.last@orange.com 22institutetext: Université de Rennes, CNRS, Inria, IRISA UMR 6074.
22email: first.last@irisa.fr
Synthetic Tabular Data Detection In the Wild
Abstract
Detecting synthetic tabular data is essential to prevent the distribution of false or manipulated datasets that could compromise data-driven decision-making. This study explores whether synthetic tabular data can be reliably identified across different tables. This challenge is unique to tabular data, where structures (such as number of columns, data types, and formats) can vary widely from one table to another. We propose four table-agnostic detectors combined with simple preprocessing schemes that we evaluate on six evaluation protocols, with different levels of "wildness". Our results show that cross-table learning on a restricted set of tables is possible even with naive preprocessing schemes. They confirm however that cross-table transfer (i.e. deployment on a table that has not been seen before) is challenging. This suggests that sophisticated encoding schemes are required to handle this problem.
Keywords:
Tabular Data Tabular Generative Models Fake Data Detection Classification Transfer learning.1 Introduction
Most studies on synthetic data detection focus on images [4, 7, 27, 2], texts [22, 21, 13, 38], [28], audio files [26], videos (face-swap) [31], or their combination [34]. Nevertheless, a growing number of generative models for tabular data generation has emerged recently; some are general-purpose [44, 19], while others are tailored to specific domains like finance [33] or healthcare [14]. These advancements will make it easier to create realistically manipulated datasets, enabling the falsification of scientific results or the concealment of fraud and accounting loopholes. Consequently, it is crucial to prioritize research on identifying synthetic tabular data and to develop detection methods that match the remarkable capabilities of the generative models.
Detecting synthetic content issued from a known generative model on a restricted domain is a relatively manageable task. The performance of such a predictor is indeed commonly used for adversarial training [10] and as a metric to assess generation performance [26, 43]. However, the challenge intensifies when attempting to detect synthetic data "in the wild" [36], namely, when the deployed system has to face modalities and content generators it has never seen during training. It is well-established that, even for homogeneous formats such as images or text, synthetic content detection systems lack robustness against cross-generator and cross-domain distribution shifts [20].
In the context of tabular data, we encounter a more pronounced form of domain shift, that we refer to as cross-table shift. The term "distribution shift" refers to a change in distribution within the same table as in [9]. For instance, by training on "Adult" table for a specific gender and deploying on another one. On the other hand, "cross-table shift" is a new setting involving distinct tables. For instance, by training on "Adult" and deploying on "Insurance". We focus here on the cross-table shift.
A first requirement for a synthetic table detection system to be effective "in the wild", is to be "table-agnostic" (i.e. able to take diverse table formats with varying numbers of columns and data types as input). A stronger requirement is for the model to generalize across different tables (i.e. to be able to work on a table structure it has never seen before). We call this "cross-table shift" adaptation.
We propose and study four "table-agnostic" baselines for synthetic tabular data detection "in the wild". Two are based on standard models (logistic regression and gradient boosting) and two, potentially stronger, are based on Transformers. These baselines rely on different preprocessing schemes: three textual linearizations of the rows and one specific column-based encoding. We focus our evaluation on cross-table robustness.
2 Related Work
In this section, we present prior research related to synthetic data detection as well as tabular data generation and pretrained models for representation learning on tables.
2.1 Synthetic Data Detection
Although a significant amount of work focus on image [27, 2], text [38, 28] and audio synthetic data detection [23], relatively few studies have focused on tabular data. Most synthetic tabular data detectors assess the quality of the generated data through frameworks like the Synthetic Data Vault (SDV) [30], which generally rely on comparing the distributions of two samples from the same dataset. The primary metric used to measure data realism is the Classifier two-Sample Test (C2ST) [26], which evaluates how effectively a detector can distinguish real from synthetic data. Unlike previous work, we explore a broader approach that can detect synthetic data across diverse tables and in a variety of settings. Another key difference in our work is the training set used for the generators. In C2ST, the generator has only access to the train subset. Since we want to evaluate the detector, we opted for a less favorable yet more realistic scenario where the generator has access to the test subset and the detector has to be table-agnostic.
2.2 Tabular Data Generation
Several tabular data generation models have been developed in the last few years. The state of the art comprises iterative models such as diffusion models and non iterative (or "push-forward") ones. Among diffusion models we consider TabDDPM [19] and TabSyn [44]. These models aim to gradually change random Gaussian noise into samples from the target data distribution. They involve two phases: a training phase where a forward diffusion process adds Gaussian noise to the samples, and a generation phase where a backward diffusion process removes progressively the noise to generate samples from the target distribution. Following the idea in [37, 32], TabSyn embeds the diffusion in a latent space by using a Variational Autoencoder (VAE) [18]. Among the push-forward generative models, we evaluate TVAE and CTGAN [40]. TVAE is built upon a Variational Autoencoder (VAE), while CTGAN is based on a Wasserstein GAN [10]. Both models utilize one-hot encoding for categorical features and a Gaussian Mixture Model (GMM) normalization approach for numerical features. Additionally, CTGAN incorporates specialized techniques, such as a conditional vector and oversampling, to address imbalances in categorical values.
2.3 Table-agnostic Embeddings and Encodings
Research on tabular data has also explored representation learning for tables. Most off-the-shelf table representation models are inspired by BERT-like architectures and are designed for small tables, such as those found in popular datasets like WikiTableQuestions [29], WikiSQL [45], and TabFact [6]. These models include TaBERT [42], which is pretrained on 26 million tables, jointly learning representations for both tables and their accompanying descriptions. Other models, such as TAPAS [12] and TAPEX [25], focus on question answering over tables. TAPAS is a BERT-based model trained using a Masked Language Modeling (MLM) objective, where table cells or text segments are masked during training. TAPEX, on the other hand, is a BART-based model pretrained to emulate the functionality of an SQL execution engine when interacting with tables. All these encoders rely on a text linearization of the tables or rows which is fed to a standard subword tokenizer. Some recently proposed architectures like CARTE [16] and PORTAL [35] replace the text linearization by a table-specific encoding scheme.
We focus here on large tables commonly found in databases, which are often too extensive to be processed directly by BERT-like models due to their context-token limits (512 for BERT, 1024 for BART). For both representation learning and classification tasks, it is crucial to decide on an appropriate level of granularity, meaning the number of rows to be included as input. In our approach, we utilize classifiers that process a single row at a time, while recognizing that certain table properties may only become apparent when considering multiple rows together.
Concerns such as the lack of control, potential data leakage between test sets and pretraining tables, discrepancies between pretraining and fine-tuning objectives, model size, and environmental impact (e.g., carbon footprint) led us to develop and train our own lightweight transformers rather than relying on a pretrained model.
3 Datasets, Encodings and Detectors
In this section, we present the real and synthetic datasets in Section 3.1, the text and column-based encodings in Section 3.2 as well as the detection models in Section 3.3.
3.1 Datasets
Real Data:
We use 14 common public tabular datasets from the UCI111https://archive.ics.uci.edu/ repository with different sizes, dimensions and domains. These datasets are described in Table 1.
| Name | Size | #Num | #Cat |
|---|---|---|---|
| Abalone222https://www.openml.org | 4177 | 7 | 2 |
| Adult2 | 48842 | 6 | 9 |
| Bank Marketing2 | 45211 | 7 | 10 |
| Black Friday2 | 166821 | 6 | 4 |
| Bike Sharing2 | 17379 | 9 | 4 |
| Cardio333https://www.kaggle.com/datasets | 70000 | 11 | 1 |
| Churn Modelling3 | 4999 | 8 | 4 |
| Diamonds2 | 26970 | 7 | 3 |
| HELOC3 | 5229 | 23 | 1 |
| Higgs2 | 98050 | 28 | 1 |
| House 16H2 | 22784 | 17 | 0 |
| Insurance3 | 1338 | 4 | 3 |
| King3 | 21613 | 19 | 1 |
| MiniBooNE2 | 130064 | 50 | 1 |
Synthetic Data:
The data generators are heavily tuned versions of TabDDPM [19], TabSyn [44], TVAE, and CTGAN [40] provided by [17].
To generate a synthetic version of a specific table using a particular generator, we first train the generator on the entire table using the hyperparameters derived from the extensive tuning in [17]. After training, the model generates synthetic rows. These are then mixed with real and other synthetic data to form the detectors’ training and testing sets. In our setup, each generator is used to create a synthetic version of the 14 real tables (Table 1) resulting in synthetic tables.
3.2 Table-agnostic Data Encodings
To be practical "in the wild," a detection model must be "table-agnostic," meaning it should be capable of processing inputs from various table formats.
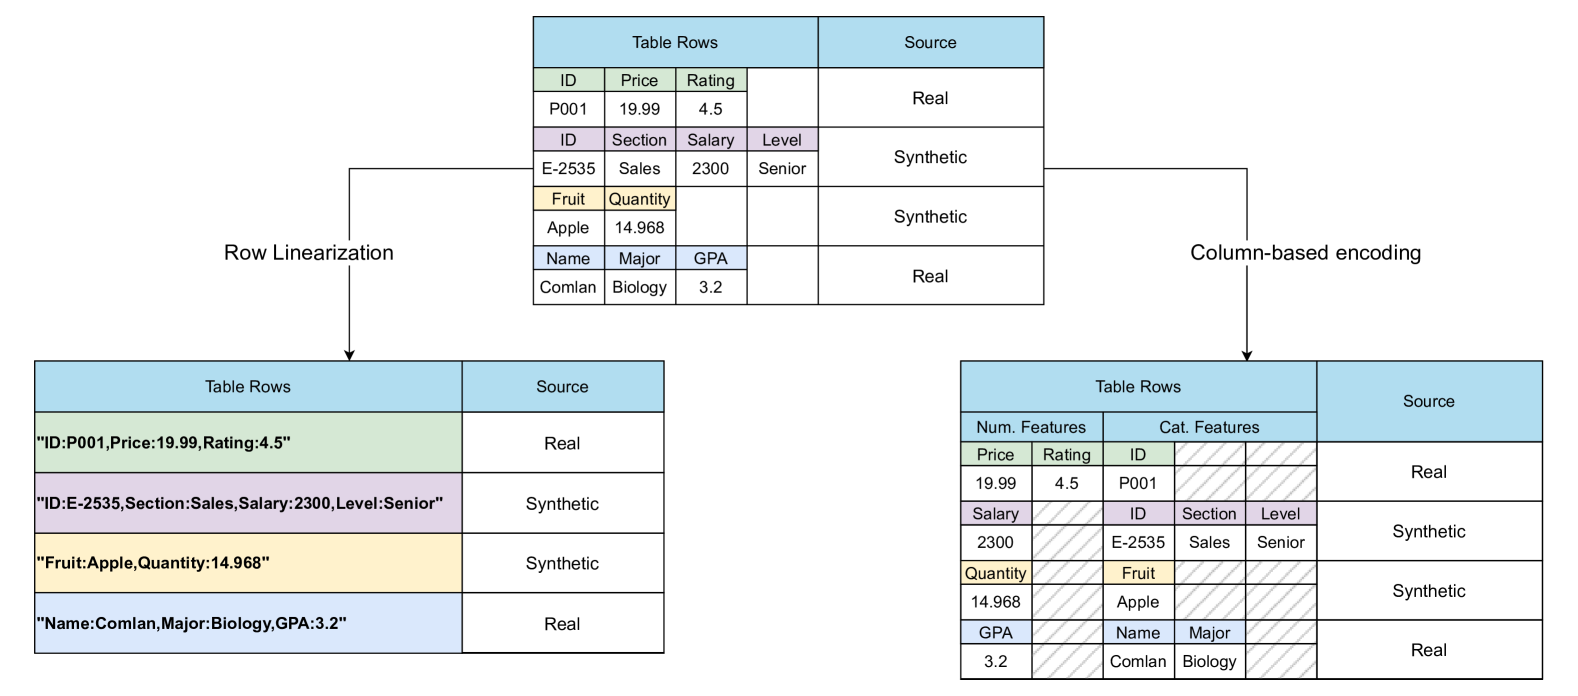
We explore four simple table-agnostic preprocessing schemes: three text-based data encodings and one column-based encoding. For the text-based approaches, the table is first linearized into text. From this, we derive three representations: (i) character trigrams (referred to as "3gram-char"), (ii) word trigrams (referred to as "3gram-word"), and (iii) a general linearized representation (referred to as "Flat Text"). For the column-based encoding (referred to as "Column" in the results), we use a coarse-grained column-level encoding of tables.
Text-Based Encodings:
A natural solution to build a table-agnostic model is to consider the tables as raw text. This approach is used in pretrained models such as TaBERT [42], TAPAS [12], or TAPEX [25]. These models are designed to encode small tables like the ones found on Wikipedia. They are derived from BERT and rely on a text encoding of the whole table. In order to work with larger tables we opted, as in [3], to work at the row level. The left-hand side of Figure 1 illustrates the row linearization process.
We converted each table row into a shuffled sequence of <column>:<value> patterns. For example, the first row of Table 1 can be encoded as the string: "Name:Abalone,Size:4177,#Num:7,#Cat:2" or any permutation of its columns. This random column permutation is designed to enhance generalization across different tables. Then three options are considered: (i) For 3gram-char, the string is simply split into a bag of character-level trigrams such as "Nam", "e:A", ":41" or ,"t:2" (ii) For 3gram-word, it is split into bags of word-level trigrams such as "Name Abalone Size" or "4177 #Num 7"; (iii) For the Flat Text encoding, the string is tokenized into a sequence of characters indexes.
These basic text-based encodings have the advantage that they can be applied to any table, even in multitable setups with varying numbers of columns. They can also help to highlight obvious patterns in the data. We also employ traditional binary text classification methods for establishing baselines for our problem, particularly the Bag-Of-Words (BOW) approach [1], and explore both word-level and character-level trigrams.
Column-Based Encoding:
In this approach, all datasets are encoded using the same procedure: numerical features are normalized using the QuantileTransformer, and categorical features are encoded with the OrdinalEncoder, both from scikit-learn444https://scikit-learn.org/stable/. Notably, each dataset is processed independently, ensuring that the methods for encoding numerical and categorical features are applied separately to avoid any unintended interactions between the cross-table features. This approach preserves the natural relationships between features, helping detectors learn meaningful interactions. It also emphasises unique feature characteristics, which may improve pattern recognition.
A key challenge when working with tabular data is its heterogeneous nature. For instance, tabular datasets often vary in the number of features they contain. Unlike image data, which can typically be normalized to a consistent range, standardizing tabular data is less straightforward. To address this characteristic, we first split the columns according to their types: the numerical and the categorical features. For models with a fixed input size like logistic regression or decision trees, we then apply a padding scheme or a crop to match their input dimensions. The procedure is illustrated on the right-hand side of Figure 1. A notable advantage of this – very basic – approach is that it is universally applicable to any new table encountered by the detector. It also effectively mitigates data type conflicts by treating numeric and categorical features separately.
3.3 Detectors
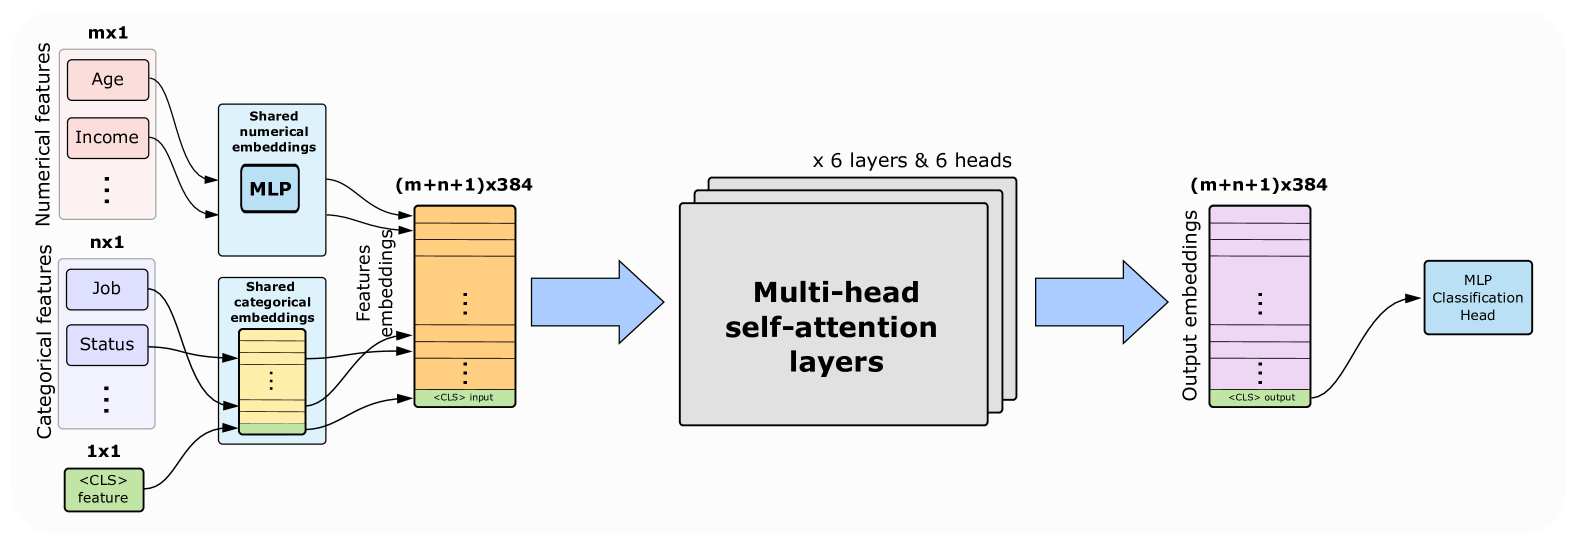
We deployed two Transformer-based detectors: one utilizing column-based encoding and the other employing Flat Text encoding. They share the following core components: (i) an embedding block, (ii) a Transformer encoder block, and (iii) a classification head. For the column-based Transformer, as shown in Figure 2, the feature embedding module uses a shared feed-forward layer for numerical features and a shared embedding layer for categorical features. Additionally, we have incorporated a positional encoding layer into the detector. While this baseline is relatively simple, more advanced strategies are discussed in [39] and [35]. For the Flat Text Transformer, the tokenized input is mapped, as usual for Transformers, into a sequence of embedding vectors that are combined with a positional encoding.
Similar to BERT-like [8] Transformer architectures, our Transformer-based detectors utilize a CLS embedding, which is appended to the input and whose representation is extracted from the output of the Transformer encoder block. This CLS representation is then passed to the classification head to predict the binary target class (real or synthetic data).
Transformers were chosen primarily because they can be designed to be permutation invariant and are capable of handling inputs with varying lengths. This flexibility is particularly advantageous for a table-agnostic detector, which must operate on sets of features with variable sizes. Furthermore, while tree-based models tend to outperform neural networks on medium-sized tabular data [11], transformer-based models offer an advantage over tree-based competitors when handling large tables [15].
We trained XGBoost [5] and Logistic Regression detectors on all four preprocessing schemes. All detectors are trained for binary classification.
4 Detection Setups
All dataset rows are combined into a list with two additional labels: the dataset name (to simulate the cross-table shift) and the origin, which can be either "real" or "synthetic". In the following sections, we outline two setups: training detectors without distribution shift (Section 4.1) and with a cross-table shift (Section 4.2). For each setup, we apply the preprocessing schemes described in Section 3.3 to evaluate the detectors. We use a 3-fold cross-validation protocol which evaluates discrepancies across three runs of synthetic data generation, each combined with a different subset of the real data.
4.1 Detection Without Distribution Shift
First, we train detectors on the detection of synthetic data generated by each generator, resulting in four setups, namely: (i) TVAE vs Real, (ii) CTGAN vs Real, (iii) TabSyn vs Real, and (iv) TabDDPM vs Real . In each one of these setups, we mix all synthetic tables produced by each generator along with real tables. Rows are labelled accordingly. We include a fifth setup where each synthetic dataset is generated using a combination of all generators, mixed along with real data, and labelled accordingly. This setup is referred to as All Models vs Real.
With these setups, we aim to evaluate the effectiveness of the detectors in accurately identifying data generated by each generator independently, using a restricted set of datasets. While our primary focus is on the cross-table shift, we consider this an essential step for both validating the detectors and ensuring their effectiveness in realistic use cases that practitioners may encounter (especially the All Models vs Real). Moreover, these setups can also be viewed as an advanced version of the C2ST performed on multiple tables instead of table-specific like the approach in [17]. They are also more realistic and challenging for the detectors as the generators are exposed to the full available real data and not only a train subset.
4.2 Detection Under Cross-table Shift
| Tables | ||||
|---|---|---|---|---|
| Adult | Cardio | King | ||
| Real Data | ||||
| TVAE | ||||
| TabSyn | ||||
| CTGAN | ||||
| Generators | TabDDPM | |||
As explained in Section 1, the cross-table shift is a setup that simulates the realistic situation where the model is deployed on table structures it has never seen before. This setup can be implemented with GroupKFold from scikit-learn555https://scikit-learn.org/stable/. For example, as shown in Table 2, if Tables Adult and Cardio are used in training, they cannot be used in testing. Similarly, if Table King is used in the test, it cannot be used in the training phase.
5 Results
We present the results of our baselines across different setups, both without (Section 5.1) and with (Section 5.2) cross-table shift. These results are summarized in Table LABEL:tab:results and Table LABEL:tab:results2 using standard metrics including ROC-AUC, Accuracy, and F1 score.
| Setup | Model | Encoding | Metrics | ||
|---|---|---|---|---|---|
| AUC | Accuracy | F1 | |||
| [+5pt]TVAE vs Real [+2pt](All tables [+2pt]no shift) | LReg. | 3gram-char | |||
| 3gram-word | |||||
| Column | |||||
| Flat Text | |||||
| XGBoost | 3gram-char | ||||
| 3gram-word | |||||
| Column | |||||
| Flat Text | |||||
| Transf. | Column | ||||
| Flat Text | |||||
| [+5pt]CTGAN vs Real [+2pt](All tables [+2pt]no shift) | LReg. | 3gram-char | |||
| Column | |||||
| Flat Text | |||||
| XGBoost | 3gram-char | ||||
| 3gram-word | |||||
| Column | |||||
| Flat Text | |||||
| Transf. | Column | ||||
| Flat Text | |||||
| [+5pt]TabSyn vs Real [+2pt](All tables [+2pt]no shift) | LReg. | 3gram-char | |||
| 3gram-word | |||||
| Column | |||||
| Flat Text | |||||
| XGBoost | 3gram-char | ||||
| 3gram-word | |||||
| Column | |||||
| Flat Text | |||||
| Transf. | Column | ||||
| Flat Text | |||||
| [+5pt]TabDDPM vs Real [+2pt](All tables [+2pt]no shift) | LReg. | 3gram-char | |||
| 3gram-word | |||||
| Column | |||||
| Flat Text | |||||
| XGBoost | 3gram-char | ||||
| 3gram-word | |||||
| Column | |||||
| Flat Text | |||||
| Transf. | Column | ||||
| Flat Text | |||||
| [+5pt]All Models vs Real [+2pt](All tables [+2pt]no shift) | LReg. | 3gram-char | |||
| 3gram-word | |||||
| Column | |||||
| Flat Text | |||||
| XGBoost | 3gram-char | ||||
| 3gram-word | |||||
| Column | |||||
| Flat Text | |||||
| Transf. | Column | ||||
| Flat Text | |||||
5.1 Without Distribution Shift
The first observation from Table LABEL:tab:results is that Transformer-based detectors perform well across all metrics and setups with an AUC above across all setups, except for CTGAN vs Real where the AUC is for the Flat Text encoding. This suggests that these table-agnostic detectors have good generalization capabilities when there is no distribution shift. Note however that XGBoost slightly outperforms the Transformers on the TabSyn vs Real setup ( for the best Transformer versus for XGBoost).
The encoding scheme has also a strong impact on the performance for all detectors. XGBoost performs better with column-based or Flat Text encodings in all setups. However, its performance is close to random guessing with an AUC around for the trigram encodings, and it shows poor performance on other metrics as well. As for Logistic Regression, performance varies across setups, with either encoding yielding better results depending on the specific setup. Nonetheless, it delivers its best performance with the three textual encodings, achieving an average AUC of 0.70 under the 3gram-char encoding.
Regarding the generators, we note that TVAE is easier to detect than the other generators. Indeed, despite its simple design, the table-agnostic column-based Transformer achieves an AUC of for detecting TVAE rows against real rows. This is an improvement from the results reported in [17] where the median AUC for XGBoost was with the less challenging C2ST setup (see Section 2.1). Similarly, the median AUC for detecting TabSyn samples is in [17], whereas we achieve an AUC above across multiple detectors (Logistic Regression with 3gram-word, XGBoost, and Flat Text Transformer) when combining datasets generated by TabSyn.
The task becomes more challenging under the All models vs Real setup, but overall performance remains stable across all detectors. As a secondary observation, we note that there is still considerable room for improvement in achieving realistic tabular data generation. The synthetic tabular data generators appear to exhibit patterns that even a simple table-agnostic classifier can detect.
| Setup | Model | Encoding | Metrics | ||
|---|---|---|---|---|---|
| AUC | Accuracy | F1 | |||
| [+5pt]Cross-table shift [+2pt](All tables [+2pt]all models) | LReg. | 3gram-char | |||
| 3gram-word | |||||
| Column | |||||
| Flat Text | |||||
| XGBoost | 3gram-char | ||||
| 3gram-word | |||||
| Column | |||||
| Flat Text | |||||
| Transf. | Column | ||||
| Flat Text | |||||
5.2 Cross-table Shift
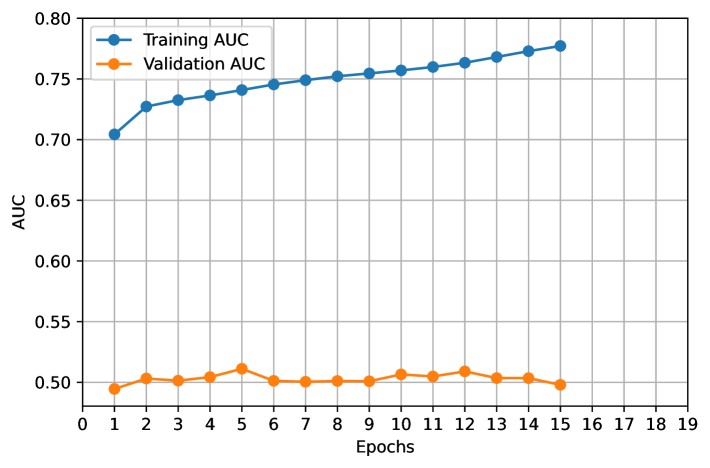
The cross-table shift results (Table LABEL:tab:results2) highlight the difficulty of this setup, as all detectors struggle to achieve correct performance. The column-based Transformer experiences a significant drop in performance, with an AUC of . The detector fails to identify meaningful patterns and is unable to generalize to unseen datasets, essentially making random guesses on the test set.
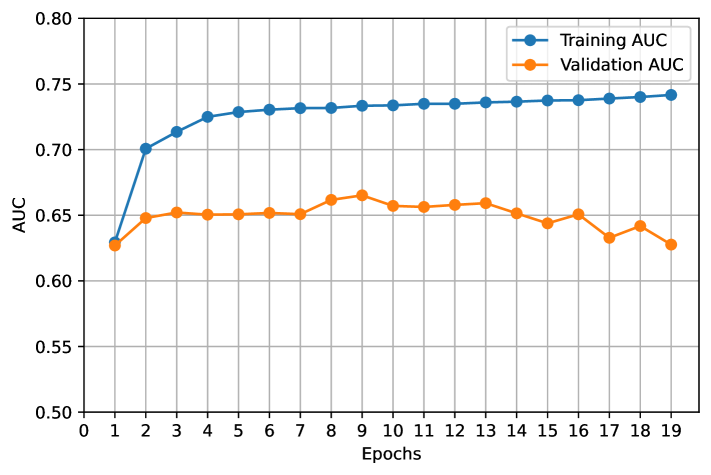
It is interesting to note that the Flat Text Transformer outperforms the column-based one with an AUC of . The training curves shown in Figure 3 confirm that, with a cross-table shift across all training, validation, and test sets, the Flat Text Transformer (on the left-hand side) is more robust than the column-based Transformer (on the right-hand side). The table-agnostic encoding used in the column-based method shows its limitations when evaluated on unseen tables. Being closely tied to the specific characteristics of the datasets, this encoding does not generalize well to datasets with different features (e.g., the number of features, range of numerical values, categories in categorical features, and sample size). In contrast, the Flat Text representation yields more promising results in presence of a cross-table shift.
The Logistic Regression baseline shows poor performance with most encodings, particularly with 3gram-word, which scores for F1. Nethertheless, it achieves decent performance with the 3gram-char encoding (AUC = 0.60), but, unlike Transformers [46, 24, 41], its potential for improvement is limited. As for XGBoost, it now produces random guesses (AUC around ) and performs poorly on the accuracy as well. Our analysis also shows that the F1 score of 0.67 results from predicting all samples as the same class, leading to a recall of 1.0 and a precision of 0.5.
Taken together, these results suggest that the textual preprocessing schemes in the cross-table setup lead to more promising results, especially the character-based encodings. These preliminary findings indicate the need for further investigation into Transformer-based detectors with both Flat Text and column-based encodings. Additionally, the potential for transfer learning from pre-trained models could further enhance performance, making Transformer-based approaches a valuable asset in the cross-table setup.
5.3 Limitations
The results demonstrate that our column-based Transformer, combined with its simple table-agnostic preprocessing and feature embedding scheme, performs well when there is no distribution shift. However, it struggles to generalize effectively under cross-table shift. A better encoding scheme is hence required.
In contrast, the text-based Transformer is simpler and more flexible. However, it results in longer row-encoding sequences and it lacks tabular-specific inductive bias, potentially limiting its ability to capture patterns that are unique to tabular data.
A limitation of this study is that although we have deployed light transformers which are much smaller than most on-the-shelf table embedding models, we did not analyze their cost and scalability for large tables. Another limitation of this study is that we only considered row-by-row detection. But we acknowledge that some statistical properties, especially for time-series or sequential data, may become apparent only when considering multiple rows together.
6 Conclusion
We investigated the detection of synthetic tabular data "in the wild" using 14 datasets and 4 state-of-the-art, highly-tuned tabular data generation models. By evaluating various detectors with different tabular data representations as inputs, we demonstrated that synthetic data detection is both feasible and shows promising performance. Our analysis spanned different levels of "wildness," considering scenarios both with and without cross-table shift, which was a central focus of our study. While our preliminary findings are encouraging, they underscore the challenges of adapting to cross-table shifts. Moving forward, we aim to refine these results by exploring more advanced encodings, addressing other types of distribution shifts, and developing improved adaptation strategies. We also plan to evaluate recent approaches, such as [35], while also developing a benchmark platform for cross-table synthetic tabular data detection, inspired by [9]. The benchmark will provide a detailed evaluation of the costs and scalability of the detectors for large tables.
References
- [1] Alsammak, I.L.H., Itwee, W.H., Mahmoud, M.A., Jasim, N.I.: Text Classification: A Comprehensive Survey from Traditional Approaches to Deep Learning Methods, pp. 247–267. Springer Nature Switzerland, Cham (2025). https://doi.org/10.1007/978-3-031-75091-5_14, https://doi.org/10.1007/978-3-031-75091-5_14
- [2] Bammey, Q.: Synthbuster: Towards detection of diffusion model generated images. IEEE Open Journal of Signal Processing 5, 1–9 (2024). https://doi.org/10.1109/OJSP.2023.3337714
- [3] Borisov, V., Sessler, K., Leemann, T., Pawelczyk, M., Kasneci, G.: Language models are realistic tabular data generators. In: The Eleventh International Conference on Learning Representations (2023)
- [4] Chai, L., Bau, D., Lim, S.N., Isola, P.: What makes fake images detectable? understanding properties that generalize. In: Computer Vision–ECCV 2020: Proceedings, Part XXVI 16. pp. 103–120. Springer (2020)
- [5] Chen, T., Guestrin, C.: Xgboost: A scalable tree boosting system. In: Proceedings of the 22nd acm sigkdd international conference on knowledge discovery and data mining. pp. 785–794 (2016)
- [6] Chen, W., Wang, H., Chen, J., Zhang, Y., Wang, H., Li, S., Zhou, X., Wang, W.Y.: Tabfact: A large-scale dataset for table-based fact verification. In: International Conference on Learning Representations (2020), https://openreview.net/forum?id=rkeJRhNYDH
- [7] Corvi, R., Cozzolino, D., Zingarini, G., Poggi, G., Nagano, K., Verdoliva, L.: On the detection of synthetic images generated by diffusion models. pp. 1–5 (06 2023). https://doi.org/10.1109/ICASSP49357.2023.10095167
- [8] Devlin, J., Chang, M.W., Lee, K., Toutanova, K.: Bert: Pre-training of deep bidirectional transformers for language understanding. In: North American Chapter of the Association for Computational Linguistics (2019), https://api.semanticscholar.org/CorpusID:52967399
- [9] Gardner, J., Popovic, Z., Schmidt, L.: Benchmarking distribution shift in tabular data with tableshift. Advances in Neural Information Processing Systems 36 (2024)
- [10] Goodfellow, I., Pouget-Abadie, J., Mirza, M., Xu, B., Warde-Farley, D., Ozair, S., Courville, A., Bengio, Y.: Generative adversarial networks. Com. of the ACM 63(11), 139–144 (2020)
- [11] Grinsztajn, L., Oyallon, E., Varoquaux, G.: Why do tree-based models still outperform deep learning on typical tabular data? In: Thirty-sixth Conference on Neural Information Processing Systems Datasets and Benchmarks Track (2022), https://openreview.net/forum?id=Fp7__phQszn
- [12] Herzig, J., Nowak, P.K., Müller, T., Piccinno, F., Eisenschlos, J.: TaPas: Weakly supervised table parsing via pre-training. In: Jurafsky, D., Chai, J., Schluter, N., Tetreault, J. (eds.) Proceedings of the 58th Annual Meeting of the Association for Computational Linguistics. pp. 4320–4333. Association for Computational Linguistics, Online (Jul 2020)
- [13] Hu, X., Chen, P.Y., Ho, T.Y.: Radar: Robust ai-text detection via adversarial learning. Advances in Neural Information Processing Systems 36, 15077–15095 (2023)
- [14] Hyun, J., Lee, S.H., Son, H., Park, J.U., Chung, T.M.: A synthetic data generation model for diabetic foot treatment. In: International Conference on Future Data and Security Engineering (2020), https://api.semanticscholar.org/CorpusID:228085848
- [15] Karlsson, A., Wang, T., Nowaczyk, S., Pashami, S., Asadi, S.: Mind the data, measuring the performance gap between tree ensembles and deep learning on tabular data. In: Miliou, I., Piatkowski, N., Papapetrou, P. (eds.) Advances in Intelligent Data Analysis XXII. pp. 65–76. Springer Nature Switzerland, Cham (2024)
- [16] Kim, M.J., Grinsztajn, L., Varoquaux, G.: Carte: Pretraining and transfer for tabular learning. In: Forty-first International Conference on Machine Learning (2024)
- [17] Kindji, G.C.N., Rojas-Barahona, L.M., Fromont, E., Urvoy, T.: Under the hood of tabular data generation models: the strong impact of hyperparameter tuning (2024), https://arxiv.org/abs/2406.12945
- [18] Kingma, D.P., Welling, M.: Auto-encoding variational bayes. stat 1050, 1 (2014)
- [19] Kotelnikov, A., Baranchuk, D., Rubachev, I., Babenko, A.: Tabddpm: Modelling tabular data with diffusion models. In: International Conference on Machine Learning. pp. 17564–17579. PMLR (2023)
- [20] Kuznetsov, K., Tulchinskii, E., Kushnareva, L., Magai, G., Barannikov, S., Nikolenko, S., Piontkovskaya, I.: Robust ai-generated text detection by restricted embeddings. In: Findings of the Association for Computational Linguistics: EMNLP 2024. pp. 17036–17055 (2024)
- [21] Lahby, M., Aqil, S., Yafooz, W.M., Abakarim, Y.: Online fake news detection using machine learning techniques: A systematic mapping study. Combating fake news with computational intelligence techniques pp. 3–37 (2022)
- [22] Lavergne, T., Urvoy, T., Yvon, F.: Filtering artificial texts with statistical machine learning techniques. Language resources and evaluation 45, 25–43 (2011)
- [23] Li, X., Chen, P.Y., Wei, W.: Sonar: A synthetic ai-audio detection framework and benchmark (2024), https://arxiv.org/abs/2410.04324
- [24] Li, Y., McClelland, J.: Systematic generalization and emergent structures in transformers trained on structured tasks (2023), https://openreview.net/forum?id=pXDmbfVL_SB
- [25] Liu, Q., Chen, B., Guo, J., Ziyadi, M., Lin, Z., Chen, W., Lou, J.G.: TAPEX: Table pre-training via learning a neural SQL executor. In: International Conference on Learning Representations (2022), https://openreview.net/forum?id=O50443AsCP
- [26] Lopez-Paz, D., Oquab, M.: Revisiting classifier two-sample tests. In: International Conference on Learning Representations (2016)
- [27] Marra, F., Gragnaniello, D., Verdoliva, L., Poggi, G.: Do GANs Leave Artificial Fingerprints? . In: 2019 IEEE Conference on Multimedia Information Processing and Retrieval (MIPR). pp. 506–511. IEEE Computer Society (2019)
- [28] Mitchell, E., Lee, Y., Khazatsky, A., Manning, C.D., Finn, C.: Detectgpt: zero-shot machine-generated text detection using probability curvature. In: Proceedings of the 40th International Conference on Machine Learning. ICML’23, JMLR.org (2023)
- [29] Pasupat, P., Liang, P.: Compositional semantic parsing on semi-structured tables. In: Zong, C., Strube, M. (eds.) Proceedings of the 53rd Annual Meeting of the Association for Computational Linguistics and the 7th International Joint Conference on Natural Language Processing (Volume 1: Long Papers). pp. 1470–1480. Association for Computational Linguistics, Beijing, China (Jul 2015). https://doi.org/10.3115/v1/P15-1142, https://aclanthology.org/P15-1142
- [30] Patki, N., Wedge, R., Veeramachaneni, K.: The synthetic data vault. In: IEEE International Conference on Data Science and Advanced Analytics (DSAA). pp. 399–410 (Oct 2016). https://doi.org/10.1109/DSAA.2016.49
- [31] Pu, J., Mangaokar, N., Kelly, L., Bhattacharya, P., Sundaram, K., Javed, M., Wang, B., Viswanath, B.: Deepfake videos in the wild: Analysis and detection. In: Proceedings of the Web Conference 2021. pp. 981–992 (2021)
- [32] Rombach, R., Blattmann, A., Lorenz, D., Esser, P., Ommer, B.: High-resolution image synthesis with latent diffusion models. In: Proceedings of the IEEE/CVF conference on computer vision and pattern recognition. pp. 10684–10695 (2022)
- [33] Sattarov, T., Schreyer, M., Borth, D.: Findiff: Diffusion models for financial tabular data generation. In: Proceedings of the Fourth ACM International Conference on AI in Finance. p. 64–72. ICAIF ’23, Association for Computing Machinery (2023)
- [34] Singhal, S., Kabra, A., Sharma, M., Shah, R.R., Chakraborty, T., Kumaraguru, P.: Spotfake+: A multimodal framework for fake news detection via transfer learning (student abstract). In: Proceedings of the AAAI conference on artificial intelligence. vol. 34, pp. 13915–13916 (2020)
- [35] Spinaci, M., Polewczyk, M., Klein, T., Thelin, S.: Portal: Scalable tabular foundation models via content-specific tokenization. In: NeurIPS 2024 Third Table Representation Learning Workshop (2024)
- [36] Stadelmann, T., Amirian, M., Arnold, M., Elezi, I., Geiger, M., Rombach, K., Tuggener, L., Arabaci, I., Meier, B., Duivesteijn, G., et al.: Deep learning in the wild. Lecture Notes in Computer Science 11081, 17–38 (2018)
- [37] Vahdat, A., Kreis, K., Kautz, J.: Score-based generative modeling in latent space. Advances in neural information processing systems 34, 11287–11302 (2021)
- [38] Wang, Q., Zhang, L., Guo, Z., Mao, Z.: IDEATE: Detecting AI-generated text using internal and external factual structures. In: Proceedings of the 2024 Joint International Conference on Computational Linguistics, Language Resources and Evaluation (LREC-COLING 2024). pp. 8556–8568 (May 2024)
- [39] Wang, Z., Sun, J.: Transtab: Learning transferable tabular transformers across tables. Advances in Neural Information Processing Systems 35, 2902–2915 (2022)
- [40] Xu, L., Skoularidou, M., Cuesta-Infante, A., Veeramachaneni, K.: Modeling tabular data using conditional gan. In: Advances in Neural Information Processing Systems (NeurIPS). vol. 32 (2019)
- [41] Yadlowsky, S., Doshi, L., Tripuraneni, N.: Can transformer models generalize via in-context learning beyond pretraining data? In: NeurIPS 2023 Workshop on Distribution Shifts: New Frontiers with Foundation Models (2024)
- [42] Yin, P., Neubig, G., Yih, W.t., Riedel, S.: Tabert: Pretraining for joint understanding of textual and tabular data. In: Proceedings of the 58th Annual Meeting of the Association for Computational Linguistics, ACL. pp. 8413–8426 (01 2020)
- [43] Zein, E.H., Urvoy, T.: Tabular data generation: Can we fool XGBoost ? In: NeurIPS 2022 First Table Representation Workshop (2022)
- [44] Zhang, H., Zhang, J., Shen, Z., Srinivasan, B., Qin, X., Faloutsos, C., Rangwala, H., Karypis, G.: Mixed-type tabular data synthesis with score-based diffusion in latent space. In: The Twelfth International Conference on Learning Representations (2024)
- [45] Zhong, V., Xiong, C., Socher, R.: Seq2sql: Generating structured queries from natural language using reinforcement learning. CoRR abs/1709.00103 (2017)
- [46] Zhou, H., Bradley, A., Littwin, E., Razin, N., Saremi, O., Susskind, J.M., Bengio, S., Nakkiran, P.: What algorithms can transformers learn? a study in length generalization. In: The Twelfth International Conference on Learning Representations (2024)