∎
e1e-mail: bjoern.lehnert@tu-dresden.de \thankstexte2e-mail: serge.nagorny@gssi.it \thankstexte3e-mail: m.thiesse@sheffield.ac.uk
Improved sensitivity in the search for rare decays of Gd isotopes
Abstract
Gadolinium is widely used in multiple low-background experiments, making its isotopes accessible for rare decay searches both in-situ and through radiopurity screening data. This study presents an improved search for rare alpha and double-beta decay modes in 152Gd, 154Gd, and 160Gd isotopes using ultra-low background HPGe detectors at the Boulby Underground Screening (BUGS) facility. A total exposure of 6.7 kgyr of natural gadolinium was achieved using gadolinium sulfate octahydrate samples, originally screened for radiopurity prior to their deployment in the Super-Kamiokande neutrino experiment. Due to the detection methodology, only decays into excited states accompanied by gamma-ray emission were accessible. A Bayesian analysis incorporating prior experimental results was employed, leading to new lower half-life limits in the range of years - an improvement of approximately two orders of magnitude over previous constraints. No statistically significant decay signals were observed. These results demonstrate the effectiveness of repurposing large-scale radiopurity screening campaigns for fundamental physics research.
Keywords:
double beta decay alpha decay rare events excited states gamma spectroscopy1 Introduction
Neutrinos are key particles in astrophysics. Although they were theoretically predicted in 1930 by W. Pauli brown78 and experimentally detected for the first time in 1956 cowan56 , a comprehensive understanding of their properties remains elusive. The most significant unresolved issues concern the neutrino’s mass and its nature dolinski19 ; mohapatra07 . Among the various nuclear and electroweak processes involving neutrinos, neutrinoless double-beta decay offers the only practical means of obtaining definitive answers to both of these questions.
Neutrinoless double-beta decay is a hypothetical second-order nuclear process that is forbidden within the Standard Model of particle physics. However, if observed, it would establish the electron neutrino as a Majorana particle, implying that the neutrino possesses a non-zero effective Majorana mass term Takasugi84 ; Schechter82 ; Avignone08 . This conclusion arises because this process is only possible if the neutrino is its own antiparticle. Furthermore, the existence of Majorana-type neutrinos could enable mechanisms that would explain the observed matter-antimatter asymmetry in the Universe Fukugita86 ; Deppisch18 . Consequently, extensive worldwide experimental efforts are dedicated to this fundamental topic, with numerous international collaborations searching for neutrinoless double-beta decay in various isotopes dolinski19 ; Pritychenko25 .
The current experimental sensitivity in this field has reached a half-life value of years, yet the process remains undetected. Consequently, next-generation experiments aim to increase their sensitivity by employing an extended active detector mass in the range of 1–10 tons and by reducing the background level below counts/keVkgyr Barabash23 . To achieve this exceptionally low internal background counting rate, all potential background components must be meticulously controlled and mitigated. Therefore, all future ultra-low-background (ULB) experiments will necessitate complex assays of all materials and reagents used, which must adhere to stringent radiopurity protocols specific to each individual experiment. Typically, such screening campaigns incorporate a combination of low-background measurements of material samples using high-purity germanium (HPGe) -spectrometers located deep underground, analysis of radon emanation, and assays using ICP-MS analysis (such as akerib20 ; aprile22 ).
In a different area of low-background, high-energy physics, the large-scale neutrino oscillation experiment, Super Kamiokande (SK), has dissolved 40 tons of a gadolinium salt (gadolinium sulfate octahydrate, Gd2(SO4)H2O) into their ultra-pure water Cherenkov detector to expand their scientific programmes and distinguish neutrinos from antineutrinos originating from supernova explosions. Consequently, before loading 13 tons of Gd2(SO4)8H2O into SK in 2020 firstgdloading and an additional 26 tons in 2022 secondgdloading , samples representing a portion of the gadolinium salt underwent radiopurity screening at Boulby Underground Laboratory (UK). The raw material was required to be substantially radiopure to maintain SK’s sensitivity to solar neutrinos and the diffuse supernova neutrino background (DSNB) signals. The requirements of mBq/kg early-chain 238U, mBq/kg late-chain 238U, mBq/kg 232Th, and mBq/kg 235U were largely achieved, although some batch-to-batch variation occurred gdproduction . The experimental data acquired within this radioassay campaign provides a unique opportunity to search for rare nuclear processes that may occur in natural gadolinium isotopes at an unprecedented sensitivity level.
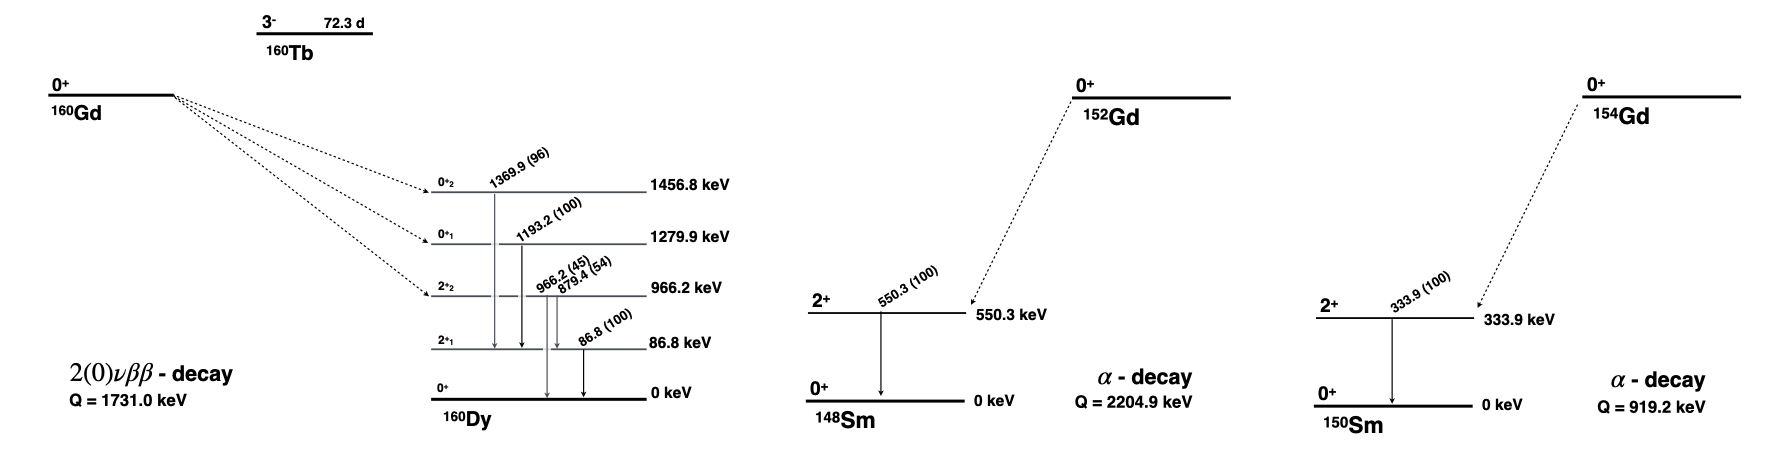
Therefore, this manuscript presents a new search for and 2 decay of Gd isotopes to excited levels of their daughter nuclides using radioassay data with a total exposure of 6.7 kgyr of natural Gd. Improved experimental sensitivity compared to the recent study Laubenstein23 was achieved by using high-purity Gd-containing samples and increasing the sample exposure. However, as this experimental approach is best suited to studying rare decay modes with the emission of relatively high-energy de-excitation -rays (above 100 keV), the 2EC process in 152Gd is not considered here. Instead, the focus is on and 2 decay of , , and to excited states of their respective daughters. The decay schemes of all considered decay modes are shown in Figure 1.
2 Experimental Setup and Sample
The Gd2(SO4)8H2O raw material was produced by the Nippon Yttrium Company in approximately half-ton batches between 2019 and 2022 firstgdloading ; secondgdloading ; gdproduction . Two distinct production methods were employed, differentiated by their treatment of elemental radium. The second production method aimed to reduce radium concentration and thereby improve the late-chain thorium radiopurity. To verify the radiopurity of the produced batches, samples were sent to three underground screening laboratories worldwide, including the Boulby UnderGround Screening (BUGS) laboratory.
Following batch production, the manufacturer initially packed the samples in EVOH bags, each containing 5 kg () of material. These were shipped by aeroplane from the manufacturer in Japan to England. Upon arrival at the University of Sheffield, the samples were packed into type 448-G Marinelli beakers and transported to Boulby Underground Laboratory for HPGe screening.
Each batch of Gd2(SO4)8H2O contained excess water from the production process. The amount of extra water in each batch was monitored by SK during Gd loading, averaging w/w across the samples included in this analysis. Therefore, the mass of each sample in this study is taken to be kg of Gd2(SO4)8H2O.
This study utilised 30 individual sample measurements from the SK screening effort, resulting in 15.9 kgyr of Gd2(SO4)8H2O exposure, or 6.7 kgyr of natural Gd, on ULB HPGe detectors at Boulby. This represents the largest exposure of ULB gadolinium to date for conducting a search for rare Gd decays.
The BUGS facility houses several ULB HPGe detectors bugslab . These include ”Merrybent” and ”Belmont,” both p-type coaxial detectors with masses of 2.0 kg and 3.2 kg, and relative efficiencies of 110% and 160%, respectively. Their background levels and resulting minimum detectable activities are reported in bugsdetectors .
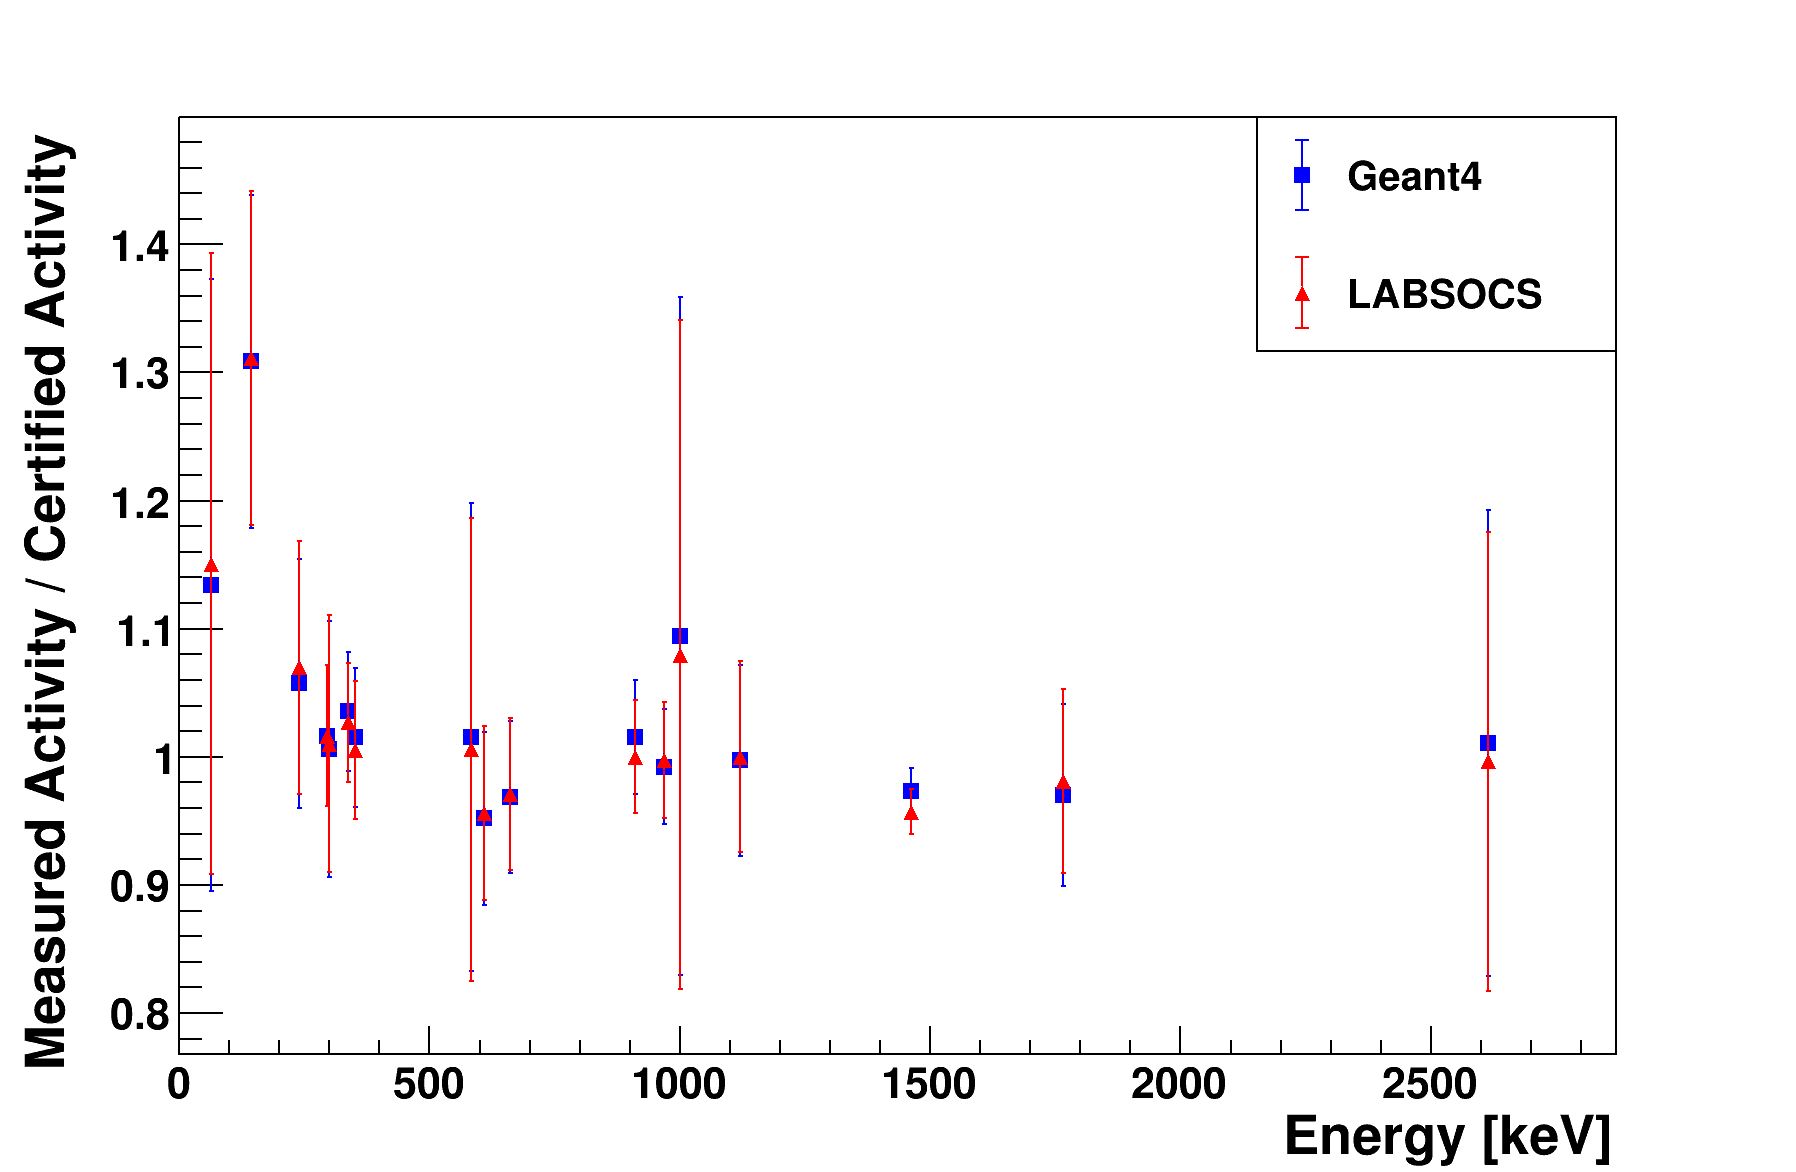
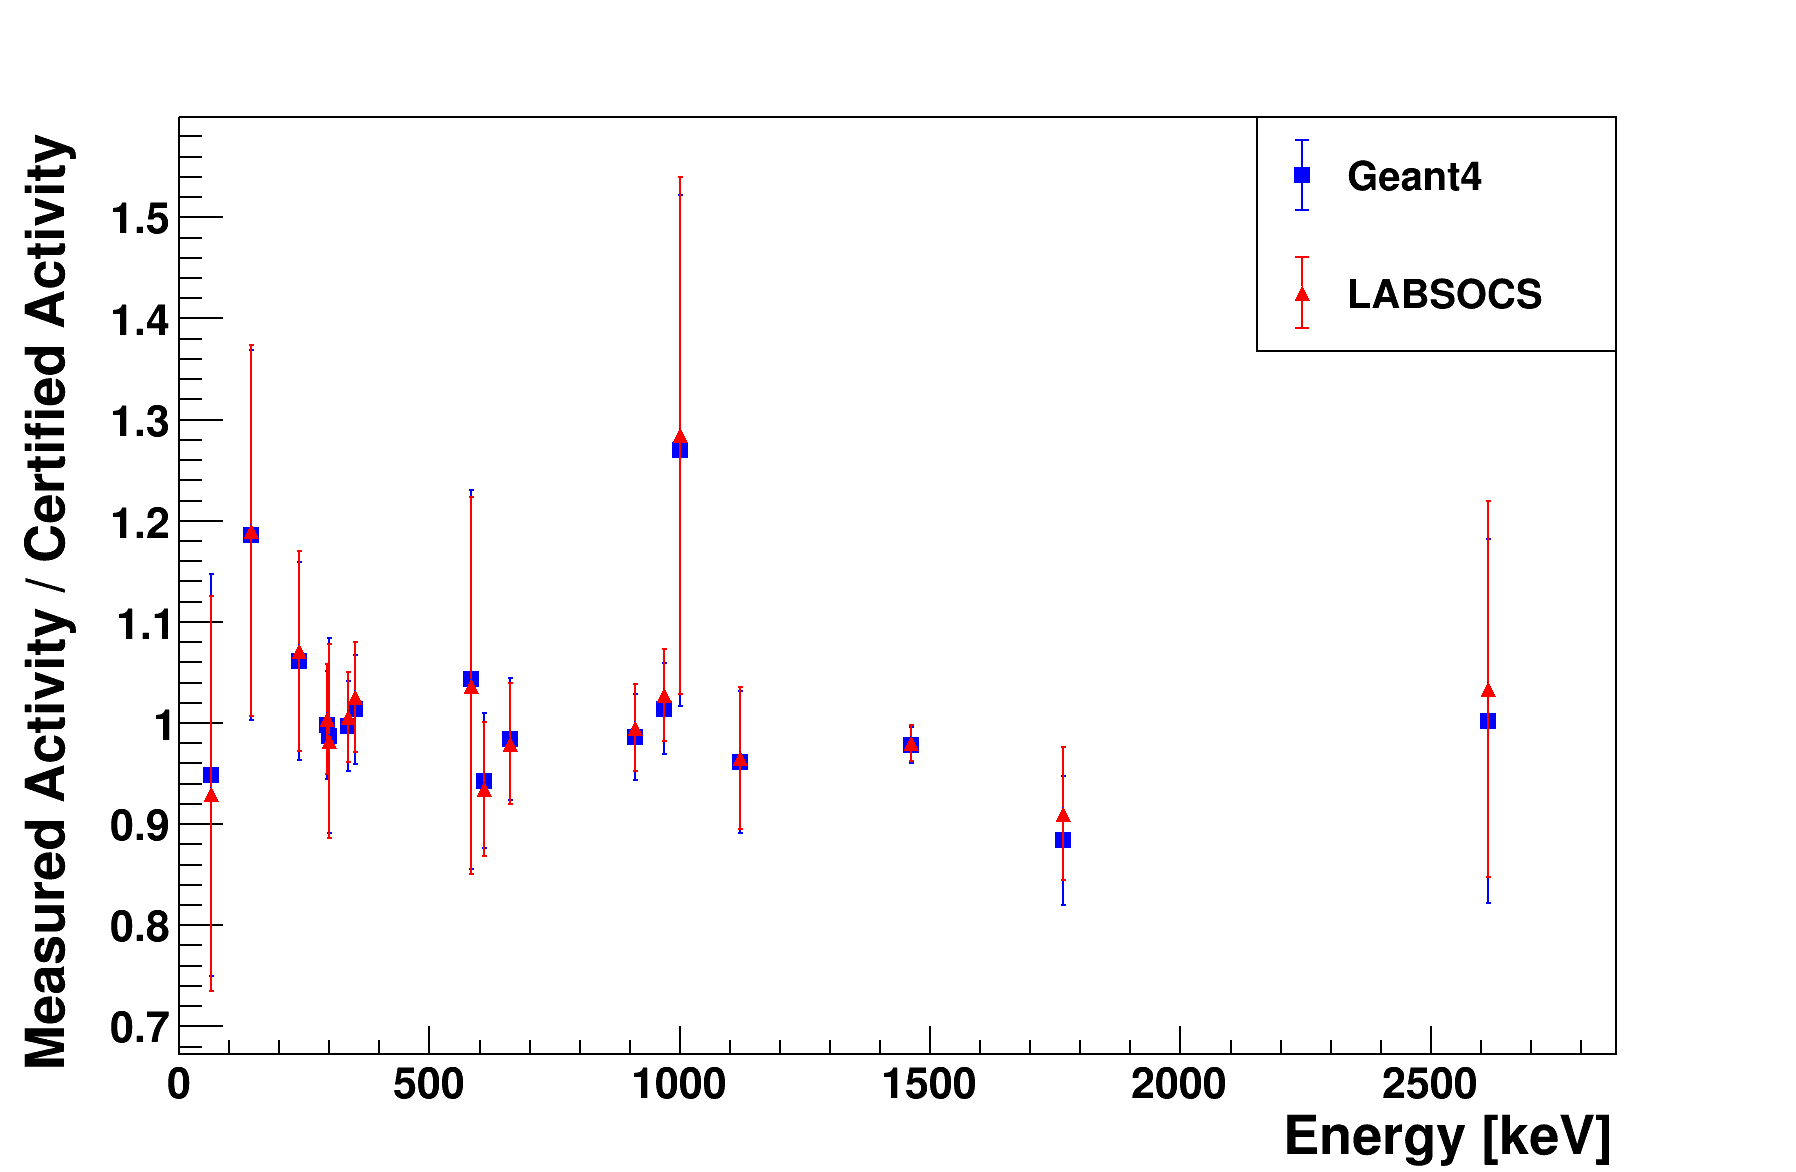
The full energy peak efficiency and true coincidence summing factors for Merrybent and Belmont are calculated using a custom Geant4 geant4 simulation of the detectors, shielding, and sample geometry. This simulation, described in boulby2018 , is validated against a LabSOCS labsocs efficiency simulation by measuring an IAEA-385 Irish Sea Sediment standard reference material on each detector. Both the Geant4 and LabSOCS calculated efficiencies and coincidence summing factors are applied to the IAEA-385 measurement and compared with the certified values. Good agreement is achieved across all analysed nuclides after accounting for coincidence summing and half-life corrections of the certified reference activities. Figures 2 and 3 demonstrate that the ratio of calculated reference source activities to the certified values is within of unity across all analysed nuclides. Consequently, the efficiencies calculated by the Geant4 simulation agree with those calculated using LabSOCS.
The Geant4 simulation package for Belmont and Merrybent was used to calculate the full energy peak efficiency for the expected gammas from the double beta decay of 160Gd to the 160Dy , , and levels, the alpha decay of 152Gd to the 148Sm level, and the alpha decay of 154Gd to the 150Sm level. The excited daughter states were generated, and the detected energy spectrum was analysed to determine the combined effect of detection efficiency and coincidence summing factors. The total efficiency factors for Belmont and Merrybent are reported in Table 5.
3 Cosmic Ray Activation of Natural Gd
During its time on the Earth’s surface and in transit from Japan to England, the Gd2(SO4)8H2O material was exposed to high-energy cosmic rays. Potential long-lived radioisotope production was investigated using an ACTIVIA activia simulation of cosmogenic neutrons on natural Gd. While the activation of each measured batch varied, it generally consisted of several weeks of processing, storage, and transport at ground level, approximately one day in air transportation, and then several additional weeks on the surface before being transported underground. For modelling purposes, we simulated one month of activation at sea level, one day at 35,000 ft, and one additional month at sea level. Finally, a seven-day cooling-off period was simulated to represent the time spent underground at Boulby before screening commenced. ACTIVIA provides the corresponding neutron flux spectra as a function of atmospheric depth. After the activation and cooling-off periods, the remaining long-lived unstable products are isotopes of Eu, Gd, and Tb, as well as other isotopes produced through spallation and decay processes. Many of the most significant expected activation or spallation products with detectable gammas from the simulation are shown in Table 1, with those having significant expected gammas indicated.
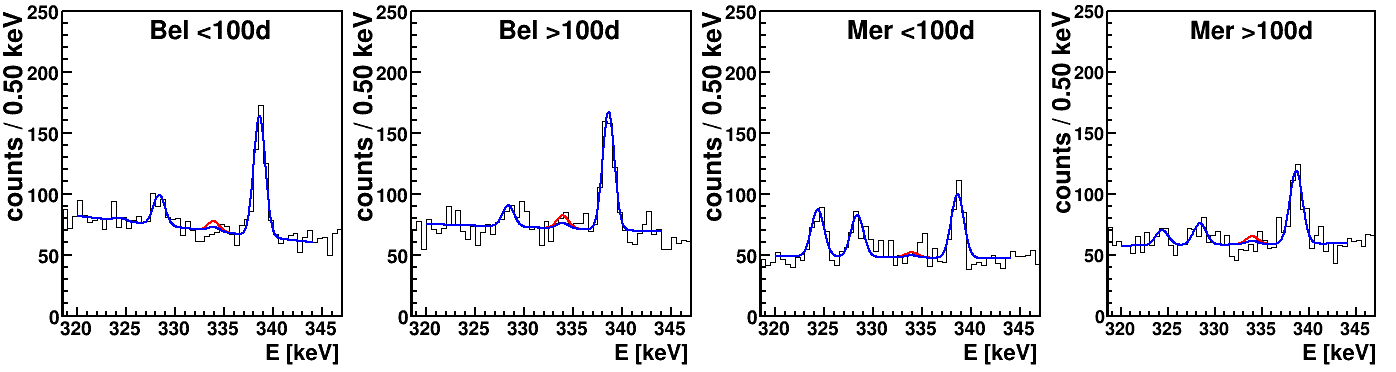
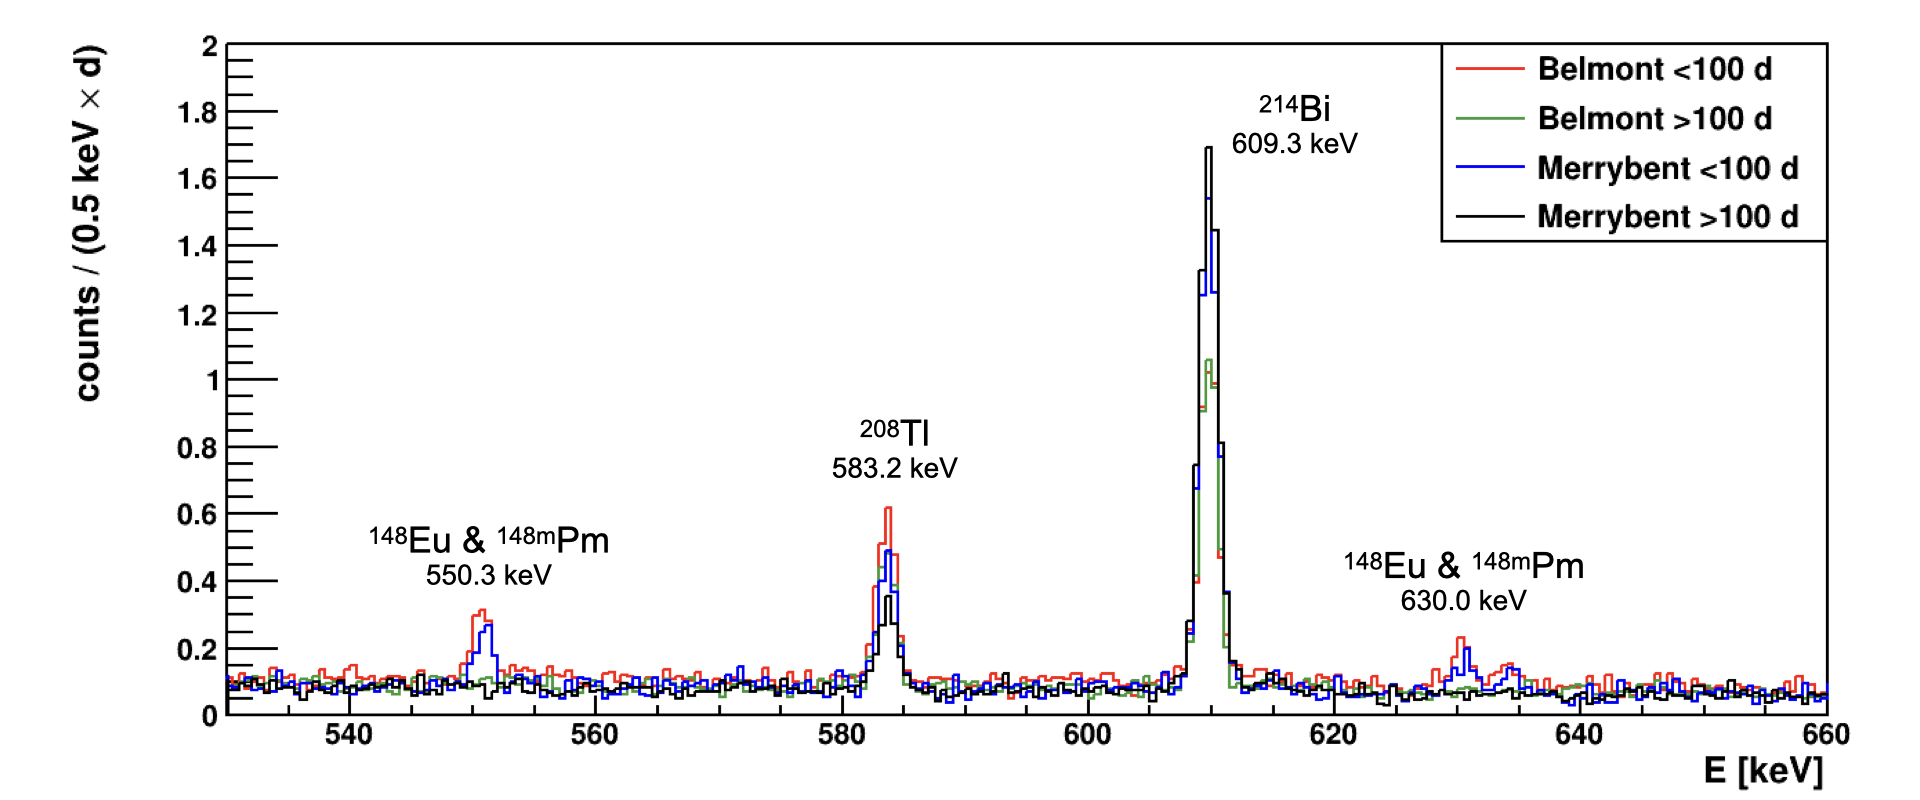
Activation products with gammas in the regions of interest for this rare Gd decay search are particularly problematic. Notably, 148Eu and 148mPm have strong gammas (550.3 keV, Iγ>95%, d and d, respectively nds148 ) that interferes with the 152Gd alpha decay search. The half-lives of these isotopes are similar in magnitude to the typical time between upper-atmosphere exposure to cosmic radiation and sample measurement on underground, ULB HPGe detectors. The residual activity of 148Eu following simulated activation indicates the potential for medium-lived gamma interference within these measured Gd2(SO4)8H2O samples. This interference is most significant in samples screened soon after being brought underground. Both 550 keV and 630 keV gamma peaks are observed in the combined detector spectra (Figure 4), with relative intensities consistent with literature values. A possible interference at 550 keV from 220Rn is dismissed as the peak area would imply a 232Th-chain activity which is two orders of magnitude greater than that observed from 208Tl.
Other identified activation products in the datasets include 146Eu, 154Eu, 54Mn, 95Tc, and 143Pm (see Table 1). Although sulfate activation was not simulated with ACTIVIA, the light spallation product 7Be was observed in the d datasets. Possible interferences around 835 keV between 95Tc, 54Mn, and 228Ac are currently under investigation.
Due to the inconsistent cosmic ray irradiation and ”cooling-down” periods of the Gd2(SO4)8H2O samples before HPGe screening, the screening results were separated based on whether the screening commenced less than or greater than 100 days after being transported underground and shielded from cosmic rays. This cutoff was chosen to minimise the impact of interfering gammas while retaining a significant portion of the sample exposure for the 152Gd alpha decay search. Figure 4 shows the relevant region for 148Eu gammas for the Belmont <100 d, Belmont >100 d, Merrybent <100 d, and Merrybent >100 d datasets. The 100-days cutoff effectively eliminates the small but significant gamma peaks from both strong gamma emitters.
| Isotope |
|
|
Significant Gammas |
|
||||||
|---|---|---|---|---|---|---|---|---|---|---|
| 156Eu | 15.2 | 0.33 | 811.8 keV (9.7%) | |||||||
| 149Gd | 9.28 | 0.27 | 346.7 keV (23.7%) | |||||||
| 156Tb | 5.4 | 0.20 | 534.3 keV (67%) | |||||||
| 148Eu(*) | 54.5 | 0.12 | 550.3 keV (99%), 630.0 keV (71.9%) | |||||||
| 160Tb | 72.4 | 0.08 | 879.4 keV (30%) | |||||||
| 145Eu | 5.93 | 0.08 | 893.7 keV (66%) | |||||||
| 143Pm | 265 | 0.06 | 741.9 keV (38.5%) | |||||||
| 131Ba | 11.5 | 0.04 | 496.3 keV (48%) | |||||||
| 146Eu | 4.51 | 0.03 | 747.2 keV (98%), 633-634 keV (sum: 81.8%) | |||||||
| 7Be | 53.3 | 0.01 | 477.6 keV (10.4%) | |||||||
| 154Eu | 2993 | 0.009 | 1274.4 keV (34.8%) | |||||||
| 105Ag | 41.3 | 0.008 | 344.6 keV (42%) | |||||||
| 144Pm | 363 | 0.007 | 618.0 keV (98%), 696.5 keV (99.5%) | |||||||
| 113Sn | 115 | 0.006 | 391.7 keV (65%) | |||||||
| 119Te | 4.68 | 0.005 | 1212.7 keV (66%) | |||||||
| 152Eu | 4891 | 0.005 | 1408.0 keV (15%), 964.1 keV (10.5%) | |||||||
| 85Sr | 64.8 | 0.005 | 514.0 keV (96%) | |||||||
| 88Zr | 83.4 | 0.004 | 392.9 keV (97.3%) | |||||||
| 99Rh | 15 | 0.004 | 528.2 keV (37.9%), 353.1 keV (34.5%) | |||||||
| 95Tc | 61 | 0.004 | 582.1 keV (30%), 835.1 keV (26.6%) | |||||||
| 106Ag | 8.5 | 0.003 | 1045.8 keV (29.6%) | |||||||
| 148mPm(*) | 41.3 | 0.003 | 550.3 keV (94.9%), 630.0 keV (89%) | |||||||
| 54Mn | 312 | 0.001 | 834.8 keV (99.98%) |
(*) The observed activity assumes all counts attributed to this nuclide.
4 Sample Characterization
The concentration of chemical impurities in a subset of the Gd2(SO4)8H2O samples was determined using a quadrupole inductively coupled plasma mass spectrometer equipped with collision cell (Agilent model 7850). The results are presented in Table 2. A semi-quantitative analysis was performed, calibrating the instrument with a single standard solution containing 1 ppb of Li, Co, Y, Ce, and Tl. The uncertainty in the measured concentrations is approximately 25%. The contamination of K was measured by high-resolution inductively coupled plasma mass spectrometry (HR-ICP-MS, Thermo Fisher Scientific ELEMENT2) in “cool plasma” mode in order to enhance the sensitivity.
For each sample, 150 mg of Gd-containing material was placed in a plastic vial with 5 ml of ultrapure water and 0.5 ml of nitric acid. This mixture was then placed in an ultrasonic bath at C until complete sample decomposition. The resulting solutions were diluted with ultrapure water to a total volume of 10 ml (a dilution factor of approximately 2000) in preparation for ICP-MS analysis.
| Element | 190502 | 190804 | 220471 | 210601 | 190705 | 210811 | 210711 | 190904 |
|---|---|---|---|---|---|---|---|---|
| K | 380 | 295 | 200 | 635 | 440 | 425 | 300 | 210 |
| Ba | 6 | 7 | 8 | 6 | 18 | 17 | 8 | 8 |
| La | 147 | 60 | 10 | 2 | 58 | 10 | 20 | 35 |
| Ce | 8 | 5 | 5 | 3 | 13 | 2 | 5 | 4 |
| Nd | 40 | 10 | 20 | 20 | 120 | 50 | 50 | 30 |
| Pr | 12 | 2 | 7 | 2 | 40 | 1 | 1 | 2 |
| Sm | 185 | 230 | 20 | 6 | 215 | 20 | 50 | 220 |
| Eu | 95 | 200 | 6 | 5 | 685 | 12 | 13 | 170 |
| Tb | 135 | 140 | 70 | 137 | 96 | 130 | 110 | 97 |
| Lu | 3000 | 3000 | 3000 | 3000 | 3000 | 3000 | 3000 | 3000 |
| Th | 1 | 1 | 1 | 1 | 1 | 1 | 1 | 1 |
| U | 1 | 1 | 1 | 1 | 1 | 1 | 1 | 1 |
The results in Table 2 demonstrate the high chemical purity of the Gd-containing samples, confirming the effectiveness of the purification process employed during production. For example, the purification is highly effective at removing U and Th, with upper limits below 1 ppb established. The sensitivity of the ICP-MS measurements for these two elements could be further improved by employing a pre-concentration technique using anion-exchange resins Ito2017 ; Nisi17 .
The high detection limit for Lu (3000 ppb) is caused by significant interference of signals from this element with the signal from the matrix (primarily GdOH+ ions). Similarly, the signal from Tb is affected by interference from GdH+ ions.
The radiopurity of all Gd2(SO4)8H2O powder samples used in this analysis was previously reported by SK gdproduction ; secondgdloading . For comparison with the ICP-MS measurements performed in this study, a subset of ULB HPGe-measured radiopurity values is reproduced in Table 3.
| Chain | Nuclide | Specific activity, mBq/kg, 95% C.L. limits | |||||||
|---|---|---|---|---|---|---|---|---|---|
| 190502 | 190804 | 220471 | 210601 | 190705 | 210811 | 210711 | 190904 | ||
| 238U | 234Th | ||||||||
| 214Pb | |||||||||
| 235U | 235U | ||||||||
| 227Th | |||||||||
| 232Th | 228Ac | ||||||||
| 208Tl | |||||||||
| 176Lu | |||||||||
| 137Cs | |||||||||
| 138La | |||||||||
| 40K | |||||||||
The upper detection limit for , less than (1–6) mBq/kg, corresponds to a concentration of natural potassium of less than 32–192 ppb. These are in slight disagreement with the concentrations of natural potassium reported by ICP-MS. The BUGS laboratory is located within the potash layer of the Boulby Mine, so the potassium background is greater and sensitivities worse compared to other underground sites around the world.
Similarly, the observed specific activity of in sample 190502 (0.12 mBq/kg) corresponds well with the highest concentration of La (approximately 150 ppb) among all samples measured using ICP-MS.
decays through beta decay with gamma emission. The detected activity of this radioisotope in all analysed samples, at the level of (0.12–7.11) mBq/kg, corresponds to a natural lutetium concentration of 2.3–137.0 ppb. This result agrees well with the established detection limit for Lu in the ICP-MS measurements (<3000 ppb). However, due to the strong interference effects with chemical elements of the complex compound observed with ICP-MS, gamma-ray spectrometry provides a more precise evaluation of the Lu concentration in Gd2(SO4)8H2O samples.
It is important to note that chemical reactions and transformations typically disrupt the secular equilibrium in natural radioactive decay chains. This disruption is primarily driven by the chemical properties of the daughter nuclides in the U/Th chains. Furthermore, the production technology for the Gd2(SO4)8H2O material used in SK was modified at least twice, leading to different disruptions of the secular equilibrium in each production run111Samples numbered 19xxxx were from the first production run. Samples numbered 21xxxx or 22xxxx were from the second production run, where radium was reduced further compared with the earlier batches.. This variation can be observed in the specific activities of the radionuclides from the natural U/Th decay chains.
The isotopic composition of gadolinium was determined through complementary measurements of the eight Gd2(SO4)8H2O samples selected for comparative chemical and radiopurity studies. HR-ICP-MS analysis was conducted at LNGS, and the results are presented in Table 4. The measured isotopic composition of gadolinium in all eight samples is consistent with natural abundance, within the quoted uncertainties. Therefore, tabulated values for the natural isotopic composition of gadolinium were used in subsequent analyses.
| Sample | |||||||
|---|---|---|---|---|---|---|---|
| 190502 | |||||||
| 190804 | |||||||
| 220471 | |||||||
| 210601 | |||||||
| 190705 | |||||||
| 210811 | |||||||
| 210711 | |||||||
| 190904 | |||||||
| Tabulated value |
5 Datasets
Gd2(SO4)8H2O samples were measured at BUGS from September 2019 to February 2024 (Table 6 in appendix). Each sample was screened until achieving a sensitivity of <0.5 mBq/kg for the 609.3 keV gamma ray from 214Bi, at a 95% confidence level. In some instances, such as during the first UK COVID-19 lockdown from March to May 2020, sample measurements continued beyond the time required to reach this sensitivity due to restricted underground access. The inherent radioactivity of each batch is reported in gdproduction and secondgdloading , relative to the SK requirements. This Gd2(SO4)8H2O material was among the most radiopure ever screened at Boulby, necessitating additional corrections to the spectral analysis to account for the shielding of background sources by the large, dense samples bkgshield .
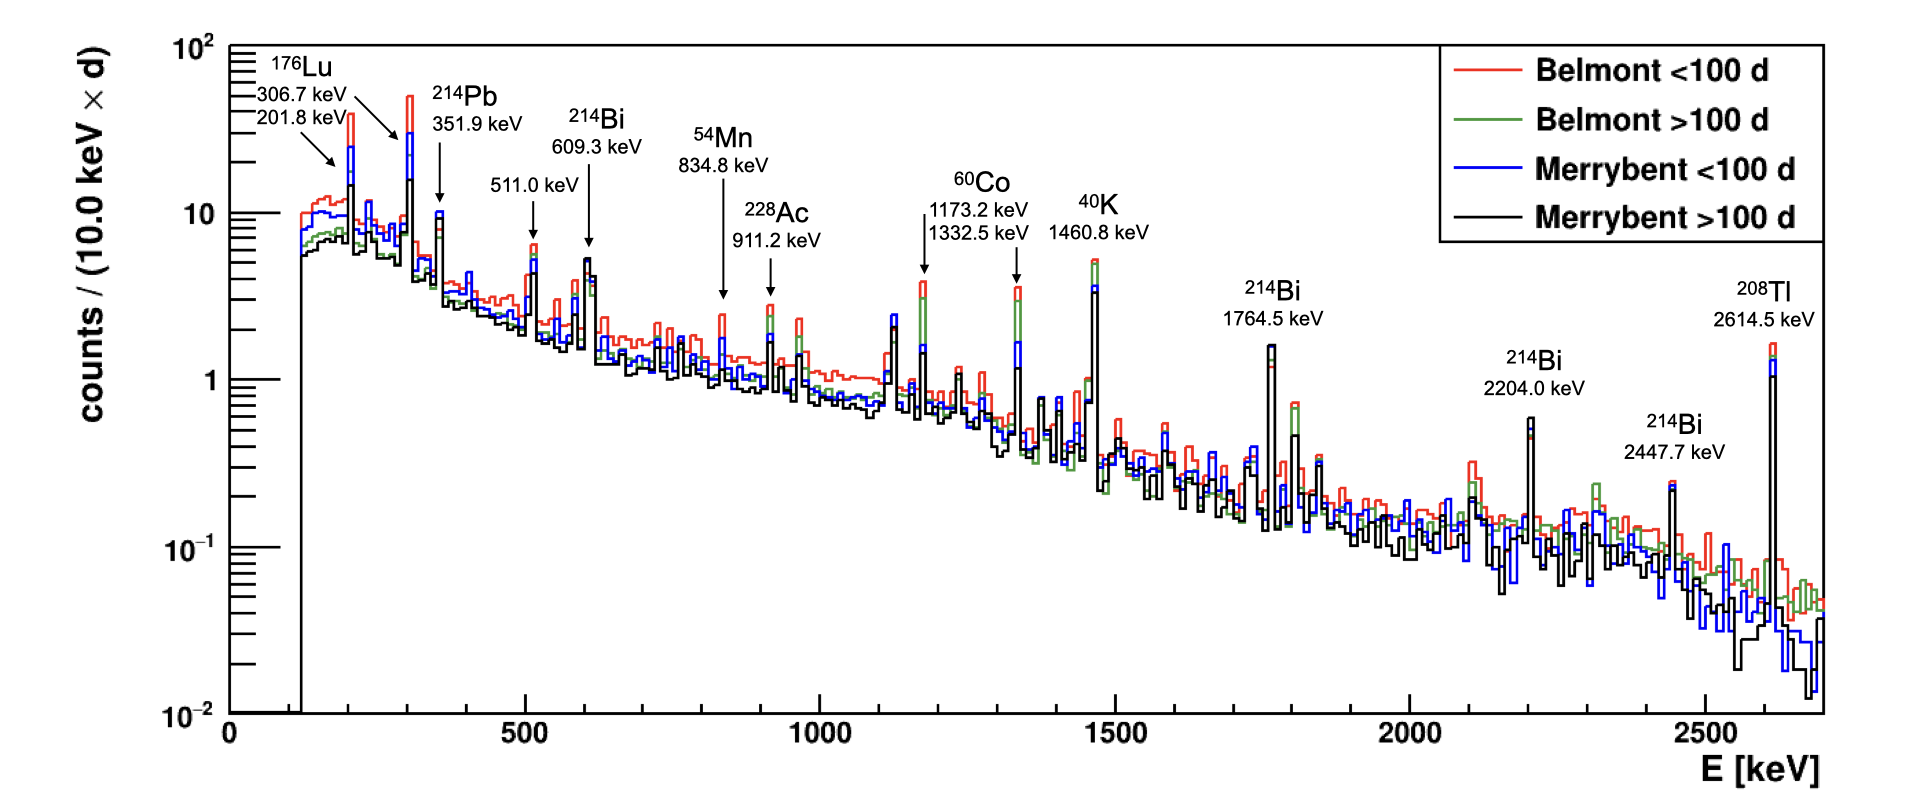
To account for drift in the absolute ADC calibration, fluctuating backgrounds, and external factors affecting detector resolution, each measured spectrum was individually calibrated. This calibration procedure involved identifying significant peaks attributable to common naturally occurring radioactive material (NORM) gamma full energy peaks. Depending on the Gd batch, these peaks could include 201.83 keV and 306.82 keV from 176Lu, 295.22 keV and 351.93 keV from 214Pb, 609.31 keV, 1120.29 keV, 1764.49 keV, and 2204.21 keV from 214Bi, 911.20 keV and 968.96 keV from 228Ac, 583.19 keV and 2614.51 keV from 208Tl, and 1173.21 keV and 1332.49 keV from 60Co. A linear ADC calibration was evaluated for each spectrum based on the locations of these peaks and the literature gamma energy values. The Gaussian width parameter of each fitted peak was also used to estimate the detector energy resolution, , with the functional form: , where and are free parameters. The resolution for each detector remained stable throughout the screening programme. The corresponding values for the gamma energies of interest for this analysis are shown in Table 5.
Detector stability was monitored throughout the Gd measurement period using several methods. The inherent background spectrum, measured multiple times during the screening programme, was checked for consistency. Periods exhibiting higher-than-normal background levels were investigated and generally attributed to external factors, such as N2 purge failures. Additionally, periodic measurements of a check source containing 37 kBq of both 155Eu and 22Na were conducted to monitor the full energy peak width of the characteristic gamma rays and the dead layer thickness. The latter was determined by examining the ratio of the count rate in the 86.5 keV and 105.3 keV peak areas. Datasets exhibiting fluctuations in detector background or full energy peak resolution indicative of suboptimal detector conditions were excluded.
The calibrated spectra from each detector were rebinned and combined according to the <100 day and >100 day classifications. Figure 5 displays the full spectra in 10 keV bins for all four combined datasets. Statistical analysis of the rare event search employed 0.5 keV binned spectra.
6 Analysis
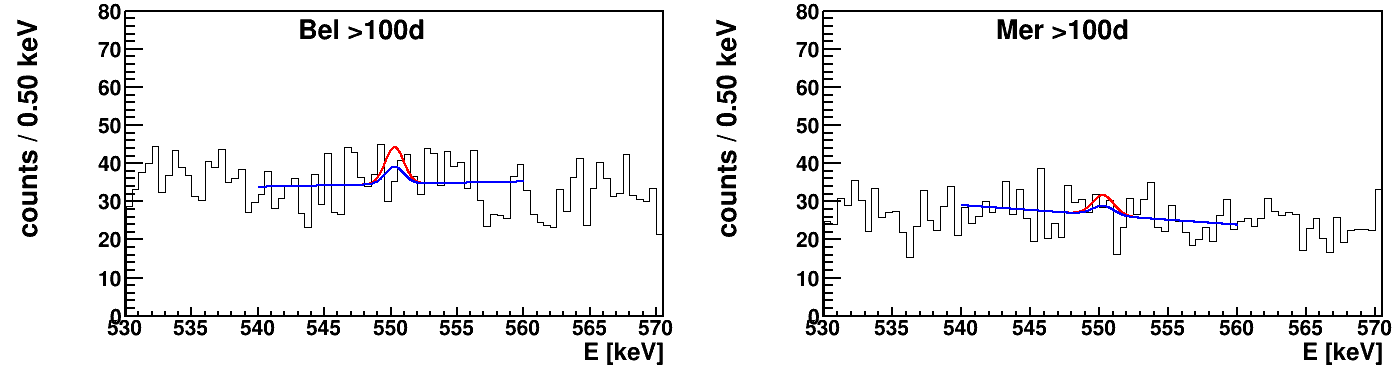
This analysis builds upon the work presented in Laubenstein23 , employing the same peak search procedure based on Bayesian statistics (see Eqs. (5), (6), and (7) from that manuscript) and incorporating the results from the same study as prior input. For this study, as in the previous one, an independent analysis is performed for each decay mode. All four datasets are combined using fits with a single inverse half-life parameter but independent nuisance parameters. To avoid interference from cosmogenically produced isotopes (148Eu and 148mPm), only the two datasets with >100 days underground are used for the alpha decay of . The marginalized posteriors of from Laubenstein23 serve as prior functions for in this analysis.
The live times, , of the four datasets were as follows: (i) 0.81919 yr for Belmont <100 d; (ii) 1.03781 yr for Belmont >100 d; (iii) 0.60820 yr for Merrybent <100 d; and (iv) 0.88705 yr for Merrybent >100 d. The mass of the gadolinium sample was 4.78 kg for all samples and datasets, corresponding to , , atoms of , , and , respectively. The uncertainties associated with sample mass and isotopic abundance are subdominant and correlated to the uncertainty of the detection efficiency (10%); therefore, they are neglected. The detection efficiencies and energy resolutions, which differ by detector but share the same prior input for the <100 d and >100 d division, are provided in Table 5. It is important to note that each dataset has its own fit parameters, allowing for systematic variations between datasets even with identical input values.
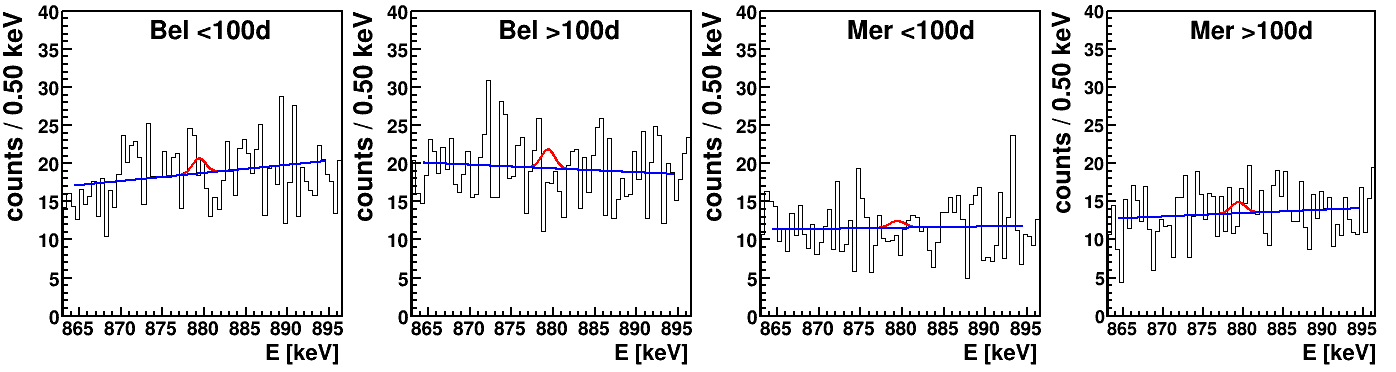
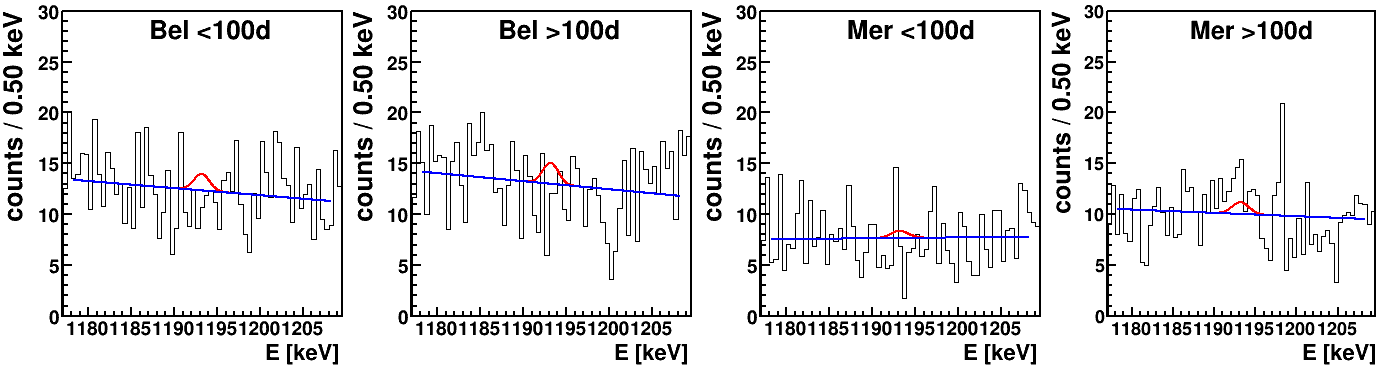
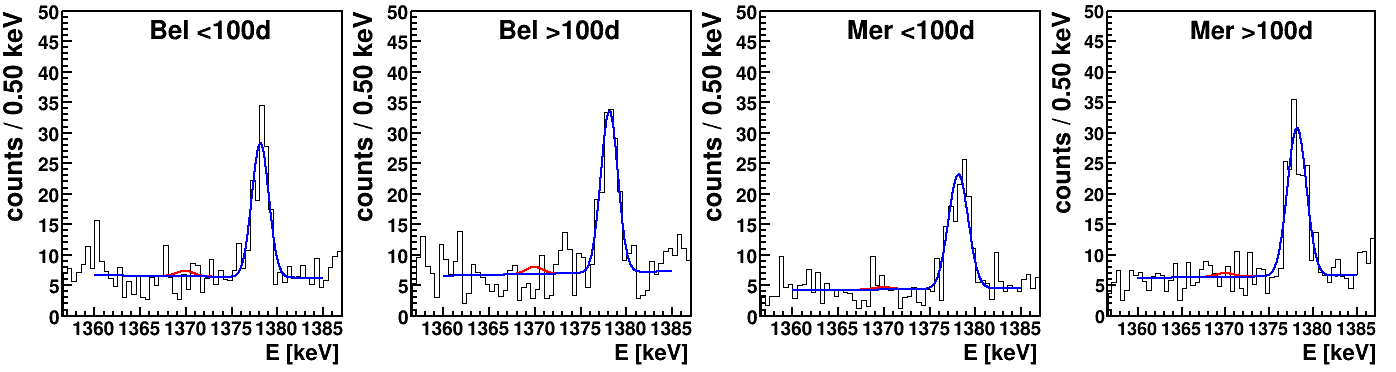
The spectral fits for all decay modes are shown in Figures 6–10 in the Appendix. The best-fit functions are shown in blue. All investigated rare decay modes are consistent with the assumption of no detected signal. The fit functions with the signal process set to the 90% credibility limit are shown in red.
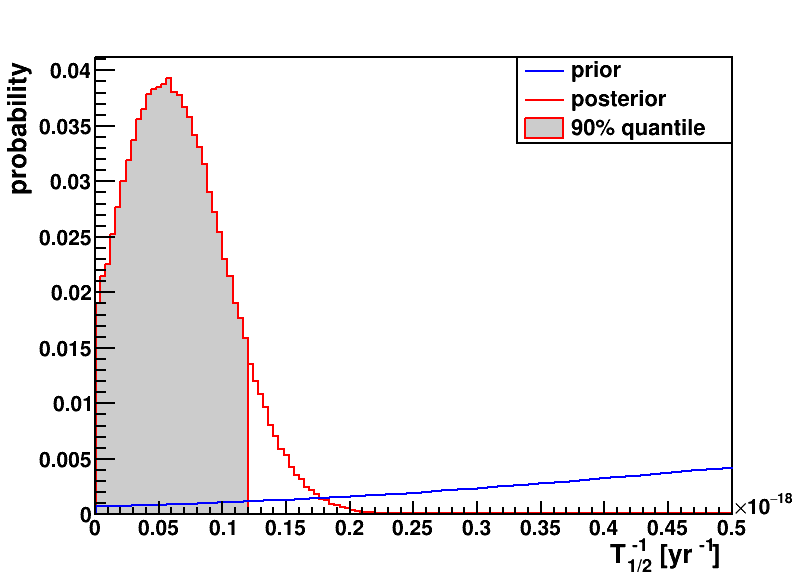
The 90% quantiles of the marginalized posteriors of yield the limits. These distributions are shown in red in Figure 11 in the Appendix. The blue curves represent the priors from Laubenstein23 , and the shaded areas indicate the 90% probability regions of the posterior.
The lower half life limits are presented in the last columns of Table 5, showing the previous limits from Laubenstein23 , the limits obtained using only data from this work (flat prior in ), and the combined data as described above.
The data combination results in both higher and lower limits compared to using the new data alone but does not significantly influence the overall results. This outcome is attributed to the significantly greater amount of data and sensitivity in the present work, resulting in a relatively flat and uninformative prior. Random over- or under-fluctuations in the previous data only slightly inform the Bayesian parameter interpretation of the new data. Nevertheless, using the combined results is recommended, as they utilise more experimental data and avoid bias from selecting the best limit. Therefore, the reported posteriors in Figure 11 can serve as prior input for future searches.
| Nuclide (decay) | Daughter (level) | -lines | Det. eff. | T1/2 (90% C.I.) | T1/2 (90% C.I.) | T1/2 (90% C.I.) | |
| ( keV) | [keV] | [%] | [keV] | [yr] old Laubenstein23 | [yr] new | [yr] comb. | |
| ( | 879.4 | 1.23, 0.84 | 0.84, 0.95 | (*) | |||
| ( | 1193.2 | 2.06, 1.37 | 0.90, 1.03 | ||||
| ( | 1369.9 | 1.89, 1.24 | 0.94, 1.08 | ||||
| () | ( | 550.3 | 2.56, 1.82 | 0.70, 0.78 | |||
| () | ( | 333.9 | 2.64, 1.93 | 0.60, 0.67 |
(*) the old half-life limit is based on a combined fit of two -lines
7 Discussion
It is noteworthy that the sensitivity of modern experimental techniques, such as the ULB HPGe gamma spectrometers employed in this study, allows for the investigation of rare nuclear processes even within routine materials screening campaigns. This study demonstrates the feasibility of achieving experimental sensitivities of 10 years for various rare nuclear processes in natural Gd isotopes. This was accomplished using a set of large-mass Gd-containing samples with a total exposure of 6.7 kgyr of natural Gd, originally intended for radiopurity assays.
None of the investigated decay modes yielded an observable signal. 90% credibility limits were established using a Bayesian analysis that accounted for dominant systematic uncertainties. The recently established experimental limits from Laubenstein23 were improved by approximately two orders of magnitude. However, these experimental limits for the alpha decays of and remain far from theoretical expectations ( yr and yr, respectively). Calculations for the expected half-lives of various double beta decay modes of are still pending.
Further improvements in experimental searches for rare decays of , , and are challenging within the ”source detector” approach. This limitation arises from two main disadvantages of this technique: (i) the decrease in detection efficiency with decreasing gamma energy due to absorption in surrounding materials (e.g., sample container, end cap, and Ge crystal holder); and (ii) the limited benefit of increasing sample mass due to increased self-absorption.
Therefore, innovative experimental approaches that significantly enhance detection efficiency, such as those described in Nagorny21 , or increase the number of isotopes of interest through enrichment Beeman2015 are necessary. The latter option appears more promising, as the potential sensitivity enhancement would be the product of the enrichment factor and the improvement in detection efficiency achieved through reduced sample dimensions and self-absorption. This enhancement could range from a factor of 5 to several orders of magnitude.
A more substantial enhancement in detection efficiency for the processes of interest could be achieved by implementing the ”source = detector” approach. In this approach, the decaying Gd nuclei are embedded within the detector’s sensitive volume, which could be a liquid scintillator, a crystal scintillator, or a bolometer/scintillating bolometer. This configuration enables the detection of not only de-excitation gamma quanta but also short-range particles (alpha and beta particles) in the final reaction channel. This capability allows for further background rejection through coincidence measurements of different reaction products.
Furthermore, effective particle identification based on pulse-shape discrimination, variations in emitted scintillation light, or variations in the ratio of emitted light to phonon signal would enable the detection of alpha decay to ground states. This capability would also enhance the experimental sensitivity to decay modes that occur through transitions to excited states of daughter nuclei. Finally, this experimental approach accommodates the use of a much larger sample mass.
For example, the PIKACHU (Pure Inorganic scintillator experiment in KAmioka for CHallenging Underground sciences) project was recently initiated to fabricate high-purity Ce-doped Gd3Ga3Al2O12 (GAGG - Gadolinium Aluminium Gallium Garnet) single crystals for studying all modes of double beta decay omori2024first . This experiment benefits from a combination of technological expertise and successful multi-ton Gd-salt purification for the SK experiment gdproduction and in-house growth of GAGG single crystals with strict control at each production stage. Moreover, crystal growth leverages the well-developed technology of GAGG single crystal production (see, for instance Kamada12 and Kamada16 ), driven by commercial market demands. Consequently, high-quality, large-volume scintillating crystals with masses of a few kilograms are commercially available.
Initially, PIKACHU will employ two GAGG scintillating crystals, 6.5 cm in diameter and 14.5 cm in length, each containing 710 g of . Due to the excellent light yield (approximately 50,000 photons/MeV) and pulse-shape discrimination capability of these crystals, a sensitivity level of years is anticipated for the double beta decay modes of . Subsequently, twenty large-volume, high-radiopurity GAGG crystals will be used to further enhance the experimental sensitivity. Therefore, the most stringent constraints on not only double beta decay modes but also rare alpha decays of and will likely emerge from this experiment in the near future.
8 Conclusion
This study investigated rare nuclear decay modes in natural gadolinium isotopes using high-purity samples originally intended for the Super Kamiokande neutrino experiment. Despite achieving a sensitivity of years, no evidence for alpha or double beta decay to excited states of daughter nuclides was observed. The resulting limits improve upon previous measurements by two orders of magnitude. Future searches employing enriched isotopes or the ”source = detector” approach are necessary to reach the theoretical predictions for these decays. Projects such as PIKACHU, which leverage high radiopurity GAGG scintillating crystals, hold promise for achieving the required sensitivities and providing crucial insights into rare nuclear processes that may occur in Gd isotopes and neutrino properties.
Acknowledgements.
The authors express their sincere gratitude to the Super-Kamiokande Collaboration for providing the Gd samples used in this study. This work was supported by the U.K. Science and Technology Facilities Council [grant numbers ST/T00200X/1, ST/V002821/1, ST/V006185/1, ST/X002438/1]. We would also like to thank Ruben Saakyan who suggested looking for rare decays in gadolinium screening data and connected our small collaboration.References
- (1) L. Brown, Phys. Today 31, 9 (1978) https://doi.org/10.1063/1.2995181
- (2) C. L. Cowan, F. Reines, F. B. Harrison, H. W. Kruse, A. D. McGuire, Science, 124, 3212 (1956) https://doi.org/10.1126/science.124.3212.103
- (3) M. J. Dolinski, A. W. P. Poon, W. Rodejohann, Annu. Rev. Nucl. Part. Sci. 69, 219, 51 (2019) https://doi.org/10.1146/annurev-nucl-101918-023407
- (4) R. N. Mohapatra, et al., Rep. Prog. Phys. 70, 1757 (2007) https://doi.org/10.1088/0034-4885/70/11/R02
- (5) E. Takasugi, Phys. Lett. B 149 (1984) https://doi.org/10.1016/0370-2693(84)90426-X
- (6) J. Schechter, J. W. F. Valle, Phys. Rev. D 25 (1982) https://doi.org/10.1103/PhysRevD.25.2951
- (7) F. T. Avignone, S. R. Elliott, J. Engel, Rev. Mod. Phys. 80 (2008) https://doi.org/10.1103/RevModPhys.80.481
- (8) M. Fukugita, T. Yanagida, Phys. Lett. B 174 (1986) https://doi.org/10.1016/0370-2693(86)91126-3
- (9) F. F. Deppisch, L. Graf, J. Harz, W.-C. Huang, Phys. Rev. D 98, 055029 (2018) https://doi.org/10.1103/PhysRevD.98.055029
- (10) B. Pritychenko, V.I. Tretyak, Atomic Data and Nuclear Data Tables 161, 101694 (2025) https://doi.org/10.1016/j.adt.2024.101694
- (11) A. Barabash, Universe 9, 6, 290 (2023) https://doi.org/10.3390/universe9060290
- (12) D. S. Akerib, et al., Eur. Phys. J. C 80, 1044 (2020) https://doi.org/10.1140/epjc/s10052-020-8420-x
- (13) E. Aprile, et al., Eur. Phys. J. C 82, 599 (2022) https://doi.org/10.1140/epjc/s10052-022-10345-6
- (14) K. Abe, et al., Nucl. Instr. Meth. A 1027, 166248 (2022) https://doi.org/10.1016/j.nima.2021.166248
- (15) K. Hosokawa, et al., Prog. Theo. Exp. Phys. 2023, 1, 013H01 (2023) https://doi.org/10.1093/ptep/ptac170
- (16) K. Abe, et al., Nucl. Instr. Meth. A 1065, 169480 (2024) https://doi.org/10.1016/j.nima.2024.169480
- (17) M. Laubenstein, B. Lehnert, S. S. Nagorny, S. Nisi, Eur. Phys. J. C 83, 1114 (2023) https://doi.org/10.1140/epjc/s10052-023-12218-y
- (18) P. R. Scovell, M. Thiesse, S. A. Maouloud, C. Ghag, J. Dobson, Front. Phys. 11, 1310146 (2023) https://doi.org/10.3389/fphy.2023.1310146
- (19) P. R. Scovell, et al., J. Instrum. 19, P01017 (2024) https://doi.org/10.1088/1748-0221/19/01/P01017
- (20) J. Allison et al., Nucl. Instrum. Meth. A 835 (2016) https://doi.org/10.1016/j.nima.2016.06.125
- (21) P. R. Scovell, et al., Astropart. Phys., 97 (2018) https://doi.org/10.1016/j.astropartphys.2017.11.006
- (22) LabSOCS, Canberra Industries.
- (23) J. J. Back, Y. A. Ramachers, Nucl. Instr. Meth. A 586, 2 (2008) https://doi.org/10.1016/j.nima.2007.12.008
- (24) N. Nica, Nuclear Data Sheets 117, 1-229 (2014) https://doi.org/10.1016/j.nds.2014.02.001
- (25) National Nuclear Data Center https://www.nndc.bnl.gov (2020).
- (26) S. Ito, et al., Prog. Theor. Exp. Phys., 2017, 11, 113H01, (2017) https://doi.org/10.1093/ptep/ptx145
- (27) S. Nisi, L. Copia, I. Dafinei, M. L. Di Vacri, Intl. J. Mod. Phys. A 32, 30 (2017) https://doi.org/10.1142/S0217751X17430035
- (28) M. Thiesse, P. R. Scovell, L. Thompson, App. Rad. Iso. 188, 110384 (2022) https://doi.org/10.1016/j.apradiso.2022.110384
- (29) S. Nagorny, M. Laubenstein and S. Nisi, J. of Instr. 16 P03027 (2021) https://doi.org/10.1088/1748-0221/16/03/P03027
- (30) J. W. Beeman, et al., Eur. Phys. J. C 75, 12 (2015) https://doi.org/10.1140/epjc/s10052-015-3822-x
- (31) T. Omori, et al., Prog. Th. Exp. Phys. 2024, 3, 033D01 (2024) https://doi.org/10.1093/ptep/ptae026
- (32) K. Kamada et al., J. Cryst. Growth 352, 88 (2012) https://doi.org/10.1016/j.jcrysgro.2011.11.085
- (33) K. Kamada et al., J. Cryst. Growth 452, 15 (2016) https://doi.org/10.1016/j.jcrysgro.2016.04.037
9 Appendix
| Sample | Detector |
|
|
Start Date | ||||||
|---|---|---|---|---|---|---|---|---|---|---|
| 190502 | Belmont | 35.2 | < 100 | 2019/09/24 | ||||||
| 190604 | Belmont | 30.3 | > 100 | 2020/08/07 | ||||||
| 190704 | Belmont | 37.3 | < 100 | 2019/11/29 | ||||||
| 190706 | Belmont | 27.4 | < 100 | 2020/01/09 | ||||||
| 190804 | Belmont | 31.0 | < 100 | 2020/02/14 | ||||||
| 190902 | Belmont | 98.4 | < 100 | 2020/03/18 | ||||||
| 190902_2 | Belmont | 7.4 | > 100 | 2021/06/29 | ||||||
| 190902_3 | Belmont | 18.3 | > 100 | 2021/08/13 | ||||||
| 190904 | Belmont | 28.4 | > 100 | 2020/07/09 | ||||||
| 210601 (A) | Belmont | 54.1 | > 100 | 2022/02/18 | ||||||
| 210711 (C) | Belmont | 31.7 | < 100 | 2021/12/16 | ||||||
| 210712 (D) | Belmont | 37.7 | < 100 | 2022/12/20 | ||||||
| 210713_2 (E) | Belmont | 19.5 | > 100 | 2023/02/27 | ||||||
| 210811 (F) | Belmont | 25.2 | > 100 | 2022/04/14 | ||||||
| 211106_2 (K) | Belmont | 37.1 | > 100 | 2023/04/04 | ||||||
| 220241 (M) | Belmont | 40.2 | > 100 | 2023/06/09 | ||||||
| 220242 (N) | Belmont | 25.7 | > 100 | 2023/07/20 | ||||||
| 220251 (O) | Belmont | 36.9 | > 100 | 2023/09/15 | ||||||
| 220352 (Q) | Belmont | 20.4 | > 100 | 2023/11/01 | ||||||
| 220361 (S) | Belmont | 15.2 | > 100 | 2023/11/22 | ||||||
| 220471 (U) | Belmont | 20.4 | > 100 | 2024/01/25 | ||||||
| 190501 | Merrybent | 12.7 | < 100 | 2019/09/10 | ||||||
| 190606 | Merrybent | 28.5 | < 100 | 2019/10/24 | ||||||
| 190705 | Merrybent | 44.1 | < 100 | 2019/12/19 | ||||||
| 190705_2 | Merrybent | 24.9 | > 100 | 2021/07/01 | ||||||
| 190802 | Merrybent | 56.9 | > 100 | 2020/07/09 | ||||||
| 190806 | Merrybent | 45.1 | < 100 | 2020/03/11 | ||||||
| 210601 (A) | Merrybent | 9.2 | < 100 | 2021/09/02 | ||||||
| 210711 (C) | Merrybent | 93.0 | > 100 | 2022/11/17 | ||||||
| 210811 (F) | Merrybent | 61.3 | > 100 | 2023/06/09 | ||||||
| 210821 (G) | Merrybent | 82.7 | < 100 | 2021/12/16 | ||||||
| 210822 (I) | Merrybent | 20.2 | > 100 | 2023/11/01 | ||||||
| 211201_2 (L) | Merrybent | 20.3 | > 100 | 2023/11/22 | ||||||
| 220482 (W) | Merrybent | 24.4 | > 100 | 2024/01/04 | ||||||
| 220582 (Y) | Merrybent | 12.3 | > 100 | 2024/01/31 | ||||||
| 220691 (Z) | Merrybent | 10.5 | > 100 | 2024/02/13 |