CANUCS/Technicolor: JWST Medium Band Photometry Finds Half of the Star Formation at is Obscured
Abstract
We present a sample of 146 high-redshift () galaxies from the CANUCS/Technicolor surveys, showcasing photometry in every wide- and medium-band NIRCam filter in addition to ancillary HST data sampling (22 JWST bands out of 29 bands total). Additionally, 48 (33%) galaxies in our sample meet criteria to be classified as extreme emission line galaxies, 15 (10%) of which are completely missed by typical dropout selections due to faint UV emission. By fitting the SEDs covering the rest-frame UV to optical at , we investigate the dust obscuration properties, giving an unbiased view of dust buildup in high-redshift galaxies free from spectroscopic follow-up selection effects. Dust attenuation correlates with stellar mass, but more strongly with star formation rate. We find typical galaxies at have of their star formation obscured. However, since galaxies with higher star formation rates suffer more attenuation, of the total star formation rate density at is obscured. The obscured fraction drops to in our bin, possibly due to substantial dust grain growth in the interstellar medium not having time to occur. Extrapolating the decline in dust obscuration of galaxies to higher redshifts, we infer that dust obscuration should approach zero at , implying that epoch as when dust first forms in bright galaxies.
1 Introduction
Providing a full accounting of star formation is a critical component for building a complete understanding of galaxy evolution. Particularly, measurements of star formation conditions in the early universe place strong constraints on galaxy evolution models. One crucial component of early galaxies, which has received significant recent attention yet remains largely unconstrained, is their dust content (e.g., Algera et al., 2023; Ciesla et al., 2024; Cullen et al., 2024; Ferrara, 2024; Langeroodi et al., 2024). Dust plays a crucial role in properly interpreting observations of early galaxies because it preferentially attenuates light at shorter wavelengths and re-radiates it in the infrared (IR). For the highest redshift () galaxies, even with the James Webb Space Telescope’s (JWST’s) NIRCam (Rieke et al., 2023), we are limited to sampling the rest-frame ultraviolet (UV), meaning that dust may significantly affect our observations. Furthermore, by blocking the escape of UV photons, dust impacts galaxies’ contribution to cosmic reionization (see Robertson, 2021, for a review).
Observational work has firmly demonstrated that the majority of star formation is obscured by dust up to , with the peak in the obscured fraction of occurring at (Cucciati et al., 2012; Rowan-Robinson et al., 2016; Koprowski et al., 2017; Zavala et al., 2021). Spitzer MIPS and Herschel proved invaluable in performing this measurement out to , but beyond this range the poor spatial resolution, limited wavelength coverage, and poor sensitivity compared to UV-optical observations made measurements much more difficult. The Atacama Large Millimeter Array (ALMA) has enabled a revolution in this field with its vastly improved sensitivity and spatial resolution and extended the direct detection of dust emission up to and beyond (Capak et al., 2015; Willott et al., 2015; Watson et al., 2015; Laporte et al., 2017; Bakx et al., 2020; Bowler et al., 2022). Though a significant population of dusty star-forming galaxies exists at these redshifts (e.g., Laporte et al., 2017; Hygate et al., 2023), the total fraction of obscured star formation appears to decline toward higher redshift (Zavala et al., 2021; Algera et al., 2023; Traina et al., 2024), but perhaps not a quickly as previously inferred (Sun et al., 2025).
Despite significant effort, detections of the dust continuum deep into the Reionization Era at still number only in the tens, with many coming from the forty galaxies targeted by the Reionization Era Bright Emission Line Survey (REBELS) (Laporte et al., 2019; Bakx et al., 2020; Bouwens et al., 2022; Schouws et al., 2022; Ferrara et al., 2022; Algera et al., 2023; Feruglio et al., 2023; Hashimoto et al., 2023; Bowler et al., 2024; Salvestrini et al., 2024). It is difficult to extrapolate these results to the general population due to the targeted nature of most of the ALMA observations. Most measurements come from samples preselected by their UV magnitude, potentially biasing against heavily obscured sources. Furthermore, most are very massive Lyman break galaxies, which may not be representative of the general population at these epochs. Large, blind surveys like Mapping Reionization with ALMA (MORA; Casey et al. 2021) can only achieve modest depths and cannot sample typical star-forming galaxies at these redshifts.
Recent observations with JWST have revealed an unexpectedly large number of UV-bright galaxies in the very early universe. One proposed explanation is the absence of dust, potentially due to its expulsion during strong starbursts (Ferrara, 2024). The scenario is consistent with the non-detection of dust continuum in JADES-GS-z14-0, which places an upper limit on the dust to stellar mass ratio of , consistent with expected yields from supernovae (Carniani et al., 2024a; Schouws et al., 2024). Though lower than expected given the galaxy’s compact size, the dust attenuation derived from spectral energy distribution (SED) fitting is still non-negligible, with depending on the SED modeling code and assumptions (Carniani et al., 2024b; Helton et al., 2024). On the other hand, some models invoking bursty star formation or increased star formation efficiency suggest efficient dust production may be required to simultaneously match constraints from UV luminosity functions and properties of individual galaxies such as stellar masses and UV slopes (Mirocha & Furlanetto, 2023).
In response to the flood of new constraints from ALMA and , the latest generation of simulations has made significant effort to make predictions for not only the total dust mass in galaxies, but also expected number counts and observed optical depths by including varying dust models with different numerical methods (e.g. Behrens et al., 2018; Lewis et al., 2023; Mushtaq et al., 2023; Choban et al., 2024; Esmerian & Gnedin, 2024; Narayanan et al., 2024; Zimmerman et al., 2024). There has been success in matching observed dust masses (Lower et al., 2024), but simultaneously matching UV and IR emission constraints has proven difficult, with evidence that sufficient resolution and the details of the stellar feedback model are important for producing realistic interstellar medium (ISM) conditions (Esmerian & Gnedin, 2024). Indeed, the dust properties of high-z galaxies can provide strong constraints on feedback models since they affect the amount, spatial distribution, and effective optical depth of the dust.
To truly understand the amount of obscured star-formation in the distant universe and thereby have a complete and accurate census of star formation, it is necessary to obtain an estimate of the dust content in an unbiased sample of the intrinsically fainter normal star forming galaxies at the highest redshifts. To address this challenge, we utilize the JWST in Technicolor (PID: 3362) and CAnadian NIRISS Unbiased Cluster Survey (CANUCS; Willott et al. 2022) which together provide deep imaging with every JWST NIRCam medium- and wide-band filter in addition to ancillary Hubble Space Telescope (HST) data, achieving space-based photometry in an impressive 29 bands. This effectively provides a low resolution spectrum for a large sample of high-z galaxies, with covering m. The wide wavelength range and higher spectral resolution of the medium bands importantly can differentiate strong emission lines from continuum and with the large wavelength coverage facilitate much more accurate estimates of dust extinction. The exquisite photometry allows us to account for dust via SED modeling and thus estimate the amount of obscured star formation without an expensive direct dust continuum detection or potentially biased selection for spectroscopy, albeit with the requirement that the assumed form of the dust law that is fit is indeed representative of its form at high-z.
This paper is organized as follows. In Section 2 we present the data utilized in this work. Section 3 describes the sample selection and analysis. Section 4 showcases our results. In Section 5 we compare with other results and finally draw conclusions in Section 6. Throughout the paper we assume a standard CDM cosmology with , , and km s as well as a Chabrier initial mass function (Chabrier, 2003). All magnitudes are in the AB system.
2 Data
We draw our sample from the JWST in Technicolor survey (Program ID 3362), which, along with CANUCS (Program ID 1208 Willott et al., 2022), covers the flanking fields of three Hubble Frontier Fields clusters (Abell 370, MACS J0416.1-2403, and MACS J1149.5+2223) with comprehensive NIRCam imaging. These fields possess homogeneous imaging in every wide- and medium-band NIRCam filter along with two narrow-band filters (F164N and F187N) and ancillary HST ACS imaging from HFF program (Lotz et al., 2017). The limiting flux densities in a aperture range from nJy in wide filters to nJy in medium filters. Complete details of depth and completeness will be provided by Sarrouh et al. (in prep.). The CANUCS/Technicolor image reduction and photometry procedure is fully described in Noirot et al. (2023); Willott et al. (2024); Asada et al. (2024a), whereas details on PSF measurement and homogenization can be found in Sarrouh et al. (2024). Briefly, we begin the data reduction process with a modified version of the Detector1Pipeline (calwebb_detector1) stage of the official STScI pipeline. Astrometric alignment of the different exposures of JWST/NIRCam to HST/ACS images, sky subtraction, and drizzling to a common pixel scale of 0.04′′ utilize the grism redshift and line analysis software for space-based slit-less spectroscopy (Grizli; Brammer & Matharu 2021). PSFs are extracted empirically by median stacking bright, isolated, non-saturated stars. Object detection and segmentation are performed on the detection image created using all available NIRCam and HST ACS images. Photometry is performed on images convolved to the F444W resolution with the Photutils package (Bradley et al., 2024). Data for CANUCS may be found at doi:10.17909/ph4n-6n76.
3 Sample Selection
3.1 Photo-z Selected Galaxies at
As our fiducial high-redshift sample, we apply a similar selection to that used by Willott et al. (2024) to identify galaxies with high fidelity for the high-z CANUCS luminosity function, albeit opting for a more complete than pure selection by allowing slightly lower signal-to-noise ratios in F277W. We require a dropout in the F090W filter and a confident high-z photometric solution from EAzY (Brammer et al., 2008). The full selection is as follows:
| (1) |
| (2) |
| (3) |
| (4) |
Here refers to the maximum likelihood redshift from EAzY and is the percentile of the redshift probability distribution. When running EAzY we use modified templates based on the binc100z001age6_cloudy_LyaReduced template from Larson et al. (2023) that include stronger [OIII] emission lines to better match recent observations and the empirically-calibrated intergalacic medium/ circumgalactic medium attenuation curve of Asada et al. (2024b) which has been shown to reduce redshift bias for Epoch of Reionization galaxies. By requiring a non-detection in F090W and high confidence in a photometric redshift solution above , we exclude low-redshift interlopers from our sample. This selection results in 251 galaxies, which is reduced to 131 secure sources after visual inspection. Most of the removed sources are spurious detections or objects with insufficient signal to perform reliable SED fitting. We refer to this as the photo-z selected sample throughout the paper.
3.2 Emission Line Selected Galaxies at
In addition to this more typical high-z selection, we also incorporate color-selected emission line galaxies (ELGs) identified by flux excesses in the photometry caused by the [OIII]+H complex. The ELG selection ensures a robust photometric redshift solution and potentially allows us to recover galaxies whose rest-frame UV emission is too faint for a secure photo-z selection using traditional methods (Cava et al., 2015; Lumbreras-Calle et al., 2019). The process and specific color combinations for the selection are described in detail in Withers et al. (2023). Briefly, template spectra from the Yggdrasil stellar population synthesis code (Zackrisson et al., 2011) were used to derive color selections to identify emission line excesses in synthetic photometry. Completeness and contamination tests led to the inclusion of a S/N cut in line emission and an average S/N cut on the underlying continuum bands. Follow-up spectroscopy of 15 objects presented in Withers et al. (2023) confirmed excellent redshift precision and accuracy from this technique, with and no outliers, albeit in a sample at lower redshift which was further constrained by the presence of H in the observed photometry. Additional details will be given in Withers et al. (in prep.).
Our selection identifies 67 objects, which is reduced to 48 after removing potentially spurious sources and sources which are too faint to retrieve constrained properties from SED fitting via visual inspection. We find 15/48 () galaxies in the ELG sample are missed by the photo-z selection, bringing the total number of unique sources to 146. These missed ELGs generally have weak rest-UV emission, and are thus excluded by the F277W S/N cut. Two are excluded for having photo-z posteriors from EAzY which extend to lower redshifts. Throughout the paper we will distinguish between ELGs which are included in the photo-z sample as the continuum+line sample (owing to the F277W UV continuum and Lyman break detections, 33 galaxies), and ”missed” ELGs as the line-only sample (15 galaxies).
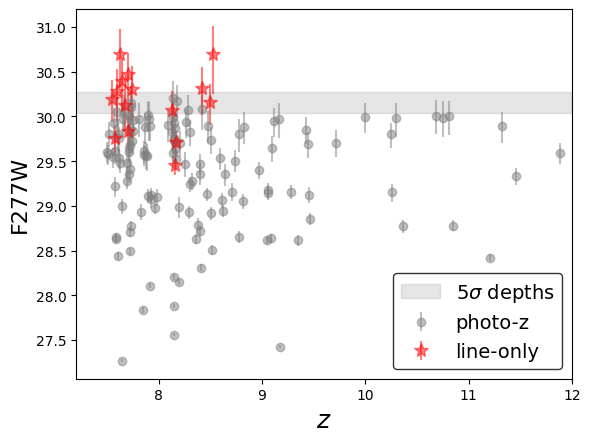
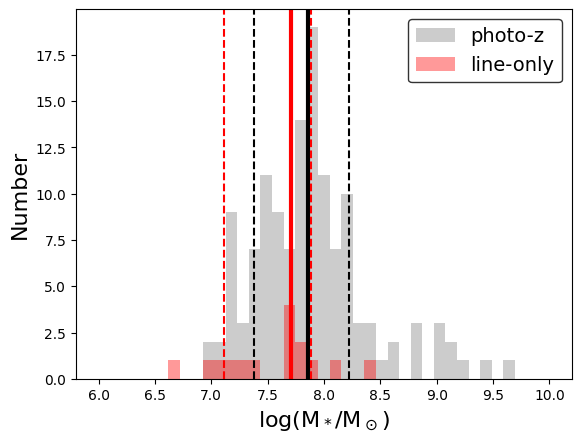
Figure 1 shows the F277W magnitude versus photometric redshift for our continuum high-z selection (gray) as well as the additional 15 sources identified by our ELG selection (red). Indeed, the line-only subsample probes fainter UV magnitudes than the photo-z selection, enabling the detection and characterization of fainter galaxies. Note these ”missed” ELGs are important as the lack of UV continuum can be caused by strong dust attenuation in some sources, not only because they are always intrinsically fainter. We will show some of the dustiest galaxies are among the emission line only sample. The bottom panel of Figure 1 shows that the fainter UV magnitudes do not necessarily correspond to lower stellar masses. The stellar mass distributions largely overlap, with the line-only sample missing the tail to higher masses seen in the photo-z sample. We further explore the relationship between these samples below.
3.3 SED Modeling
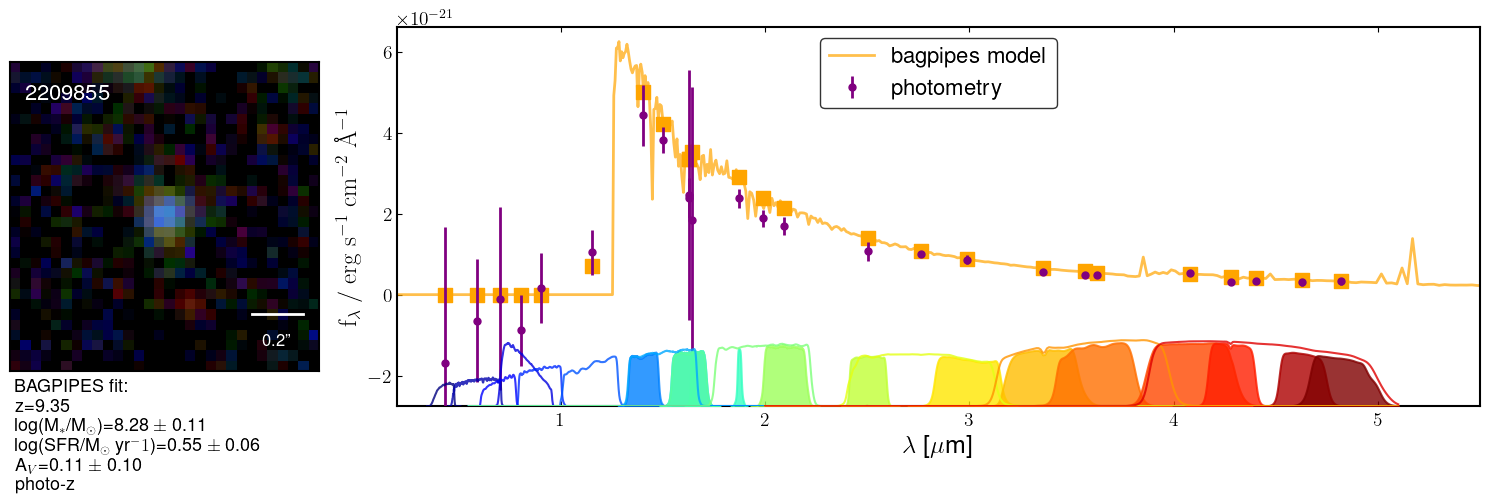
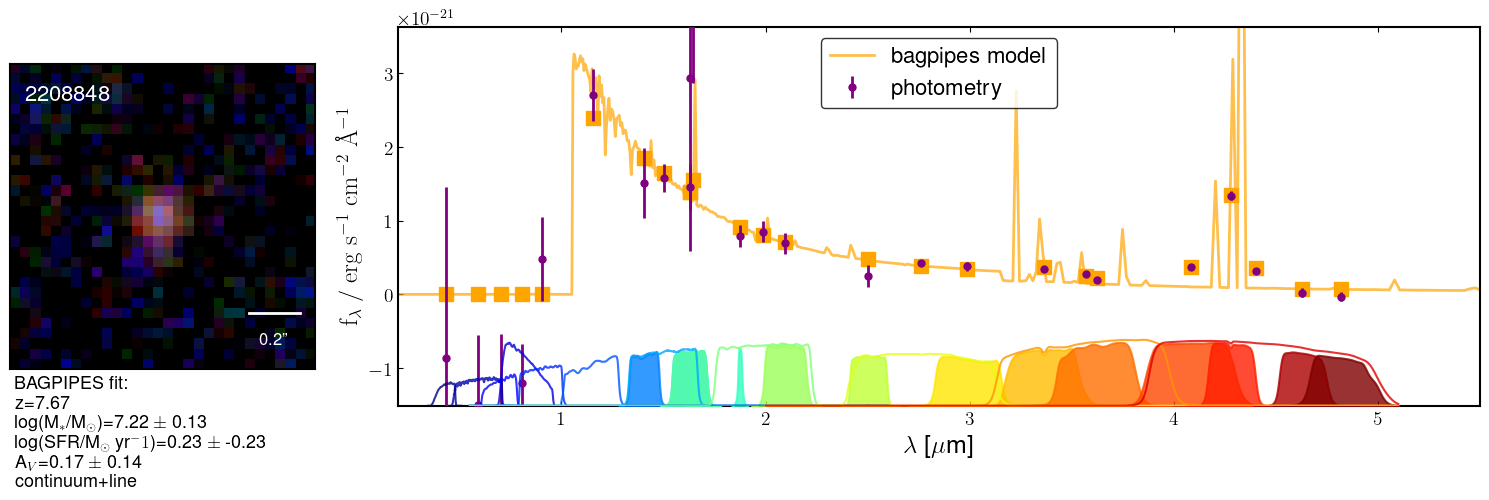
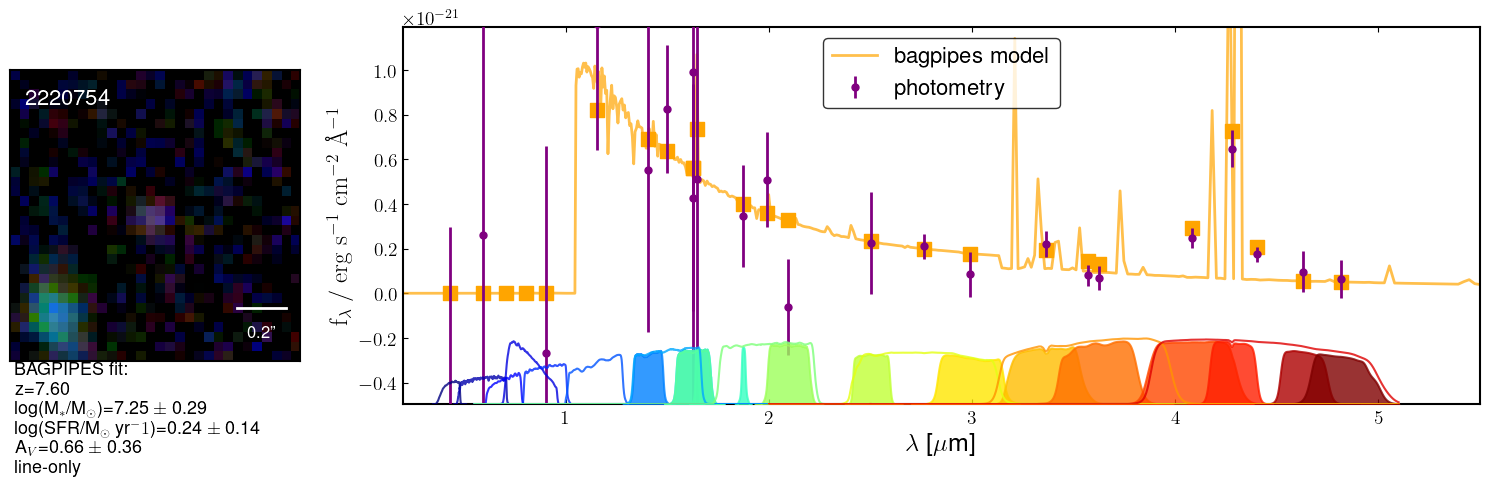
We perform SED modeling of the HST+JWST photometry with the BAGPIPES code (Carnall et al., 2018) to derive physical properties for our sample. We assume a double power law star formation history, Calzetti (Calzetti et al., 2000) dust attenuation law, and Chabrier (Chabrier, 2003) initial mass function. Markov et al. (2024) recently used JWST prism spectra to measure the attenuation curves for galaxies up to . They find that for galaxies, the empirically measured attenuation curve is similar to the Calzetti curve, with a shallow slope and no UV bump. We thus adopt the Calzetti curve to facilitate comparison with other works and show how the measured attenuation values differ when assuming different dust laws, priors, and SED fitting methodology (DENSEBASIS, Iyer et al. 2019) in the appendix. The redshift is set to the photometric redshift from EAzY with a Gaussian prior of width 0.05. The exquisite Technicolor medium-band photometry strongly constrains the shape of the continuum while overlapping medium- and wide-bands quantify the contribution of emission lines. Figure 2 shows three example SEDs, one each for our photo-z, continuum+line, and line-only subsamples. Photometry is shown in purple and the corresponding BAGPIPES fit in orange. We also show RGB cutouts and the measured stellar population properties for each object.
The analysis of slopes for the full CANUCS sample will be presented in Felicioni et al. (in prep.). Here, we fit a power law to the observed photometry utilizing all bands whose pivot wavelengths lie between rest-frame Å. At , this corresponds to 10 JWST medium and wide filters (F115W, F140M, F150W, F162M, F182M, F200W, F210M, F250M, F277W; the two narrow bands F167N and F187N are included in the fit, but are shallower and provide less constraint).
4 Results
4.1 How Many Galaxies Exhibit Significant Dust Obscuration at ?
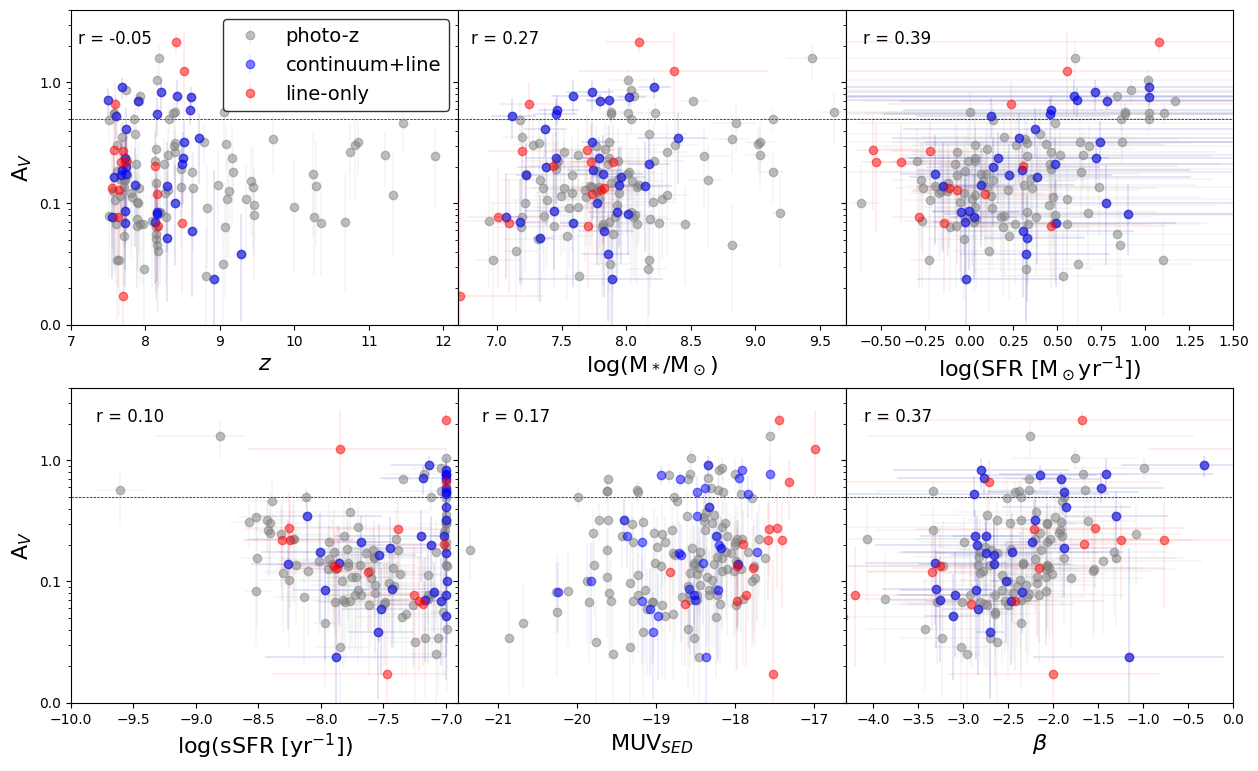
We first investigate how dust obscuration in our sample relates to other galaxy physical properties. Figure 3 shows the dependence of AV on redshift, stellar mass, star formation rate (SFR), specific star formation rate (sSFR), absolute UV magnitude (MUV), and for our photo-z sample (gray), continuum+line sample (blue), and line-only sample (red). Stellar mass, SFR, and AV are the outputs from the BAGPIPES fit, MUV is measured from the best fit EAzY template, and is calculated as described above. While many high-z sources are consistent with little to no dust obscuration, we find a significant population of objects with AV . Specifically, 15% of the continuum sample, and 25% of the continuum+line sample, and 20% of the line-only sample meet this criterion. The median statistical uncertainties on the derived AV are 0.12 mag for the continuum sample, and 0.15 mag for the line only sample, though systematic uncertainties are significantly higher (see Appendix).
As reported in Willott et al. (2024), the CANUCS fields do not exhibit a high density of UV-luminous galaxies at high-z, thus our sample does not include a large number of objects with extreme stellar masses derived in some other recent works (e.g., Labbé et al., 2023; Finkelstein et al., 2024; Xiao et al., 2024). We find eight galaxies with log(M∗/M. This is most likely due to cosmic variance since Willott et al. (2024) also do not find massive galaxy candidates in the CANUCS cluster pointings. Another possibility, though likely subdominant for this sample, is that the more accurate photometric redshifts enabled by the medium bands better exclude low-redshift interlopers that may be interpreted as more massive galaxies at higher redshift in surveys with fewer filters, as has been found at lower redshift (Sarrouh et al., 2024). However, the medium-band coverage excluding SED solutions with high stellar masses that would otherwise be unconstrained with only broadband photometry (Desprez et al., 2024) could also contribute (see next section).
Similarly, SFRs of our sample are modest, falling below 15 M⊙ yr-1. The artifact of galaxies being limited to yr-1 in sSFR (visible in the bottom left panel of Figure 3) comes from the adopted choice of time resolution of 10 Myr for the SED modeling. The inclusion of the line-only subsample extends the range of MUV reached by this work to -17 mag demonstrating the efficacy of the color selections to identify intrinsically UV-faint galaxies.
In each panel of Figure 3 we report the Pearson correlation coefficient of AV with the indicated quantity. We do not observe strong correlations between AV and MUV, but we identify mild trends toward increasing AV with increasing stellar mass and SFR, with correlation coefficients of 0.26 and 0.39. The trends are in line with findings in both the local Universe from the Sloan Digital Sky Survey (Brinchmann et al., 2004; Gilbank et al., 2010) and cosmic noon (e.g., Sawicki, 2012; Martis et al., 2016; Whitaker et al., 2017). We also recover the expected correlation between and dust obscuration (r=0.37), but with substantial scatter.
4.1.1 Dust Properties from Medium versus Broadband Photometry
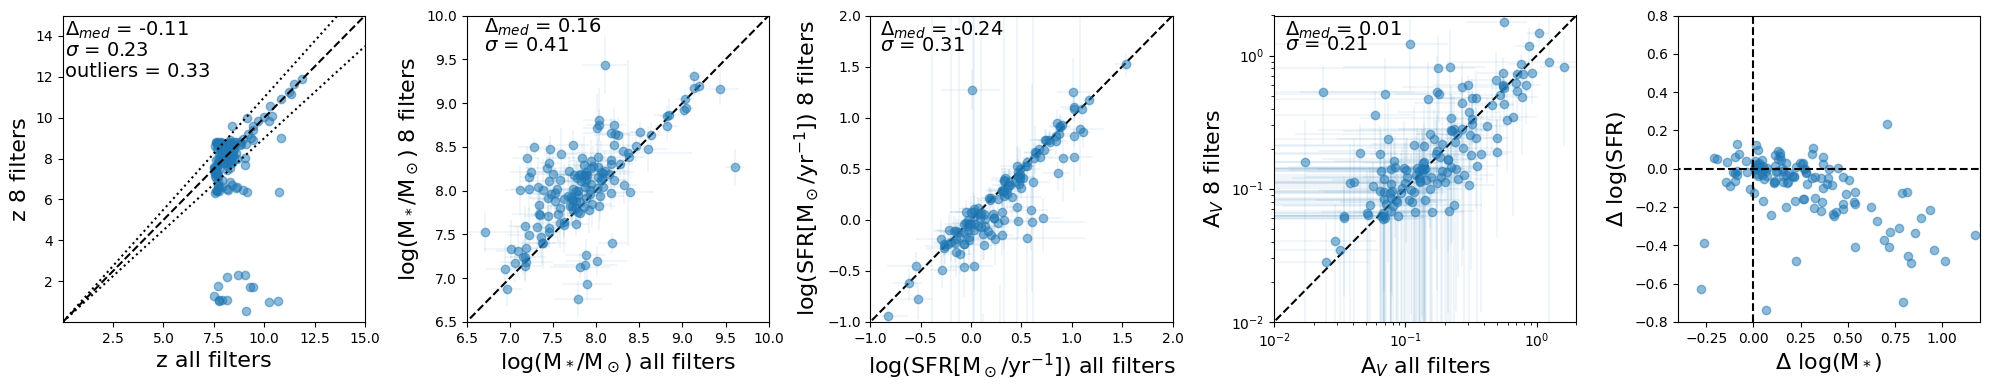
To test the hypothesis that medium-band photometry affects how dust properties are derived, we repeated our SED fitting procedure including only the F090W, F115W, F150W, F200W, F277W, F356W, F410M, and F444W bands (the set used in the CANUCS cluster fields and representative of other extragalactic surveys). Figure 4 compares the photometric redshifts, stellar masses, SFRs and AV derived using the two filter sets. Photometric redshifts change significantly, with a third of the sample having significantly different solutions, defined by . Moreover, 14 (10%) galaxies are moved from to without the medium-band filters, showing that the extra filters significantly improve completeness of photometric samples at high-z. This is particularly true for faint galaxies, in agreement with recent findings from Adams et al. (2025). We find that without the medium bands, stellar masses are systematically overestimated by dex and SFRs are underestimated by dex. Moreover, we show in the rightmost panel, that the biases in stellar mass and SFR are anti-correlated, meaning that without the medium bands sampling the [OIII]+H complex, SED modeling prefers solutions with elevated continuum to account for the line-flux, resulting in overestimated stellar masses. Stellar mass functions at high-z may therefore be overestimated if measured from only broadband photometry. The behavior of AV is more complicated. At low attenuation levels, the broadband-only fitting slightly overestimates AV, whereas at higher values it underestimates AV, though in both cases usually within the errors. Coincidentally, this leads to no significant median offset in the sample as a whole.
4.2 The Fraction of Obscured Star Formation
Beyond understanding the fraction of early galaxies that exhibit significant dust obscuration, we wish to determine the fraction of star formation that is obscured within individual galaxies. To estimate the fraction of obscured star formation, we take the following approach. First, we use the stellar population properties from the BAGPIPES SED fit to produce an intrinsic, unobscured model spectrum. We calculate the NUV-based SFR using the calibration of Hao et al. (2011); Murphy et al. (2011), given below
| (5) |
from both the intrinsic and obscured model spectra (assuming the Calzetti attenuation curve) and use the ratio of UV to total SFR to calculate the obscured fraction, , of the SFR in each galaxy. We verified that the dust-corrected NUV-based SFRs derived in this manner are broadly consistent with those derived from SED modeling.
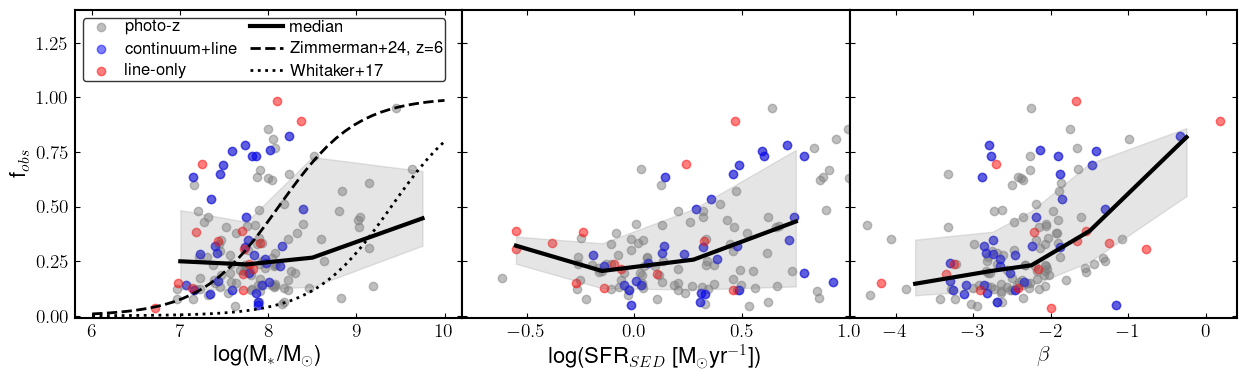
Figure 5 shows as a function of SFR, stellar mass, and . We observe tentative trends of increasing with all three quantities, but with significant scatter. Our observed relation between and stellar mass is shallower than that derived at (Whitaker et al., 2017), while also exhibiting higher obscuration values at low stellar masses. We find a closer match to recent results from the SIMBA cosmological simulations at , though again a more shallow relation than predicted. The photo-z, continuum+line, and line-only samples occupy similar distributions of , though most of the line-only sources exhibit fairly low along with the relatively low SFRs in these systems. Significantly, we observe 28 sources (19% of the full sample) with . That is, the majority of star formation in roughly one in five galaxies at is strongly obscured by dust. As shown by the completeness tests in Willott et al. (2024), our detection fraction remains high at faint UV magnitudes because detection is performed on a image with so many filters. Even without the extra medium-band filters provided by Technicolor and more stringent selection, they reach 80% completeness at and in these fields. Their sample in these fields contains a total of 77 galaxies compared to our 146, meaning that in addition to the more lenient S/N cut employed here (our original selection of 251 galaxies is reduced to 120 using exactly the Williams et al. 2024 criteria), the long-wavelength medium-band filters and addition of our line-only sample significantly improve the completeness of high-redshift galaxy samples. These measurements therefore constrain the dust content of a truly representative sample of galaxies in the early universe.
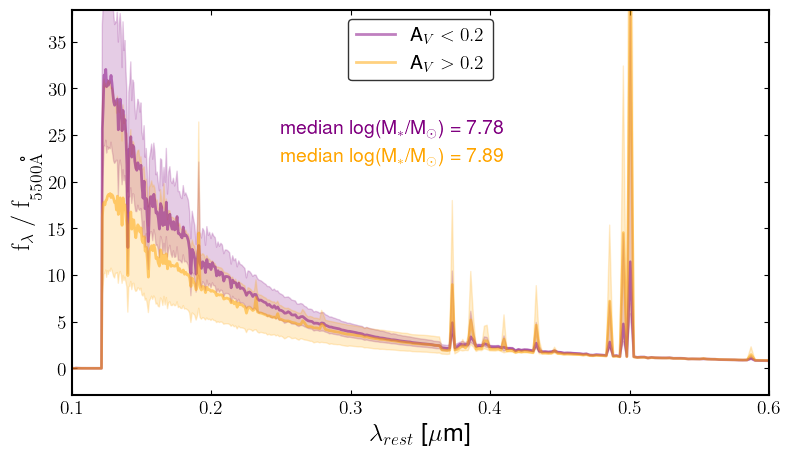
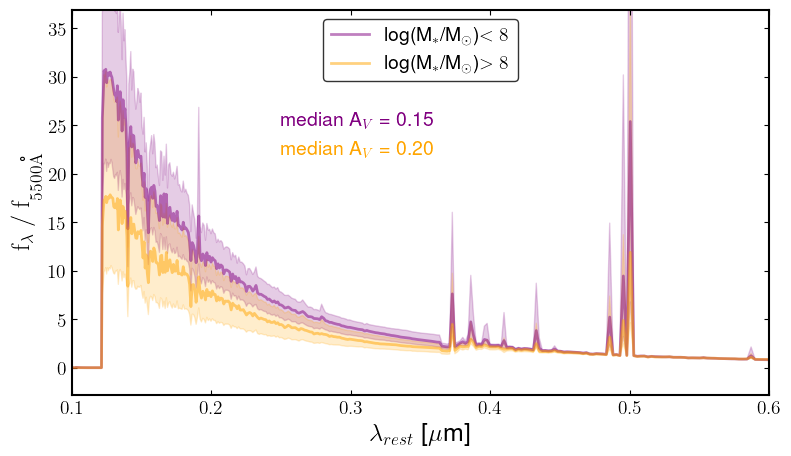
To illustrate the significant difference in SED shape for the more heavily dust-obscured galaxies in our sample, Figure 6 shows the median model spectra from BAGPIPES when splitting our sample into two bins normalized to rest-frame . In the top panel, our sample is divided by AV, and in the bottom by stellar mass. The low dust and low stellar mass sub-samples show steeper UV- slopes. The low-mass and higher dust sub-samples show stronger emission lines relative to the normalized continuum.
5 Discussion
5.1 Evolution of Total Obscured SFR at
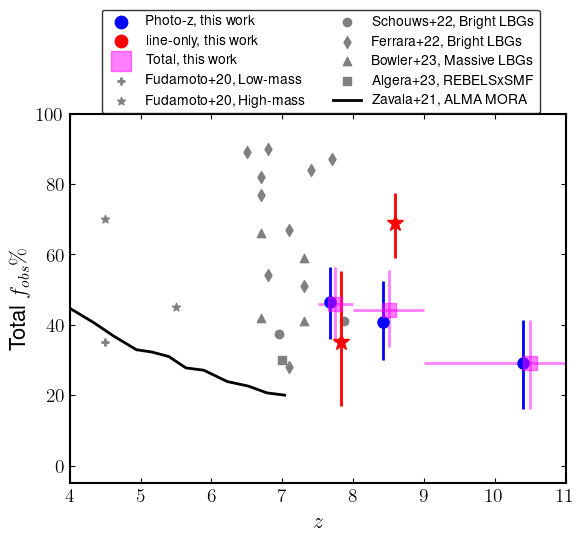
We have shown that galaxies exhibit a wide variety in their dust obscuration properties and how this translates into observable quantities frequently used to characterize high-z galaxy populations such as MUV and . We now consider how these population properties translate to the global SFR density measurements by comparing the summed SFRUV and SFRSED across each sample. After accounting for dust attenuation from our SED modeling, we find of star formation in the continuum sample is obscured, whereas this reaches for the continuum+line sample, and in the 15 ”missed” line-only sources.
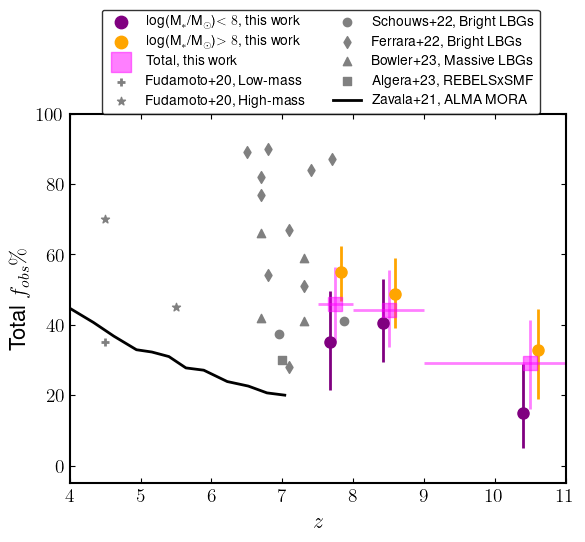
Figure 7 shows how for our photo-z, line-only, and full samples evolves with redshift in comparison with other results from the literature. Errors are obtained by recalculating using the and percentiles of the AV posteriors for each galaxy. At , we observe in line with most previous estimates in the range from the ALMA REBELS and MORA programs (Zavala et al., 2021; Schouws et al., 2022; Ferrara et al., 2022; Bowler et al., 2024; Algera et al., 2023) and slightly lower redshift from Fudamoto et al. (2020). This is perhaps an unexpected result. The ALMA sources with dust continuum detections are largely drawn from follow-up observations of the brightest Lyman break galaxies, which are potentially biased to the most massive or heavily star forming systems. Indeed, the REBELS sample has stellar masses , whereas the median stellar mass of our sample is . We thus show for the first time that half of all star formation is obscured up to , but that this is driven by the more massive and heavily star-forming galaxies in our sample (which is still overall low-mass) being preferentially more obscured. This is shown more clearly by looking at versus redshift after subdividing our sample into low- and high-mass with the boundary at (right panel of Figure 7). The low-mass subsample has a median , while the high-mass subsample has median .
Alongside the general consensus that most low mass galaxies in the EoR exhibit low levels attenuation, several recent studies point to the existence of a population with non-negligible attenuation. Sandles et al. (2024) use spectroscopy from the JWST Advanced Deep Extragalactic Survey (JADES) ton investigate the Balmer decrement in low-mass galaxies from . While most of the sample is consistent with little to no nebular dust attenuation, they do find trends of increasing attenuation with increasing stellar mass and SFR, in line with our results. Detailed studies of individual objects at have uncovered a handful of spectroscopically confirmed objects with (Markov et al., 2023; Harshan et al., 2024; Ma et al., 2024) accompanied by significant star formation. On the more extreme end, there have been several claims of massive (), heavily obscured galaxies at (Akins et al., 2023; Rodighiero et al., 2023). So while perhaps low in number, the most active sites of star formation even in the very early universe may be heavily obscured, leading to significant obscuration of the total star formation rate density.
At lower redshift (mostly ), Bisigello et al. (2023) report the finding of a population of dusty dwarf galaxies (median stellar mass ). They exhibit extraordinary levels of dust attenuation given their low mass, with median AV=4.9. These sources are too red for and too faint for existing FIR wide-field surveys and so have been missed before JWST . Their comparative rarity to bluer star-forming dwarfs may point to the possibility of a short evolutionary stage in which dust enshrouds very recent star-formation before being destroyed or expelled from the shallow potential well. One heavily obscured dwarf galaxy was recently spectroscopically confirmed at with stellar mass , AV=2.2-3.3, and significant metal enrichment (Bisigello et al., 2024). Thanks to the aid of gravitational lensing, a similar stellar mass galaxy at , MACS0717_Az9, has a detected dust continuum and directly measured fraction of obscured star formation of (Pope et al., 2017, 2023). Detecting similar sources at higher redshift, if they exist, will prove extremely difficult, so further investigating this population of low-mass, dusty galaxies may be the best way to study how dust might accumulate in early galaxies.
Recent simulations of galaxy evolution seem to point to detailed modeling of ISM processes as being key to reproducing the properties of epoch of reionization galaxies. Using an updated version of the SIMBA simulation which includes prescriptions for dust and molecular hydrogen directly in the simulation rather than via post-processing, Jones et al. (2024) find the inclusion boosts early star formation and dust to gas ratios. Spatially resolving the ISM also appears to play an important role. Two recent studies with similar prescriptions for dust and predicted dust masses for reionization era galaxies (Lewis et al., 2023; Esmerian & Gnedin, 2024) predict different levels of UV extinction, with lower resolution corresponding to lower attenuation. In this case it is likely that by spreading the dust over a larger surface area, the effective optical depth is reduced. Similarly, investigations using the high resolution FIRE (Ma et al., 2018, 2019) and FirstLight (Mushtaq et al., 2023) find lower dust attenuation for a given dust mass than other models. By resolving the effect of stellar feedback on the ISM, these simulations can produce variations in optical depth across a galaxy, including channels through which UV radiation can escape, lowering the total effective optical depth. Measurements of attenuation in high-z galaxies may therefore be one of the best ways to distinguish between models of stellar feedback in the extreme environments of high-z galaxies.
5.2 Timescale of Dust Production
The drops in in our highest redshift bin, albeit within the error of lower redshift bins, perhaps pointing to a limit in the speed in which dust can effectively form in typical galaxies at this epoch. Fitting a linear relation to our observed obscuration fraction versus redshift trend predicts the obscuration fraction to reach zero at . Such an extrapolation obviously suffers from incompleteness in our highest redshift bin, and does not reflect potentially rapidly changing conditions in the first few hundred Myr of cosmic history, but is informative in the sense that we can now point to the earliest galaxies in which we predict dust to be observable. Through an analysis of slopes of galaxies, Cullen et al. (2024) also find that moderate attenuation observed at is mostly absent at higher redshifts, with consistent with dust-free stellar populations. Similarly, Toyouchi et al. (2025) find with self-consistent, resolved modeling of stars, gas, metals, and dust that the luminosity functions can be reproduced by their model only if the predicted significant effect of dust attenuation is ignored. The low dust obscuration at is also consistent with the model of Ferrara (2024), who argue that radiation-driven outflows in very early galaxies should be able to clear dust, increasing apparent UV brightness. The combined evidence points to a rapid change in galaxies’ dust properties in the first few hundred million years of cosmic history.
Langeroodi & Hjorth (2024); Langeroodi et al. (2024); Ciesla et al. (2024) find a correlation between AV and inverse sSFR, which provides a way to determine the time delay between the onset of star formation and significant dust production since 1/sSFR is a close proxy for stellar age at such early epochs. The slope of the relation depends on several dust properties, including production and destruction by supernovae, grain properties, geometry, and the fraction of dust removed by outflows. Langeroodi et al. (2024) find a time delay of about 30 Myr, consistent with SN dust production. We probe a lower mass regime than either work, but still require an inverse relation between AV and sSFR as seen in the bottom left panel of Figure 3, pointing to a gradual buildup of dust. We refrain from reporting the slope of the relation due to the limit in sSFR values which particularly impacts our low mass sample.
6 Summary and Conclusion
We have presented a sample of galaxies from the JWST Technicolor and CANUCS surveys in order to investigate the amount of dust obscuration in the very early universe. We summarize our main findings as follows:
-
•
Including color-selected ELGs by utilizing medium-bands improves the completeness of high-z galaxy samples by reaching fainter UV magnitudes. In our sample of 146 galaxies, 15 (10%) are only selected via the emission line selection, partly due to intrinsically fainter UV and partly due to dust.
-
•
Inclusion of medium-bands in SED fitting of high-z galaxies significantly improves accuracy of photometric redshifts and reduces systematic bias in stellar mass and SFR estimates by and dex respectively.
-
•
We observe trends of increasing dust obscuration derived from SED fitting with increasing stellar mass, SFR, and UV-slope, , though with significant scatter.
-
•
We use our derived attenuation values to infer the fraction of star formation obscured by dust as a function of redshift. We find that of all star formation up to is obscured by dust, with the increased obscuration in more massive, heavily star-forming galaxies playing a significant role. The obscuration fraction drops in our highest redshift bin, perhaps pointing to a limit in the timescale in which significant dust can accumulate.
In order to verify the findings presented here, we require direct constraints on dust emission or attenuation subject to fewer modeling assumptions. Large samples of typical galaxies at will be time-consuming and difficult to observe with ALMA, and very deep spectra are required to measure Balmer line ratios for galaxies as faint as those in this sample (F277W 30 mag). A possible alternative is to better constrain the rest-frame optical-NIR SED with deep MIRI imaging, which may be more efficient. Additionally, the small volume probed by Technicolor does not allow us to sufficiently sample the high-mass () galaxy population and precludes more direct comparison with existing ALMA observations. A large-area medium-band JWST survey could make great progress in this regard.
Appendix A Systematics from SED Fitting Assumptions
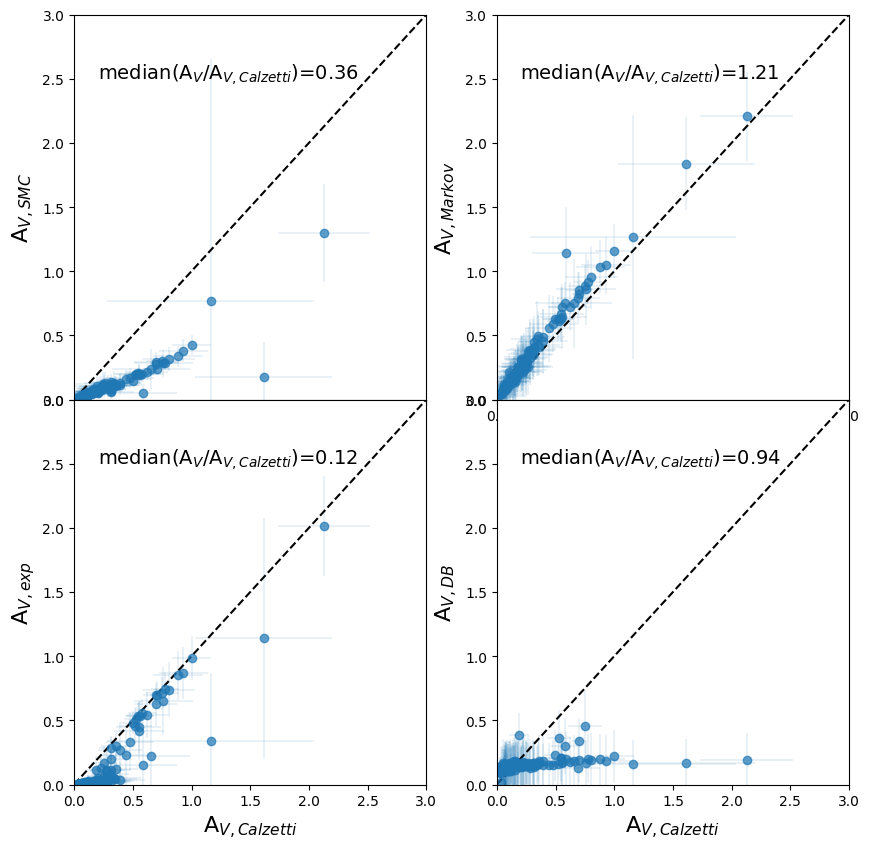
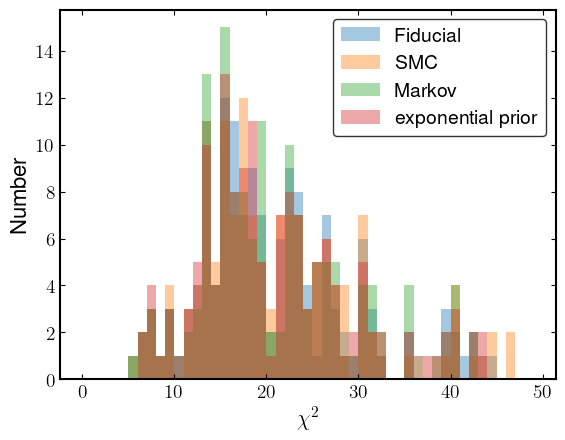
Recent work by Markov et al. (2024) has directly measured the median attenuation curve for galaxies at high-z and finds results similar to the Calzetti curve in the range, rather than the steeper Small Magellanic Cloud (SMC) curve (Gordon et al., 2003) proposed by others. Here we compare to the median curve for the subsample derived using the same methodology to more closely match the sample in this paper. To facilitate comparison with other work, we report our main findings assuming a Calzetti et al. (2000) curve, but here show the inferred attenuation values for the SMC and empirical Markov et al. (2024) curves in the left sub-figure of Figure 8. The comparisons expectedly show systematic bias in AV ( smaller for SMC, larger for the empirical curve). However, the comparisons also show small scatter, suggesting the primary uncertainty is systematic due to the attenuation curve choice and that the dense sampling of the rest-frame UV-optical SED can constrain the amount of dust attenuation given that choice. The bottom left panel shows the results assuming an exponential rather than flat prior on dust. For galaxies with less than , many of the fits move close to zero, showing that the models can not discriminate between very little and no dust. The attenuation derived for the most heavily obscured galaxies, however, remains consistent, albeit with larger errors. This suggests the result of the presence of at least some heavily obscured early galaxies is strongly preferred. Finally, the bottom right panel shows the attenuation derived from fitting the sample with the DENSEBASIS SED modeling code, which uses a non-parametric star formation history and here assumes an exponential prior on AV. Almost all the derived attenuation values all fall within a narrow range around , suggesting either minimal impact from dust at these redshifts or that the AV is prior-driven in DENSEBASIS in this case. As an additional check, the right sub-figure of Figure 8 shows the distributions for each of the BAGPIPES modeling cases are indistinguishable, meaning that none provides a clearly better fit to the data. Discriminating between the assumptions between the fiducial case and those shown here will be difficult and resource-intensive, requiring deep spectroscopic campaigns careful designed to avoid biased populations, or ultra-deep MIRI imaging to constrain the rest-optical emission and reduce the degeneracies between dust attenuation, stellar age, and metallicity.
References
- Adams et al. (2025) Adams, N. J., Austin, D., Harvey, T., et al. 2025, arXiv e-prints, arXiv:2502.10282, doi: 10.48550/arXiv.2502.10282
- Akins et al. (2023) Akins, H. B., Casey, C. M., Allen, N., et al. 2023, ApJ, 956, 61, doi: 10.3847/1538-4357/acef21
- Algera et al. (2023) Algera, H. S. B., Inami, H., Oesch, P. A., et al. 2023, Monthly Notices of the Royal Astronomical Society, 518, 6142, doi: 10.1093/mnras/stac3195
- Asada et al. (2024a) Asada, Y., Sawicki, M., Abraham, R., et al. 2024a, MNRAS, 527, 11372, doi: 10.1093/mnras/stad3902
- Asada et al. (2024b) Asada, Y., Desprez, G., Willott, C. J., et al. 2024b, arXiv e-prints, arXiv:2410.21543, doi: 10.48550/arXiv.2410.21543
- Astropy Collaboration et al. (2013) Astropy Collaboration, Robitaille, T. P., Tollerud, E. J., et al. 2013, A&A, 558, A33, doi: 10.1051/0004-6361/201322068
- Bakx et al. (2020) Bakx, T. J. L. C., Tamura, Y., Hashimoto, T., et al. 2020, MNRAS, 493, 4294, doi: 10.1093/mnras/staa509
- Behrens et al. (2018) Behrens, C., Pallottini, A., Ferrara, A., Gallerani, S., & Vallini, L. 2018, Monthly Notices of the Royal Astronomical Society, 477, 552, doi: 10.1093/mnras/sty552
- Bisigello et al. (2023) Bisigello, L., Gandolfi, G., Grazian, A., et al. 2023, Astronomy and Astrophysics, 676, A76, doi: 10.1051/0004-6361/202346219
- Bisigello et al. (2024) Bisigello, L., Gandolfi, G., Feltre, A., et al. 2024, Spectroscopic confirmation of a dust-obscured, metal-rich dwarf galaxy at z~5, doi: 10.48550/arXiv.2410.10954
- Bouwens et al. (2022) Bouwens, R. J., Smit, R., Schouws, S., et al. 2022, The Astrophysical Journal, 931, 160, doi: 10.3847/1538-4357/ac5a4a
- Bowler et al. (2022) Bowler, R. A. A., Cullen, F., McLure, R. J., Dunlop, J. S., & Avison, A. 2022, MNRAS, 510, 5088, doi: 10.1093/mnras/stab3744
- Bowler et al. (2024) Bowler, R. A. A., Inami, H., Sommovigo, L., et al. 2024, Monthly Notices of the Royal Astronomical Society, 527, 5808, doi: 10.1093/mnras/stad3578
- Bradley et al. (2024) Bradley, L., Sipőcz, B., Robitaille, T., et al. 2024, astropy/photutils: 2.0.2, 2.0.2, Zenodo, doi: 10.5281/zenodo.596036
- Brammer & Matharu (2021) Brammer, G., & Matharu, J. 2021, gbrammer/grizli: Release 2021, 1.3.2, Zenodo, Zenodo, doi: 10.5281/zenodo.5012699
- Brammer et al. (2008) Brammer, G. B., van Dokkum, P. G., & Coppi, P. 2008, ApJ, 686, 1503, doi: 10.1086/591786
- Brinchmann et al. (2004) Brinchmann, J., Charlot, S., White, S. D. M., et al. 2004, MNRAS, 351, 1151, doi: 10.1111/j.1365-2966.2004.07881.x
- Calzetti et al. (2000) Calzetti, D., Armus, L., Bohlin, R. C., et al. 2000, ApJ, 533, 682, doi: 10.1086/308692
- Capak et al. (2015) Capak, P. L., Carilli, C., Jones, G., et al. 2015, Nature, 522, 455, doi: 10.1038/nature14500
- Carnall et al. (2018) Carnall, A. C., McLure, R. J., Dunlop, J. S., & Davé, R. 2018, MNRAS, 480, 4379, doi: 10.1093/mnras/sty2169
- Carniani et al. (2024a) Carniani, S., D’Eugenio, F., Ji, X., et al. 2024a, arXiv e-prints, arXiv:2409.20533, doi: 10.48550/arXiv.2409.20533
- Carniani et al. (2024b) Carniani, S., Hainline, K., D’Eugenio, F., et al. 2024b, Nature, 633, 318, doi: 10.1038/s41586-024-07860-9
- Casey et al. (2021) Casey, C. M., Zavala, J. A., Manning, S. M., et al. 2021, ApJ, 923, 215, doi: 10.3847/1538-4357/ac2eb4
- Cava et al. (2015) Cava, A., Pérez-González, P. G., Eliche-Moral, M. C., et al. 2015, ApJ, 812, 155, doi: 10.1088/0004-637X/812/2/155
- Chabrier (2003) Chabrier, G. 2003, PASP, 115, 763, doi: 10.1086/376392
- Choban et al. (2024) Choban, C. R., Salim, S., Kereš, D., Hayward, C. C., & Sandstrom, K. M. 2024, arXiv e-prints, arXiv:2408.08962, doi: 10.48550/arXiv.2408.08962
- Ciesla et al. (2024) Ciesla, L., Adscheid, S., Magnelli, B., et al. 2024, Dust emission from the bulk of galaxies at the Epoch of Reionization, arXiv. http://arxiv.org/abs/2412.02557
- Cucciati et al. (2012) Cucciati, O., Tresse, L., Ilbert, O., et al. 2012, A&A, 539, A31, doi: 10.1051/0004-6361/201118010
- Cullen et al. (2024) Cullen, F., McLeod, D. J., McLure, R. J., et al. 2024, MNRAS, 531, 997, doi: 10.1093/mnras/stae1211
- Desprez et al. (2024) Desprez, G., Martis, N. S., Asada, Y., et al. 2024, MNRAS, 530, 2935, doi: 10.1093/mnras/stae1084
- Esmerian & Gnedin (2024) Esmerian, C. J., & Gnedin, N. Y. 2024, The Astrophysical Journal, 968, 113, doi: 10.3847/1538-4357/ad410f
- Ferrara (2024) Ferrara, A. 2024, Astronomy and Astrophysics, 684, A207, doi: 10.1051/0004-6361/202348321
- Ferrara et al. (2022) Ferrara, A., Sommovigo, L., Dayal, P., et al. 2022, Monthly Notices of the Royal Astronomical Society, 512, 58, doi: 10.1093/mnras/stac460
- Feruglio et al. (2023) Feruglio, C., Maio, U., Tripodi, R., et al. 2023, ApJ, 954, L10, doi: 10.3847/2041-8213/ace0c8
- Finkelstein et al. (2024) Finkelstein, S. L., Leung, G. C. K., Bagley, M. B., et al. 2024, ApJ, 969, L2, doi: 10.3847/2041-8213/ad4495
- Fudamoto et al. (2020) Fudamoto, Y., Oesch, P. A., Faisst, A., et al. 2020, A&A, 643, A4, doi: 10.1051/0004-6361/202038163
- Gilbank et al. (2010) Gilbank, D. G., Baldry, I. K., Balogh, M. L., Glazebrook, K., & Bower, R. G. 2010, MNRAS, 405, 2594, doi: 10.1111/j.1365-2966.2010.16640.x
- Gordon et al. (2003) Gordon, K. D., Clayton, G. C., Misselt, K. A., Landolt, A. U., & Wolff, M. J. 2003, ApJ, 594, 279, doi: 10.1086/376774
- Hao et al. (2011) Hao, C.-N., Kennicutt, R. C., Johnson, B. D., et al. 2011, ApJ, 741, 124, doi: 10.1088/0004-637X/741/2/124
- Harshan et al. (2024) Harshan, A., Bradač, M., Abraham, R., et al. 2024, MNRAS, 532, 1112, doi: 10.1093/mnras/stae1574
- Hashimoto et al. (2023) Hashimoto, T., Inoue, A. K., Sugahara, Y., et al. 2023, ApJ, 952, 48, doi: 10.3847/1538-4357/acdd5c
- Helton et al. (2024) Helton, J. M., Rieke, G. H., Alberts, S., et al. 2024, arXiv e-prints, arXiv:2405.18462, doi: 10.48550/arXiv.2405.18462
- Hygate et al. (2023) Hygate, A. P. S., Hodge, J. A., da Cunha, E., et al. 2023, Monthly Notices of the Royal Astronomical Society, 524, 1775, doi: 10.1093/mnras/stad1212
- Iyer et al. (2019) Iyer, K. G., Gawiser, E., Faber, S. M., et al. 2019, ApJ, 879, 116, doi: 10.3847/1538-4357/ab2052
- Jones et al. (2024) Jones, E., Smith, B., Davé, R., Narayanan, D., & Li, Q. 2024, Monthly Notices of the Royal Astronomical Society, doi: 10.1093/mnras/stae2445
- Koprowski et al. (2017) Koprowski, M. P., Dunlop, J. S., Michałowski, M. J., et al. 2017, MNRAS, 471, 4155, doi: 10.1093/mnras/stx1843
- Labbé et al. (2023) Labbé, I., van Dokkum, P., Nelson, E., et al. 2023, Nature, 616, 266, doi: 10.1038/s41586-023-05786-2
- Langeroodi & Hjorth (2024) Langeroodi, D., & Hjorth, J. 2024, NIRSpec View of the Appearance and Evolution of Balmer Breaks and the Transition from Bursty to Smooth Star Formation Histories from Deep Within the Epoch of Reionization to Cosmic Noon, doi: 10.48550/arXiv.2404.13045
- Langeroodi et al. (2024) Langeroodi, D., Hjorth, J., Ferrara, A., & Gall, C. 2024, Rapid Dust Formation in the Early Universe, doi: 10.48550/arXiv.2410.14671
- Laporte et al. (2017) Laporte, N., Ellis, R. S., Boone, F., et al. 2017, ApJ, 837, L21, doi: 10.3847/2041-8213/aa62aa
- Laporte et al. (2019) Laporte, N., Katz, H., Ellis, R. S., et al. 2019, MNRAS, 487, L81, doi: 10.1093/mnrasl/slz094
- Larson et al. (2023) Larson, R. L., Hutchison, T. A., Bagley, M., et al. 2023, ApJ, 958, 141, doi: 10.3847/1538-4357/acfed4
- Lewis et al. (2023) Lewis, J. S. W., Ocvirk, P., Dubois, Y., et al. 2023, Monthly Notices of the Royal Astronomical Society, 519, 5987, doi: 10.1093/mnras/stad081
- Lotz et al. (2017) Lotz, J. M., Koekemoer, A., Coe, D., et al. 2017, ApJ, 837, 97, doi: 10.3847/1538-4357/837/1/97
- Lower et al. (2024) Lower, S., Narayanan, D., Hu, C.-Y., & Privon, G. C. 2024, The Astrophysical Journal, 965, 123, doi: 10.3847/1538-4357/ad306c
- Lumbreras-Calle et al. (2019) Lumbreras-Calle, A., Muñoz-Tuñón, C., Méndez-Abreu, J., et al. 2019, A&A, 621, A52, doi: 10.1051/0004-6361/201731670
- Ma et al. (2018) Ma, X., Hopkins, P. F., Boylan-Kolchin, M., et al. 2018, MNRAS, 477, 219, doi: 10.1093/mnras/sty684
- Ma et al. (2019) Ma, X., Hayward, C. C., Casey, C. M., et al. 2019, MNRAS, 487, 1844, doi: 10.1093/mnras/stz1324
- Ma et al. (2024) Ma, Z., Sun, B., Cheng, C., et al. 2024, The Astrophysical Journal, 975, 87, doi: 10.3847/1538-4357/ad7b32
- Markov et al. (2024) Markov, V., Gallerani, S., Ferrara, A., et al. 2024, arXiv e-prints, arXiv:2402.05996, doi: 10.48550/arXiv.2402.05996
- Markov et al. (2023) Markov, V., Gallerani, S., Pallottini, A., et al. 2023, Astronomy and Astrophysics, 679, A12, doi: 10.1051/0004-6361/202346723
- Martis et al. (2016) Martis, N. S., Marchesini, D., Brammer, G. B., et al. 2016, ApJ, 827, L25, doi: 10.3847/2041-8205/827/2/L25
- Mirocha & Furlanetto (2023) Mirocha, J., & Furlanetto, S. R. 2023, MNRAS, 519, 843, doi: 10.1093/mnras/stac3578
- Murphy et al. (2011) Murphy, E. J., Condon, J. J., Schinnerer, E., et al. 2011, ApJ, 737, 67, doi: 10.1088/0004-637X/737/2/67
- Mushtaq et al. (2023) Mushtaq, M., Ceverino, D., Klessen, R. S., Reissl, S., & Puttasiddappa, P. H. 2023, MNRAS, 525, 4976, doi: 10.1093/mnras/stad2602
- Narayanan et al. (2024) Narayanan, D., Stark, D. P., Finkelstein, S. L., et al. 2024, The Ultraviolet Slopes of Early Universe Galaxies: The Impact of Bursty Star Formation, Dust, and Nebular Continuum Emission, doi: 10.48550/arXiv.2408.13312
- Noirot et al. (2023) Noirot, G., Desprez, G., Asada, Y., et al. 2023, MNRAS, 525, 1867, doi: 10.1093/mnras/stad1019
- Pope et al. (2017) Pope, A., Montaña, A., Battisti, A., et al. 2017, ApJ, 838, 137, doi: 10.3847/1538-4357/aa6573
- Pope et al. (2023) Pope, A., McKinney, J., Kamieneski, P., et al. 2023, ApJ, 951, L46, doi: 10.3847/2041-8213/acdf5a
- Rieke et al. (2023) Rieke, M. J., Kelly, D. M., Misselt, K., et al. 2023, PASP, 135, 028001, doi: 10.1088/1538-3873/acac53
- Robertson (2021) Robertson, B. E. 2021, arXiv:2110.13160 [astro-ph]. http://arxiv.org/abs/2110.13160
- Rodighiero et al. (2023) Rodighiero, G., Bisigello, L., Iani, E., et al. 2023, MNRAS, 518, L19, doi: 10.1093/mnrasl/slac115
- Rowan-Robinson et al. (2016) Rowan-Robinson, M., Oliver, S., Wang, L., et al. 2016, MNRAS, 461, 1100, doi: 10.1093/mnras/stw1169
- Salvestrini et al. (2024) Salvestrini, F., Feruglio, C., Tripodi, R., et al. 2024, arXiv e-prints, arXiv:2412.02688, doi: 10.48550/arXiv.2412.02688
- Sandles et al. (2024) Sandles, L., D’Eugenio, F., Maiolino, R., et al. 2024, Astronomy and Astrophysics, 691, A305, doi: 10.1051/0004-6361/202347119
- Sarrouh et al. (2024) Sarrouh, G. T. E., Muzzin, A., Iyer, K. G., et al. 2024, ApJ, 967, L17, doi: 10.3847/2041-8213/ad43e8
- Sawicki (2012) Sawicki, M. 2012, MNRAS, 421, 2187, doi: 10.1111/j.1365-2966.2012.20452.x
- Schouws et al. (2022) Schouws, S., Stefanon, M., Bouwens, R., et al. 2022, The Astrophysical Journal, 928, 31, doi: 10.3847/1538-4357/ac4605
- Schouws et al. (2024) Schouws, S., Bouwens, R. J., Ormerod, K., et al. 2024, arXiv e-prints, arXiv:2409.20549, doi: 10.48550/arXiv.2409.20549
- Sun et al. (2025) Sun, F., Wang, F., Yang, J., et al. 2025, ApJ, 980, 12, doi: 10.3847/1538-4357/ad9d0e
- Toyouchi et al. (2025) Toyouchi, D., Yajima, H., Ferrara, A., & Nagamine, K. 2025, arXiv e-prints, arXiv:2502.12538, doi: 10.48550/arXiv.2502.12538
- Traina et al. (2024) Traina, A., Gruppioni, C., Delvecchio, I., et al. 2024, A&A, 681, A118, doi: 10.1051/0004-6361/202347048
- Watson et al. (2015) Watson, D., Christensen, L., Knudsen, K. K., et al. 2015, Nature, 519, 327, doi: 10.1038/nature14164
- Whitaker et al. (2017) Whitaker, K. E., Pope, A., Cybulski, R., et al. 2017, ApJ, 850, 208, doi: 10.3847/1538-4357/aa94ce
- Williams et al. (2024) Williams, C. C., Alberts, S., Ji, Z., et al. 2024, ApJ, 968, 34, doi: 10.3847/1538-4357/ad3f17
- Willott et al. (2015) Willott, C. J., Carilli, C. L., Wagg, J., & Wang, R. 2015, ApJ, 807, 180, doi: 10.1088/0004-637X/807/2/180
- Willott et al. (2022) Willott, C. J., Doyon, R., Albert, L., et al. 2022, PASP, 134, 025002, doi: 10.1088/1538-3873/ac5158
- Willott et al. (2024) Willott, C. J., Desprez, G., Asada, Y., et al. 2024, ApJ, 966, 74, doi: 10.3847/1538-4357/ad35bc
- Withers et al. (2023) Withers, S., Muzzin, A., Ravindranath, S., et al. 2023, ApJ, 958, L14, doi: 10.3847/2041-8213/ad01c0
- Xiao et al. (2024) Xiao, M., Oesch, P. A., Elbaz, D., et al. 2024, Nature, 635, 311, doi: 10.1038/s41586-024-08094-5
- Zackrisson et al. (2011) Zackrisson, E., Rydberg, C.-E., Schaerer, D., Östlin, G., & Tuli, M. 2011, ApJ, 740, 13, doi: 10.1088/0004-637X/740/1/13
- Zavala et al. (2021) Zavala, J. A., Casey, C. M., Manning, S. M., et al. 2021, The Astrophysical Journal, 909, 165, doi: 10.3847/1538-4357/abdb27
- Zimmerman et al. (2024) Zimmerman, D. T., Narayanan, D., Whitaker, K. E., & Davé, R. 2024, The Astrophysical Journal, 973, 146, doi: 10.3847/1538-4357/ad6844