Using firm-level supply chain networks to measure the speed of the energy transition
Abstract
While many national and international climate policies clearly outline decarbonization targets and the timelines for achieving them, there is a notable lack of effort to objectively monitor progress. A significant share of the transition from fossil fuels to low-carbon energy will be borne by industry and the economy, requiring both the decarbonization of the electricity grid and the electrification of industrial processes. But how quickly are firms adopting low-carbon electricity? Using a unique dataset on Hungary’s national supply chain network, we analyze the energy portfolios of 27,000 firms, covering more than 80% of gas, 70% of electricity, and 50% of oil consumption between 2020 and 2023. This enables us to objectively measure the trends of decarbonization efforts at the firm level. Although more than half of firms have increased their share of low-carbon electricity, many have reduced it. Extrapolating the observed trends, we find a transition of only 20% of total energy consumption to low-carbon electricity by 2050. The current speed of transition in the economy is not sufficient to reach climate neutrality by 2050. If firms would adopt the same efforts as the decarbonization frontrunners in their industry, a low-carbon energy share of up to 86% could be reached, putting climate targets within reach. As a key barrier, we identify a ’lock-in’ effect, where firms with a high ratio of fossil fuel costs per revenue are less likely to transition. Accelerating the energy transition will require targeted policies that address these barriers, ensuring that firms can align their decarbonization strategies with best practices.
The global transition from fossil fuels to low-carbon energy sources is crucial for achieving international climate goals [1]. The energy transition has two major components: decarbonizing the electricity grid and electrifying appliances and industrial processes [2, 3]. For some industries and processes, alternative strategies such as biomass, hydrogen, or carbon capture and storage/usage (CCS/CCU) might be more viable options for greenhouse gas mitigation [4, 5, 6, 7]. However, there is widespread agreement that direct electrification is the primary pathway for most end-use sectors and processes [8, 3, 9, 10]. There is an extensive body of literature that analyzes the decarbonization of electricity grids across different scales—global, regional, and national—using energy system models to project the rollout of low-carbon energy technologies [11, 12, 13, 14]. Recently, advances in grid decarbonization have been observed in countries and regions around the world driven by falling prices for renewable energy technologies such as photovoltaic (PV) installations, wind power, and grid-scale batteries [15, 16, 17]. Although many options for the electrification of industrial processes have been discussed [18, 19, 20, 21], comprehensive studies on the actual adoption of these technologies remain scarce or focused on specific industries [22].
The literature on electrification can be divided into two dominant streams. The first examines sector-level energy consumption trends and electrification options from a top-down perspective [23, 24, 25]. Although effective in assessing industrial sectors as a whole, these studies offer limited insight into individual firms, not accounting for firm- and plant-level differences in the adoption of electrification technologies. The second stream consists of case studies on specific firms or small-scale analyses focused on energy-intensive industries regulated by emissions trading schemes or other policy initiatives [26, 27, 22, 28]. Sector-level research is typically enabled by readily available input-output tables, which are often augmented with environmental data, known as environmentally extended input-output (EEIO) tables. These allow for an analysis of sectoral energy consumption and electrification patterns [29, 30]. However, this coarse sectoral view limits our understanding of the underlying dynamics, as firms within the same industry sector do not necessarily use the same technologies or follow the same adoption strategies [31, 32]. Emerging research on firm-level supply chain networks highlights significant heterogeneity between firms even within fine-grained industry sector classifications, including differences in their input and output structure [33], their exposure to climate transition risks [34], or their systemic role in the context of climate policy [35]. Although case studies provide insights to firm-specific behaviors, barriers, and opportunities, they lack generalizability, offering only fragmented perspectives on how firms approach electrification. Some studies have used larger panels of firm- or plant level data to investigate the role of electrification for energy efficiency or productivity, a focus on the broader energy transition is lacking [36, 37].
Here we bridge the gap between top-down sector-level analyses and bottom-up studies of individual firm strategies by using granular national supply chain network data to capture the dynamics of the energy transition at the firm level. Recently, firm-level supply chain network data based on value-added tax (VAT) or electronic invoice data has become available in an increasing number of jurisdictions [38], making it possible to apply the method presented here to monitor the ongoing energy transition in other countries and regions. We analyze consecutive annual snapshots of the Hungarian supply chain network, obtained from VAT data spanning the years 2020 to 2023, to reconstruct the annual energy consumption portfolios of 27,067 firms. The Hungarian supply chain network has been studied, with prior research focusing on structural characteristics [39], systemic relevance of individual firms within the supply chain [40], the role of supply chain disruptions in amplifying financial systemic risk [41], the temporal dynamics of supply chain networks [42]. A review on the state of firm-level supply chain network research is available [43].
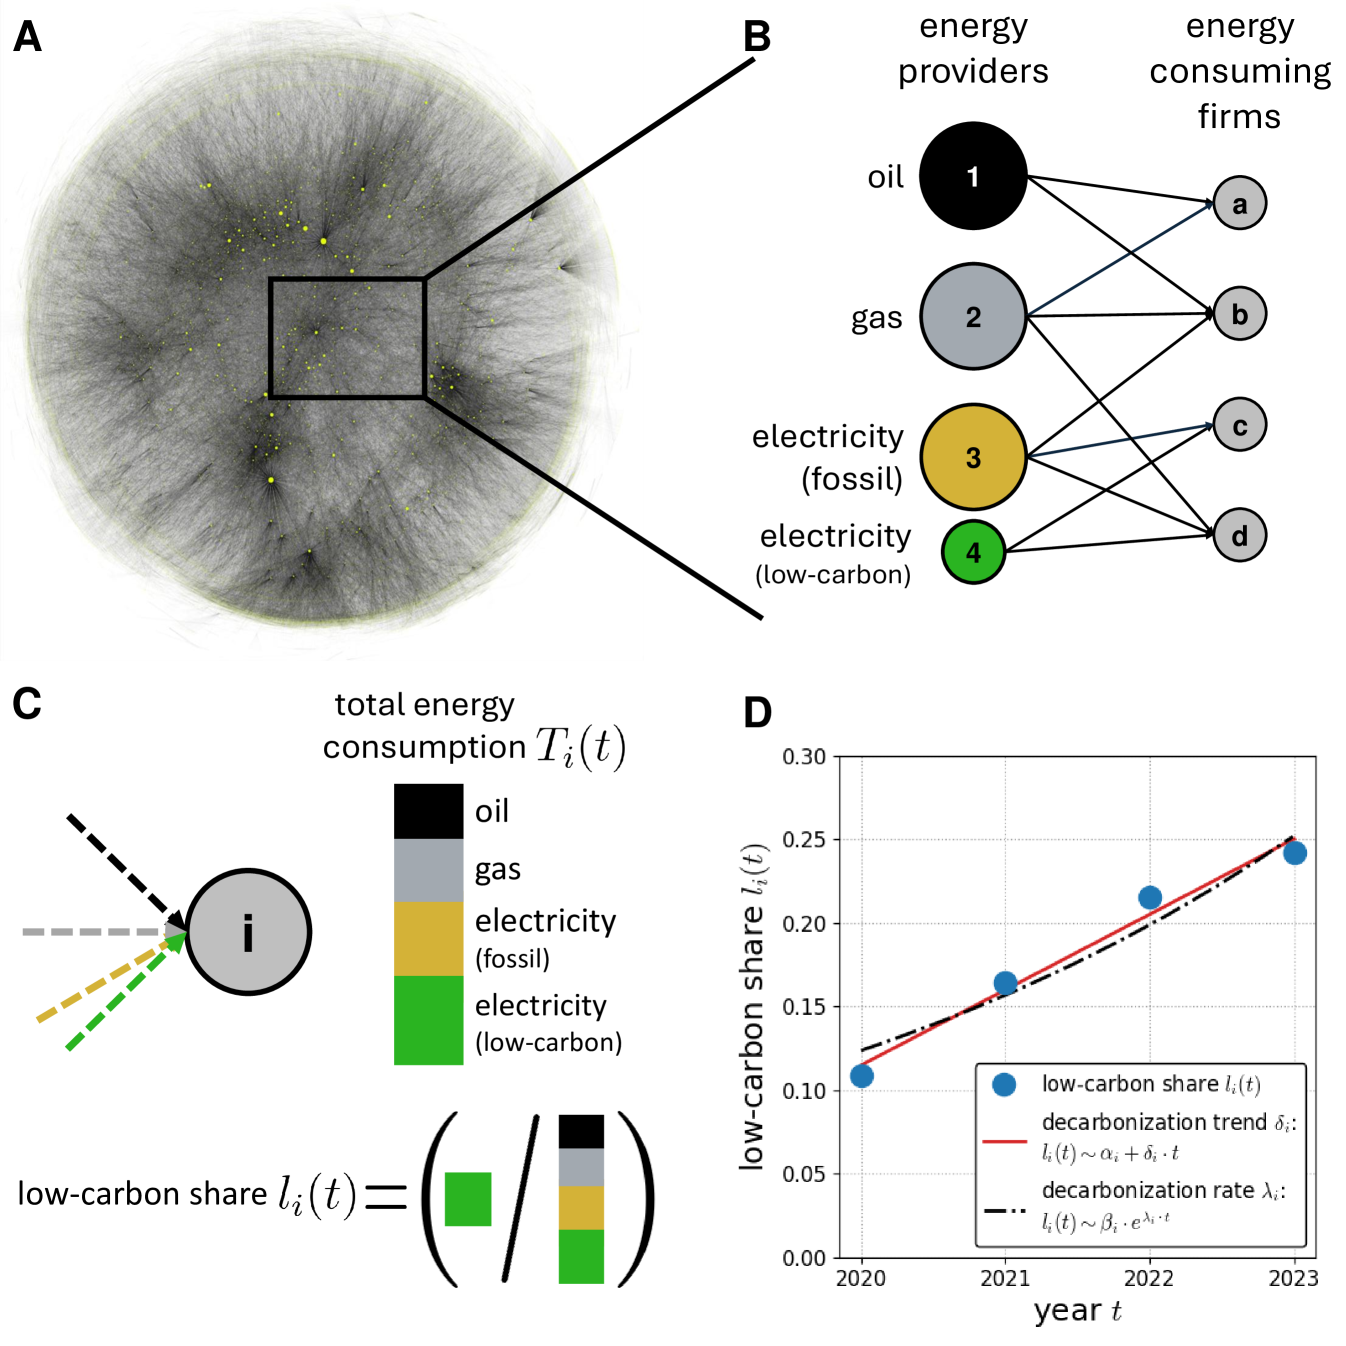
We use the Hungarian supply chain network to identify energy-providing firms —those supplying electricity, gas, or oil products— based on their NACE 4-digit industry classification [44], as well as energy-consuming firms, as illustrated in Fig.1A,B. We obtain a sample of 27,067 firms with continuous time series data on electricity, gas, and oil consumption, as well as revenue, spanning from 2020 to 2023; for details, see the Methods section. By applying annual energy prices for electricity, gas, and oil, we convert monetary transactions observed in the supply chain network into kilowatt-hours of energy consumption. Low-carbon electricity consumption, , for each firm, , is determined by multiplying its electricity consumption, , with the low-carbon share of Hungary’s annual electricity mix, . Note that nuclear energy is included as a low-carbon source of electricity, in line with its classification by both the IPCC and the Hungarian government that has set a target for 90% low-carbon electricity by 2030 [3, 45]. A firm’s low-carbon energy share, , is then calculated as the ratio of its low-carbon electricity consumption, , to its total energy consumption, , within a given year, , as shown schematically in Fig.1C. To quantify the pace of the energy transition at the firm level, we employ two approaches. First, we fit a linear function to across the observation period to derive the decarbonization trend, , of every firm, . Second, we fit an exponential function to to estimate the decarbonization rate, of . These indicators for the pace of the energy transition can be interpreted as two distinct patterns of technological change: an incremental mode (linear trend) that assumes steady and gradual progress, and a disruptive mode (exponential rate) that reflects more rapid transitions, such as those driven by capital stock renewal. Both modes have been observed and analyzed in previous studies on technology adoption [46, 47]. With these measures, we are able to address the following questions: How heterogeneous are firms, both within and across industry sectors in their adoption of low-carbon electricity? What characteristics distinguish transitioning firms—–those with positive decarbonization trends, , and rates, ,—from non-transitioning firms? And, finally, are the current trends sufficient to achieve an energy transition that aligns with international climate targets?
Results
Firm-level heterogeneity of energy consumption. The analysis of firm-level decarbonization trends shows significant heterogeneity in both, low-carbon consumption, and decarbonization trends in the various industry sectors. Figure 2 illustrates the variation in low-carbon electricity consumption, , decarbonization trend, , and low-carbon share, , for every firm, , in the year . The scatter plot shows low-carbon electricity consumption, , on the -axis (logarithmic scale) versus the decarbonization trend, on the -axis (linear scale) for every firm, . Every marker represents one firm, colors indicate the NACE 1-digit industry category, the size represents its revenue in 2023. We exclude firms acting as energy providers since we are focused on the energy consumption of end-users; see Method section for details. The plot shows a wide range of decarbonization trends, with firms of all sizes, low-carbon electricity consumption levels, and sector affiliations exhibiting both, positive, and negative decarbonization trends, . The majority of firms show decarbonization trends centered around zero, meaning that their low-carbon share, , remained relatively stable over the observation period. The top consumers of low-carbon electricity are primarily found in the ’C - Manufacturing’ sector, along with firms in the ’G - Wholesale and retail trade; repair of motor vehicles and motorcycles’ sector. The plot also highlights considerable variability in decarbonization trends across both, sectors, and individual firms. While low-carbon electricity consumption and decarbonization trends span nearly the entire space, a considerable gap exists in the bottom-right corner of Fig.2A, where small electricity consumers with high decarbonization rates are practically absent. This suggests that predominantly larger firms and those with higher electricity consumption dominate the progress in increasing their low-carbon electricity share. The majority of small consumers (defined as those with low-carbon consumption, kWh for ) exhibit negative decarbonization trends, with 2,859 firms showing a decline of their low-carbon share compared to 1,448 firms displaying positive trends.
Figure 2B shows the distribution of the low-carbon share, , for for the NACE 2-digit industry sectors. While median values are generally low, notable within-sector heterogeneity exists, along with variation between NACE 2-digit sectors within the same NACE 1-digit category. Manufacturing sectors, which are among the largest consumers of low-carbon electricity (as shown in Fig.2A), exhibit higher median low-carbon shares. Service sectors such as ’J - Information and communication’ and ’M - Professional, scientific, and technical activities’, located higher up in the NACE industry classification, also show higher median values. Across all sectors, some firms approach a low-carbon share of 0.7, indicating near-exclusive use of low-carbon electricity. The upper bound for the low-carbon share is 0.7017, representing the proportion of low-carbon electricity sources in the Hungarian electricity mix in 2023 (see the Methods section for more details). Although some firms have made significant progress in increasing their low-carbon share, the majority still show relatively modest levels.
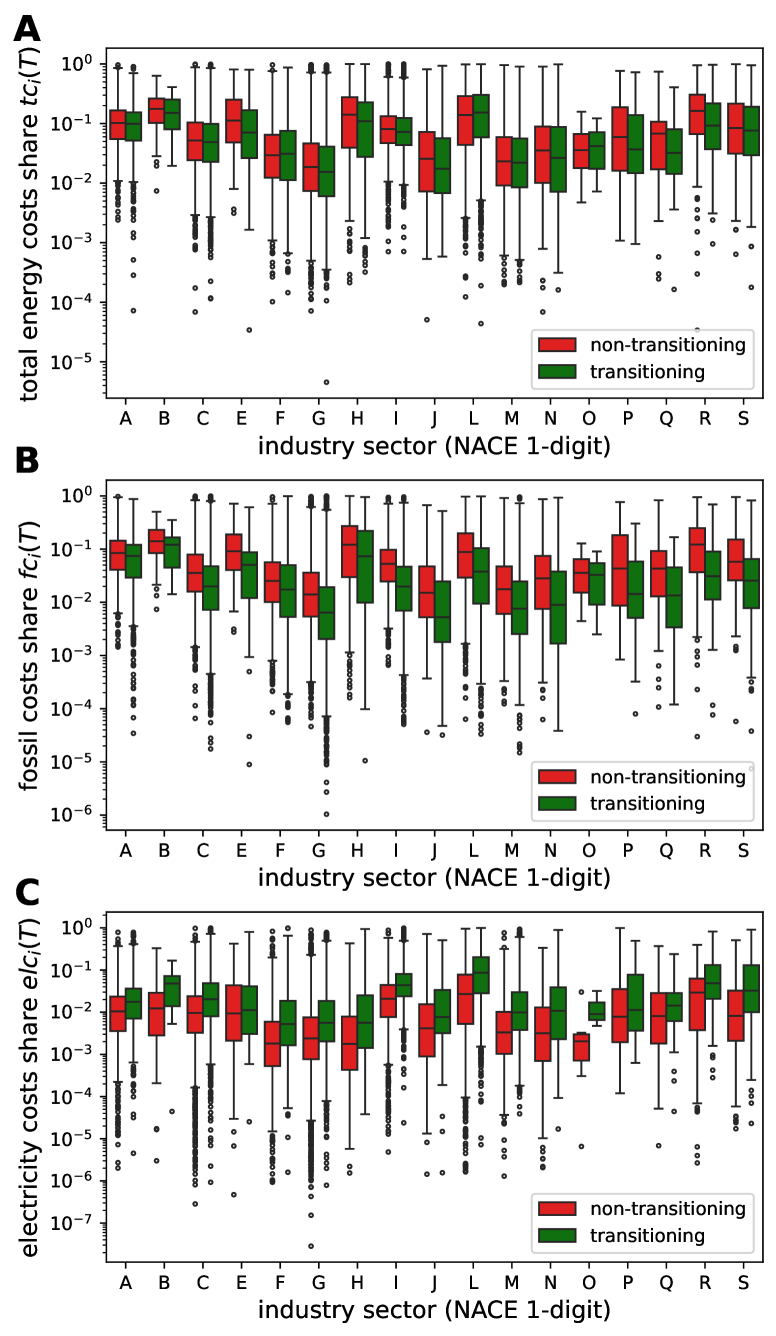
Characteristics of transitioning firms. To determine which firms tend to transition, Fig. 3 shows the relation between energy costs as a fraction of firm revenue for all NACE 1-digit categories. distinguishing between firms that are transitioning ( and , green) and those that are not transitioning (negative decarbonization trend and , red) for the year 2023. Figure 3A presents the distributions of the total energy cost share, , as box plots. Within every sector, there is considerable heterogeneity in energy costs: some firms incur substantial energy costs, while others have relatively low ones as a fraction of their annual revenue. Although the median total energy cost share varies significantly across NACE 1-digit categories, there is little difference between transitioning and non-transitioning firms. Logistic regression results, summarized in Table 1 confirm this observation. The regression coefficient, , predicting a firm’s transitioning status based on its total energy cost share, is not statistically significant for any industry; see Methods section for details. Figure 3B presents the distribution of the fossil cost share, . Similar to A, the distributions exhibit substantial within-sector heterogeneity, with transitioning firms generally displaying wider variability than non-transitioning ones in most sectors. The median fossil cost share varies considerably between sectors and between transitioning and non-transitioning firms within the same sector. Logistic regression results in Table 1 reveal that the regression coefficients, , are negative for all sectors and highly significant for most, indicating a consistent association between fossil energy costs and transitioning status. The adjusted odds ratios for a 1% increase in fossil energy cost share show a significant decrease in the likelihood of transitioning for most sectors, supporting the hypotheses that high fossil energy costs are associated with non-transitioning firms. Figure 3C presents the distribution of the electricity cost share, . In contrast to A and B, the median electricity cost share is lower for most sectors, but it still varies considerably across NACE 1-digit categories. Similar to B, the distributions of electricity cost share, , differ significantly between transitioning and non-transitioning firms, with transitioning firms consistently exhibiting higher electricity cost shares. Logistic regressions in Table 1 indicate that is positive for all sectors and highly significant for most, reflecting a systematic association between electricity costs and transitioning status. The adjusted odds ratios for a 1% increase in electricity cost share show a consistent increase in the likelihood of transitioning for most sectors, supporting the hypotheses that higher electricity costs are more common among transitioning firms. These statistically significant results suggest that a firm’s energy cost structure plays a significant role in determining whether it transitions to low-carbon electricity consumption. The observed higher electricity costs for transitioning firms and higher fossil energy costs for non-transitioning firms indicate the presence of a ’lock-in’ effect, where firms are constrained by their current energy technologies. Upfront investments required to switch to low-carbon electricity may deter firms from transitioning.
|
|
|
|
|||||||||||
| A | -0.21 (0.43) | 0.998 | -1.86*** (0.51) | 0.982 | 3.72*** (0.95) | 1.038 | ||||||||
| B | -1.11 (2.22) | 0.989 | -3.32 (2.85) | 0.967 | 6.01 (5.73) | 1.062 | ||||||||
| C | -0.07 (0.23) | 0.999 | -2.43*** (0.32) | 0.976 | 7.58*** (0.67) | 1.079 | ||||||||
| E | -1.48 (0.84) | 0.985 | -3.52** (1.27) | 0.965 | 1.30 (1.48) | 1.013 | ||||||||
| F | 0.49 (0.42) | 1.005 | -1.23* (0.52) | 0.988 | 5.33*** (1.06) | 1.055 | ||||||||
| G | 0.10 (0.22) | 1.001 | -1.97*** (0.30) | 0.980 | 6.57*** (0.70) | 1.068 | ||||||||
| H | -0.83 (0.45) | 0.992 | -1.15* (0.45) | 0.989 | 5.84** (1.95) | 1.060 | ||||||||
| I | -0.32 (0.32) | 0.997 | -4.31*** (0.53) | 0.958 | 4.88*** (0.67) | 1.050 | ||||||||
| J | -0.82 (0.75) | 0.992 | -4.92*** (1.46) | 0.952 | 4.63** (1.78) | 1.047 | ||||||||
| L | 0.31 (0.18) | 1.003 | -2.77*** (0.27) | 0.973 | 4.69*** (0.36) | 1.048 | ||||||||
| M | 0.46 (0.44) | 1.005 | -2.29*** (0.63) | 0.977 | 6.83*** (1.27) | 1.071 | ||||||||
| N | -0.06 (0.51) | 0.999 | -1.85** (0.67) | 0.982 | 8.61*** (1.96) | 1.090 | ||||||||
| O | 1.93 (14.03) | 1.019 | -3.33 (18.20) | 0.967 | 67.82 (60.45) | 1.970 | ||||||||
| P | -0.87 (1.13) | 0.991 | -4.61* (2.10) | 0.955 | 0.82 (1.54) | 1.008 | ||||||||
| Q | -3.95 (2.35) | 0.961 | -13.30** (4.83) | 0.875 | 2.04 (3.55) | 1.021 | ||||||||
| R | -1.64* (0.67) | 0.984 | -4.26*** (0.98) | 0.958 | 4.98*** (1.44) | 1.051 | ||||||||
| S | -0.26 (0.56) | 0.997 | -3.48*** (0.87) | 0.966 | 5.84*** (1.26) | 1.060 |
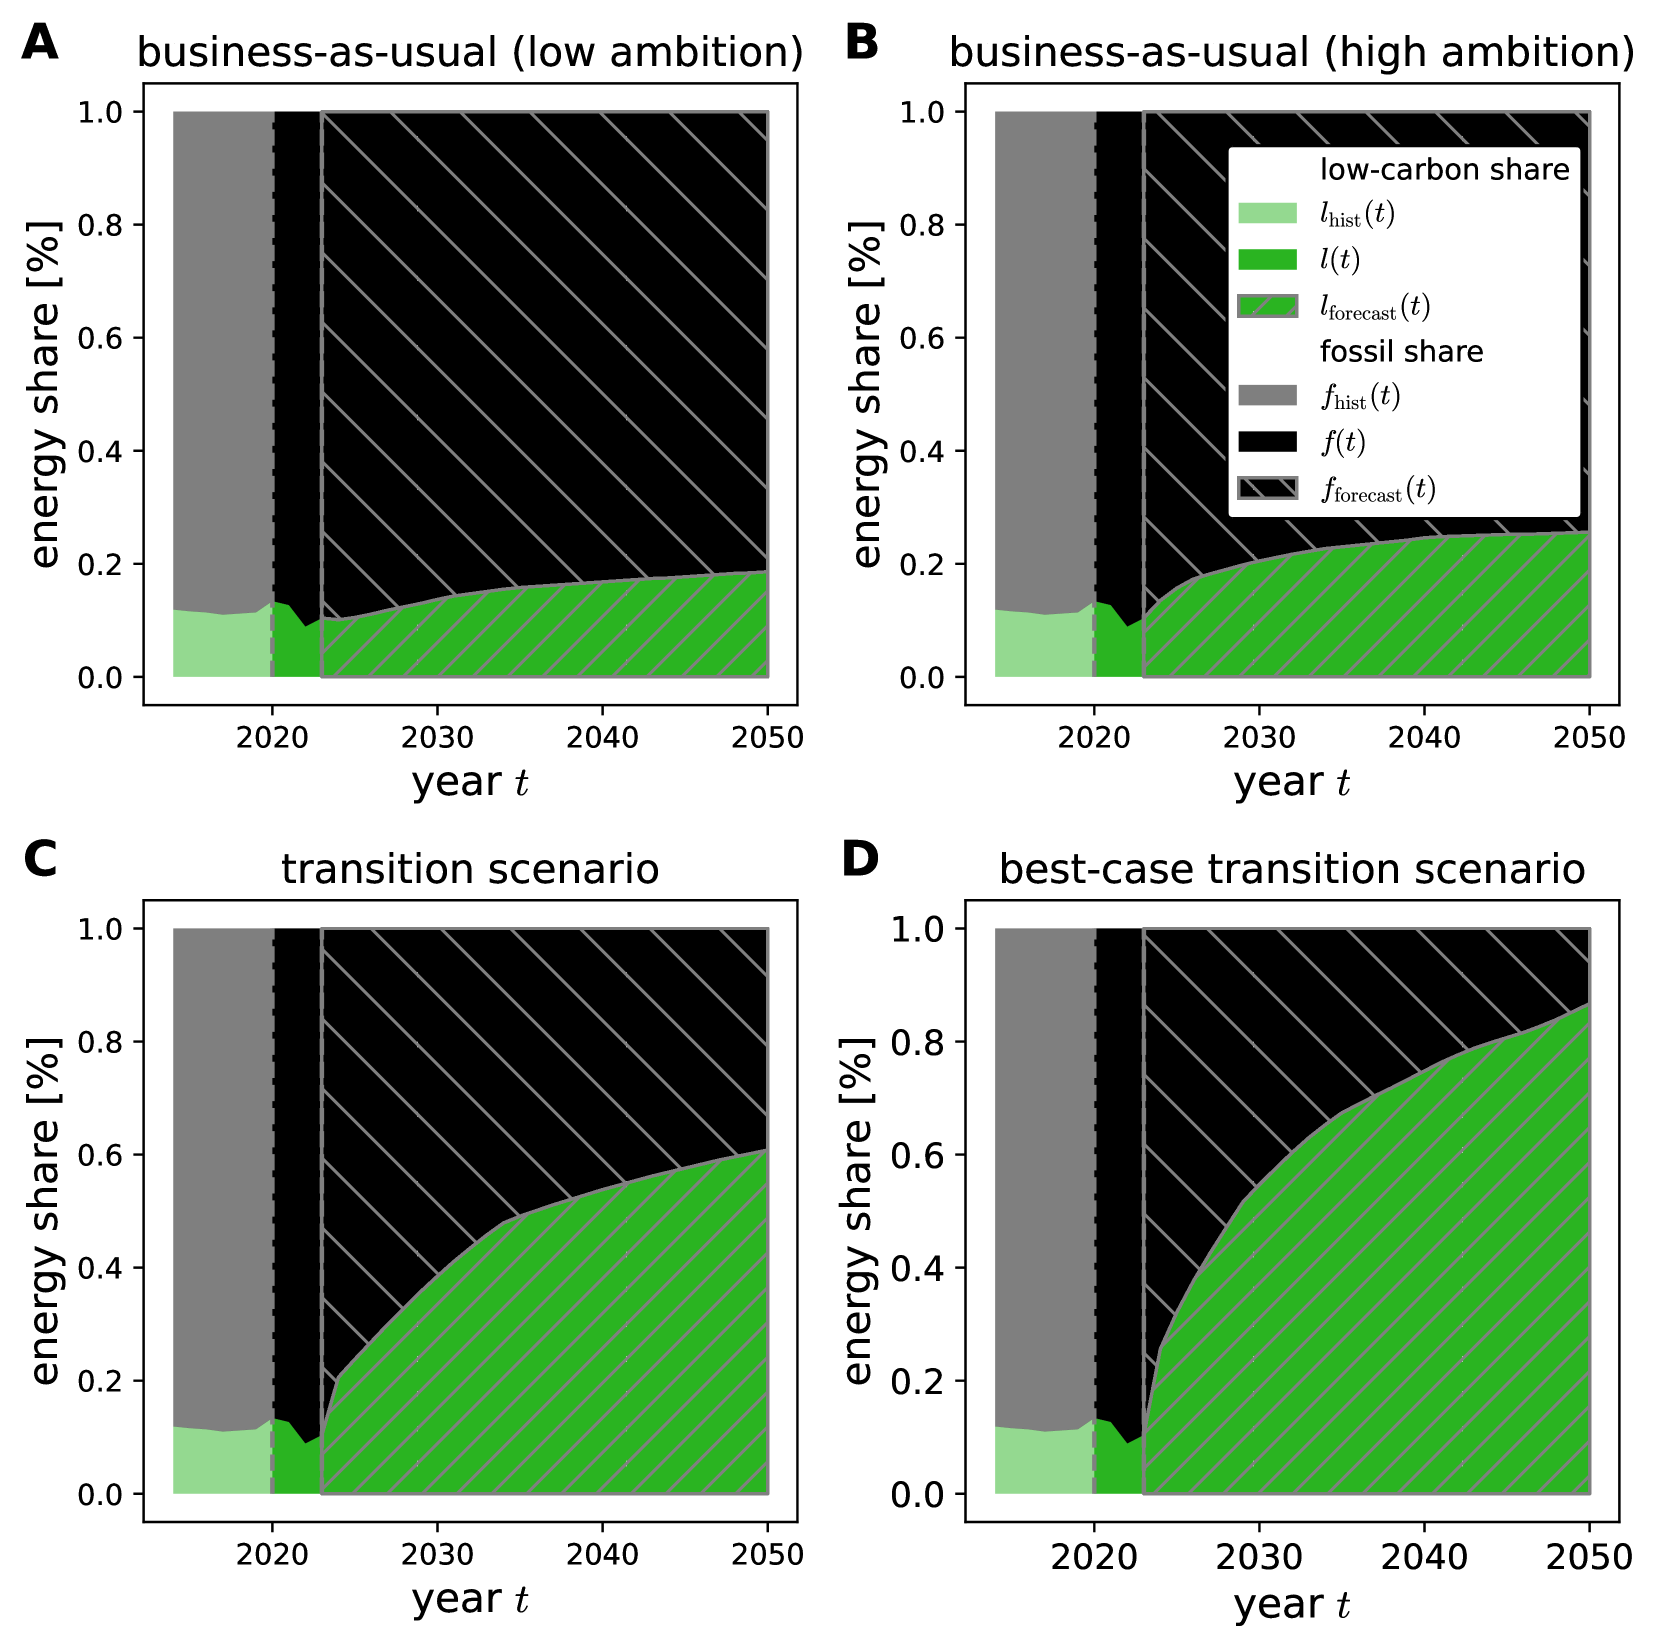
Energy transition scenarios. To examine whether the current pace of the energy transition aligns with international climate goals, Fig.4 presents scenarios of future estimated energy consumption for all firms in the sample. Specifically, it displays four scenarios illustrating how the energy share between low-carbon electricity (green) and fossil energy (black) could evolve until 2050, based on the observed decarbonization trends, , and decarbonization rates, ; see Methods section for details. All panels show the aggregated low-carbon shares, , and the observed fossil shares, , of all firms in the sample during the period 2020–2023 as solid area plots. For reference, Hungary’s historical final energy consumption shares of low-carbon electricity, , and fossil energy, , from 2014–2019 are displayed as shaded area plots with reduced opacity. While not directly comparable to the low-carbon shares estimated from the aggregated firm sample, these historical values provide a context for Hungary’s energy transition progress. Future estimated low-carbon electricity shares, , and fossil energy shares, , are depicted as hatched area plots. For the forecast values, it is assumed that firms continue consuming the average amount of energy reconstructed for the period 2020–2023. The electricity mix of Hungary is assumed to gradually decarbonize until 2035, aligning with Hungary’s goal of achieving 90% low-carbon electricity by 2030; For details, see Methods section and SI section S3 Electricity mix of Hungary and forecast until 2050.
Figure 4A depicts the business-as-usual scenario with low ambition, based on observed decarbonization trends, . Firms with positive trends increase their share of low-carbon electricity, while firms with negative trends reduce it over time. The plot shows that the system quickly saturates, with reaching only by 2050; see Table 2. This suggests that no substantial transition occurs if the current linear trends persist.
Figure 4B illustrates the business-as-usual scenario with high ambition, based on observed decarbonization rates, . Firms with positive rates significantly increase their share of low-carbon electricity, while those with negative rates decrease it over time. Initially, the overall low-carbon share, , rises rapidly but plateaus around 2030, as most firms with positive rates fully decarbonize by then. By 2050, the low-carbon share reaches a value of only . This indicates that even with exponential adoption of electrification technologies, the system-wide transition to low-carbon electricity would fall short of meeting international climate goals. Firms currently increasing their fossil energy shares must reverse this trend, as explored in the transition scenarios in Fig.4C and Fig.4D.
Figure 4C shows a transition scenario, where every firm with a negative decarbonization trend, , adopts a positive trend derived from an industry peer within the same NACE 4-digit sector, matched by revenue and employment in 2023. This means that every firm adopts the positive electrification strategies of its peers, resulting in all firms having positive decarbonization trends, from onward. In this optimistic scenario, the forecast low-carbon electricity share, , rises sharply until the mid-2030s, as Hungary’s electricity mix becomes fully decarbonized. Beyond that point continues to grow steadily, reaching a share of by 2050; see Table 2. However, even with industry-wide adoption of positive linear decarbonization trends, , the energy transition on the firm level remains insufficient to achieve the rapid emission reductions required to meet climate targets , i.e., net-zero emissions by 2050 [1]. Figure 4D presents the best-case scenario, where every firm with a negative decarbonization rate, , adopts a positive rate from onward from an industry peer within the same NACE 4-digit sector, matched by revenue and employment in 2023. This scenario assumes that all firms adopt the best-case electrification strategies of their peers, resulting in universal positive decarbonization rates. Here, the forecast low-carbon electricity share, , increases rapidly until 2035, when Hungary’s electricity mix is fully decarbonized. Beyond this point continues to climb steeply, reaching a share of by 2050. This suggests that in a best-case scenario, where all firms pivot decisively towards electrification, the energy transition at the firm level could achieve the speed and depth needed to align with international climate targets, given that electrification is typically associated with significant gains in energy efficiency gains [3].
| business-as-usual (low ambition) | business-as-usual (high ambition) | transition scenario | best-case transition scenario | |||||
| year | ||||||||
| 2020 | 0.134 | 0.866 | 0.134 | 0.866 | 0.134 | 0.866 | 0.134 | 0.866 |
| 2030 | 0.137 | 0.863 | 0.205 | 0.795 | 0.385 | 0.615 | 0.547 | 0.453 |
| 2040 | 0.168 | 0.832 | 0.246 | 0.754 | 0.538 | 0.462 | 0.748 | 0.252 |
| 2050 | 0.186 | 0.814 | 0.256 | 0.744 | 0.608 | 0.392 | 0.867 | 0.133 |
Discussion
Achieving climate neutrality in line with international climate goals rests on the success of the energy transition. Much of that transition must be borne by the industry and the economy. While much of the existing research has focused on the decarbonization of electricity grids, comprehensive studies on the uptake of low-carbon electricity by firms remain scarce. Here, we present findings on the speed of the energy transition at the firm level by reconstructing the energy portfolio of 27,067 of the most relevant energy consuming firms in Hungary. Our analysis uses granular, firm-level supply chain network data for the first time, providing an unprecedented level of detail on the state of the energy transition. We analyze the uptake of low-carbon electricity, try to find distinguishing characteristics of transitioning and non-transitioning firms, and discuss the feasibility of meeting international climate goals based on the currently realized firm-level electrification trajectories.
Our findings show remarkable heterogeneity both within and between industry sectors concerning low-carbon electricity consumption, the share of low-carbon electricity in the overall energy mix, and the decarbonization speeds of firms – defined as the speed of increase in the low-carbon electricity share between 2020 and 2023. While more than half of the firms in the sample showed positive decarbonization trends, indicating an increase in their low-carbon electricity share over the observation period, nearly half of the firms actually reduced their low-carbon electricity share. This is a concerning indication that the energy transition is far from assured, and a huge fraction of firms continues to rely on fossil energy sources.
We find that transitioning and non-transitioning firms display distinct characteristics regarding their fossil energy and electricity costs. Non-transitioning firms typically have higher fossil energy costs as a share of their annual revenue compared to transitioning firms within the same sector. Conversely, transitioning firms tend to have higher electricity costs as a share of their revenue than non-transitioning firms. These differences are statistically significant across most NACE 1-digit sectors, as confirmed by logistic regression analysis based on fossil and electricity cost shares. The high levels of statistical significance of the quantified relations suggest that energy cost structures play a key role in the adoption of electrification technologies. The adjusted odds ratios show that a 1% increase in fossil energy cost share decreases the odds of transitioning, whereas a 1% increase in electricity cost share increases the odds of transitioning for almost all sectors. For most sectors, the positive effect for higher electricity costs is even more pronounced than the negative effect for higher fossil energy costs. The observed higher electricity costs for transitioning firms and higher fossil energy costs for non-transitioning firms point to a ’lock-in’ effect, where firms are constrained by their existing energy technologies. High upfront investments required for switching to low-carbon electricity may discourage firms from transitioning. This investment barrier has been noted in previous studies [3, 9, 10]. An immediate policy implication of this result is that policymakers should consider targeted incentives, such as subsidies, tax breaks, and technology standards, to help firms overcome these barriers.
To assess whether current trends align with international climate goals, we simulate several scenarios based on the presented decarbonization trends and rates, as well the potential of a shift in firms’ decarbonization strategies. Four scenarios are modeled, differing in their assumptions about firm behavior. In the business-as-usual (low ambition) scenario, firms continue on their current paths, increasing their low-carbon electricity share according to the observed linear decarbonization trends. In this scenario, the low-carbon electricity share reaches only 18.6% by 2050, which is far below international climate targets. The high-ambition business-as-usual scenario, where firms maintain their observed exponential decarbonization rates, results in a 25.6% low-carbon electricity share by 2050—still insufficient to meet climate goals. These findings suggest that if firms continue along their current decarbonization trajectories, a meaningful energy transition will not be feasible. We also model transition scenarios where firms hypothetically adopt the decarbonization strategies of their industry peers. In the scenario where firms adopt the linear decarbonization trends of the industry leaders, the aggregated low-carbon electricity share rises to 50.8% by 2050. Only in the best-case scenario, where firms adopt the positive exponential decarbonization rates of their peers, does the aggregated low-carbon electricity share reach 86.7% by 2050 —now aligning with the emissions reductions required to stay on track with the Paris climate goals.
Our study has several limitations. The data analyzed covers the period from 2020 to 2023. Prior to 2020, the quality of firm-level data is less reliable due to changes in the thresholds for reporting VAT transactions. Specifically, firms were required to report VAT transactions only when they reached a certain transaction value threshold, which decreased over time. After 2020, this threshold was removed entirely, as described in [43]. Only then a complete reconstruction of the energy portfolios of firms becomes possible. Although 2020-2023 allows one to obtain trends in the firm-level energy transition, it is a relatively short time span. Nevertheless, this period is particularly relevant, as electrification and renewable energy technologies have become more affordable, and climate policies, such as those in the EU Green Deal introduced in late 2019, gained increasing momentum among policymakers and industry. In this respect, the 2020-2023 period represents a crucial phase for observing the onset of the energy transition.
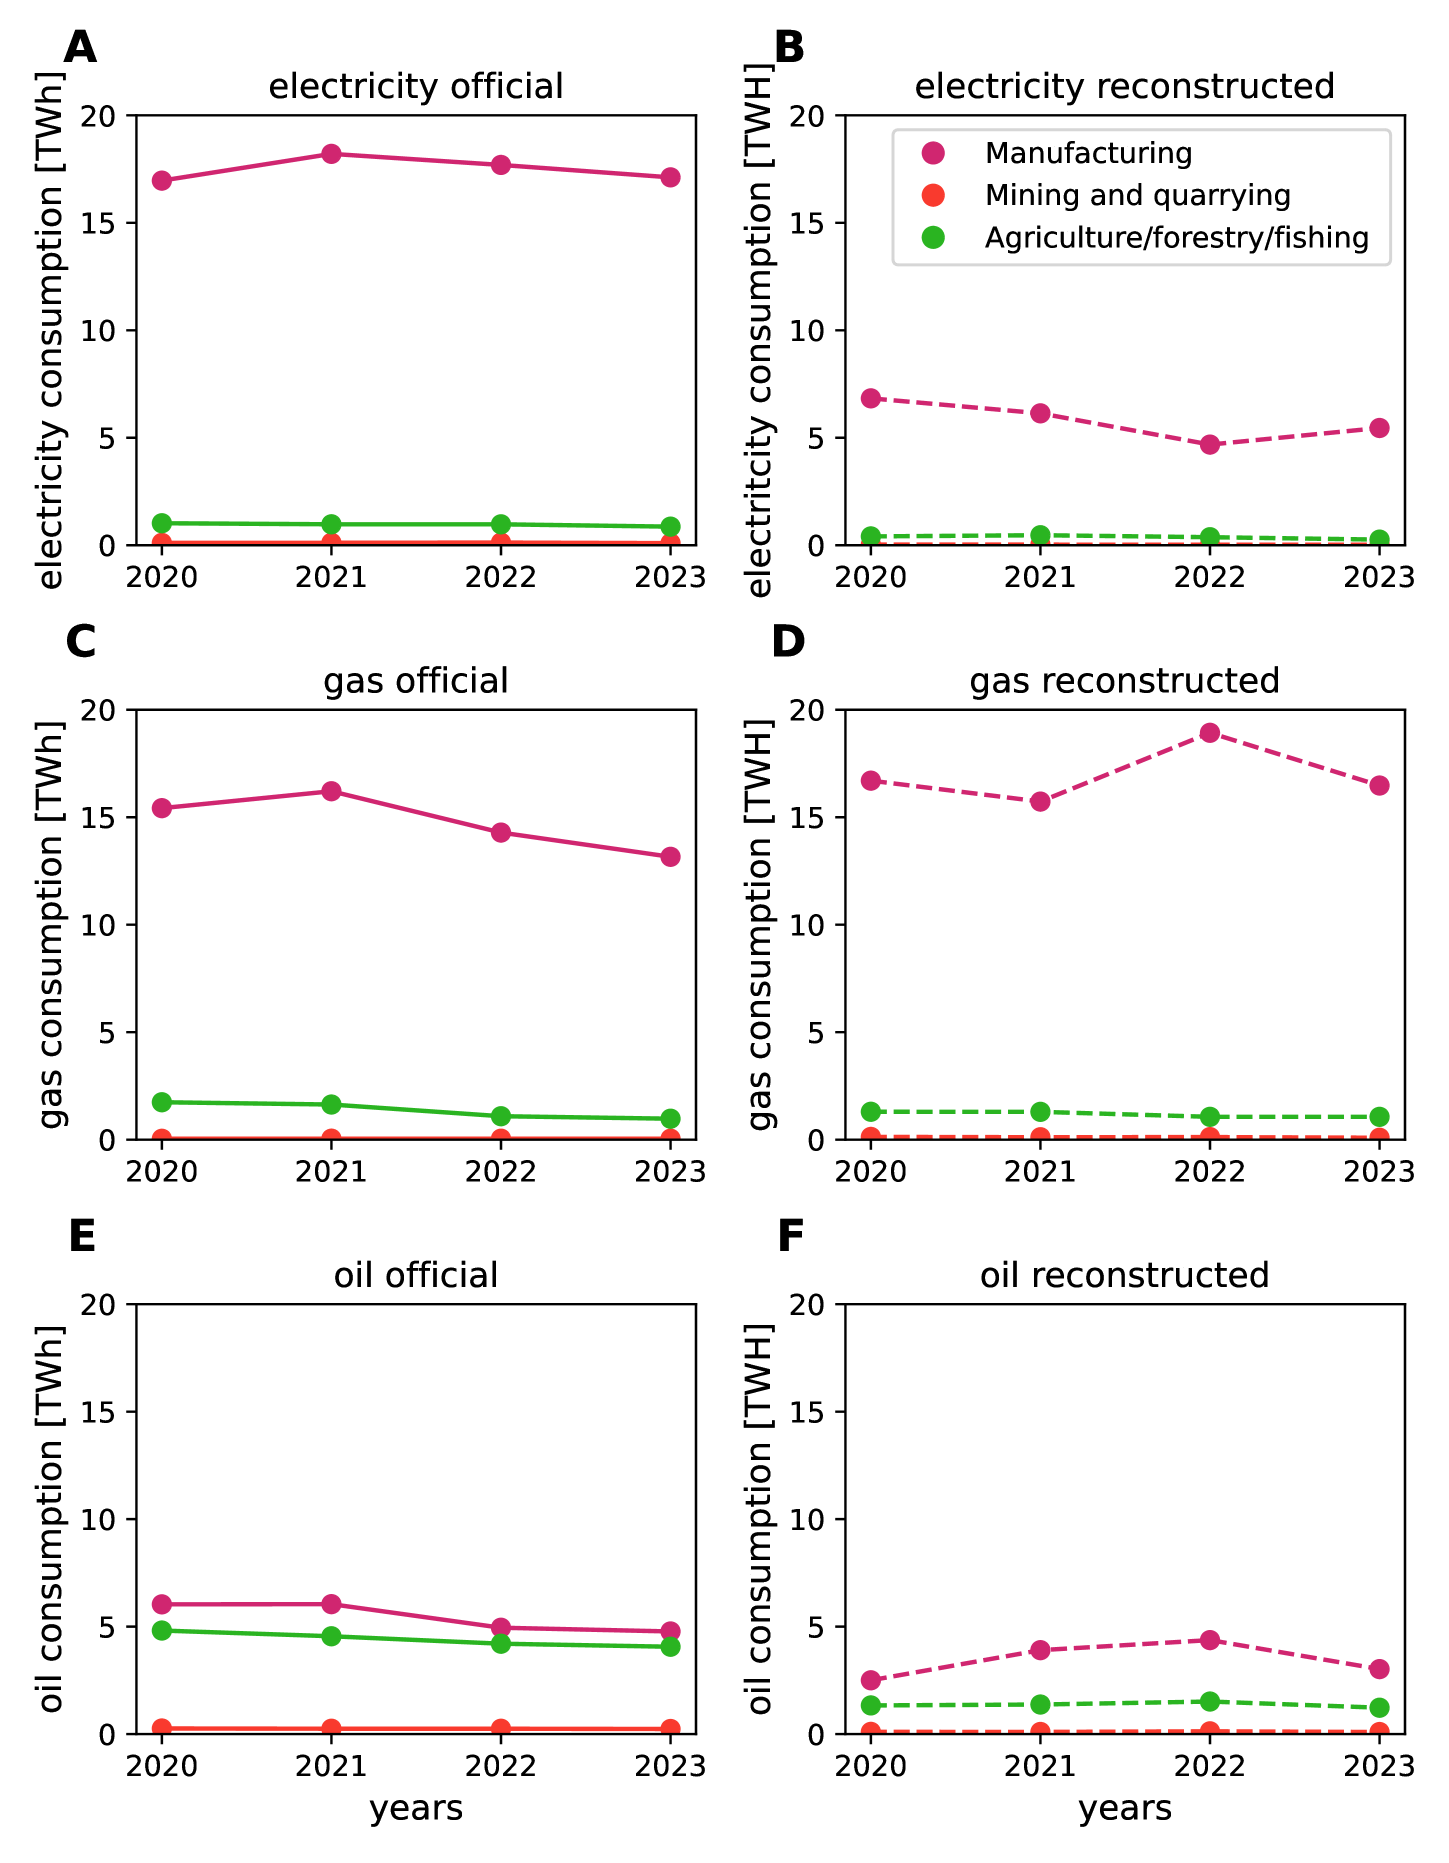
The fluctuations in energy prices, particularly for electricity and gas during the energy crisis, may have impacted the results. For instance, in 2022, we observed a decline in the overall low-carbon electricity share, as shown in the scenarios in Fig.4. This decrease can be attributed to the sharp rise in electricity prices during the crisis. We use annual average prices for different categories of industrial consumers for both electricity and gas, sourced from EUROSTAT[48, 49]. This approach ignores price fluctuations during a year which can lead to an underestimation of electricity consumption and an overestimation of gas consumption; see SI section S5 Comparison of firm sample to sectoral energy consumption data. In general, our methodology is more robust for years with relatively stable energy prices. For additional information on how energy price data was handled, refer to the Methods section and SI sections S1 Electricity and gas price evolution in Hungary, and S2 Fuel price evolution in Hungary.
Energy providers typically sell both, gas and electricity but are categorized under only one NACE code, either for the distribution of gas or electricity. To address this issue, we limited our analysis to firms with connections to both gas and electricity distributors, assuming they would purchase gas and electricity from separate providers. This restriction resulted in a sample of 27,067 firms, which still accounts for a substantial portion of energy consumption (34.0% of total final energy consumption in Hungary in 2023 — 22.7 % of electricity, 64.0 % of gas, 18.6 % of oil), making it a reasonable representation of the broader firm population. Further details on this selection process are found in the Methods section. A discussion of the resulting firm sample is presented in SI sections S4 Firm sample description and S5 Comparison of firm sample to sectoral energy consumption data.
Oil products are highly heterogeneous, ranging from fuels such as gasoline and diesel to feedstocks like naphtha. Since we do not have product-level information but only observe monetary transactions in the supply chain between firms, we must make assumptions about which oil products firms consume in order to convert monetary values into kilowatt-hours via prices. Specifically, we assumed that firms consume oil in the form of diesel and gasoline, applying the weighted average price of these fuels in Hungary. This provides a reasonable estimate of the energy consumed through oil products, as diesel and gasoline are by far the most widely consumed oil products in Hungary, with the exception of the chemical industries where naphtha is the most prevalent. For more details, see the Methods section and SI section S2 Fuel price evolution in Hungary.
Another limitation is that we do not observe energy generation activities carried out directly on firms’ premises, such as photovoltaic (PV) installations, which are becoming increasingly significant in the transition to low-carbon energy. Our analysis is restricted to energy purchases made from other companies. However, utility-scale PV installations and household rooftop solar account for approximately 80% of the total installed capacity, so the impact of any mis-estimation from commercial PV installations is relatively small [50, 51]. Our focus is on electrification as a strategy for adopting low-carbon energy, which is a viable pathway for most sectors but may not be applicable to all, such as the chemical industry or cement production, where alternative decarbonization strategies are needed. Future research could explore these alternative strategies if detailed product-level information becomes available for firm-to-firm transactions within supply chain networks. This would enable a broader assessment of decarbonization approaches beyond electrification, providing an even more comprehensive understanding of firm-specific energy transition pathways.
Our study reveals the presence of both, frontrunners, and laggards across all industrial sectors. Notably, even within the fine-grained NACE 4-digit classification that groups firms by similar activities, there are firms exhibiting both positive and negative decarbonization trends. This suggests that a technical pathway for the energy transition exists for firms in virtually all industries. However, maybe the most relevant result of this study is that many firms continue to move in the wrong direction, underscoring the urgent need for more effective policies to oversee, incentivize, and guide the energy transition at the firm level. Our use of firm-level supply chain network data to analyze decarbonization trends establishes a robust foundation for more comprehensive and detailed studies of firm strategies in the energy transition. As such data becomes increasingly accessible across a growing number of regions [38], our methodology offers a scalable and transferable approach for monitoring and comparing the energy transition of different nations, and for identifying best practices.
Methods
Using the Hungarian Firm-Level Supply Chain Network to Reconstruct Annual Energy Consumption Portfolios of Firms
This study relies on the reconstructed firm-level supply chain network of the Hungarian economy, derived from value-added tax (VAT) transaction data collected by the Hungarian National Tax and Customs Administration. Since 2014, this data, made available through the Central Bank of Hungary, has enabled the identification of supply relationships between firms, facilitating the creation of detailed snapshots of the Hungarian supply chain network at the firm level. More information on this dataset can be found in previous studies [39, 40]. The dataset anonymizes the companies but provides information such as revenue, number of employees, and industry sector, enabling analysis based on company size and activities. The coverage of the dataset has evolved over time due to changes in reporting thresholds for VAT transactions. Between early 2015 and mid-2018, only transactions with a cumulative tax content exceeding 1 million Hungarian Forint (HUF) within a reporting period (monthly, quarterly, or annually) were recorded. From the third quarter of 2018 to mid-2020, the threshold was lowered to 100,000 HUF and applied to individual transactions, significantly increasing the visibility of firms and their supply relationships. However, firms whose transactions consistently fell below this new threshold were excluded. Since the third quarter of 2020, all inter-firm invoices must be reported, eliminating thresholds entirely and providing a comprehensive view of supply chain relationships. This is also discussed in detail in [43].
Identifying energy providers
For this study, we use annual snapshots of the Hungarian firm-level supply chain network from 2020 to 2023, as this period offers the most consistent and comprehensive time-series data following the removal of reporting thresholds. To identify energy providers within the network, we categorize firms based on their NACE 4-digit industry affiliations. Electricity providers are identified as firms classified under one or more of the following categories: ’D35.1 - Electric power generation, transmission, and distribution,’ ’D35.1.1 - Production of electricity,’ ’D35.1.2 - Transmission of electricity,’ ’D35.1.3 - Distribution of electricity,’ and ’D35.1.4 - Trade of electricity.’ Gas providers are identified as firms in the categories ’D35.2.1 - Manufacture of gas,’ ’D35.2.2 - Distribution of gaseous fuels through mains,’ and ’D35.2.3 - Trade of gas through mains.’ Oil providers are identified as firms classified under ’B6.1.0 - Extraction of crude petroleum,’ ’C19.2.0 - Manufacture of refined petroleum products,’ ’G47.3.0 - Retail sale of automotive fuel in specialized stores,’ and ’G46.7.1 - Wholesale of solid, liquid, and gaseous fuels and related products.’ It is important to note that multiple NACE 4-digit categories are included for each type of energy provider (electricity, gas, and oil) to account for the limitations of industry classifications. Firms’ NACE classifications do not always capture the full scope of their activities. For instance, a firm might simultaneously transport and sell gas or refine and sell oil, yet only be classified under a single category. Moreover, energy companies often operate as large entities consisting of multiple sub-companies with different industry classifications. To ensure comprehensive coverage of energy consumption, we include all relevant categories associated with these activities. Note that coal usage is not covered in this study due to the absence of a distinct NACE code specifically related to coal distribution. Additionally, coal in Hungary is primarily used for electricity production, which is already addressed in the electricity mix of Hungary. Beyond that, coal consumption is limited to a small number of firms, mostly in the steel and pulp and paper industries [52].
Firm sample construction
We aggregate the monetary inputs from companies identified as providers of electricity, gas, and oil—based on the industry classifications detailed above—over the observation period from 2020 to 2023. This aggregation enables us to estimate the total amount of electricity, gas, and oil purchased by each firm annually, allowing us to track their energy consumption trends over time. To ensure data quality, we apply several restrictions to our sample. Since energy providers often supply both gas and electricity, we retain only firms that simultaneously purchase electricity and gas from companies classified under electricity and gas provider categories, based on their NACE 4-digit sector affiliation, for each year of the observation period. This ensures we account for firms with distinct electricity and gas purchases. Firms classified under any NACE 4-digit industry related to energy provision—whether electricity, gas, or oil—are excluded to focus on end-users of energy, rather than energy suppliers. Additionally, firms from the financial sector, classified under the NACE 1-digit category ”K - Financial and insurance activities” are excluded, as they may act as energy brokers without directly consuming energy themselves. Firms without a NACE classification in the dataset, and those lacking revenue data for any observed year, are also excluded. We further exclude an outlier firm whose gas consumption increased anomalously by three orders of magnitude from one year to the next. After applying these criteria, the final sample consists of 27,067 firms for which continuous time-series data on electricity, gas, oil consumption, and revenue are available. Although this filtering approach may exclude firms that exclusively use gas or electricity, it is necessary to maintain the consistency and reliability of the resulting firm sample. Since energy providers often supply both gas and electricity, and we cannot distinguish between these energy types in the monetary transactions within our dataset, the assumption of separate providers for electricity and gas ensures the robustness of the analysis. SI section S4 Firm sample description provides an analysis of the firm sample, focusing on the coverage of energy purchases within the Hungarian firm-level supply network. SI section S5 Comparison of firm sample to sectoral energy consumption data compares the sample characteristics to sectoral energy consumption data from Hungary’s energy balance [53].
Conversion of monetary inputs into energy consumption via energy prices
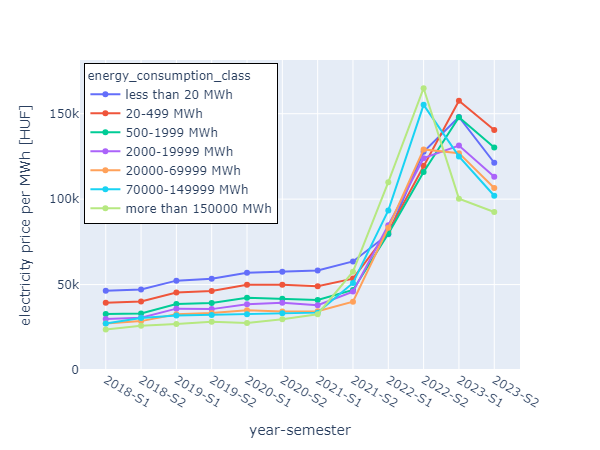
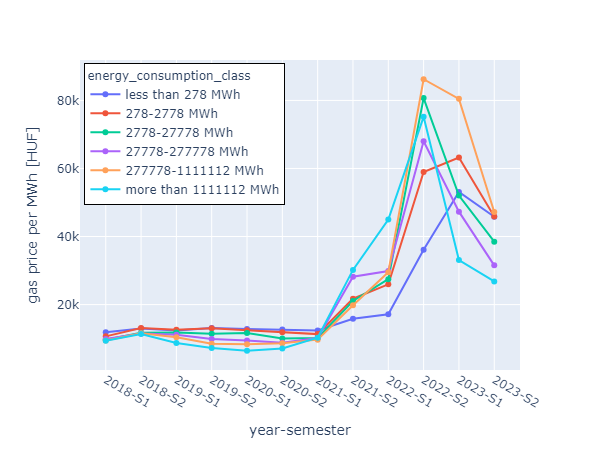
We use annual energy prices to convert the monetary inputs for electricity, gas, and oil into kilowatt-hours of energy consumed by each firm in the sample. For electricity and gas, we rely on energy price data for non-household users in Hungary from EUROSTAT, which includes all taxes and levies [49, 48]. This data is collected from electricity and gas providers who report the prices paid by their customers across different consumption bands (seven for electricity and six for gas). The data is updated semi-annually, allowing for the observation of price changes twice a year. To align this with our annual data on firm-level energy purchases, we calculate the average price for each year and each consumer class based on the semi-annual price data. We determine the appropriate consumption band for each firm by converting the energy consumption thresholds into monetary units using the respective energy prices. We then assign each firm to the corresponding band for each year based on its expenditures. Figures 1 and 2 in SI section S1 Electricity and gas price evolution show the price trends for electricity and gas. Over the observation period, electricity and gas prices have fluctuated significantly, particularly during the energy crisis of 2022, when prices surged. They subsequently decreased again in 2023. However, the averaging of semi-annual data to yearly values could distort the energy consumption estimations. It is also important to note that price evolution varies across different consumer groups: larger firms typically experienced earlier price increases and reductions, while smaller firms saw these changes later. This discrepancy may be attributed to larger firms hedging their energy costs through the energy futures market, while smaller firms often have fixed contracts with one or more energy providers.
Government support during the energy crisis. In 2022, the Hungarian government introduced a support scheme aimed at energy-intensive small- and medium-sized enterprises (SMEs), covering 50% of the increased electricity and gas costs. This scheme impacted an estimated 10,000 companies [54]. In 2023, the government also implemented a price cap on electricity, benefiting around 5,000 companies in sectors such as manufacturing, accommodation, and warehousing/transport [55]. These market interventions do not affect our energy consumption estimates, as the SME support scheme functioned as a reimbursement, and the electricity price cap applied directly to the energy bills of companies. Consequently, the prices reported by EUROSTAT still represent the actual prices paid by companies to their energy providers and, therefore, the corresponding kilowatt-hours consumed.
Estimating oil consumption based on fuel prices
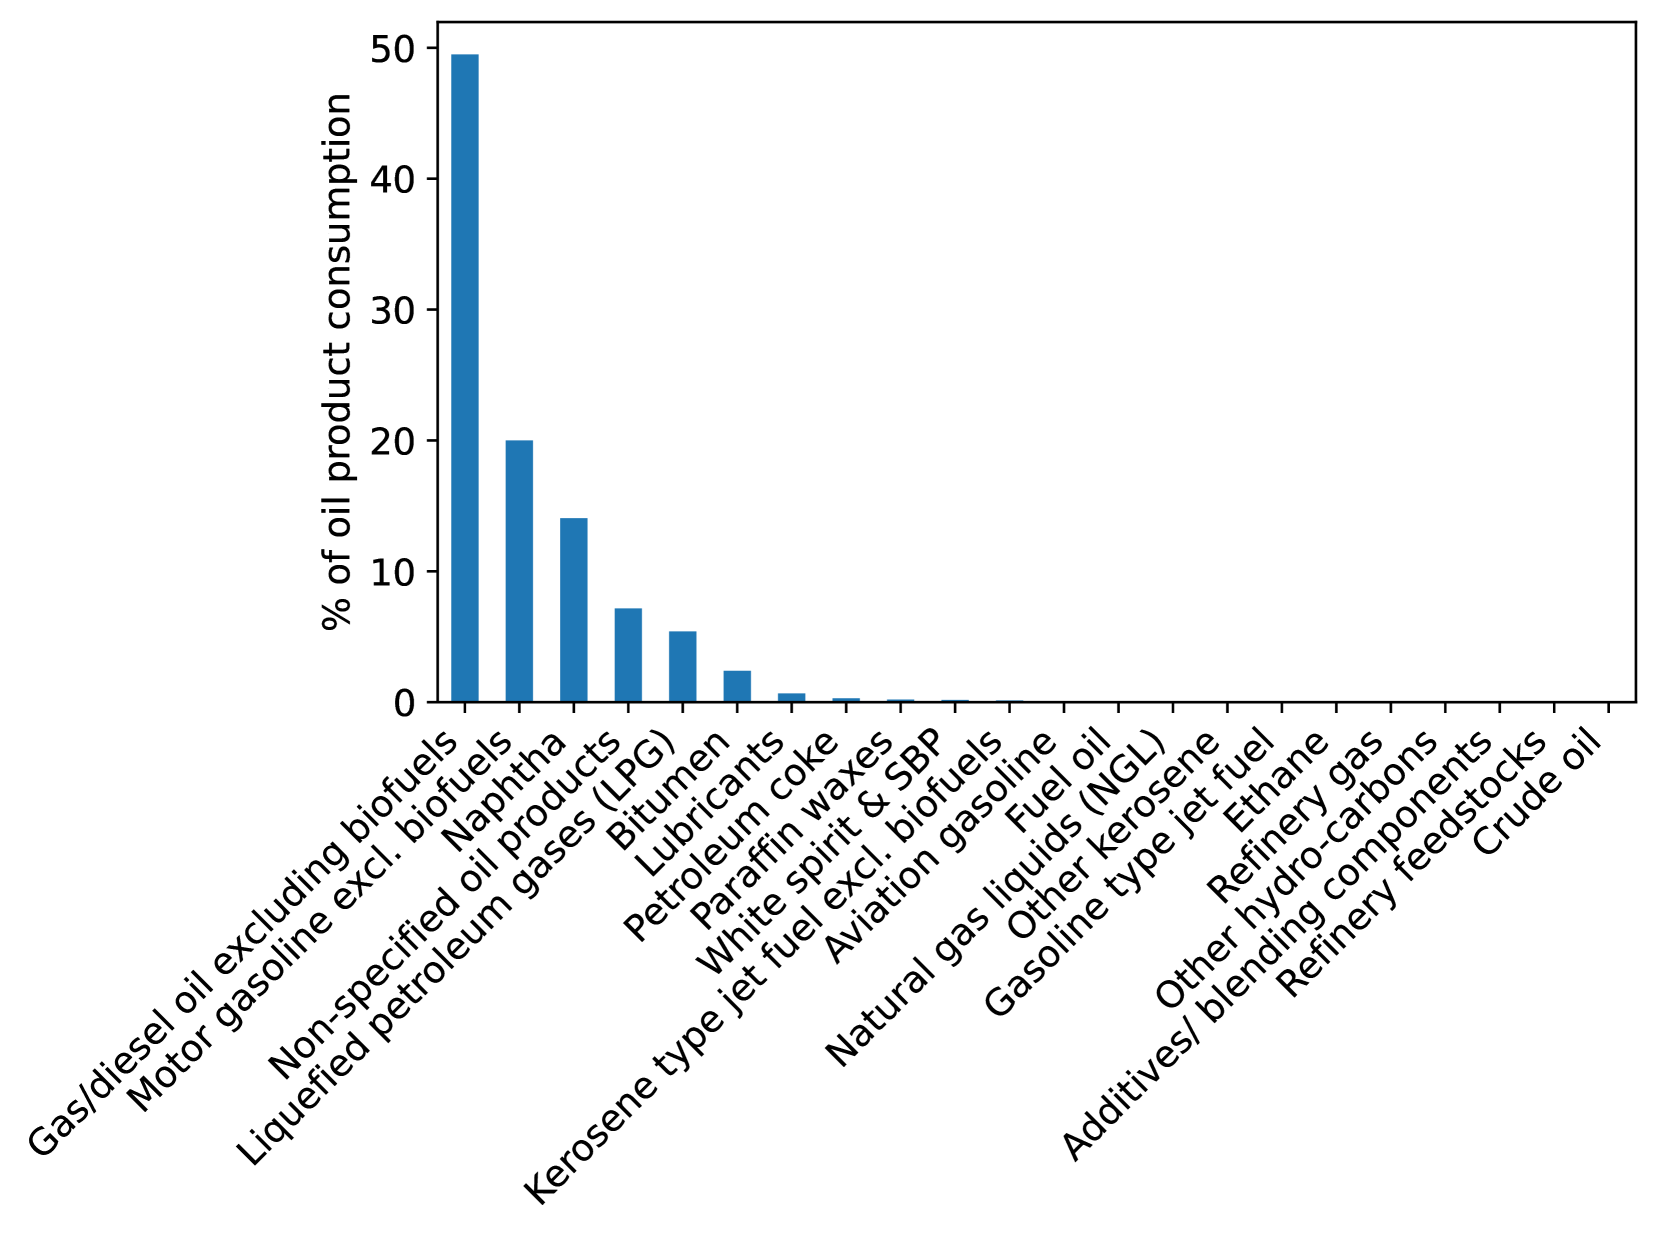
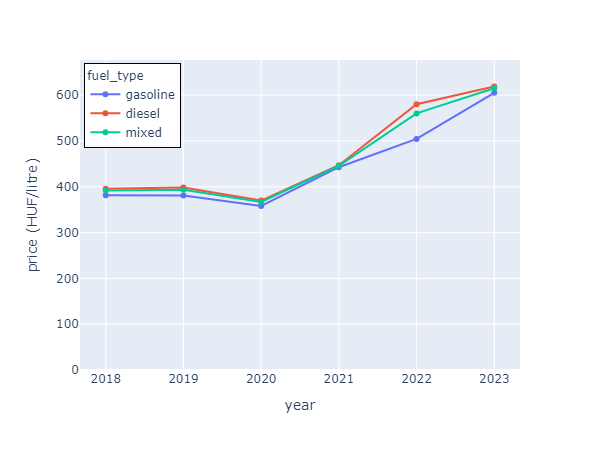
To estimate oil consumption, we assume that firms primarily use oil in the form of fuels and employ fuel price trends as a proxy to convert observed oil expenditures into energy units. Data from the National Detailed Energy Balance, provided by the Hungarian Energy and Public Utility Regulatory Authority (MEKH), confirms that diesel and gasoline are the dominant forms of oil product consumption [53]. Figure 3 in SI Section S2 Fuel price evolution in Hungary shows the distribution of oil product consumption for 2023, derived from final consumption data in the National Detailed Energy Balance. Diesel accounts for nearly half of oil product consumption in 2023, followed by gasoline at 20%. Naphtha represents 14% of total consumption; however, according to the National Detailed Energy Balance, the chemical and petrochemical industries are the sole consumers of naphtha. Therefore, the assumption that firms primarily consume oil in the form of fuels is reasonable for all industry sectors, except for the chemical industry, which also consumes oil in the form of naphtha. Since naphtha is generally cheaper than diesel or gasoline, our method may underestimate oil product consumption in the chemical sector. Fuel price data is obtained from historical trends in the Weekly Oil Bulletin provided by the EU [56]. To determine a single representative price for oil products, we calculate a weighted average of gasoline and diesel prices in Hungary, using weights based on the relative consumption of these fuels, also derived from the Weekly Oil Bulletin data. This approach implicitly assumes that firms consume these fuels in similar proportions. On average, diesel represents 74% of fuel consumption, while gasoline accounts for 26% during the observation period from 2020 to 2023. This weighted average price allows us to convert monetary expenditures on oil products into kilowatt-hours consumed. Figure 4 in SI Section S2 Fuel price evolution in Hungary depicts the evolution of fuel prices for gasoline, diesel, and their weighted average in Hungary from 2018 to 2023. Fuel prices have risen significantly since 2021, reflecting the broader energy crisis in Europe.
Calculating the low-carbon share
To determine the low-carbon electricity consumption for a firm in a given year, we use the low-carbon share of Hungary’s annual electricity mix, as provided by the online platform Ember [57]. Ember reports annual data on clean and fossil electricity generation in terawatt-hours, excluding imports and exports. We compute the low-carbon share of Hungary’s annual electricity mix, , by dividing the electricity generated from low-carbon sources (including hydro, PV, wind, bioenergy, and nuclear) by the total electricity produced. The low-carbon electricity consumption of a firm in a given year is calculated as
| (1) |
where represents the total electricity consumption of firm . The low-carbon share of a firm’s total energy consumption is then given by
| (2) |
where denotes the total energy consumption of firm in year . This approach allows us to estimate the low-carbon electricity share for each firm in our sample over the period from 2020 to 2023, enabling us to analyze trends and assess the pace at which firms are increasing the low-carbon share of their energy mix.
Measuring the speed of the energy transition at the firm level
To measure the pace of the energy transition for individual firms, we use two distinct models of technology adoption. The first approach assumes that the decarbonization process follows a gradual, steady trend, while the second approach models the transition as a potentially faster, more disruptive process.
Linear model. In the first model, we fit a linear function to the low-carbon energy share , for each firm over the observation period. This allows us to calculate the decarbonization trend , which represents the gradual pace of decarbonization. The linear equation is
| (3) |
where is the initial low-carbon share and is the slope of the trend. We calculate by minimizing the difference between the actual data and the predicted values, using the residual sum of squares (RSS)
| (4) |
The optimal values of and are obtained by solving
| (5) |
Exponential model. The second model fits an exponential function to , estimating the decarbonization rate , which reflects a potentially faster, exponential growth in the low-carbon energy share. The exponential equation is
| (6) |
where is the initial value, and is the rate of change over time. Again, we minimize the RSS to obtain the best estimate of :
| (7) |
The optimal values of and are obtained by solving
| (8) |
While logistic growth models are also commonly used in studies of technological adoption, we refrain from using them here. This is because logistic growth requires fitting a three-parameter model, and with only four time points (2020-2023), such a model would not be reliable or meaningful for this analysis. Instead, the linear and exponential models are better suited for illustrating two distinct patterns of technological change: steady, incremental transitions and more rapid, disruptive shifts.
Quantifying the relationship between energy costs and a firm’s transition status
We perform logistic regression analyses to examine the relationship between the energy cost structure of firms and their transition status within each NACE 1-digit industry sector. Specifically, we model the probability that a firm transitions to low-carbon electricity consumption based on the share of energy costs relative to the firm’s revenue. Firms are categorized as either transitioning or non-transitioning. Transitioning firms are defined as those with a positive decarbonization trend , and a positive exponential decarbonization rate , while non-transitioning firms have negative decarbonization trends , and negative exponential decarbonization rates . For each firm, we define three distinct energy cost shares: the total energy cost share , the fossil energy cost share , and the electricity cost share . The total energy cost share represents the proportion of a firm’s overall energy costs relative to its annual revenue. The fossil energy cost share reflects the proportion of energy costs derived from oil and gas, while the electricity cost share indicates the proportion of energy costs attributed to electricity consumption. We run separate logistic regressions for each of these cost share variables for firms within each NACE 1-digit industry sector, focusing on the latest year in the observation period . The logistic regression model is given by:
| (9) |
In this model, represents the probability that firm is transitioning to low-carbon energy consumption. The variable refers to one of the cost share variables for firm : , , or . The regression coefficient quantifies the effect of the energy cost share on the likelihood of transitioning, and is the intercept term (constant) in the model. The binary outcome variable is coded as 1 if the firm is transitioning, and 0 if the firm is not transitioning. To aid in interpretation, we also compute the adjusted odds ratio (AOR) for a 1 percentage point increase in each energy cost share. The AOR is obtained using the formula:
| (10) |
This represents the multiplicative change in the odds of transitioning associated with a 1 percentage point increase in the respective cost share. An AOR greater than 1 indicates that an increase in the energy cost share raises the odds of transitioning, while an AOR less than 1 suggests a decrease in the odds. For each regression, we collect the regression coefficient , standard error, p-value and the adjusted odds ratio (AOR) for a 1 percentage point increase to quantify the relationship between energy cost share and the firm’s transition status. Statistical significance of the coefficients is determined using conventional thresholds. Significance levels are indicated by stars in the output: ’***’ for -value , ’**’ for -value , ’*’ for -value , ’.’ for -value , and no stars for -value 0.1. A positive regression coefficient (or an AOR greater than 1) indicates that an increase in the energy cost share is associated with a higher probability of transitioning, while a negative coefficient (or an AOR less than 1) suggests the opposite. We analyze the regression results within each NACE 1-digit industry sector to identify sector-specific relationships, as shown in Table 1.
Constructing energy transition scenarios
Decarbonization of Hungary’s electricity mix
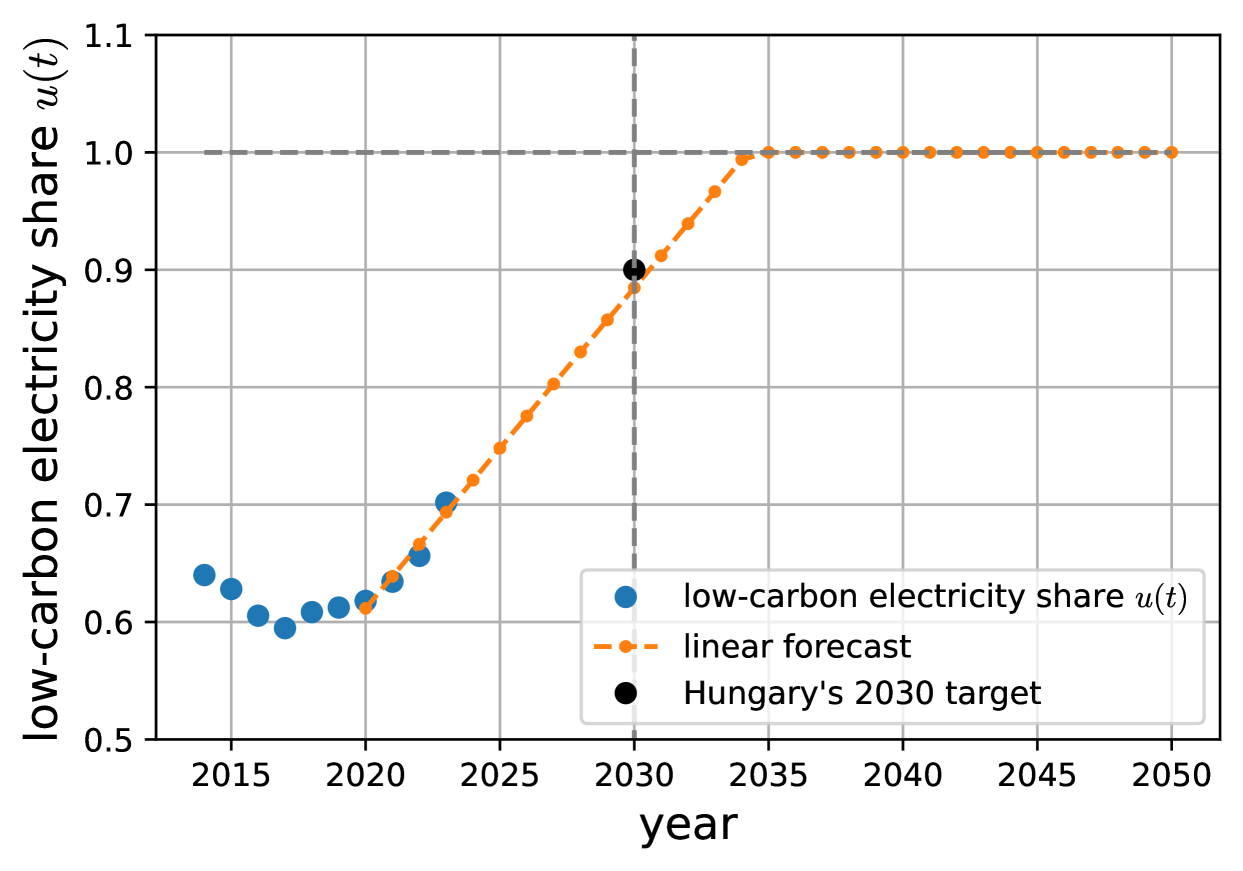
To create scenarios for future low-carbon electricity consumption, we need to make a forecast of the evolution of Hungary’s low-carbon electricity share . This share influences the low-carbon share for each firm , as it reflects the overall decarbonization progress of the country’s electricity grid. Between 2020 and 2023, Hungary’s low-carbon electricity share grew significantly, from about 60% in 2020 to over 70% in 2023. This increase was mainly due to the expansion of photovoltaic (PV) installations. To forecast for 2024 to 2050, we use a linear regression based on the observed trend from 2020 to 2023. The resulting forecast , is consistent with Hungary’s target of achieving 90% low-carbon electricity by 2030. This would require an annual increase of 2.7% in the share of low-carbon electricity. Under this forecast, Hungary’s electricity grid will be fully decarbonized by 2035, and remain so thereafter. Figure 5 and Tab. 1 in the SI Section S3 Electricity mix of Hungary and forecast until 2050 provide further details on the observed values of and the forecasted path for .
Forecasting future low-carbon shares
To forecast the future low-carbon share for each firm , we first need to make an assumption regarding future total energy consumption . We assume that each firm’s energy consumption will remain at the average level observed between 2020 and 2023 .
This assumption is conservative because many electricity-powered appliances and processes are more efficient than their fuel-based counterparts [3]. However, the potential overestimation of energy use is counterbalanced by the possibility of firm growth and capital expansion, which may increase energy consumption.
It is important to note that the observed decarbonization trends and decarbonization rates of firms cannot be directly used to forecast their future low-carbon shares because already reflects the change of Hungary’s low-carbon electricity share . Therefore, we perform separate regressions to estimate a linear electrification trend , and an exponential electrification rate for each firm, analogous to the regressions in equations 5 and 8. These regressions are based on the share of electricity in firms’ energy mixes, excluding Hungary’s low-carbon share
Depending on the scenario—whether a linear or exponential adoption is assumed—the forecasted low-carbon shares for each firm in the years 2024 to 2050 are calculated using one of the following equations
| (11) |
or
| (12) |
In both equations and represent the initial values for each firm’s electrification trend or rate. The forecasted fossil share is then calculated as
| (13) |
Modeling the business-as-usual (low ambition) scenario
In the business-as-usual scenario, firms continue their current electrification trends , while Hungary’s electricity mix gradually decarbonizes. The forecasted low-carbon share for each firm in year is calculated according to equation 11. To project the total low-carbon and fossil energy shares consumed by all firms from 2024 to 2050, we first compute the low-carbon and fossil energy consumption for each firm in each year
| (14) |
| (15) |
where represents the firm’s total energy consumption, assumed constant over time. The total low-carbon share of energy consumption across all firms is then given by
| (16) |
where is the number of firms. Finally, the total fossil energy share is determined as .
Modeling the business-as-usual (high ambition) scenario
In the business-as-usual (high ambition) scenario, firms continue to follow their current electrification rates , while Hungary’s electricity mix gradually decarbonizes. The forecasted low-carbon share for each firm in year is computed using equation 12. The total low-carbon and fossil shares of energy consumption across all firms are then determined using the same methodology as detailed above.
Constructing the transition scenario
In the transition scenario, all firms are required to decarbonize by adopting a positive electrification trend . If a firm does not exhibit a positive electrification trend, it is assigned a trend based on a matched firm with similar characteristics. The matching process follows these steps:
-
1.
Identify all firms within the same NACE 4-digit sector as firm .
-
2.
Select a firm from this group that most closely matches firm in terms of revenue (from 2023) and number of employees (from 2022) using a Nearest Neighbor search. Since 2022 is the latest year with complete employment data, it is used for this comparison.
-
3.
If no suitable match is found at the NACE 4-digit level (i.e., no firm in the same sector has a positive decarbonization trend), the search expands to the NACE 2-digit sector, following the same matching procedure.
Through this procedure, each firm is assigned a positive decarbonization trend . The forecasted low-carbon share for each firm in year is then computed using equation 11. The total low-carbon and fossil shares are calculated as previously described.
Constructing the best-case transition scenario
In the best-case transition scenario, all firms are required to decarbonize rapidly by adopting a positive electrification rate . For any firm that does not follow a positive electrification rate, it is paired with a firm exhibiting the most similar characteristics. The pairing process follows the same procedure outlined earlier. As a result, every firm is assigned a positive decarbonization rate . The forecasted low-carbon share for each firm in year is then calculated according to equation 12, and the total low-carbon and fossil shares are computed in the same manner as described above.
References
- Rogelj et al. [2018] J. Rogelj, D. Shindell, K. Jiang, S. Fifita, P. Forster, V. Ginzburg, C. Handa, H. Kheshgi, S. Kobayashi, E. Kriegler, L. Mundaca, R. Séférian, and M. V. Vilariño, Mitigation Pathways Compatible with 1.5°C in the Context of Sustainable Development, in Global Warming of 1.5°C. An IPCC Special Report on the Impacts of Global Warming of 1.5°C Above Pre-industrial Levels and Related Global Greenhouse Gas Emission Pathways, in the Context of Strengthening the Global Response to the Threat of Climate Change, Sustainable Development, and Efforts to Eradicate Poverty, edited by V. Masson-Delmotte, P. Zhai, H.-O. Pörtner, D. Roberts, J. Skea, P. Shukla, A. Pirani, W. Moufouma-Okia, C. Péan, R. Pidcock, S. Connors, J. B. Matthews, Y. Chen, X. Zhou, M. Gomis, E. Lonnoy, T. Maycock, M. Tignor, and T. Waterfield (2018).
- Mercure et al. [2021] J.-F. Mercure, P. Salas, P. Vercoulen, G. Semieniuk, A. Lam, H. Pollitt, P. B. Holden, N. Vakilifard, U. Chewpreecha, N. R. Edwards, and J. E. Vinuales, Reframing incentives for climate policy action, Nature Energy 6, 1133 (2021).
- Pathak et al. [2022] M. Pathak, R. Slade, P. Shukla, J. Skea, R. Pichs-Madruga, and D. Ürge-Vorsatz, Technical summary, in Climate Change 2022: Mitigation of Climate Change. Contribution of Working Group III to the Sixth Assessment Report of the Intergovernmental Panel on Climate Change, edited by P. Shukla, J. Skea, R. Slade, A. A. Khourdajie, R. van Diemen, D. McCollum, M. Pathak, S. Some, P. Vyas, R. Fradera, M. Belkacemi, A. Hasija, G. Lisboa, S. Luz, and J. Malley (Cambridge University Press, Cambridge, UK and New York, NY, USA, 2022).
- Bataille et al. [2018] C. Bataille, M. Åhman, K. Neuhoff, L. J. Nilsson, M. Fischedick, S. Lechtenböhmer, B. Solano-Rodriquez, A. Denis-Ryan, S. Stiebert, H. Waisman, O. Sartor, and S. Rahbar, A review of technology and policy deep decarbonization pathway options for making energy-intensive industry production consistent with the Paris Agreement, Journal of Cleaner Production 187, 960 (2018).
- Davis et al. [2018] S. J. Davis, N. S. Lewis, M. Shaner, S. Aggarwal, D. Arent, I. L. Azevedo, S. M. Benson, T. Bradley, J. Brouwer, Y.-M. Chiang, C. T. M. Clack, A. Cohen, S. Doig, J. Edmonds, P. Fennell, C. B. Field, B. Hannegan, B.-M. Hodge, M. I. Hoffert, E. Ingersoll, P. Jaramillo, K. S. Lackner, K. J. Mach, M. Mastrandrea, J. Ogden, P. F. Peterson, D. L. Sanchez, D. Sperling, J. Stagner, J. E. Trancik, C.-J. Yang, and K. Caldeira, Net-zero emissions energy systems, Science 360, eaas9793 (2018).
- Rissman et al. [2020] J. Rissman, C. Bataille, E. Masanet, N. Aden, W. R. Morrow, N. Zhou, N. Elliott, R. Dell, N. Heeren, B. Huckestein, J. Cresko, S. A. Miller, J. Roy, P. Fennell, B. Cremmins, T. Koch Blank, D. Hone, E. D. Williams, S. De La Rue Du Can, B. Sisson, M. Williams, J. Katzenberger, D. Burtraw, G. Sethi, H. Ping, D. Danielson, H. Lu, T. Lorber, J. Dinkel, and J. Helseth, Technologies and policies to decarbonize global industry: Review and assessment of mitigation drivers through 2070, Applied Energy 266, 114848 (2020).
- Gailani et al. [2024] A. Gailani, S. Cooper, S. Allen, A. Pimm, P. Taylor, and R. Gross, Assessing the potential of decarbonization options for industrial sectors, Joule 8, 576 (2024).
- Gerres et al. [2019] T. Gerres, J. P. Chaves Ávila, P. L. Llamas, and T. G. San Román, A review of cross-sector decarbonisation potentials in the European energy intensive industry, Journal of Cleaner Production 210, 585 (2019).
- International Energy Agency (2024) [IEA] International Energy Agency (IEA), World Energy Outlook 2024, Tech. Rep. (IEA, Paris, 2024).
- International Renewable Energy Agency (2024) [IRENA] International Renewable Energy Agency (IRENA), World Energy Transitions Outlook 2024: 1.5°C Pathway (International Renewable Energy Agency, Abu Dhabi, 2024).
- Pfenninger et al. [2014] S. Pfenninger, A. Hawkes, and J. Keirstead, Energy systems modeling for twenty-first century energy challenges, Renewable and Sustainable Energy Reviews 33, 74 (2014).
- Riahi et al. [2017] K. Riahi, D. P. Van Vuuren, E. Kriegler, J. Edmonds, B. C. O’Neill, S. Fujimori, N. Bauer, K. Calvin, R. Dellink, O. Fricko, W. Lutz, A. Popp, J. C. Cuaresma, S. Kc, M. Leimbach, L. Jiang, T. Kram, S. Rao, J. Emmerling, K. Ebi, T. Hasegawa, P. Havlik, F. Humpenöder, L. A. Da Silva, S. Smith, E. Stehfest, V. Bosetti, J. Eom, D. Gernaat, T. Masui, J. Rogelj, J. Strefler, L. Drouet, V. Krey, G. Luderer, M. Harmsen, K. Takahashi, L. Baumstark, J. C. Doelman, M. Kainuma, Z. Klimont, G. Marangoni, H. Lotze-Campen, M. Obersteiner, A. Tabeau, and M. Tavoni, The Shared Socioeconomic Pathways and their energy, land use, and greenhouse gas emissions implications: An overview, Global Environmental Change 42, 153 (2017).
- Capros et al. [2019] P. Capros, G. Zazias, S. Evangelopoulou, M. Kannavou, T. Fotiou, P. Siskos, A. De Vita, and K. Sakellaris, Energy-system modelling of the EU strategy towards climate-neutrality, Energy Policy 134, 110960 (2019).
- Breyer et al. [2022] C. Breyer, S. Khalili, D. Bogdanov, M. Ram, A. S. Oyewo, A. Aghahosseini, A. Gulagi, A. A. Solomon, D. Keiner, G. Lopez, P. A. Ostergaard, H. Lund, B. V. Mathiesen, M. Z. Jacobson, M. Victoria, S. Teske, T. Pregger, V. Fthenakis, M. Raugei, H. Holttinen, U. Bardi, A. Hoekstra, and B. K. Sovacool, On the History and Future of 100% Renewable Energy Systems Research, IEEE Access 10, 78176 (2022).
- Luderer et al. [2021] G. Luderer, S. Madeddu, L. Merfort, F. Ueckerdt, M. Pehl, R. Pietzcker, M. Rottoli, F. Schreyer, N. Bauer, L. Baumstark, C. Bertram, A. Dirnaichner, F. Humpenöder, A. Levesque, A. Popp, R. Rodrigues, J. Strefler, and E. Kriegler, Impact of declining renewable energy costs on electrification in low-emission scenarios, Nature Energy 7, 32 (2021).
- Way et al. [2022] R. Way, M. C. Ives, P. Mealy, and J. D. Farmer, Empirically grounded technology forecasts and the energy transition, Joule 6, 2057 (2022).
- International Energy Agency [2024] International Energy Agency, Electricity Market Report 2024: Analysis and Forecast to 2026, Tech. Rep. (International Energy Agency, 2024).
- Williams et al. [2012] J. H. Williams, A. DeBenedictis, R. Ghanadan, A. Mahone, J. Moore, W. R. Morrow, S. Price, and M. S. Torn, The Technology Path to Deep Greenhouse Gas Emissions Cuts by 2050: The Pivotal Role of Electricity, Science 335, 53 (2012).
- Lechtenböhmer et al. [2016] S. Lechtenböhmer, L. J. Nilsson, M. Åhman, and C. Schneider, Decarbonising the energy intensive basic materials industry through electrification – Implications for future EU electricity demand, Energy 115, 1623 (2016).
- Madeddu et al. [2020] S. Madeddu, F. Ueckerdt, M. Pehl, J. Peterseim, M. Lord, K. A. Kumar, C. Krüger, and G. Luderer, The CO reduction potential for the European industry via direct electrification of heat supply (power-to-heat), Environmental Research Letters 15, 124004 (2020).
- World Economic Forum [2024] World Economic Forum, Net-Zero Industry Tracker 2024 (World Economic Forum, 2024).
- Clementi and Garofalo [2023] E. L. Clementi and G. Garofalo, Determinants of Renewable Energy Adoption: Evidence from Italian Firms:, Journal of Innovation Economics & Management 42, 201 (2023).
- Bühler et al. [2019] F. Bühler, B. Zühlsdorf, T.-V. Nguyen, and B. Elmegaard, A comparative assessment of electrification strategies for industrial sites: Case of milk powder production, Applied Energy 250, 1383 (2019).
- Lopez et al. [2023] G. Lopez, T. Galimova, M. Fasihi, D. Bogdanov, and C. Breyer, Towards defossilised steel: Supply chain options for a green European steel industry, Energy 273, 127236 (2023).
- ISI [2024] F. ISI, Direct electrification of industrial process heat. An assessment of technologies, potentials and future prospects for the EU. Study on behalf of Agora Industry. (2024).
- Stenqvist and Nilsson [2012] C. Stenqvist and L. J. Nilsson, Energy efficiency in energy-intensive industries—an evaluation of the Swedish voluntary agreement PFE, Energy Efficiency 5, 225 (2012).
- Wiertzema et al. [2020] H. Wiertzema, E. Svensson, and S. Harvey, Bottom–Up Assessment Framework for Electrification Options in Energy-Intensive Process Industries, Frontiers in Energy Research 8, 192 (2020).
- Dragomir et al. [2023] V. D. Dragomir, M. Dumitru, A. Duţescu, and M. F. Perevoznic, Empirical Assessment of Carbon Reduction and Energy Transition Targets of European Companies, Proceedings of the International Conference on Business Excellence 17, 718 (2023).
- Lenzen et al. [2012] M. Lenzen, K. Kanemoto, D. Moran, and A. Geschke, Mapping the Structure of the World Economy, Environmental Science & Technology 46, 8374 (2012).
- Wood et al. [2014] R. Wood, K. Stadler, T. Bulavskaya, S. Lutter, S. Giljum, A. De Koning, J. Kuenen, H. Schütz, J. Acosta-Fernández, A. Usubiaga, M. Simas, O. Ivanova, J. Weinzettel, J. Schmidt, S. Merciai, and A. Tukker, Global Sustainability Accounting—Developing EXIOBASE for Multi-Regional Footprint Analysis, Sustainability 7, 138 (2014).
- Acemoglu et al. [2023] D. Acemoglu, G. Anderson, D. Beede, C. Buffington, E. Childress, E. Dinlersoz, L. Foster, N. Goldschlag, J. Haltiwanger, Z. Kroff, P. Restrepo, and N. Zolas, Advanced Technology Adoption: Selection or Causal Effects?, AEA Papers and Proceedings 113, 210 (2023).
- Acemoglu et al. [2024] D. Acemoglu, G. W. Anderson, D. N. Beede, C. Buffington, E. E. Childress, E. Dinlersoz, L. S. Foster, N. Goldschlag, J. C. Haltiwanger, Z. Kroff, P. Restrepo, and N. Zolas, Automation and the Workforce: A Firm-Level View from the 2019 Annual Business Survey, in Technology, Productivity, and Economic Growth (University of Chicago Press, 2024).
- Diem et al. [2024] C. Diem, A. Borsos, T. Reisch, J. Kertész, and S. Thurner, Estimating the loss of economic predictability from aggregating firm-level production networks, PNAS Nexus 3, pgae064 (2024).
- Tabachová et al. [2025] Z. Tabachová, C. Diem, J. Stangl, A. Borsos, and S. Thurner, Climate stress testing supply networks and banking systems using nation wide firm-level CO2 emission estimates, Forthcoming (2025).
- Stangl et al. [2024] J. Stangl, A. Borsos, C. Diem, T. Reisch, and S. Thurner, Firm-level supply chains to minimize unemployment and economic losses in rapid decarbonization scenarios, Nature Sustainability 7, 581 (2024).
- Boyd and Pang [2000] G. A. Boyd and J. X. Pang, Estimating the linkage between energy efficiency and productivity, Energy Policy 28, 289 (2000).
- Jung and Lee [2014] Y. Jung and S.-H. Lee, Electrification and productivity growth in Korean manufacturing plants, Energy Economics 45, 333 (2014).
- Pichler et al. [2023] A. Pichler, C. Diem, A. Brintrup, F. Lafond, G. Magerman, G. Buiten, T. Y. Choi, V. M. Carvalho, J. D. Farmer, and S. Thurner, Building an alliance to map global supply networks, Science 382, 270 (2023).
- Borsos and Stancsics [2020] A. Borsos and M. Stancsics, Unfolding the hidden structure of the Hungarian multi-layer firm network, MNB Occasional Papers 139, Magyar Nemzeti Bank, Budapest, 2020, https://hdl.handle.net/10419/241068.
- Diem et al. [2022] C. Diem, A. Borsos, T. Reisch, J. Kertész, and S. Thurner, Quantifying firm-level economic systemic risk from nation-wide supply networks, Scientific Reports 12, 7719 (2022).
- Tabachová et al. [2024] Z. Tabachová, C. Diem, A. Borsos, C. Burger, and S. Thurner, Estimating the impact of supply chain network contagion on financial stability, Journal of Financial Stability 75, 101336 (2024).
- Reisch et al. [2025] T. Reisch, A. Borsos, and S. Thurner, Supply chain rewiring dynamics of the economy at the firm-level, Forthcoming (2025).
- Bacilieri et al. [2023] A. Bacilieri, A. Borsos, P. Astudillo-Estevez, and F. Lafond, Firm-Level Production Networks What Do We Really Know, Working Paper 2023-08 (INET Oxford, 2023).
- Statistik Austria [2008] Statistik Austria, Systematik der Wirtschaftstätigkeiten ÖNACE 2008 (2008), https://www.statistik.at/fileadmin/publications/Systematik_der_Wirtschaftstaetigkeiten__OENACE_2008.pdf Accessed January 28, 2025.
- Ministry for Innovation and Technology [2020] Ministry for Innovation and Technology, National Clean Development Strategy (2020), https://unfccc.int/sites/default/files/resource/LTS_1_Hungary_2021_EN.pdf Accessed December 18, 2024.
- Geels [2002] F. W. Geels, Technological transitions as evolutionary reconfiguration processes: a multi-level perspective and a case-study, Research Policy 31, 1257 (2002).
- Trianni et al. [2014] A. Trianni, E. Cagno, and A. De Donatis, A framework to characterize energy efficiency measures, Applied Energy 118, 207 (2014).
- Eurostat [2024a] Eurostat, Electricity prices for non-household consumers - bi-annual data (from 2007 onwards) (2024a), last updated: October 27, 2024. https://ec.europa.eu/eurostat/databrowser/view/nrg_pc_205__custom_9257772/default/table?lang=en Accessed December 19, 2024.
- Eurostat [2024b] Eurostat, Gas prices for non-household consumers - bi-annual data (from 2007 onwards) (2024b), last updated: April 11, 2024. https://ec.europa.eu/eurostat/databrowser/view/nrg_pc_203__custom_12406662/default/table?lang=en Accessed December 19, 2024.
- Enerdata [2023] Enerdata, Hungary’s solar capacity surged to 5.6 gw in 2023 (2023), https://www.enerdata.net/publications/daily-energy-news/hungarys-solar-capacity-surged-16-gw-2023-56-gw.html Accessed January 28, 2025.
- Europe [2023] S. Europe, Solar power in europe: Commercial and industrial sector growth (2023), https://www.solarpowereurope.org/insights/interactive-data/total-eu-27-solar-pv-capacity-a-growth-story Accessed January 28, 2025.
- IEA [2022] IEA, Hungary 2022 (2022), https://www.iea.org/reports/hungary-2022 Licence: CC BY 4.0.
- Hungarian Energy and Public Utility Regulatory Authority [2025] Hungarian Energy and Public Utility Regulatory Authority, National detailed energy balance - iea format - (annual) 2014-2023 (2025), https://mekh.hu/download/3/c1/91000/7_3_orszagos_eves_IEA_tipusu_reszletes_energiamerleg_2014_2023.xlsx Accessed January 28, 2025.
- About Hungary [2023] About Hungary, Government announces support scheme for energy-intensive smes (2023), https://abouthungary.hu/news-in-brief/government-announces-support-scheme-for-energy-intensive-smes Accessed January 28, 2025.
- Reuters [2023] Reuters, Hungarian government to cap prices for companies’ power contracts (2023), https://www.reuters.com/business/energy/hungarian-government-cap-prices-set-companies-power-contracts-2023-06-19/ Accessed January 28, 2025.
- European Commission [2024] European Commission, Weekly oil bulletin price developments 2005 onwards (2024), https://energy.ec.europa.eu/document/download/906e60ca-8b6a-44e7-8589-652854d2fd3f_en?filename=Weekly_Oil_Bulletin_Prices_History_maticni_4web.xlsx Accessed January 27, 2024.
- Ember [2023] Ember, Electricity Data Explorer (2023), https://ember-energy.org/data/electricity-data-explorer/ Accessed December 19, 2024.
Supplementary Information
S1 Electricity and gas price evolution in Hungary
Electricity and gas prices for non-household consumers are sourced from EUROSTAT [48][49]. These data, based on the reports of energy providers, reflect price trends across various energy consumption classes. Electricity prices are categorized into seven ranges, while gas prices are divided into six. The prices, provided in Hungarian Forint (HUF), are reported semi-annually. Figures 5 and 6 depict the evolution of the electricity and the gas price for non-household consumers in Hungary. To derive annual energy prices for electricity and gas in each consumption class, we calculate the average of the semi-annual data. An annual energy price is necessary because we observe annual energy expenditures in the Hungarian supply chain network. This aggregation may lead to under- or overestimation for 2021 and 2022, years marked by significant energy price fluctuations that varied across consumption classes. As a result, real prices for individual firms may differ slightly from our estimates. However, since the price data is stratified by consumption class, it captures trends, especially the fluctuations during Europe’s energy crisis which allows us to arrive at a approximation of the actual energy prices.
S2 Fuel price evolution in Hungary
We assume that firms primarily consume oil in the form of fuels, using fuel price trends as a proxy to convert observed oil expenditures into energy units. Data from the National Detailed Energy Balance, provided by the Hungarian Energy and Public Utility Regulatory Authority, confirms that diesel and gasoline are by far the most significant forms of oil product consumption [53]. Figure 7 illustrates the distribution of oil product consumption for 2023, derived from the National Detailed Energy Balance data. Diesel accounts for nearly half of oil product consumption, followed by gasoline at 20%. Naphtha represents 14% of consumption; however, according to the National Detailed Energy Balance, the chemical and petrochemical industries are the sole consumers of naphtha.
Data on fuel prices is obtained from the historical price trends in the Weekly Oil Bulletin provided by the EU [56]. To determine a unique price for oil products, we calculate a weighted average of gasoline and diesel prices in Hungary. The weights are based on the relative consumption of gasoline and diesel in Hungary, also derived from the Weekly Oil Bulletin data, implicitly assuming that firms consume these fuels in similar proportions. In general, diesel represents about 74% of fuel consumption, whereas gasoline represents about 26% during the observation period from 2020 to 2023. We arrive at a unique price for fuel consumption in Hungary that allows us to convert monetary inputs for oil products into kilowatt-hours consumed. Figure 8 depicts the evolution of fuel prices for gasoline, diesel, and their weighted average in Hungary from 2018 to 2023. Fuel prices have increased significantly since 2021, reflecting the broader energy crisis in Europe.
S3 Electricity mix of Hungary and forecast until 2050
We use data from the online platform Ember, which provides annual data on clean and fossil electricity generation in terawatt-hours, to calculate the low-carbon share of Hungary’s annual electricity mix [57]. To estimate the future low-carbon share, we perform a linear regression based on the 2020-2023 observation period, during which the low-carbon share increased by 10%. This scenario, which would enable Hungary to reach its self-proclaimed target of 90% low-carbon electricity generation by 2030, requires an annual increase of by 2.7%. In this scenario, Hungary’s electricity grid would be essentially decarbonized by the year 2035. Table LABEL:SI-Tab.:low-carbon_share_Hungary and Fig.10 provide an overview of the evolution and the forecast of the low-carbon share based on the electricity generation data.
| year |
|
type | ||
| 2014 | 0.64 | observed | ||
| 2015 | 0.63 | observed | ||
| 2016 | 0.61 | observed | ||
| 2017 | 0.59 | observed | ||
| 2018 | 0.61 | observed | ||
| 2019 | 0.61 | observed | ||
| 2020 | 0.62 | observed | ||
| 2021 | 0.63 | observed | ||
| 2022 | 0.66 | observed | ||
| 2023 | 0.70 | observed | ||
| 2024 | 0.72 | forecast | ||
| 2025 | 0.75 | forecast | ||
| 2026 | 0.78 | forecast | ||
| 2027 | 0.80 | forecast | ||
| 2028 | 0.83 | forecast | ||
| 2029 | 0.86 | forecast | ||
| 2030 | 0.88 | forecast | ||
| 2031 | 0.91 | forecast | ||
| 2032 | 0.94 | forecast | ||
| 2033 | 0.97 | forecast | ||
| 2034 | 0.99 | forecast | ||
| 2035 | 1.00 | forecast | ||
| 2040 | 1.00 | forecast | ||
| 2050 | 1.00 | forecast |
S4 Firm sample description
We compare our constructed firm sample of 27,067 firms with the total firm dataset, which we treat as the ’ground truth,’ to evaluate how well the sample represents the overall firm population in terms of energy inputs and revenue. Specifically, we compare the aggregated monetary inputs for gas, electricity, and oil, as well as the total revenue of firms in our sample, with the corresponding aggregated values in the total dataset. To ensure a fair comparison, we exclude energy-providing sectors, firms from the financial sector, and firms with no NACE category from the ’ground truth’ dataset. However, we do not apply the time series consistency restrictions outlined in the Methods section on Firm Sample Construction. As a result, we exclude firms in the following NACE 4-digit categories from the ’ground truth’: ’D35.1 - Electric power generation, transmission, and distribution,’ ’D35.1.1 - Production of electricity,’ ’D35.1.2 - Transmission of electricity,’ ’D35.1.3 - Distribution of electricity,’ ’D35.1.4 - Trade of electricity,’ ’D35.2.1 - Manufacture of gas,’ ’D35.2.2 - Distribution of gaseous fuels through mains,’ ’D35.2.3 - Trade of gas through mains,’ ’B6.1.0 - Extraction of crude petroleum,’ ’C19.2.0 - Manufacture of refined petroleum products,’ ’G47.3.0 - Retail sale of automotive fuel in specialized stores,’ ’G46.7.1 - Wholesale of solid, liquid, and gaseous fuels and related products,’ and ’K - Financial and insurance activities.’
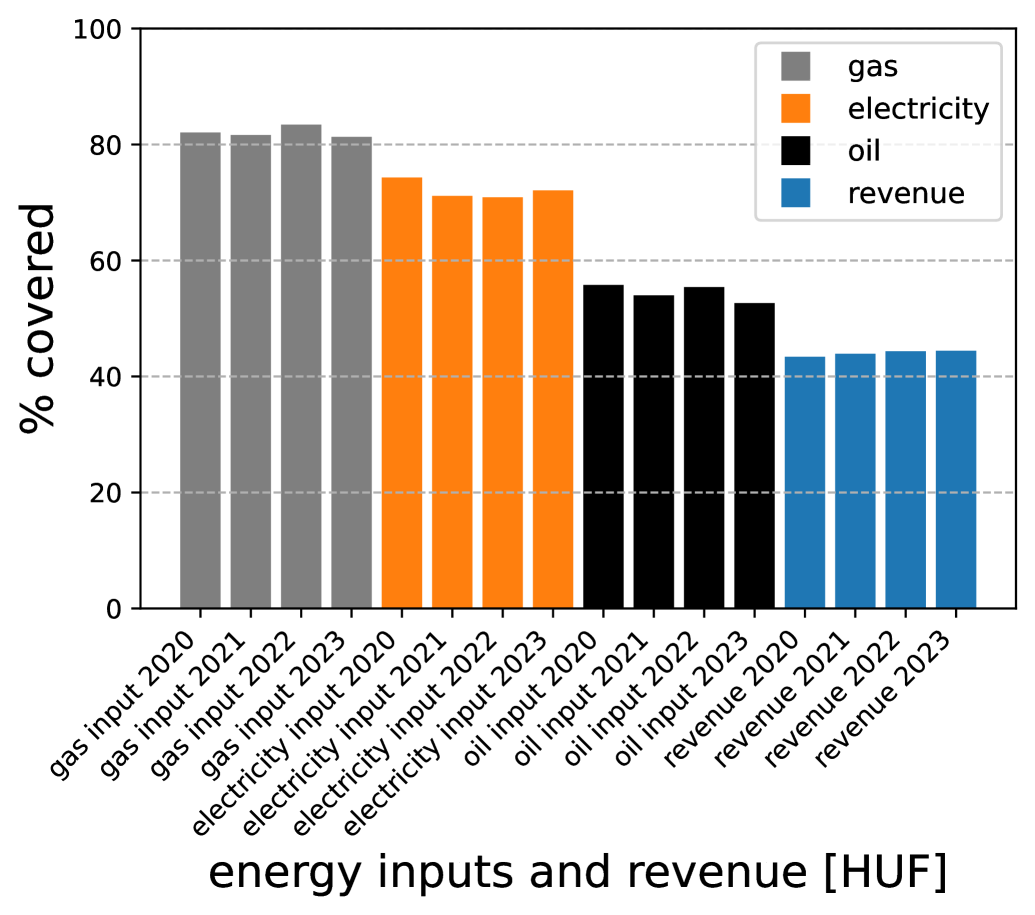
This results in a ’ground truth’ dataset of 539,565 firms, all of which either have energy inputs in any of the specified categories or report positive revenue in at least one of the years between 2020 and 2023. Figure LABEL:SI-Tab.:coverage_energy_inputs_revenue illustrates the coverage, and Table LABEL:SI-Tab.:coverage_energy_inputs_revenue provides further details. We achieve very good coverage for gas and electricity, with over 80% coverage for gas inputs and over 70% for electricity inputs across all years. We also have good coverage for oil and revenue, with over 50% coverage for oil inputs and around 44% for total revenue across the years 2020 to 2023. This means that our constructed firm sample captures a significant share of energy inputs and revenue from the total firm dataset, indicating that the sample consists of large and thus relevant firms.
| variable [HUF] | % covered |
| gas input 2020 | 82.07 |
| gas input 2021 | 81.65 |
| gas input 2022 | 83.43 |
| gas input 2023 | 81.31 |
| electricity input 2020 | 74.30 |
| electricity input 2021 | 71.13 |
| electricity input 2022 | 70.90 |
| electricity input 2023 | 72.08 |
| oil input 2020 | 55.79 |
| oil input 2021 | 53.99 |
| oil input 2022 | 55.42 |
| oil input 2023 | 52.65 |
| revenue 2020 | 43.41 |
| revenue 2021 | 43.93 |
| revenue 2022 | 44.35 |
| revenue 2023 | 44.44 |
To provide a more detailed description of our sample, we present the aggregated energy purchases (gas, oil, and electricity) of all firms in the sample from 2020 to 2023, along with their conversion into energy units (terawatt-hours, TWh) using energy prices, as shown in Fig.11. As illustrated in Fig.11A, energy purchases increased significantly in 2022 and 2023, coinciding with peak prices for gas, oil, and electricity. However, when these purchases are converted into energy units using energy prices, it becomes clear that total energy consumption across the different energy types remained relatively stable for the firms in the sample. Notably, electricity consumption appears to have declined since 2022. This could be due to one of two factors: either firms actually reduced their electricity usage in response to high electricity prices, or the way we averaged semi-annual electricity prices, shown in Fig.5, led to an underestimation of electricity consumption. Since we cannot know the exact price each firm paid at different times, we averaged between a lower and a very high price, which might result in an overestimation of the actual electricity price firms paid. This could explain the apparent drop in consumption. Although, a similar argument can be made for gas. Despite the rise in gas prices, estimated gas usage remained relatively stable or even increased.
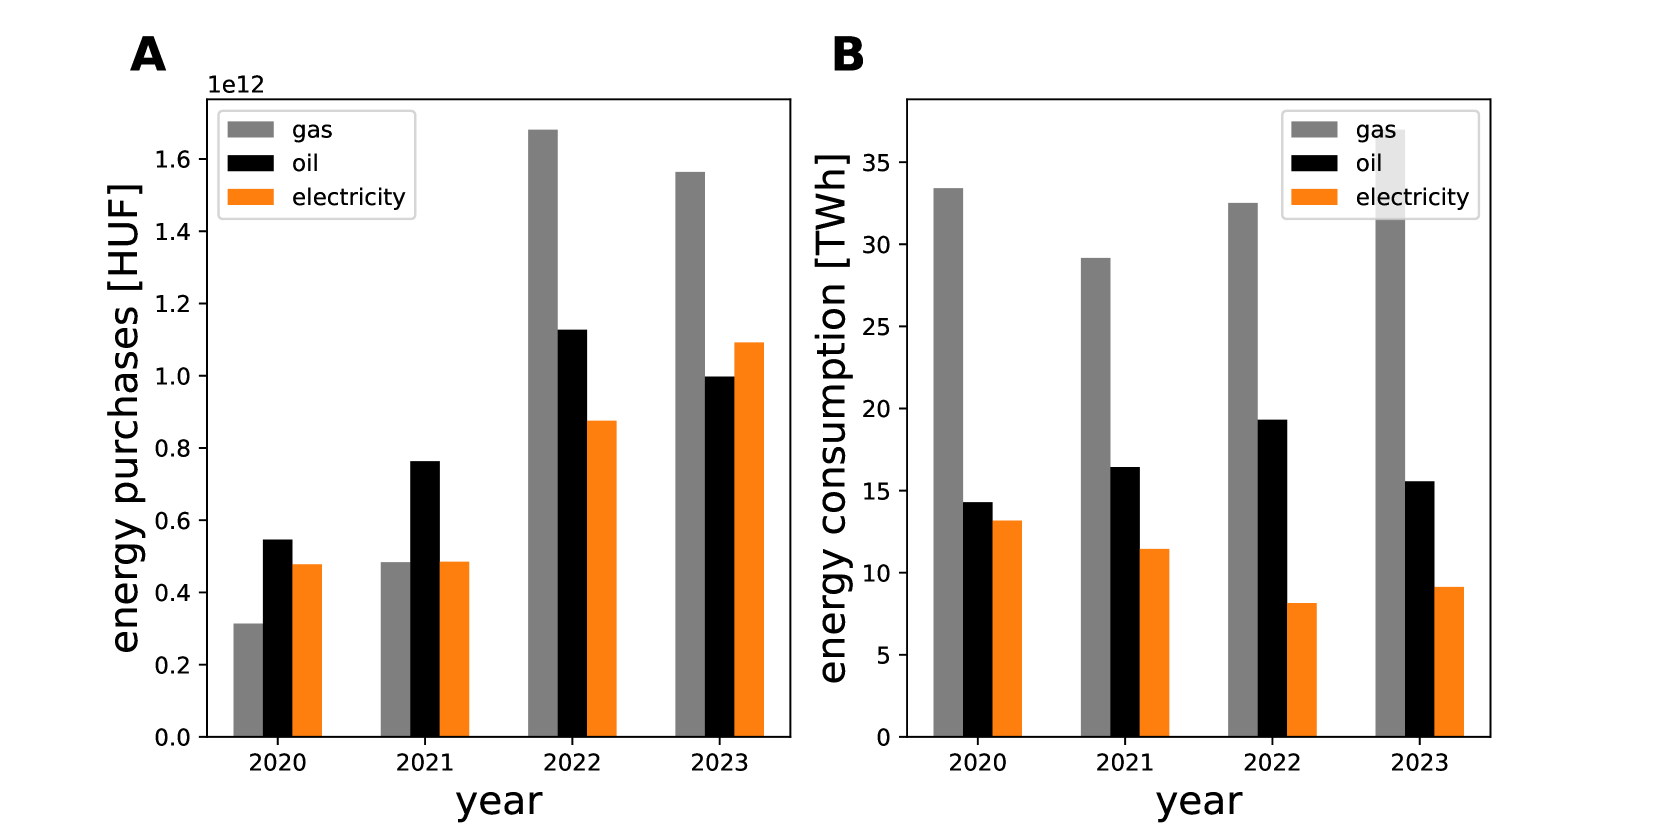
S5 Comparison of firm sample to sectoral energy consumption data
We assess how well our firm sample represents sectoral energy consumption in Hungary by comparing it to official statistics. Specifically, we examine the total energy consumption (in TWh) of gas, electricity, and oil for the NACE 1-digit sectors ’A - Agriculture, forestry and fishing,’ ’B - Mining and quarrying,’ and ’C - Manufacturing,’ using data from Hungary’s energy balance [53]. Figure 12 presents time series data for both the official statistics and our estimated energy consumption for the aggregated firm sample. Since our sample consists of only 27,067 firms, it is not expected to cover the total energy consumption of each sector. However, it should capture the relative consumption levels across sectors. As shown in Fig.12, the sectoral distribution of gas, electricity, and oil consumption is well reflected in our estimates, with ’C - Manufacturing’ consuming the most energy, followed by ’A - Agriculture, forestry and fishing,’ and ’B - Mining and quarrying’ consuming the least. However, our estimates indicate higher gas consumption and lower electricity consumption for ’C - Manufacturing’ compared to official statistics. This suggests a possible underestimation of electricity consumption and an overestimation of gas consumption in our firm sample.
To further evaluate the accuracy of our estimates, we compare the share of electricity consumption in each NACE 1-digit sector using official energy balance data [53]. For each year between 2020 and 2023, we calculate the electricity share in the sectoral energy mix by dividing electricity consumption by the total consumption of electricity, natural gas, and oil. We then compare these shares to those in our firm sample. As shown in Fig.13, our estimates generally capture the relative importance of electricity across sectors. ’C - Manufacturing’ has the highest share of electricity in the energy mix, consistent with official statistics. However, our estimates show a lower overall electricity share, indicating a potential underestimation of electricity consumption. The discrepancy is particularly pronounced in 2022, likely due to the way we averaged semi-annual electricity prices, which may have led to an overestimation of the prices firms actually paid.