22institutetext: School of Physics and Astronomy, Sun Yat-Sen University, Zhuhai 519082, People’s Republic of China; tanbxuan@sysu.edu.cn
33institutetext: CSST Science Center for the Guangdong-Hongkong-Macau Greater Bay Area, Sun Yat-Sen University, Zhuhai 519082, People’s Republic of China 44institutetext: School of Physics and Electrical Engineering, Liupanshui Normal University, Liupanshui 553004, People’s Republic of China
\vs\no
Multi-wavelength study for gamma-ray nova V1405 Cas
Abstract
Novae are found to have GeV to TeV -ray emission, which reveals the shock acceleration from the white dwarfs. Recently, V1405 Cas was reported to radiated suspicious -ray by Fermi-LAT with low significance () after the optical maximum. Radio observations reveal that it is one of the five brightest novae surrounded by low-density ionized gas columns. Here we report continuous search for GeV -ray from Fermi-LAT. No -ray were found. For V1405 Cas the flux level is lower than other well-studied Fermi novae, and the -ray maximum appear at d. -ray of V1405 Cas are used to search potential -ray periodicity. No -ray periodicity was found during the time of observation. By comparing multi-wavelength data, the -ray upper limit to optical flux ratio with value at around is obtained to constrain the shock acceleration. Long-term analysis from Swift-XRT gets X-ray spectral in the post-shock phase, which indicates that V1405 Cas became a super-soft source. The best-fit black body temperature at the super soft state is 0.11 - 0.19 keV.
keywords:
Classical Novae: Gamma-ray source : Cataclysmic variable1 Introduction
Classical nova is one kind of optical transient with brightness increase by one order in less than a few days (Gallagher & Starrfield 1978). Such transient is an eruption that happens to a white dwarf (WD) which accretes from a main sequence star in close binary system (Della Valle & Izzo 2020; Chomiuk et al. 2021a). They are different from the so-called ‘luminous red novae’ which are believed to arise from stellar mergers (Pastorello et al. 2019; Cai et al. 2019, 2022a, 2022b). Classical novae are important objects for studying shock, nucleosynthesis and binary evolution (José et al. 2006). Since WDs undergoing nova eruptions can obtain mass during accretion, novae have been suggested as the progenitors of Type Ia supernovae in degenerate scenario (Shara et al. 2010; Soraisam & Gilfanov 2015). The shell of WD will be heated by the compression and undergo a thermonuclear runaway, which results in the ejection of the accreted mass (Starrfield et al. 2016). Such transient objects observed from radio to -ray are identified firstly by optical observations.
Since the Fermi spacecraft launched in August 2008, more and more -ray novae are discovered by the Large Area Telescope (LAT) on board Fermi (Ackermann et al. 2014; Franckowiak et al. 2018). Nova can accelerate a fraction of the swept-up particles to high energies by diffusive shock acceleration within the Fermi-LAT detection energy range. Both classical and recurrent novae (e.g. RS Oph) are detected by Fermi-LAT (Cheung et al. 2022). RS Oph is seen even in TeV range also (Acciari et al. 2022; H. E. S. S. Collaboration et al. 2022). The GeV -ray emission from Galactic novae observed by Fermi-LAT reveal that these objects may accelerate relativistic particles by shocks probably (Li et al. 2017). The hadronic origin -ray related to proton-proton collisions from novae imply a production of neutrinos (Guépin & Kotera 2017; Fang et al. 2020). For symbiotic novae (e.g. V407 Cyg, RS Oph), this emission is thought to have occurred when this high-velocity material shocked the dense stellar wind from their red giant companion.
The ratio of -ray and optical luminosity is suspected to be a key to constrain the lower limit on the fraction of the shock power that accelerate relativistic particles (Metzger et al. 2015). Therefore, simultaneous -ray and optical observations would be necessary for Galactic novae. The typical -ray novae are transient sources detected over 2 - 3 week duration (Ackermann et al. 2014). By assuming all novae are -ray emitters, classical novae with and within are likely to be discovered in -ray using Fermi-LAT (Morris et al. 2017).
Shock acceleration from nova not only emit -ray but also radiate X-rays. The internal shocks from novae have velocities around and heat the post-shock gas to temperatures above , which can produce X-ray emission (Steinberg & Metzger 2020). Most -ray novae show X-ray evidence of hot shock plasma, but not until the -ray has faded below detectability (Gordon et al. 2021). Same as classical novae, the recurrent nova RS Oph were reported to produce X-ray emission originating from shocked ejecta before the X-ray supersoft source (SSS) emerged (Orio et al. 2022b). X-ray emission from classical novae during their -ray period could be absorbed by dense ejecta (Metzger et al. 2014).
V1405 Cas (PNV J23244760+6111140) was discovered on 18 March 2021 at 10:10 UT (Wischnewski 2022). Surprisingly, a series of optical flares were found with the brightest one reaching V=5.1 around 2021-05-10. Suspected -ray emission has been found after 2021-05-10 with low detection significance, making it as one of the promising -ray novae (Gong & Li 2021; Buson et al. 2021). However, the time difference between potential -ray and optical is unclear. By using 4-day time bins, it was detected with significance in data from 2021-05-20 15:01:17 to 2021-05-24 15:01:17 UTC with a flux (E >100 MeV) of photons . Therefore, it is worthwhile to investigate -ray emission for long term. Accordingly, one can check whether V1405 Cas has a -ray emission occurring at late epoch compared to the other novae. Furthermore, no matter for significant flux or upper limit, shock acceleration of a nova may be constrained probably. In this paper, we investigate -ray and X-ray emissions resulting from shock of V1405 Cas. The paper is organized in the following. Section 2 gives data selection and analysis method. Section 3 shows the results from -ray and X-ray data analysis. Section 4 discusses particle acceleration, white dwarf spinning and super soft X-ray state. Section 5 summarizes our conclusions.
2 Observations and Analysis
2.1 AAVSO
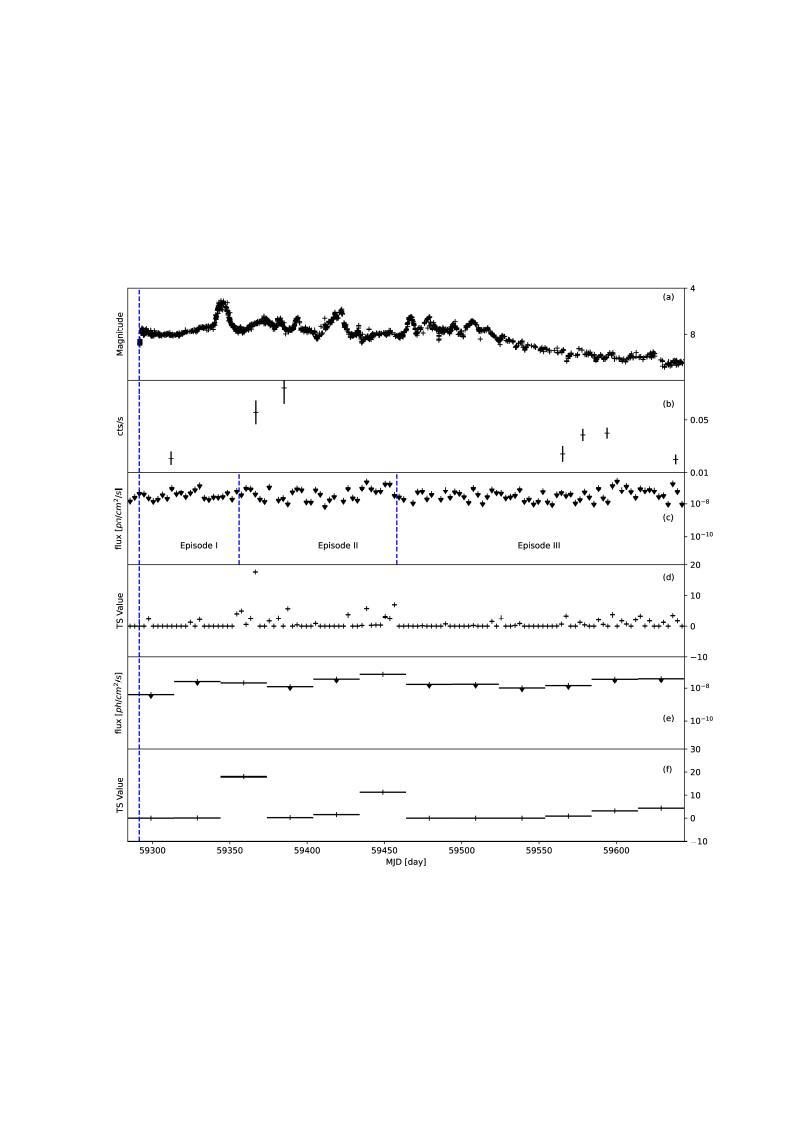
Optical light-curve of V1405 Cas has been collected from the American Association of Variable Star Observers (AAVSO)111http://www.aavso.org (Percy & Mattei 1993). Coordinates of AAVSO observations for V1405 Cas give: R.A.=23h24m48s, Dec.=61∘11’15” (Wischnewski 2022). The optical maxima appears at MJD=59344.297. Several optical bands are included in data of AAVSO database. To put it simply, we use V band (Johnson V filter, Effective Wavelength = 5448) to generate light curve (see Fig. 1 panel (a)). A galactic reddening of E(B-V) = 0.32 mag ( = 1.03 mag with = 3.1) was assumed (Schlafly & Finkbeiner 2011). of the earliest time (MJD 59293) and the peak time show 0.20 mag and 0.26 mag respectively, corresponding to colour temperatures of 7790 K and 7300 K (Kitchin 2013). There is one significant peak in Episode I and several peaks in Episode II and III (definition of three episodes can be seen in Section 2.2).
The magnitude starts from 8.822 at the beginning and arise to 5.082 at MJD of 59344.3, which is the first peak and the maximum of the whole time span. Then the magnitude go through fluctuation and arise to 5.91 as second peak, which locate in Episode II. After that, the magnitude continued to go through several times of slight fluctuation and then decline.
2.2 Fermi-LAT Observations
Fermi-LAT photon data with energy range from 300 MeV to 100 GeV within 15∘ search radius are used in this analysis. Coordinates of Fermi-LAT observations for V1405 Cas are: R.A.= 351.199∘, Dec.=61.1874∘ after running gtfindsrc. Events with a zenith angle greater than 90∘ were excluded. The Instrument Response Functions (IRFs) used in this analysis is P8R3_SOURCE_V3. The binned maximum-likelihood analysis (gtlike) was performed based on the 4FGL catalog (gll_psc_v27.fit). The Galactic emission gll_iem_v07 and isotropic diffuse emission iso_P8R3_SOURCE_V3_v1 are adopted. For sources within 5∘ from V1405 Cas the normalization parameters are freed. The spectrum of V1405 Cas is assumed to be a power law (PL):
| (1) |
where is prefactor in unit of , is the power index, is energy scale in unit of MeV.
To improve our starting model before analyzing the nova eruption, we fit a 1 yr data set spanning from 2020 March 18 to 2021 February 18, which ends 30 days before . There is no significant detection at the position of V1405 Cas with a 95% confidence flux upper limit, . As comparison, -ray emission upper limits after are around , which would be shown in next section.
Upper limits at the 90% confidence level (CL) are shown when the test statistic (TS) value is smaller than 4. The Fermi-LAT light curve with 3-day bin from 2021-03-11 is shown. In addition, for comparing with the long-term X-ray observation, a 30-day bin analysis with PL is also performed.
At the same time, we assume an exponential cutoff power law (PLSuperExpCutoff) for Fermi-LAT data to generate a light curve:
| (2) |
where is prefactor in unit of , is power index, is energy scale in unit of MeV, is cutoff energy in unit of MeV, b is the second power index.
2.3 Swift-XRT Observations
The Neil Gehrels Swift Observatory is a rapid-response satellite. The X-ray Telescope (XRT) on board is a focusing telescope which detect energy range between 0.2 and 10 keV. We selected Swift-XRT observations of exposure time longer than 1 ks to check the evolution of the spectrum. An absorbed PL model was chosen to fit each observed spectrum based on web-form on the building. The information can be seen in Table 3.
The XRT cleaned event-lists were generated by the pipeline tool xrtpipeline. The source image, spectrum and light curve were extracted by xselect. Ancillary Response Files (ARFs) were created by using xrtmkarf.
According to the Fermi-LAT light curve, we divide Swift-XRT observations into three episodes:
-
*
Episode I: Before MJD 59356, no -ray are detected by Fermi-LAT. The optical light curve rises to the maximum (the first peak).
-
*
Episode II: From MJD 59356 to 59458, suspected -ray were begun to be detected by Fermi-LAT. The optical emissions arrive the second peak.
-
*
Episode III: After MJD 59458: the -ray disappear.
We combine the observations using xselect. For Episode I and Episode II, we can not conduct spectrum due to low counts rate. We only analyze Episode III.
3 Results
3.1 Fermi-LAT light curve and spectrum
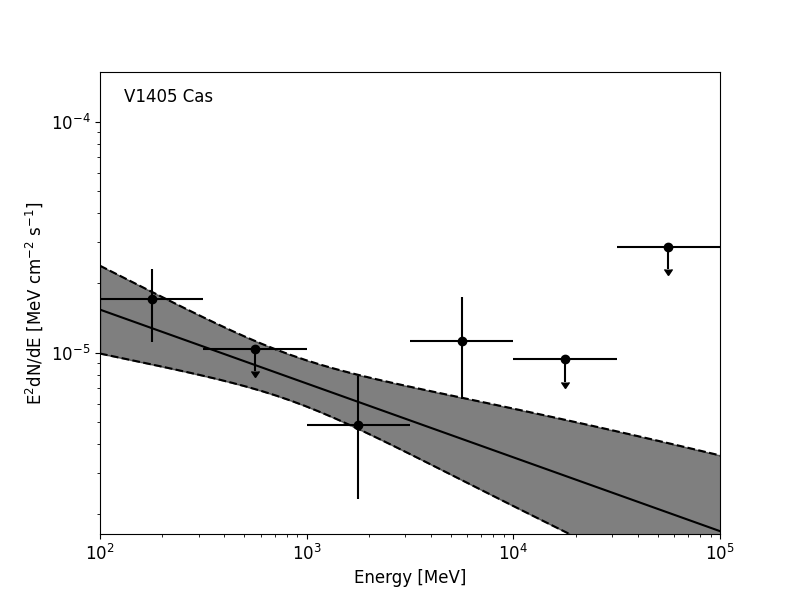
From Fig. 1, we can see that TS -ray appears around two weeks after the optical maximum. Since we use 3-day bins, we did not get exactly same results as Buson et al. (2021). is defined as the discovery date (2021-03-18 10:10:00). For the PL model at time period of d to d and d to d, we get -ray emission. We use the period from d to d to make a similar analysis (Fig. 2), which gets the photon index of 1.94 and TS value of 26.9. A binned likelihood were performed based on gtlike. The corresponding best-fit parameters are shown in Table 1. Considering V1405 Cas as a point source, PL and PLSuperExpCutoff are compared. For PLSuperExpCutoff model, considering = 3000 MeV, the significance is slightly higher than those for = 3000 MeV. Since the number of free parameters are different, it is hard to draw a conclusion about the best fitting model.
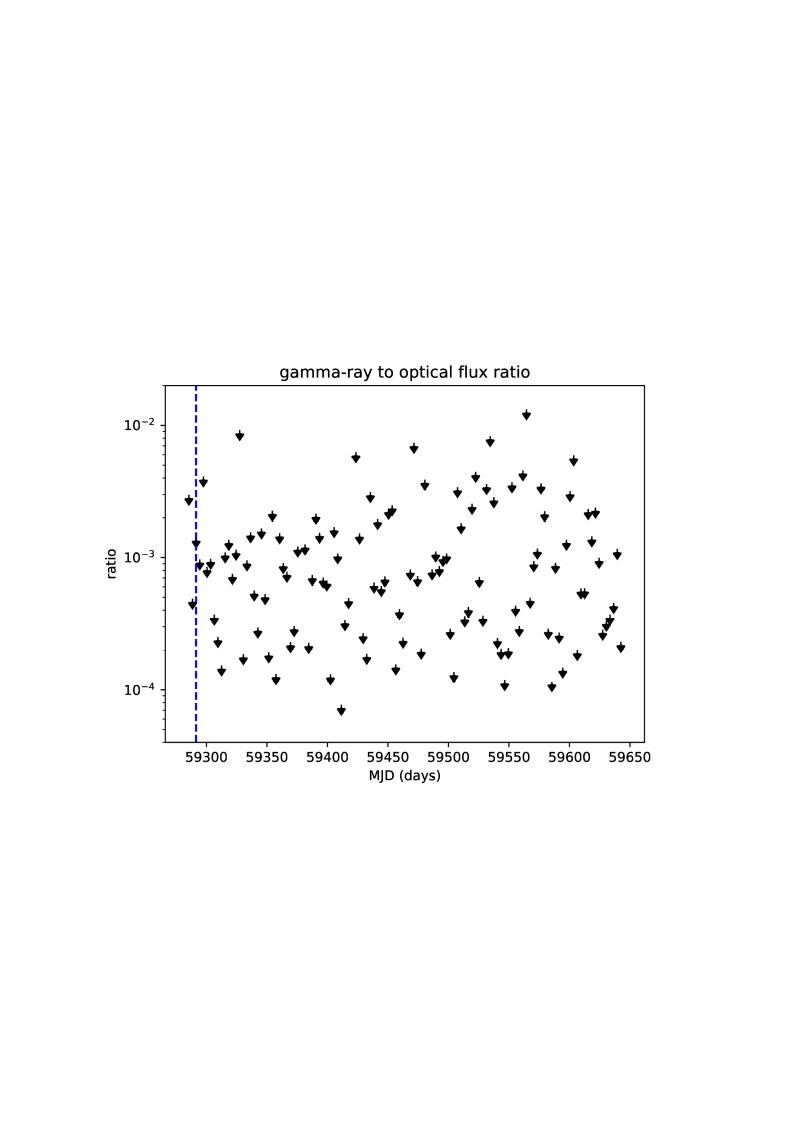
To investigate shock acceleration, we collect 3-days bin -ray data at Figure 1 to calculate the optical and -ray flux ratio. The optical flux are calculated by averaging 3-days V band magnitude following , where and are magnitude and brightness while and are absolute magnitude and absolute brightness. We average the optical flux error bar in each 3-day bin in order to match the -ray upper limit and generate ratio error bar. The corresponding results are shown in Figure 3. The occasional flux ratio is smaller than ASASSN-16ma value concluded by Li et al. (2017), RS Oph value revealed by Cheung et al. (2022) and of other novae mentioned at Figure 9 of Chomiuk et al. (2021a). This indicates that the internal shock is weaker than that in ASASSN-16ma.
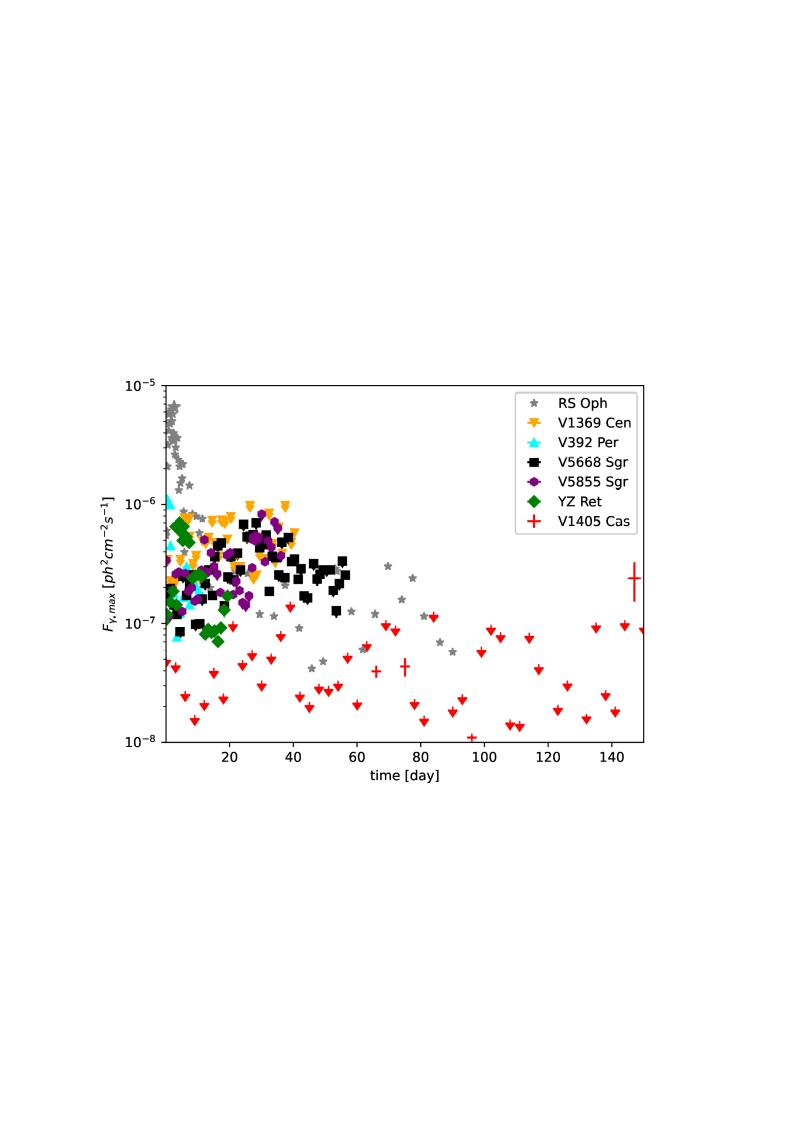
In Fig. 4, we compare light curve of well-studied Fermi novae with V1405 Cas 222https://asd.gsfc.nasa.gov/Koji.Mukai/novae/latnovae.html. The flux upper limit of V1405 Cas is lower than all the other Fermi novae. The is defined as the optical maxima of novae. We can see that most Fermi novae have -ray maxima in one day to one month after the optical maxima.
3.2 Gamma-ray periodicity
| spectral model | Flux () | (MeV) | b | TS | |
|---|---|---|---|---|---|
| PL | … | … | 22.726 | ||
| (fixed) | … | … | 22.293 | ||
| PLSuperExpCutoff | 2000 (fixed) | 1 | 26.503 | ||
| 3000 (fixed) | 1 | 28.7199 |
Inspired by Li (2022), we search potential GeV -ray periodicity of V1405 Cas . An aperture radius of was adopted for pulsation searching. We selected the Fermi-LAT data at the time between d and d. The arrival time was corrected by gtbary. This tool performs a barycentering time correction to an event file using spacecraft orbit files of Fermi-LAT . The selected events are analyzed by using efsearch task in the HEASoft package (version 6.31.1). efsearch is used to search for periodicity in a time series by folding the data over a range of periods. This search is motivated by the 544.84 s -ray pulsation detected in nova ASASSN-16ma (Li 2022). After performing a test run from 10 s to 800 s in a resolution of 0.1 s, we did not get any detection. In addition, Z-test is used to search periodicity also (Kerr 2011). TS for each photon is weighted by its probability using the instrument response function. No periodicity are found.
3.3 X-ray spectral analysis
For investigating the SSS phase, we consider an absorbed black body model for Swift-XRT observations in Episode III using online build Swift-XRT product 333https://www.swift.ac.uk/user_objects/. Considering the SSS phase, the pile-up characteristics will differ from normal sources. This occurs when several photons hit the detector at the same place between different readouts. As a result, they are counted as one and their energies are summed. Both flux measurements and spectral characteristics would be affected by pipe-up. Selecting this method will cause only grade 0 (single pixel) events to be selected and a lower count-rate threshold to be used when correcting for pile-up. The corresponding best-fit parameters are shown in Table 2, respectively. The column density of the is . The black body temperature kT distributes between 0.1 and 0.2 keV, which indicates that V1405 Cas became a SSS at the post-outburst state.
| ObsID | kT | W/dof | |||
|---|---|---|---|---|---|
| () | (keV) | () | () | ||
| 00014197018 | 33.57/27 | ||||
| 00014197020 | 45.67/51 | ||||
| 00014197024 | 16.3/26 |
| ObsID | Exposure (ks) | Date | (d) |
|---|---|---|---|
| 00014197001 | 0.28 | 2021-03-24T01:29:03 | 5.7 |
| 00014197002 | 1.64 | 2021-03-28T18:10:40 | 10.4 |
| 00014197003 | 1.85 | 2021-03-31T08:19:03 | 12.9 |
| 00014197004 | 1.57 | 2021-04-03T09:32:43 | 16.0 |
| 00014197005 | 0.44 | 2021-04-06T18:47:32 | 19.4 |
| 00014197006 | 1.83 | 2021-04-07T20:28:09 | 20.5 |
| 00014197007 | 1.37 | 2021-04-09T04:14:48 | 21.8 |
| 00014197008 | 1.42 | 2021-04-23T06:25:45 | 35.9 |
| 00014197009 | 1.90 | 2021-04-30T02:12:33 | 42.7 |
| 00014197010 | 1.80 | 2021-05-07T00:03:15 | 49.6 |
| 00014197011 | 1.08 | 2021-05-14T16:44:50 | 57.3 |
| 00014197012 | 0.92 | 2021-05-31T00:23:35 | 73.6 |
| 00014197013 | 0.84 | 2021-06-15T07:23:29 | 88.9 |
| 00014197014 | 1.58 | 2021-06-30T11:45:17 | 104.1 |
| 00014197015 | 0.73 | 2021-07-15T11:56:53 | 119.1 |
| 00014197016 | 0.78 | 2021-07-30T04:06:01 | 133.8 |
| 00014197017 | 1.04 | 2021-12-14T01:51:28 | 270.7 |
| 00014197018 | 1.89 | 2021-12-15T00:03:15 | 271.6 |
| 00014197019 | 1.29 | 2021-12-29T14:44:10 | 286.2 |
| 00014197020 | 2.36 | 2022-01-14T09:35:17 | 302.0 |
| 00014197024 | 2.34 | 2022-02-23T03:46:02 | 341.8 |
4 Discussion
4.1 Particle acceleration and shock
Figure 1 shows the discrete -ray upper limit concurrent with optical emissions (Episode II), which suggests that both are results of shock acceleration from nova explosion. GeV -ray are thought to be the by-product of relativistic particles accelerated by shocks in the nova ejecta (Figueira et al. 2018; Chomiuk et al. 2021a; Acciari et al. 2022). Theoretically, the -ray produced by novae are luminous, weighting in at 0.1 - 1% of the bolometric luminosity predicts these events could generate photon energies up to 10 TeV, depending on details of the shocks (Metzger et al. 2015). This is verified by simultaneous -ray and optical observations of Galactic nova ASASSN-16ma (Li et al. 2017).
According to Figure 1, the X-ray maximum is 20 days after the detection of the most significant -ray emission. Thermal X-rays can be produced in the internal shocks that radiate the observed -ray emission. One would expect to observe much brighter thermal X-ray emission at around 10 to 1000 times more luminous than the -ray flux. In our case, simultaneous X-ray and -ray observations of V1405 Cas at Episode II could constrain the radiative efficiency and the particle acceleration efficiency of the internal shocks. The presence of X-ray shock signatures sometimes coincident with the -ray results from the small columns of neutral gas around this nova.
Hybrid acceleration of leptons and hadrons in the nova shock has been considered in some research (Martin & Dubus 2013). In that model, the magnetic field is obtained assuming an equipartition with the thermal energy density upstream of the shock. It results in the maximum energy of protons estimated to be 300 GeV. The GeV -ray emission is then mostly expected from leptonic processes, namely the IC scattering of the nova light by the electrons accelerated in the shock. However, hadronic and/or leptonic-hadronic models are favored to explain the gamma-ray emission of novae taking into account the energy loss of electrons via synchrotron emission (Chomiuk et al. 2021a; De Sarkar et al. 2023). The narrow energy range at SED of V1405 Cas makes it hard to constrain hadronic or leptonic origins.
4.2 Whether V1405 Cas contains a spinning white dwarf?
Unsurprisingly, a spinning white dwarf can produce gamma-rays like a spinning neutron star (Takata et al. 2017; Orio et al. 2022a; Munari et al. 2022). For example, the misalignment between axes of the WD spin, magnetic dipole, and orbital revolution produce -ray pulsations. The nova progenitor is likely a fast-spinning magnetic WD, mostly an intermediate polar Orio et al. (1992)s. Strong bipolar nova winds from the magnetic poles of the WD regularly interact with the matter deposited into the orbital plane by the early and slow ejection (Orio et al. 2022b). Therefore, it is suitable to ask whether V1405 Cas are spinning, which accelerate electrons to produce GeV -ray .
Previously, pulsations of nova are discovered on X-ray from V1674 Her and -ray from ASASSN-16ma (Drake et al. 2021; Li 2022). However, no -ray pulsation were detected from V1405 Cas due to low photon counts. Nevertheless, this can not exclude V1405 Cas as a spinning WD (Section 3.2). More observations are needed to classify whether the WD V1405 Cas is spinning or not.
4.3 Super soft source
SSS is one kind of X-ray transient that is always believed to appear in post-outburst novae, in which hydrogen burning continues near the surface after the bulk of accreted envelope mass has been ejected (Orio et al. 2022a). From Table 2 we can see V1405 Cas is a SSS characterized by soft X-ray emissions. Such super-soft phase appear after shock emergence. The spectra in some novae in the supersoft X-ray phase may have redshift velocity of the emission lines and blueshift velocity of the absorption lines (Pei et al. 2021). The flux variation in some emission lines may result from the surrounding cool inhomogeneous material or temporary ionization.
Radio observations from VLA and uGMRT reveal that V1405 Cas are among the five brightest novae ever observed in the radio band, and the expansion velocity to be 1200 km/s (Chomiuk et al. 2021b; Nayana et al. 2022). Such high velocity can heat the gas, which produces X-ray emission at the post-shock phase. The appearance of radio emissions when the -ray detected by Fermi-LAT results from the low-density columns of ionized gas. As expected, V1405 Cas has begun to display Fe II absorption features and then a SSS (Shore et al. 2021; Page et al. 2021). Thus, it becomes an excellent target to study SSS after shock acceleration. This Fe II absorption point to the nova formation in a large circumbinary envelope of gas (Williams 2012; Aydi et al. 2024). The gas may have a origin of the secondary star.
The typical range of effective temperature in the SSS varies from K to about K (Suleimanov et al. 2003) . The low emission during the SSS phase can be explained by absorption from neutral and/or ionized medium (Ness et al. 2023). V1405 Cas has a typical temperature of SSS. For example, RS Oph has a blackbody temperature in the 35 to 40 eV ( 405000 to 470000 K) range (Orio et al. 2023). V2491 Cyg has a temperature of 90 1 eV ( K) and an X-ray luminosity of erg s-1 (Ness et al. 2022). The temperature is proportional to the shock velocity. Typical soft X-ray photons are absorbed in the ISM with values of in several . As X-rays suffer photoelectric absorption, reflect these effects, which is also the case for novae (Nelson et al. 2019). Possibly, the X-ray and -ray originated from different region (Metzger et al. 2015). The values of V1405 Cas are around to . However, resulting from the low quality of X-ray data, we can not derive evolution of .
5 Conclusion
We summarize our conclusion as follows. (1) Typical -ray novae show significant -ray after the optical maxima in weeks to months. Our result shows that no significant GeV -ray emissions of nova V1405 Cas were detected before and after the optical maxima. (2) Typical -ray novae have -ray maxima at hours to weeks after optical maxima. Our result reveal that -ray upper limit of nova V1405 Cas show a maximum at d. (3) Some classical novae were found to have periodicity in -ray emission. We search -ray periodicity in V1405 Cas using two methods: efsearch and Z-test. Owing to low GeV photon counts, no -ray periodicity is found from Fermi-LAT. (4) X-ray emission of novae arrives at a soft phase. Our work introduce an adsorb black body model to investigate the potential SSS phase. We show that V1405 Cas turned to a super-soft state after -ray emissions disappeared according to the best-fit temperature values. (5) -ray to optical ratio is a key for shock acceleration, our result shows a ratio around to which approach bright -ray novae (e.g., ASASSN-16ma, RS Oph).
Although some novae have low significance and weak signal in -ray , it is still valuable to observe such objects. With higher sensitivity, the future Very Large Area Gamma-ray Space Telescope (VLAST) may improve that (Fan et al. 2022). X-ray telescope, such as Einstein Probe (EP) and Space-based multi-band astronomical Variable Objects Monitor (SVOM), would also help us to unveil SSS nature for more nova.
Acknowledgements.
The authors thanks Kwan-Lok Li for many useful discussion. Scientific results from data presented in this publication are obtained from AAVSO and HEASARC. Z.W.O. is supported by the National Natural Science Foundation of China (NSFC, Grant No. 12393853). P.H.T., H.H.W. and W.J.H. are supported by the National Natural Science Foundation of China (NSFC) under grant 12273122. H.H.W. is supported by the Scientific Research Foundation of Hunan Provincial Education Department (21C0343). S.P.P. is supported by Science Research Project of University (Youth Project) of the department of education of Guizhou Province (QJJ[2022]348) and the Science and Technology Foundation of Guizhou Province (QKHJC-ZK[2023]442).References
- Acciari et al. (2022) Acciari, V. A., Ansoldi, S., Antonelli, L. A., et al. 2022, Nature Astronomy, 6, 689
- Ackermann et al. (2014) Ackermann, M., Ajello, M., Albert, A., et al. 2014, Science, 345, 554
- Albert et al. (2022) Albert, A., Alfaro, R., Alvarez, C., et al. 2022, ApJ, 940, 141
- Aydi et al. (2024) Aydi, E., Chomiuk, L., Strader, J., et al. 2024, MNRAS, 527, 9303
- Buson et al. (2021) Buson, S., Cheung, C. C., & Jean, P. 2021, The Astronomer’s Telegram, 14658, 1
- Cai et al. (2022a) Cai, Y., Reguitti, A., Valerin, G., & Wang, X. 2022a, Universe, 8, 493
- Cai et al. (2019) Cai, Y. Z., Pastorello, A., Fraser, M., et al. 2019, A&A, 632, L6
- Cai et al. (2022b) Cai, Y. Z., Pastorello, A., Fraser, M., et al. 2022b, A&A, 667, A4
- Cheung et al. (2016) Cheung, C. C., Jean, P., Shore, S. N., et al. 2016, ApJ, 826, 142
- Cheung et al. (2022) Cheung, C. C., Johnson, T. J., Jean, P., et al. 2022, ApJ, 935, 44
- Chomiuk et al. (2021a) Chomiuk, L., Metzger, B. D., & Shen, K. J. 2021a, ARA&A, 59, 391
- Chomiuk et al. (2021b) Chomiuk, L., Linford, J. D., Aydi, E., et al. 2021b, ApJS, 257, 49
- De Sarkar et al. (2023) De Sarkar, A., Nayana, A. J., Roy, N., Razzaque, S., & Anupama, G. C. 2023, ApJ, 951, 62
- Della Valle & Izzo (2020) Della Valle, M., & Izzo, L. 2020, A&A Rev., 28, 3
- Drake et al. (2021) Drake, J. J., Ness, J.-U., Page, K. L., et al. 2021, ApJ, 922, L42
- Fan et al. (2022) Fan, Y. Z., Chang, J., Guo, J. H., et al. 2022, Acta Astronomica Sinica, 63, 27
- Fang et al. (2020) Fang, K., Metzger, B. D., Vurm, I., Aydi, E., & Chomiuk, L. 2020, ApJ, 904, 4
- Figueira et al. (2018) Figueira, J., José, J., García-Berro, E., et al. 2018, A&A, 613, A8
- Franckowiak et al. (2018) Franckowiak, A., Jean, P., Wood, M., Cheung, C. C., & Buson, S. 2018, A&A, 609, A120
- Gallagher & Starrfield (1978) Gallagher, J. S., & Starrfield, S. 1978, ARA&A, 16, 171
- Gong & Li (2021) Gong, Y.-H., & Li, K.-L. 2021, The Astronomer’s Telegram, 14620, 1
- Gordon et al. (2021) Gordon, A. C., Aydi, E., Page, K. L., et al. 2021, ApJ, 910, 134
- Guépin & Kotera (2017) Guépin, C., & Kotera, K. 2017, A&A, 603, A76
- H. E. S. S. Collaboration et al. (2022) H. E. S. S. Collaboration, Aharonian, F., Ait Benkhali, F., et al. 2022, Science, 376, 77
- José et al. (2006) José, J., Hernanz, M., & Iliadis, C. 2006, Nucl. Phys. A, 777, 550
- Kerr (2011) Kerr, M. 2011, ApJ, 732, 38
- Kitchin (2013) Kitchin, C. R. 2013, Astrophysical Techniques
- Li (2022) Li, K.-L. 2022, ApJ, 924, L17
- Li et al. (2017) Li, K.-L., Metzger, B. D., Chomiuk, L., et al. 2017, Nature Astronomy, 1, 697
- Martin & Dubus (2013) Martin, P., & Dubus, G. 2013, A&A, 551, A37
- Metzger et al. (2015) Metzger, B. D., Finzell, T., Vurm, I., et al. 2015, MNRAS, 450, 2739
- Metzger et al. (2014) Metzger, B. D., Hascoët, R., Vurm, I., et al. 2014, MNRAS, 442, 713
- Morris et al. (2017) Morris, P. J., Cotter, G., Brown, A. M., & Chadwick, P. M. 2017, MNRAS, 465, 1218
- Munari et al. (2022) Munari, U., Giroletti, M., Marcote, B., et al. 2022, A&A, 666, L6
- Nayana et al. (2022) Nayana, A. J., Anupama, G. C., Banerjee, D., et al. 2022, The Astronomer’s Telegram, 15383, 1
- Nelson et al. (2019) Nelson, T., Mukai, K., Li, K.-L., et al. 2019, ApJ, 872, 86
- Ness et al. (2022) Ness, J. U., Beardmore, A. P., Bezak, P., et al. 2022, A&A, 658, A169
- Ness et al. (2023) Ness, J. U., Beardmore, A. P., Bode, M. F., et al. 2023, A&A, 670, A131
- Orio et al. (1992) Orio, M., Trussoni, E., & Oegelman, H. 1992, A&A, 257, 548
- Orio et al. (2022a) Orio, M., Gendreau, K., Giese, M., et al. 2022a, ApJ, 932, 45
- Orio et al. (2022b) Orio, M., Behar, E., Luna, G. J. M., et al. 2022b, ApJ, 938, 34
- Orio et al. (2023) Orio, M., Gendreau, K., Giese, M., et al. 2023, ApJ, 955, 37
- Page et al. (2021) Page, K. L., Starrfield, S., Munari, U., Woodward, C. E., & Wagner, R. M. 2021, The Astronomer’s Telegram, 15111, 1
- Pastorello et al. (2019) Pastorello, A., Mason, E., Taubenberger, S., et al. 2019, A&A, 630, A75
- Pei et al. (2021) Pei, S., Orio, M., Ness, J.-U., & Ospina, N. 2021, MNRAS, 507, 2073
- Percy & Mattei (1993) Percy, J. R., & Mattei, J. A. 1993, Ap&SS, 210, 137
- Schlafly & Finkbeiner (2011) Schlafly, E. F., & Finkbeiner, D. P. 2011, ApJ, 737, 103
- Shara et al. (2010) Shara, M. M., Yaron, O., Prialnik, D., & Kovetz, A. 2010, ApJ, 712, L143
- Shore et al. (2021) Shore, S. N., Buil, C., Dubovsky, P., et al. 2021, The Astronomer’s Telegram, 14577, 1
- Sokolovsky et al. (2022) Sokolovsky, K. V., Li, K.-L., Lopes de Oliveira, R., et al. 2022, MNRAS, 514, 2239
- Soraisam & Gilfanov (2015) Soraisam, M. D., & Gilfanov, M. 2015, A&A, 583, A140
- Starrfield et al. (2016) Starrfield, S., Iliadis, C., & Hix, W. R. 2016, PASP, 128, 051001
- Steinberg & Metzger (2020) Steinberg, E., & Metzger, B. D. 2020, MNRAS, 491, 4232
- Suleimanov et al. (2003) Suleimanov, V., Meyer, F., & Meyer-Hofmeister, E. 2003, A&A, 401, 1009
- Takata et al. (2017) Takata, J., Yang, H., & Cheng, K. S. 2017, ApJ, 851, 143
- Williams (2012) Williams, R. 2012, AJ, 144, 98
- Wischnewski (2022) Wischnewski, E. 2022, BAV Magazine Spectroscopy, 11, 6