(wacv) Package wacv Warning: Incorrect font size specified - WACV requires 10-point fonts. Please load document class ‘article’ with ‘10pt’ option (wacv) Package wacv Warning: Single column document - WACV requires papers to have two-column layout. Please load document class ‘article’ with ‘twocolumn’ option (wacv) Package wacv Warning: Incorrect paper size - WACV uses paper size ‘letter’. Please load document class ‘article’ with ‘letterpaper’ option
A Zero-Shot Learning Approach for Ephemeral Gully Detection from Remote Sensing using Vision Language Models
Abstract
Ephemeral gullies are a primary cause of soil erosion and their reliable, accurate, and early detection will facilitate significant improvements in the sustainability of global agricultural systems. In our view, prior research has not successfully addressed automated detection of ephemeral gullies from remotely sensed images, so for the first time, we present and evaluate three successful pipelines for ephemeral gully detection. Our pipelines utilize remotely sensed images, acquired from specific agricultural areas over a period of time. The pipelines were tested with various choices of Visual Language Models (VLMs), and they classified the images based on the presence of ephemeral gullies with accuracy higher than 70% and a F1-score close to 80% for positive gully detection. Additionally, we developed the first public dataset for ephemeral gully detection, labeled by a team of soil- and plant-science experts. To evaluate the proposed pipelines, we employed a variety of zero-shot classification methods based on State-of-the-Art (SOTA) open-source Vision-Language Models (VLMs). In addition to that, we compare the same pipelines with a transfer learning approach. Extensive experiments were conducted to validate the detection pipelines and to analyze the impact of hyperparameter changes in their performance. The experimental results demonstrate that the proposed zero-shot classification pipelines are highly effective in detecting ephemeral gullies in a scenario where classification datasets are scarce.
1 Introduction
Soil erosion is a geomorphological land degradation process that can result in environmental harm, property damage, loss of livelihoods and services, and social and economic challenges. Ephemeral gully erosion reduces the sustainability of agricultural systems and causes significant sediment-related issues downstream [1]. Ephemeral gullies remain a prominent and hard-to-treat cause of soil erosion [2]. A fast, reliable and cost-effective method to detect ephemeral gullies in the agricultural fields could play a crucial role in preventing the soil erosion and successful execution of soil conservation practices. A detection system using remote sensing images to distinguish between agricultural fields that show signs of ephemeral gully formation versus ephemeral gully-free agricultural fields will advance efforts of soil researchers, farmers and responsible agencies to study, treat and/or prevent soil erosion.
The emergence of Foundation Models, Vision Language Models (VLM), and Visual-Question-Answering (VQA) has great potential for tackling a wide range of computer vision challenges, particularly in remote sensing ([3, 4, 5]). When classifying nuanced and subjective concepts, Foundation Models and VLMs tend to hallucinate. To address this problem, techniques such as Modeling Collaborator (MC) [6] have been introduced. One of the advantages of MC is that it does not require an extensive amount of labeled data which is especially attractive to us since labeled datasets for ephemeral gully detection are extremely scarce. The lack of sufficient datasets for detecting ephemeral gullies to train conventional computer vision models leads to the exploration of methods that do not rely heavily on extensive labeled data. Techniques such as zero-shot classification, and transfer learning are common alternatives.
We assessed SOTA open-source zero-shot, transfer learning, and VLM-based classification methods in the task of classifying remote sensing images with signs of ephemeral gullies in agricultural fields. Additionally, we are providing the first dataset for detecting ephemeral gullies using remote sensing images, labeled by a group of soil and plant science experts.
Our key contributions are as follows:
-
1.
We present and evaluate three classification pipelines for detecting ephemeral gullies in remote sensing images, exploring zero-shot, transfer learning, and Vision-Language Models (VLMs). To our knowledge, this is the first work to successfully address this under-explored task. Inspired by [6], we further integrate large language models (LLMs) to enhance reasoning in the classification process, using VLMs for Visual Question Answering (VQA) and LLMs for reasoning, and compare their performance against existing zero-shot classification baselines.
-
2.
We conduct extensive experiments to investigate the choices of VLMs, types and number of questions, and aggregation methods for VQAs. Those experiments lead to a better understanding of the advantages and limitations of zero-shot classification methods such as [6].
-
3.
We make available the first public dataset for the detection of ephemeral gullies using remote sensing images. The dataset comprises high-resolution remote sensing RGB images of agricultural locations over different periods of time. The images are labeled by a team of soil and plant science experts to establish the ground truth classifications.
2 Background and Related Work
In this section, we will explore the existing research articles in the literature on ephemeral gully detection (assuming its presence in the image), and ephemeral gully formation assessments using remote sensing imagery. We also explore the SOTA zero-shot classification methods and VLMs that form the foundation of this research.
2.1 Ephemeral Gullies in Remote Sensing
Remote detection of ephemeral gully through classification remains largely unexplored, though manual assessment and evaluation are well-documented in agricultural literature [12, 13, 14, 15]. However, the time commitment associated with manual assessments limits their scalability for large-scale applications. Authors in [16] tested the effectiveness of using Google Earth temporal images to assess ephemeral gullies in U.S. agricultural fields, presenting a systematic method for identifying and locating these gullies within a certain error margin. Their approach relied heavily on manual labor and utilizes Google Earth images, which lack the image standardization needed for remote sensing in computer vision contexts.
Some researchers have attempted to automate parts of the process. There is extensive research on ephemeral gully risk assessment using topographic index models to identify areas of the field most susceptible to formation of ephemeral gullies [17]. There are examples of computer vision techniques applied to detect ephemeral gullies. For example, [18] employed conventional computer vision techniques, such as directional edge detection, to create a ”semiautomatic” method for identifying ephemeral gullies. Manual pre-identification of areas containing gullies was necessary due to the faint visibility of these features. Similarly, [19] applied deep learning methods like Convolutional Neural Networks (CNNs) [20] and U-Nets [21] for delineating gullies in non-agricultural areas. Current model- and image-based methods require either post-identification verification of presence of a gully or manual pre-identification of gully-prone regions. To date, the core task of ephemeral gully classification continues to rely on human intervention.
2.2 VLMs and Zero-Shot Classification
Authors in [11, 22] introduced Visual Instruction Tuning through their LLaVA (Large Language and Vision Assistant) model, aimed at developing a general-purpose vision-language assistant. LLaVA integrates a CLIP-based visual encoder with a language model, specifically Vicuna [23, 24], fine-tuned using multimodal instruction-following data generated by GPT-4 [25]. This combination enables the model to effectively process and understand both visual and textual inputs, enhancing performance across diverse vision-language tasks.
Zero-shot classification allows deep learning models to classify instances without prior training on the same distribution of instances. Significant advancements in this field have been achieved through models like CLIP (Contrastive Language–Image Pre-training) [7], which employs vast internet-sourced image-text pairs to align image and text embeddings in a unified multi-modal space. This alignment enables robust zero- and few-shot transfer performance for various vision tasks without fine-tuning. Extensions of CLIP [8, 26, 27] continue to refine this alignment for improved downstream task performance. Building on this foundation, [28] introduced AdaptCLIPZS, a framework that enhances zero-shot classification in fine-grained domains by incorporating detailed, category-specific descriptions generated by LLMs. These descriptions are integrated into context-rich prompts during VLM fine-tuning, consistently improving performance across benchmarks.
Modeling Collaborator (MC) [6] has demonstrated strong results in nuanced and subjective zero-shot classification tasks. Combining Visual-Question-Answering (VQA) with LLMs, MC avoids common large-model hallucinations in subjective tasks by using a series of Yes/No questions derived from the classification concept. These responses are aggregated by an LLM to produce labels that can be directly used or employed in training end classifiers. Unlike manual-label-heavy approaches such as Agile Modeling (AM) [29], MC achieves comparable results with only 100 labeled samples for validation. This framework excels at classifying subjective visual concepts, outperforming traditional zero-shot and AM methods in both accuracy and efficiency.
The rest of the paper is organized as follows; In section 3 we will present the proposed pipelines to detect ephemeral gully. The experimental setup, implementation details and experimental results will be presented in section 4. Then, in sections 5 and 6 we will present a discussion about the experimental results and conclusion of the paper respectively.
3 Proposed Method
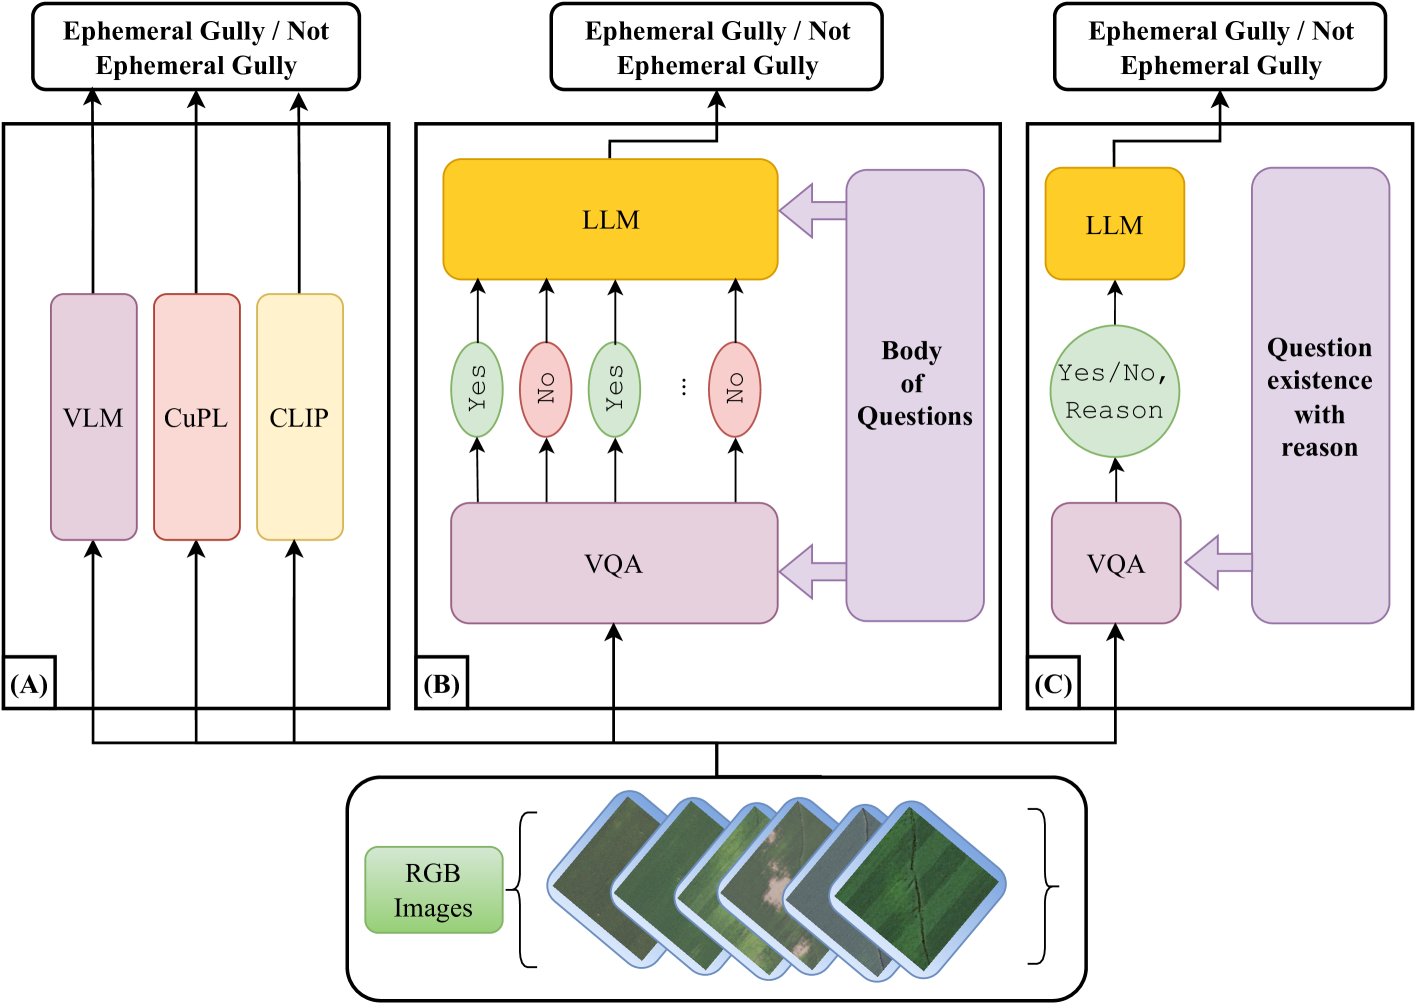
Given a set of RGB images representing temporal images (tile) at one specific location, we create a dataset consisting of locations, in which each location has a true label , determined by a group of soil and plant science experts looking at . Figure 1 shows the three classification pipelines proposed and evaluated in this work, which are presented in the next three sections.
3.1 SOTA Zero-Shot Classification Methods
In the first classification pipeline that acts as the baseline for our application (pipeline A in Figure 1), we will use a variety of zero-shot classification methods, such as CLIP [7], CuPL [8] and multiple VLMs like Llama 3.2 - Vision [9], Qwen [10], and Llava [11])
The remote sensing RGB images are submitted to those models to produce a label for each location . Equation 1 describes this pipeline.
| (1) |
Where is the input prompt to the VLM for detecting ephemeral gullies 111CLIP [7] requires a positive and a negative prompt to produce the label for each . Other VLMs can be prompted directly to produce the label..
3.2 Visual Attributes + Reasoning
Building on [6], the second pipeline proposed and evaluated in this research is designed as an end-to-end process (see pipeline B in Figure 1). This pipeline consists of two key components: 1) Visual Attributes Understanding and 2) Reasoning. The initial step in this pipeline involves identifying distinctive visual attributes of ephemeral gullies to generate a body of questions centered around these attributes. These questions help mitigate hallucinations when using baseline VLMs. The VLM processes the images alongside the generated questions, providing answers based on the image content. In the Reasoning component, these answers are aggregated by an LLM to determine the predicted class.
3.2.1 Visual Attributes Understanding
The goal of the first component of pipeline B is to:
-
1.
Identify specific visual attributes of a formed ephemeral gully.
-
2.
Create a Body of Questions, consisting of Yes/No questions based on the identified visual attributes.
-
3.
Use the VLM to generate answers to based on .
In [8], the authors proposed to use an LLM (e.g. GPT-4 [25]) to produce the specific visual attributes associated with each class. In this work, we use a combination of attributes generated by GPT-4 and visual aspects coming from plant and soil science experts. Once we obtain a set of visually distinguishable attributes for the ephemeral gully class, we build a body of questions in which we have one or more questions targeting each of the attributes.
Once is obtained, answers are generated by a VLM:
| (2) |
Where is the set of answers for all of the Yes/No questions in , based on contents. Subsequently, we can proceed to do reasoning based on given answers to our questions.
3.2.2 Reasoning
In the reasoning component of pipeline B, an LLM model aggregates the answers of and produce the final prediction:
| (3) |
Where is the aggregation prompt, and is the predicted class for .
3.3 A Descriptive Question + Reasoning
The last pipeline investigated in this research involves formulating a descriptive question to be submitted to the VLM for reasoning over the content of image location (refer to pipeline C in Figure 1). Subsequently, an LLM evaluates the provided reasoning to determine its validity and uses it to produce the final label .
3.4 Transfer Learning Using Visual Attributes
For comparison with the previous three proposed pipelines, we devised a non-zero-shot approach based on transfer learning. The rationale for this fourth approach was to contrast zero-shot and non-zero-shot methods with the intent of evaluating the performance of zero-shot methods. This approach uses the answers to questions generated by the VLM as extracted features from the contents of image location . These features are then used as inputs to train a simple Multi Layer Perceptron (MLP) on the development (Dev) set to produce the final label . The results of this approach are compared with the zero-shot methods discussed earlier, demonstrating that the zero-shot algorithms produce similar performance to this learning-based approach.
4 Experimental Setup and Results
As mentioned earlier, the main contribution of our work are: the use of VLMs as zero-shot classification approaches for detecting ephemeral gullies; exploring different types of queries using VQA, and an extensive labeled dataset. In order to evaluate the efficacy of the proposed pipelines and the queries used for VQA, we must address the following questions:
-
1.
How well each pipeline performs the task of ephemeral gully detection?
-
2.
What are the impacts of specific choices of VLMs and LLMs in those pipelines?
-
3.
How the types and number of questions affect the performance of the pipelines?
-
4.
How does the performance of the proposed pipelines compare to a non-zero-shot approach based on transfer learning?
To answer these questions, we conducted the following experiments to establish the validity and reliability of the classification pipeline.
4.1 Evaluation Dataset
We used USDA National Agriculture Imagery Program (NAIP) [30] to gather 6 temporal high-resolution (1m) RGB images for agricultural areas over a period of 10 years. Google Earth Engine [31] was used to access and download the dataset. Once the dataset was obtained, a team of 8 soil and plant science experts labeled each of the areas that showed a sign of ephemeral gully formation. Then, we divided the acquired dataset into two separate Dev and Test sets. Table 1 shows the statistics of the final evaluation dataset, after the labeling process and pruning the outliers. The dataset is available to download through this link: http://vigir.missouri.edu/Research/GullyDetection/.
| Parameter | Dev Set | Test Set |
| Total Number of Locations | 310 | 311 |
| Number of EG-Positive Locations | 177 | 177 |
| Number of EG-Negative Locations | 133 | 134 |
| Number of Images per Location () | 6 | |
| Image Size | 128x128 | |
| Image Spatial Resolution | 1m | |
4.2 Implementation Details
This section provides the implementation details used to answer the research questions, as well as the experimental setups.
4.2.1 Processing the RGB Images Simultaneously
The primary implementation challenge to address was enabling VLMs to process six images as their inputs simultaneously. Since identifying ephemeral gullies relies on temporal information, processing each RGB image independently and aggregating the results is insufficient222This is the default way that CLIP [7] uses to process multiple images.. Moreover, most of the open-source SOTA VLMs used in this study do not natively support multiple images at the time of writing. There are at least two potential solutions for this problem; The first solution involves encoding all six images into the embedding space, concatenating the embeddings, and then supplying the concatenated embedding vector as the conversation context when prompting the VLMs. However, this approach is constrained by the limited context length supported by VLMs—at most 4096 tokens at the time of writing—which makes it impractical to embed multiple separate RGB images.
4.2.2 Body of Questions
As mentioned in section 3.2.1, we are using a combination of GPT-4 [25] and soil and plant science experts to produce the body of questions (). The final is as follows:
4.2.3 Experimental Setups and Model Choices
We utilize LLava [32], Llama 3.2-Vision [9], and Qwen [10] as our VLMs. These models were selected primarily based on their performance on open benchmarks. At the time of writing, Llama 3.2 and Qwen rank among the top models across various vision and language benchmarks. LLava was included to facilitate a comparison between SOTA models and non-SOTA models.
We used Ollama [33] and Hugging Face [34] as our frameworks to interact with the open-source VLMs and LLMs. Table 2 shows the hyperparameters and model choices for the explored methods.
To enable the VLMs to classify the presence of ephemeral gullies within a specific agricultural area, we used two different prompts for pipelines A, and C:
4.3 Experimental Results
To evaluate the performance of the classification pipelines and to address research questions (1) and (2), we conducted experiments measuring the accuracy of each pipeline on the test set and analyzed the impact of different model choices for VLMs and LLMs. Additionally, to address question (4), we trained a simple MLP on the Dev set to aggregate answers from the VQA step, with results presented in Table 3. Given the dataset’s imbalance in positive and negative images, relying solely on the F1 score could be misleading; therefore, we included the Macro F1 score in Table 3 to reflect a class-averaged evaluation.
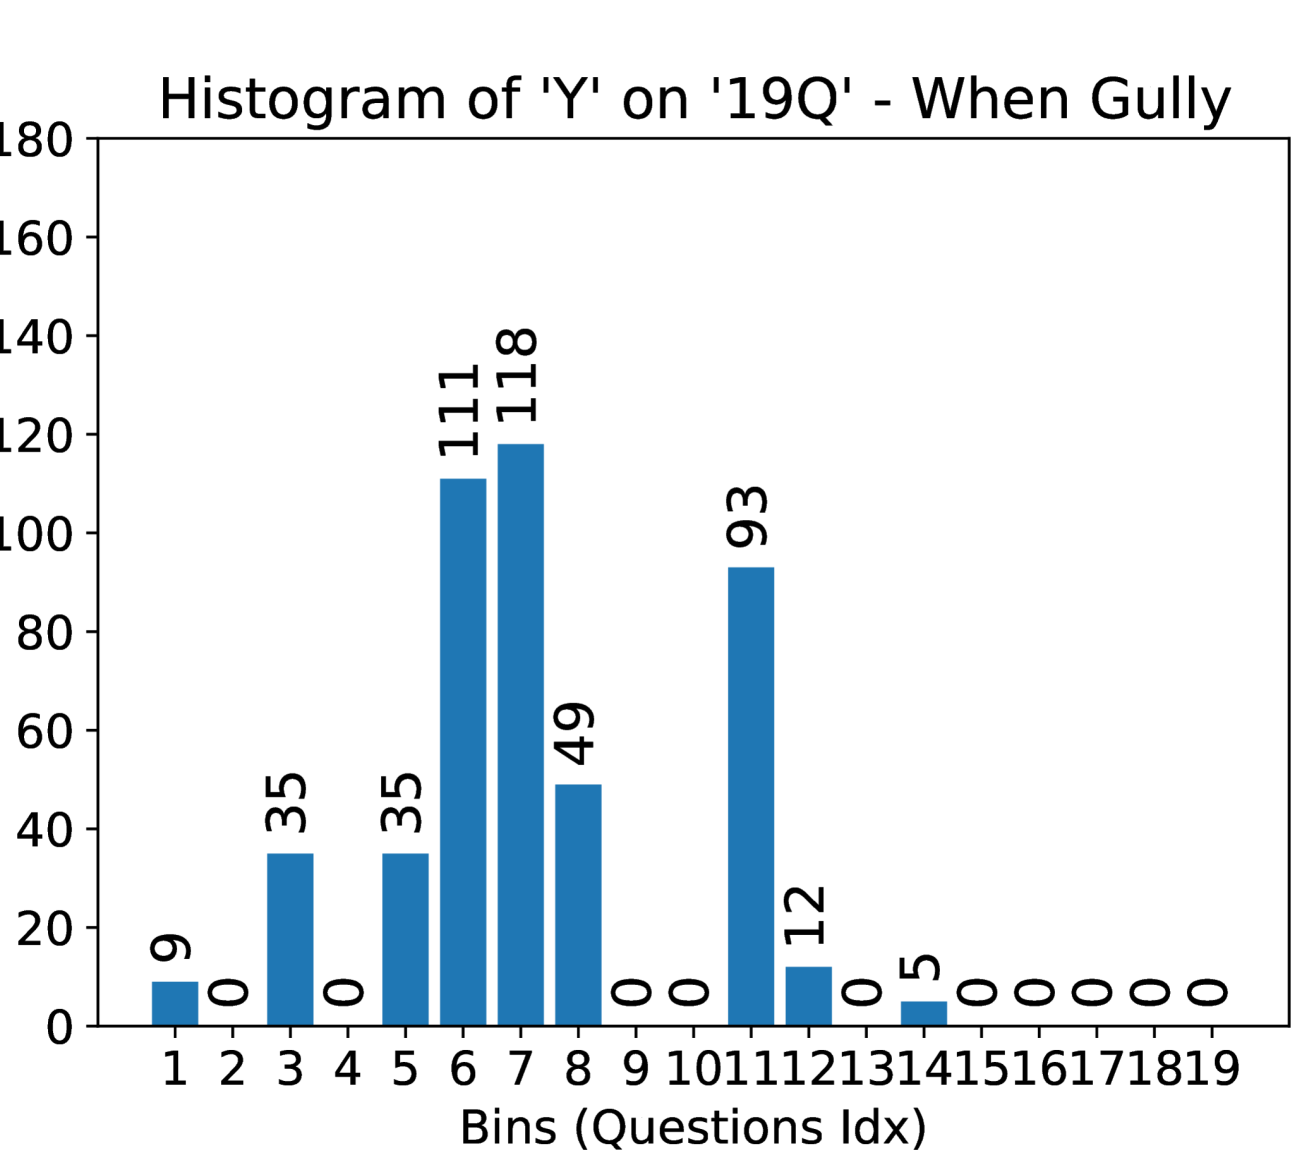
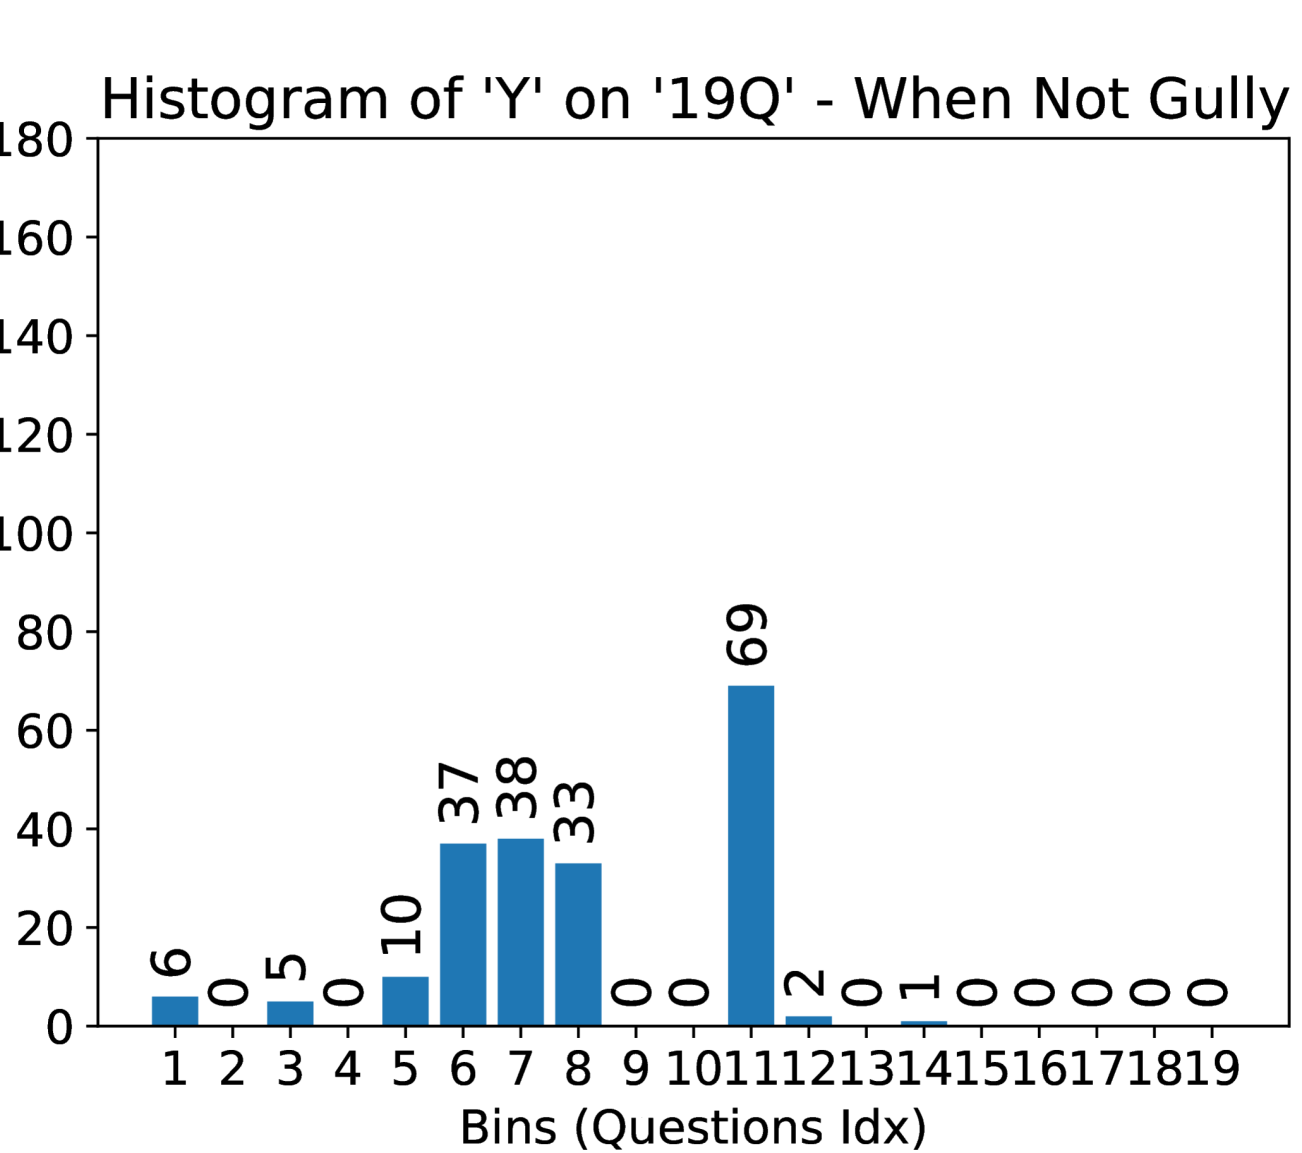
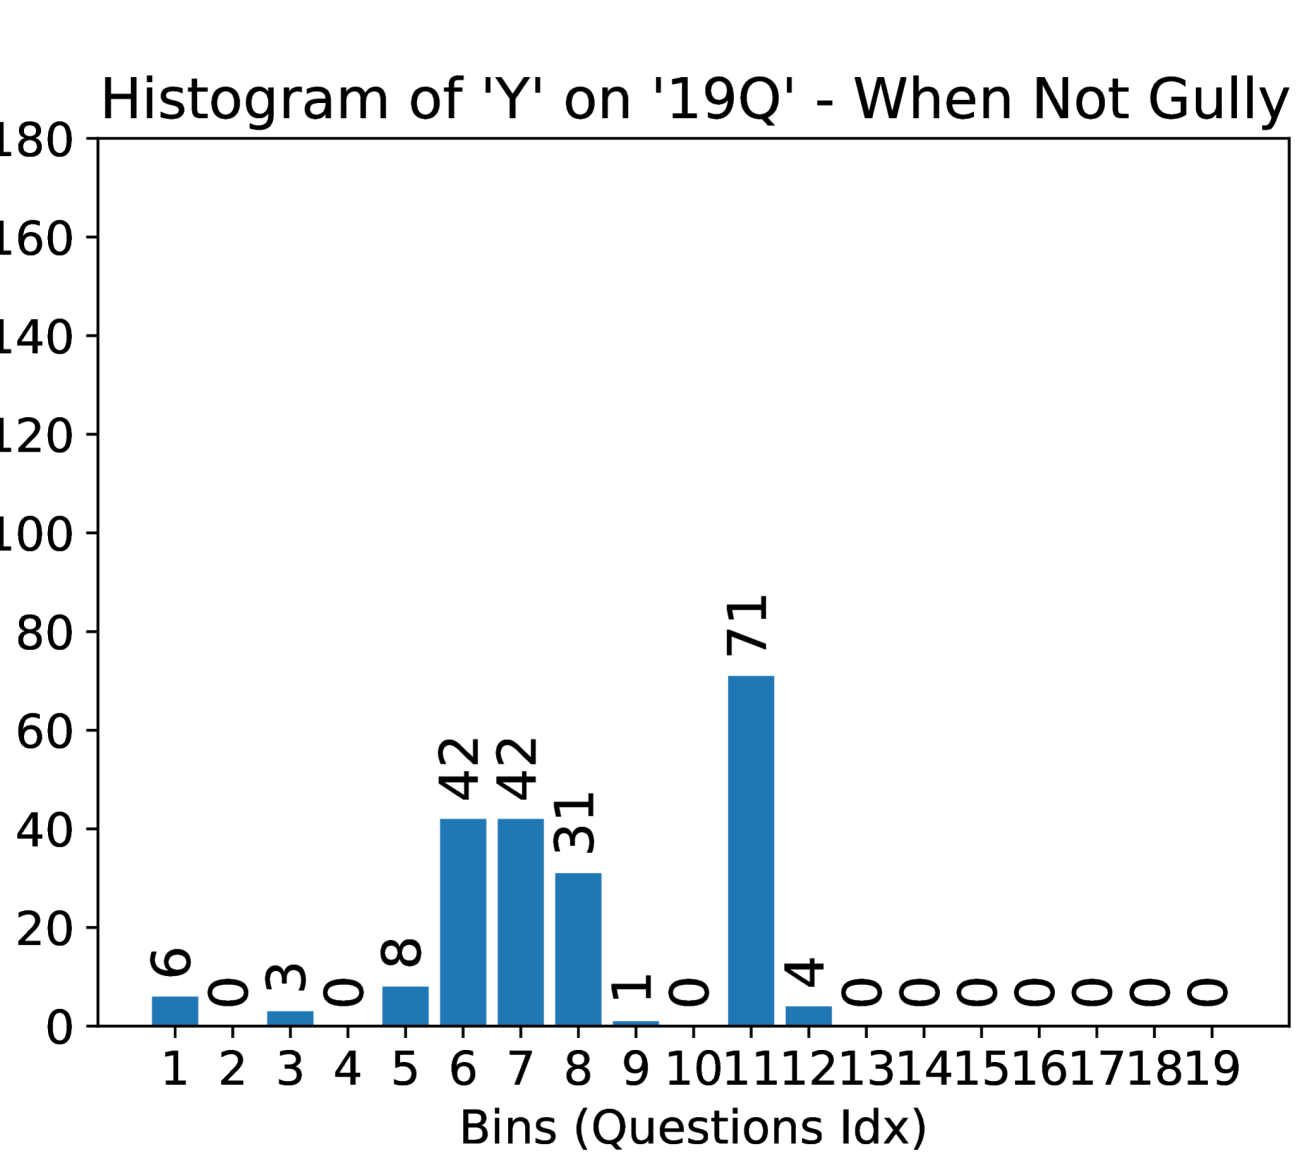
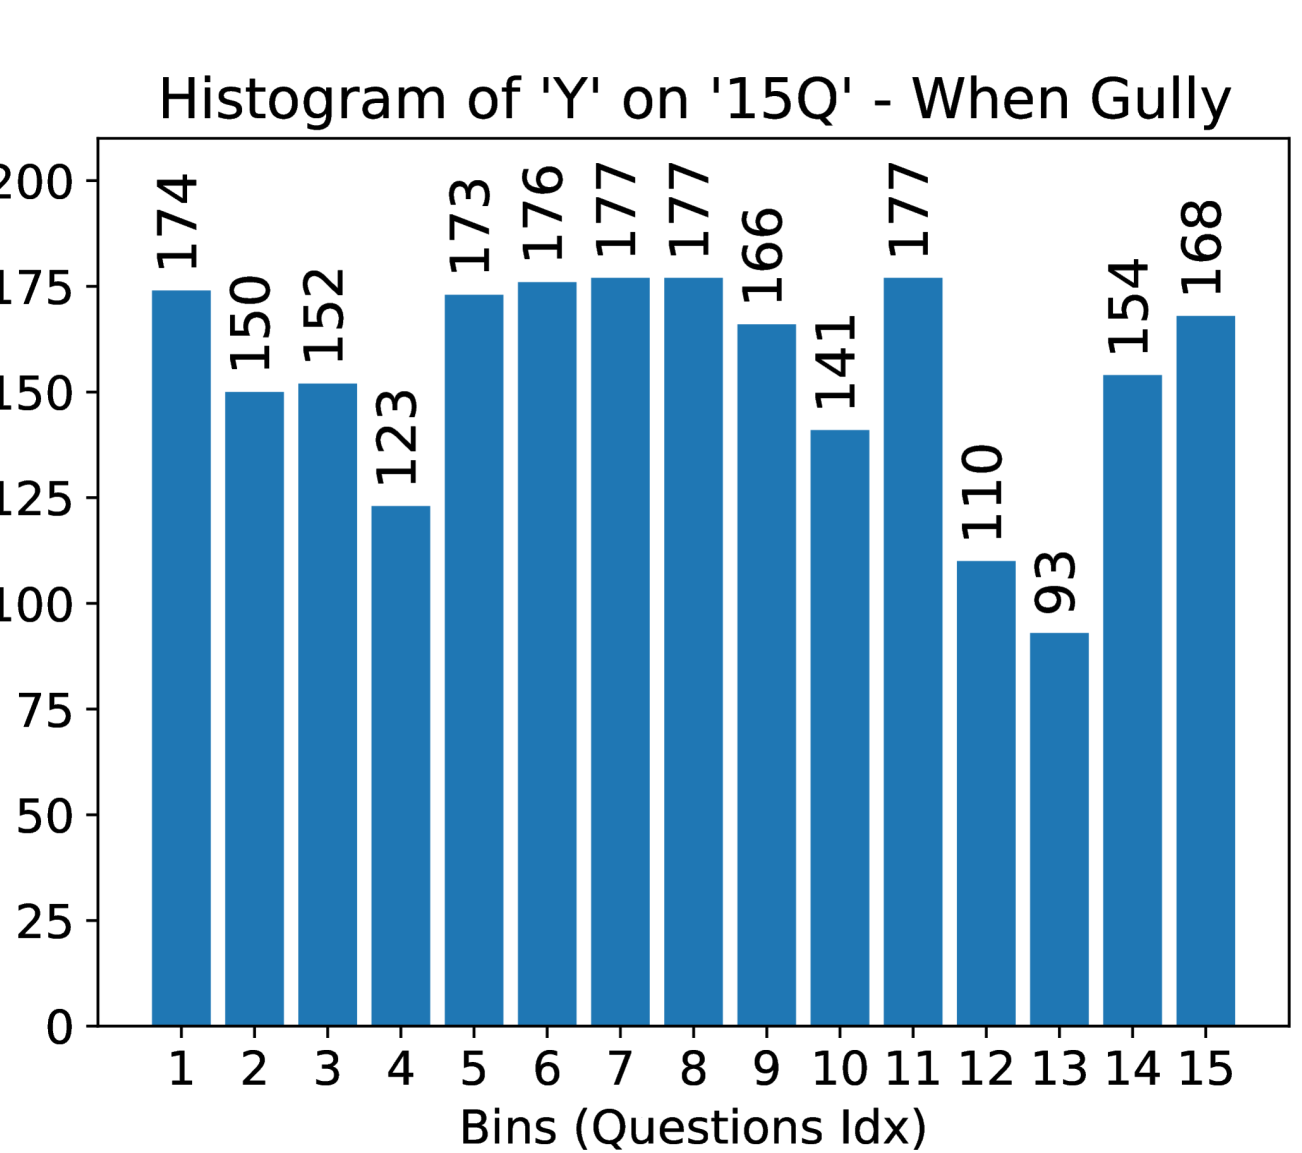
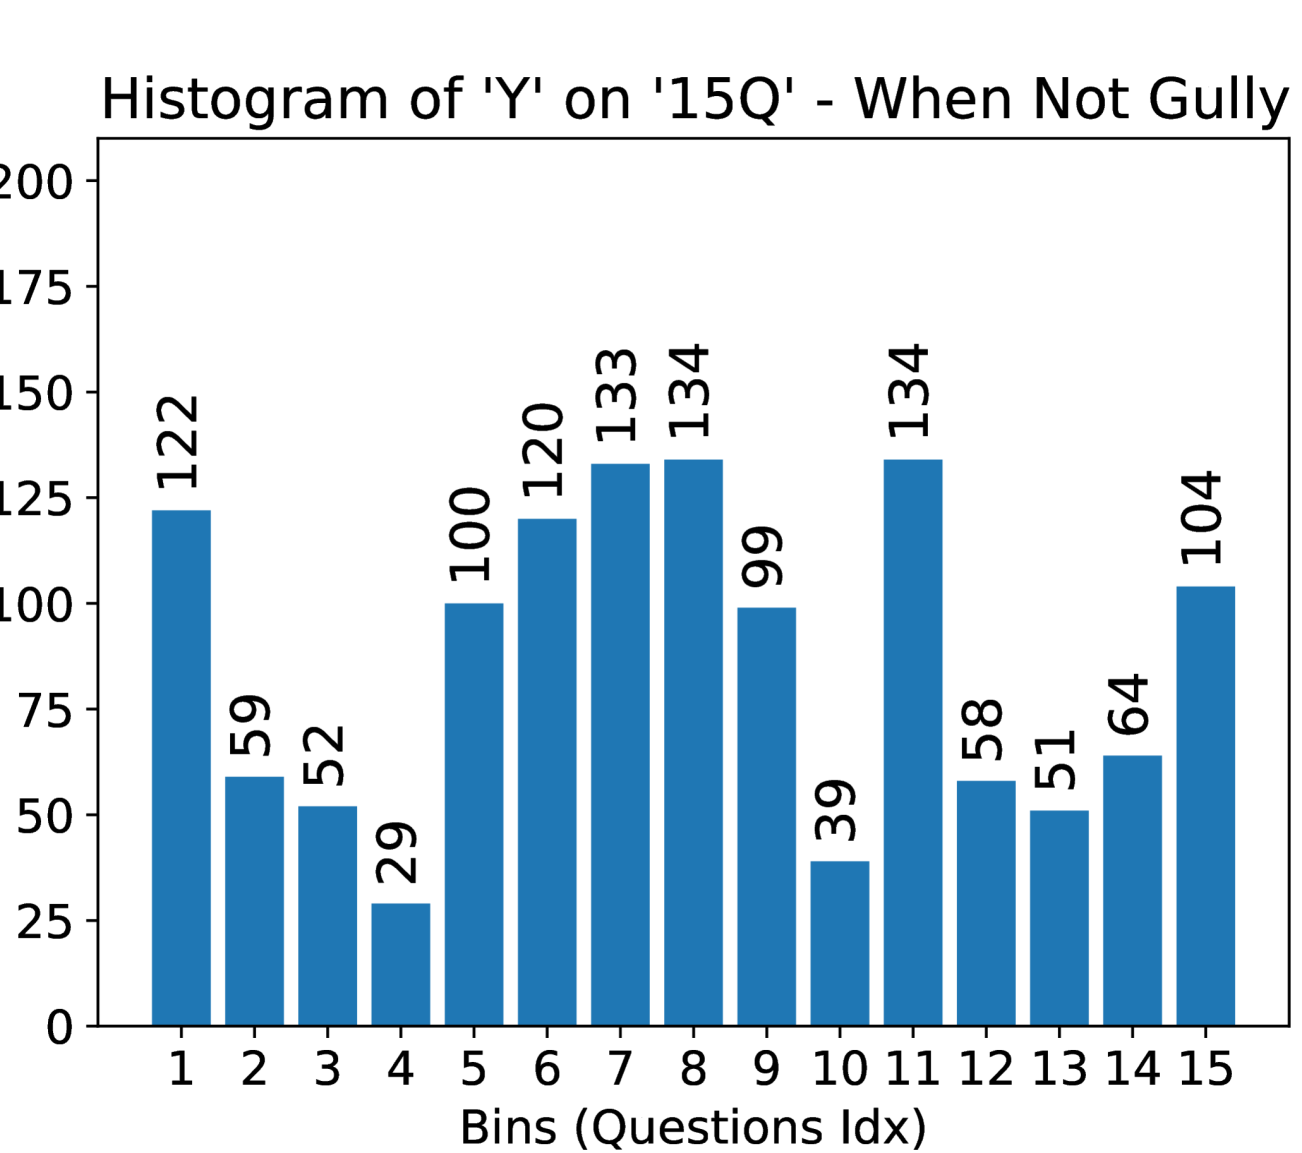
To address research question (3), we performed two additional experiments. First, an expert ranked questions in by their relevance for distinguishing ephemeral gullies, creating subsets of 3, 6, 9, 12, 15, and 18 questions, with their indices listed in Table 4. Second, a hyperparameter optimization framework (Optuna [35]) was used to identify the optimal set of questions for improving pipeline B. Performance results for these experiments are summarized in Table 5. To further analyze the decision-making process, a histogram in Figure 2 illustrates the frequency of ”Yes” responses for each question across positive and negative test and Dev sets.
| P# | VLM | LLM | Experiment | TP | FP | FN | TN | Prec. | Rec. | Acc. | F1 (G) | F1 (NG) | Macro F1 |
| Input = Collage of 6 Temporal Aerial Images | |||||||||||||
| (A) | CuPL | - | CuPL (GPT4-Prompts) | 9 | 4 | 168 | 130 | 0.692 | 0.051 | 0.447 | 0.095 | 0.602 | 0.348 |
| (A) | CLIP | - | CLIP (Pos/Neg) | 134 | 90 | 43 | 44 | 0.598 | 0.757 | 0.572 | 0.668 | 0.398 | 0.533 |
| (A) | Llava-Llama3-8b | - | VQA (1Y/N - Q&A) | 22 | 20 | 155 | 114 | 0.524 | 0.124 | 0.437 | 0.201 | 0.566 | 0.383 |
| (A) | Llama3.2-90b | - | VQA (1Y/N - Q&A) | 146 | 103 | 31 | 31 | 0.586 | 0.825 | 0.569 | 0.685 | 0.316 | 0.501 |
| (A) | Qwen2-VL-72B | - | VQA (1Y/N - Q&A) | 167 | 79 | 10 | 55 | 0.679 | 0.944 | 0.714 | 0.790 | 0.553 | 0.671 |
| (B) | Llava-Llama3-8b | Llama3.2 | VQA(15Y/N - Q&A) | 177 | 134 | 0 | 0 | 0.569 | 1.000 | 0.569 | 0.725 | 0.000 | 0.363 |
| (B) | Qwen2-VL-72B | Llama3.2 | VQA(15Y/N - Q&A) | 173 | 103 | 4 | 31 | 0.627 | 0.977 | 0.656 | 0.764 | 0.367 | 0.565 |
| (B) | Llama3.2-Vision | Qwen2 | VQA(15Y/N - Q&A) | 25 | 7 | 152 | 127 | 0.781 | 0.141 | 0.489 | 0.239 | 0.615 | 0.427 |
| (B) | Qwen2-VL-72B | Llama3.2 | VQA(15Y/N - Q&A) | 177 | 134 | 0 | 0 | 0.569 | 1.000 | 0.569 | 0.725 | 0.000 | 0.363 |
| (B) | Llama3.2-90b | Llama3.2 | VQA(15Y/N - Q&A) | 110 | 44 | 67 | 90 | 0.714 | 0.621 | 0.643 | 0.665 | 0.619 | 0.642 |
| (C) | Llava-Llama3-8b | Llama3.2 | VQA (1Q + Reason) | 177 | 134 | 0 | 0 | 0.569 | 1.000 | 0.569 | 0.725 | 0.000 | 0.363 |
| (C) | Llama3.2-90b | Llama3.2 | VQA (1Q + Reason) | 130 | 101 | 47 | 33 | 0.563 | 0.734 | 0.524 | 0.637 | 0.308 | 0.473 |
| (TL) | Llama3.2-90b | - | VQA(15Y/N) + MLP | 117 | 50 | 60 | 84 | 0.701 | 0.661 | 0.646 | 0.680 | 0.604 | 0.642 |
| Experiment | Question Indices |
|---|---|
| VQA(3Y/N - Q&A + LLM) | 2, 3, 14 |
| VQA(6Y/N - Q&A + LLM) | 2, 3, 14, 5, 4, 6 |
| VQA(9Y/N - Q&A + LLM) | 2, 3, 14, 5, 4, 6, 9, 11, 13 |
| VQA(12Y/N - Q&A + LLM) | 2, 3, 14, 5, 4, 6, 9, 11, 13, 8, 10, 7 |
| VQA(15Y/N - Q&A + LLM) | 2, 3, 14, 5, 4, 6, 9, 11, 13, 8, 10, 7, 1, 12, 15 |
| VQA(18Y/N - Q&A + LLM) | 2, 3, 14, 5, 4, 6, 9, 11, 13, 8, 10, 7, 1, 12, 15, 16, 17, 18 |
| Model | Experiment | TP | FP | FN | TN | Prec. | Rec. | Acc. | F1 (G) | F1 (NG) | Macro F1 |
| Collage of 6 Temporal Aerial Images | |||||||||||
| Ours (Llama3.2-90b) | VQA(3Y/N - Q&A + LLM) | 29 | 3 | 148 | 131 | 0.906 | 0.164 | 0.514 | 0.278 | 0.634 | 0.456 |
| Ours (Llama3.2-90b) | VQA(6Y/N - Q&A + LLM) | 40 | 9 | 137 | 125 | 0.816 | 0.226 | 0.531 | 0.354 | 0.631 | 0.493 |
| Ours (Llama3.2-90b) | VQA(9Y/N - Q&A + LLM) | 37 | 9 | 140 | 125 | 0.804 | 0.209 | 0.521 | 0.332 | 0.627 | 0.479 |
| Ours (Llama3.2-90b) | VQA(12Y/N - Q&A + LLM) | 111 | 44 | 66 | 90 | 0.716 | 0.627 | 0.646 | 0.669 | 0.621 | 0.645 |
| Ours (Llama3.2-90b) | VQA(15Y/N - Q&A + LLM) | 110 | 44 | 67 | 90 | 0.714 | 0.621 | 0.643 | 0.665 | 0.619 | 0.642 |
| Ours (Llama3.2-90b) | VQA(18Y/N - Q&A + LLM) | 37 | 10 | 140 | 124 | 0.787 | 0.209 | 0.518 | 0.330 | 0.623 | 0.477 |
| Optuna (Llama3.2-90b) | VQA(4Y/N - Q&A + LLM) | 110 | 44 | 67 | 90 | 0.714 | 0.621 | 0.643 | 0.665 | 0.619 | 0.642 |
| 4Y/N: (3,6,7,12) | |||||||||||
5 Discussion
5.1 Performance of The Classification Pipelines
Both CLIP and CuPL presented difficulty detecting ephemeral gullies (Table 3). This was expected given the limited representation of remote sensing images with delineated ephemeral gullies in their pre-training datasets. CuPL, which builds on CLIP, inherited the same challenges in distinguishing ephemeral gullies. Similarly, Llava and Llama 3.2-Vision performed poorly in pipeline A due to biases in their classification behavior. Llava classified most areas as negatives, yielding a low F1 score for the EG-positive class, while Llama 3.2-Vision labeled most locations as EG-positive, reducing the F1 score for the EG-negative class. Both models exhibited low Macro F1 scores, highlighting the importance of pre-training datasets in zero-shot classification methods, as these datasets lacked sufficient information about ephemeral gullies’ visual characteristics.
In contrast, Qwen2-VL demonstrated strong performance in pipeline A, suggesting that its pre-training dataset contained richer information about ephemeral gullies. We have also achieved promising results in pipeline B, particularly when using Llama 3.2-Vision as the VLM and Llama 3.2 as the LLM, performing comparably to Qwen2 in pipeline A. However, substituting either the VLM or LLM with Qwen2 reduced performance, as discussed in Section 5.3. Pipeline C did not surpass the performance of pipeline A, indicating that prompting VLMs to reason about their decisions may exacerbate hallucination rather than mitigate it. Additionally, a transfer learning-based method failed to outperform zero-shot classifiers in pipeline A (with Qwen2-VL) and pipeline B (with Llama 3.2 - Vision), suggesting that zero-shot methods are particularly effective for detecting ephemeral gullies in data-limited scenarios.
5.2 Importance of Questions in Pipeline (B)
Figure 2 illustrates the frequency of ”Yes” responses for each question across EG-positive and EG-negative locations. The histogram reveals that not all questions significantly impact the decision-making process, which aligned with our expectations. This is because the questions, generated using expert input and GPT-4 knowledge, do not always correspond to visual features that VLMs can reliably interpret. A subset of the questions likely contributes more meaningfully to the results, leading to a series of experiments with different subsets of questions (Table 5). Performance improved as the number of questions increased, introducing critical visual attributes—up to a certain point. Beyond 12 questions, performance began to plateau, with a slight drop observed from 12 to 15 questions, and a significant decline from 15 to 18 questions.
This behavior can be attributed to two factors. First, as the number of questions grows, redundancy becomes more likely, leading to inconsistent answers that confuse the LLM during aggregation. Second, the increased number of questions raises the potential for conflicts among them, complicating the decision-making process. To address this, Optuna was used to identify the most influential questions. Remarkably, using just the four key questions identified by Optuna produced the same results as using 15 questions, demonstrating the effectiveness of optimizing the question set for better performance (Table 5). This is a clear advantage of our pipeline over other VQA-based classification approaches like MC [6].
5.3 Qwen2-VL vs. Llama3.2-Vision
Both Qwen2-VL and Llama 3.2-Vision showed strong performance in ephemeral gully detection tasks, but their strengths varied depending on the part of the pipeline they were used in (Table 3). Qwen2-VL excelled in pipeline A, demonstrating a robust ability to directly detect ephemeral gullies. Its superior visual understanding aligned with benchmarks [36], which consistently rank Qwen2-VL above other open-source VLMs in visual comprehension. However, its language abilities lagged behind those of Llama 3.2, which makes the latter more effective in tasks requiring nuanced language reasoning.
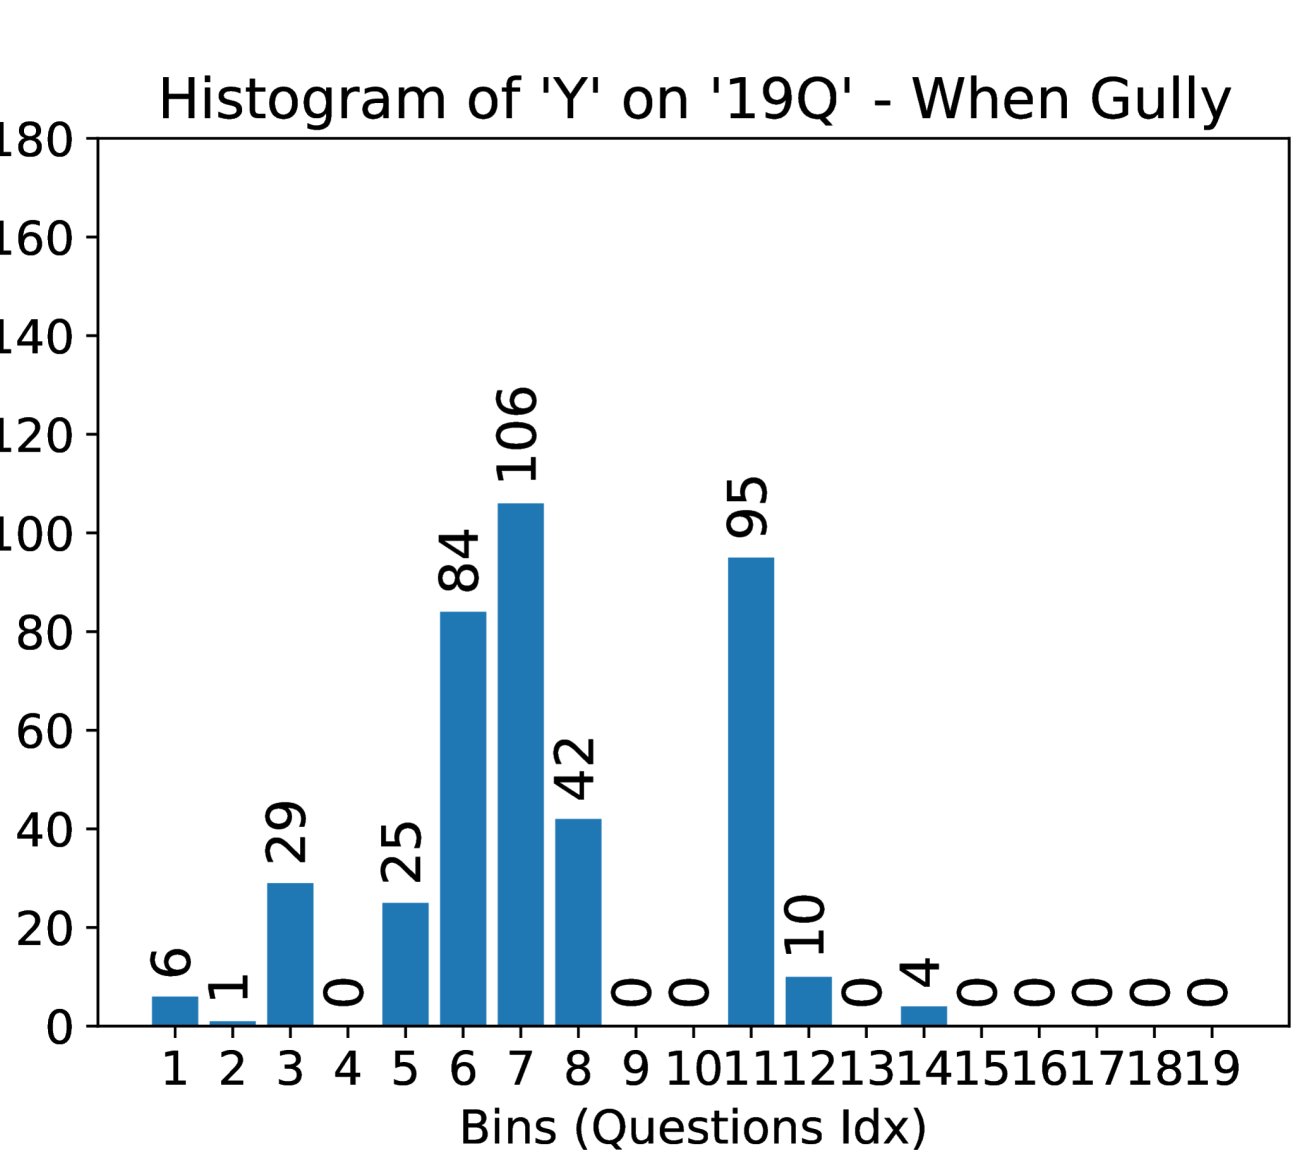
Llama 3.2’s linguistic proficiency enhanced its performance as an aggregator LLM, as shown in Table 3. Its superior language comprehension enabled it to generate better answers to the body of questions, making it a more effective VQA system. Conversely, Qwen2-VL’s answer histograms (Figure 3) revealed a tendency to respond ”Yes” to most questions, especially the key questions identified by Optuna [35], regardless of context. This overgeneralization limited its ability to distinguish between EG-positive and EG-negative tiles, often leading to the incorrect labeling of all tiles as positive.
5.4 Practical Implications and Future Works
The proposed pipelines demonstrated reliable and robust results; however, challenges remain that need to be addressed for their successful deployment in agricultural applications and real-world scenarios. In practical contexts, false negative classifications pose a greater concern than false positives, as missing ephemeral gullies in agricultural fields can lead to significant issues. To enhance the effectiveness of the proposed pipelines, improving their sensitivity (F1 (G)) to the presence of ephemeral gullies is crucial. Future research could explore the fine-tuning of Vision-Language Models (VLMs) to provide better and more robust vision and language understanding in this specific context, thereby improving the pipeline’s overall performance and reliability.
6 Conclusion
This study introduced the first stand-alone pipeline to detect ephemeral gullies and an evaluation dataset labeled by experts. Our results demonstrate that VLM-based zero-shot classification methods, particularly those using Qwen2-VL and Llama 3.2 - Vision, were effective in detecting ephemeral gullies. While Qwen2-VL excelled in visual understanding, Llama 3.2 - Vision’s language abilities made it a stronger aggregator in question-based methods. We observed that the number and quality of questions significantly impacted performance, with redundancy and conflicts in larger question sets leading to diminished results. Transfer learning approaches also provided similar, and in some cases lower performance compared to zero-shot methods that suggests the reliability and versatility of the proposed detection pipeline.
7 Acknowledgment
Computational resources for this research have been supported by the NSF National Research Platform, as part of GP-ENGINE (award OAC #2322218)
References
- [1] J. Poesen, “Soil erosion in the anthropocene: Research needs,” Earth Surface Processes and Landforms, vol. 43, no. 1, pp. 64–84, 2018.
- [2] B. Liu, B. Zhang, H. Feng, S. Wu, J. Yang, Y. Zou, and K. H. Siddique, “Ephemeral gully recognition and accuracy evaluation using deep learning in the hilly and gully region of the loess plateau in china,” International Soil and Water Conservation Research, vol. 10, no. 3, pp. 371–381, 2022.
- [3] H. Guo, X. Su, C. Wu, B. Du, L. Zhang, and D. Li, “Remote sensing chatgpt: Solving remote sensing tasks with chatgpt and visual models,” 2024.
- [4] W. Xu, Z. Yu, Y. Wang, J. Wang, and M. Peng, “Rs-agent: Automating remote sensing tasks through intelligent agents,” 2024.
- [5] L. P. Osco, E. L. de Lemos, W. N. Gonçalves, A. P. M. Ramos, and J. M. Junior, “The potential of visual chatgpt for remote sensing,” 2023.
- [6] I. E. Toubal, A. Avinash, N. G. Alldrin, J. Dlabal, W. Zhou, E. Luo, O. Stretcu, H. Xiong, C.-T. Lu, H. Zhou, et al., “Modeling collaborator: Enabling subjective vision classification with minimal human effort via llm tool-use,” in Proceedings of the IEEE/CVF Conference on Computer Vision and Pattern Recognition, pp. 17553–17563, 2024.
- [7] A. Radford, J. W. Kim, C. Hallacy, A. Ramesh, G. Goh, S. Agarwal, G. Sastry, A. Askell, P. Mishkin, J. Clark, et al., “Learning transferable visual models from natural language supervision,” in International conference on machine learning, pp. 8748–8763, PMLR, 2021.
- [8] S. Pratt, I. Covert, R. Liu, and A. Farhadi, “What does a platypus look like? generating customized prompts for zero-shot image classification,” in Proceedings of the IEEE/CVF International Conference on Computer Vision, pp. 15691–15701, 2023.
- [9] H. Touvron, T. Lavril, G. Izacard, X. Martinet, M.-A. Lachaux, T. Lacroix, B. Roziere, N. Goyal, E. Hambro, F. Azhar, et al., “Llama: Open and efficient foundation language models,” arXiv preprint arXiv:2302.13971, 2023.
- [10] J. Bai, S. Bai, Y. Chu, Z. Cui, K. Dang, X. Deng, Y. Fan, W. Ge, Y. Han, F. Huang, et al., “Qwen technical report,” arXiv preprint arXiv:2309.16609, 2023.
- [11] H. Liu, C. Li, Q. Wu, and Y. J. Lee, “Visual instruction tuning,” in Advances in Neural Information Processing Systems (NeurIPS), 2023.
- [12] W. Dai, G. Hu, X. Yang, X.-W. Yang, Y.-H. Cheng, L. Xiong, J. Strobl, and G. Tang, “Identifying ephemeral gullies from high-resolution images and dems using flow-directional detection,” Journal of Mountain Science, vol. 17, p. 3024–3038, 12 2020.
- [13] C. Karydas and P. Panagos, “Towards an assessment of the ephemeral gully erosion potential in greece using google earth,” Water, vol. 12, no. 2, 2020.
- [14] B. Liu, B. Zhang, Z. Yin, B. Hao, S. Wu, H. Feng, and K. H. M. Siddique, “Ephemeral gully development in the hilly and gully region of china’s loess plateau,” Land Degradation & Development, vol. 35, no. 1, pp. 128–141, 2024.
- [15] B. Liu, Z. Chen, B. Li, S. Wu, H. Feng, X. Gao, and K. H. Siddique, “Modeling of driving factors and headcut rates of ephemeral gullies in the loess plateau of china using high-resolution remote sensing images,” International Journal of Digital Earth, vol. 17, no. 1, p. 2369632, 2024.
- [16] D. A. Reece, J. A. Lory, T. L. Haithcoat, B. K. Gelder, and R. Cruse, “Using google earth imagery to target assessments of ephemeral gully erosion,” 2023.
- [17] A. Y. Sheshukov, L. Sekaluvu, and S. L. Hutchinson, “Accuracy of topographic index models at identifying ephemeral gully trajectories on agricultural fields,” Geomorphology, vol. 306, pp. 224–234, 2018.
- [18] X. Yang, W. Dai, G. Tang, and M. Li, “Deriving ephemeral gullies from vhr image in loess hilly areas through directional edge detection,” ISPRS International Journal of Geo-Information, vol. 6, no. 11, 2017.
- [19] B. Liu, B. Zhang, H. Feng, S. Wu, J. Yang, Y. Zou, and K. H. Siddique, “Ephemeral gully recognition and accuracy evaluation using deep learning in the hilly and gully region of the loess plateau in china,” International Soil and Water Conservation Research, vol. 10, no. 3, pp. 371–381, 2022.
- [20] A. Krizhevsky, I. Sutskever, and G. E. Hinton, “Imagenet classification with deep convolutional neural networks,” Advances in neural information processing systems, vol. 25, 2012.
- [21] O. Ronneberger, P. Fischer, and T. Brox, “U-net: Convolutional networks for biomedical image segmentation,” in Medical image computing and computer-assisted intervention–MICCAI 2015: 18th international conference, Munich, Germany, October 5-9, 2015, proceedings, part III 18, pp. 234–241, Springer, 2015.
- [22] H. Liu, C. Li, Y. Li, and Y. J. Lee, “Improved baselines with visual instruction tuning,” in Proceedings of the IEEE/CVF Conference on Computer Vision and Pattern Recognition, pp. 26296–26306, 2024.
- [23] W.-L. Chiang, Z. Li, Z. Lin, Y. Sheng, Z. Wu, H. Zhang, L. Zheng, S. Zhuang, Y. Zhuang, J. E. Gonzalez, I. Stoica, and E. P. Xing, “Vicuna: An open-source chatbot impressing gpt-4 with 90%* chatgpt quality,” March 2023.
- [24] B. Peng, C. Li, P. He, M. Galley, and J. Gao, “Instruction tuning with gpt-4,” arXiv preprint arXiv:2304.03277, 2023.
- [25] J. Achiam, S. Adler, S. Agarwal, L. Ahmad, I. Akkaya, F. L. Aleman, D. Almeida, J. Altenschmidt, S. Altman, S. Anadkat, et al., “Gpt-4 technical report,” arXiv preprint arXiv:2303.08774, 2023.
- [26] Z. Sun, Y. Fang, T. Wu, P. Zhang, Y. Zang, S. Kong, Y. Xiong, D. Lin, and J. Wang, “Alpha-clip: A clip model focusing on wherever you want,” in Proceedings of the IEEE/CVF Conference on Computer Vision and Pattern Recognition, pp. 13019–13029, 2024.
- [27] L. H. Li, P. Zhang, H. Zhang, J. Yang, C. Li, Y. Zhong, L. Wang, L. Yuan, L. Zhang, J.-N. Hwang, et al., “Grounded language-image pre-training,” in Proceedings of the IEEE/CVF Conference on Computer Vision and Pattern Recognition, pp. 10965–10975, 2022.
- [28] O. Saha, G. Van Horn, and S. Maji, “Improved zero-shot classification by adapting vlms with text descriptions,” in Proceedings of the IEEE/CVF Conference on Computer Vision and Pattern Recognition, pp. 17542–17552, 2024.
- [29] O. Stretcu, E. Vendrow, K. Hata, K. Viswanathan, V. Ferrari, S. Tavakkol, W. Zhou, A. Avinash, E. Luo, N. G. Alldrin, et al., “Agile modeling: From concept to classifier in minutes,” in Proceedings of the IEEE/CVF International Conference on Computer Vision, pp. 22323–22334, 2023.
- [30] U.S. Department of Agriculture, Farm Service Agency, “National Agriculture Imagery Program (NAIP),” 2024.
- [31] N. Gorelick, M. Hancher, M. Dixon, S. Ilyushchenko, D. Thau, and R. Moore, “Google earth engine: Planetary-scale geospatial analysis for everyone,” Remote Sensing of Environment, 2017.
- [32] L. Li, Y. Yin, S. Li, L. Chen, P. Wang, S. Ren, M. Li, Y. Yang, J. Xu, X. Sun, et al., “M 3 it: A large-scale dataset towards multi-modal multilingual instruction tuning,” arXiv preprint arXiv:2306.04387, 2023.
- [33] Ollama, “Ollama github repository.” https://github.com/ollama/ollama.
- [34] T. Wolf, “Huggingface’s transformers: State-of-the-art natural language processing,” arXiv preprint arXiv:1910.03771, 2019.
- [35] T. Akiba, S. Sano, T. Yanase, T. Ohta, and M. Koyama, “Optuna: A next-generation hyperparameter optimization framework,” in Proceedings of the 25th ACM SIGKDD International Conference on Knowledge Discovery and Data Mining, 2019.
- [36] O. Contributors, “Opencompass: A universal evaluation platform for foundation models.” https://github.com/open-compass/opencompass, 2023.