Tracks to Modernity: Railroads, Growth, and Social Movements in Denmark∗
Tom Görges, TU Dortmund University
Magnus Ørberg Rove, University of Copenhagen
Paul Sharp, University of Southern Denmark
Christian Vedel,1 University of Southern Denmark
Abstract
-
How do transport infrastructures shape economic transformation and social change? We examine the impact of railway expansion in nineteenth-century Denmark on local population growth, occupational shifts, and the diffusion of ideas. Using a historical panel dataset and a difference-in-differences approach, we document that railway access significantly increased population growth and accelerated structural change. Moreover, railway-connected areas were more likely to establish key institutions linked to civic engagement and the cooperative movement. These findings suggest that improved market access was not only a driver of economic modernization but also a catalyst for institutional and cultural transformation.
JEL codes: N73, N93, O18, R42
Keywords: Railways, Economic Development, Institutional Change
∗We would like to thank Christian Nielsen for conscientious RA work. We want to thank Nina Boberg-Fazlic for valuable feedback. This project was presented at the 2023 HEDG Miniworkshop (SDU) and the 5th Annual Meeting of the Scandinavian Society for Economic and Social History (Oslo BI), Microdata in Economic History (CES Munich), the Rome Workshop on Transport and History (Rome, Tor Vergata). We would like to thank every participant at these events for insightful questions and comments. The codebase behind this paper as well as the paper itself benefited from improvements suggested by ChatGPT.
All code to reproduce all the steps from raw data to the final regressions is available at
https://github.com/christianvedels/Tracks_to_modernity
1 Corresponding author: Christian Vedel, christian-vs@sam.sdu.dk
1 Introduction
In the late nineteenth century, Denmark underwent a profound transformation. Once a largely agrarian economy, the country rapidly industrialized and developed inclusive institutions that laid the foundation for its modern prosperity. A central driver of this transformation was the cooperative movement, particularly in dairy production, which revolutionized agricultural productivity and created a model of collective economic organization that persisted into the twentieth century (Lampe \BBA Sharp, \APACyear2018; Boberg-Fazlic \BOthers., \APACyear2023). But what made this development possible? While existing research has highlighted the importance of factors such as access to capital, technological innovation, and institutional frameworks, a crucial piece of the puzzle remains underexplored: the role of railways. Did railway expansion merely facilitate economic growth, or did it also serve as a catalyst for deeper institutional and cultural shifts?
The present work examines whether railways not only promoted economic expansion but also played a fundamental role in shaping Denmark’s institutional landscape. Specifically, we ask: Did the expansion of Denmark’s railway network in the nineteenth century contribute to both economic development and the spread of institutions, particularly assembly houses and folk high schools? These institutions, closely linked to the Grundtvigian movement, a revivalist Lutheran movement central to Danish national identity (Bentzen \BOthers., \APACyear2023, \APACyear2024), played a critical role in fostering civic engagement, education, and collective decision-making — key prerequisites for the rise of cooperative enterprises. By analyzing the link between railway access, development, and the emergence of these institutions, we provide new insights into how infrastructure development shaped both markets and ideas.
To answer this question, we employ a historical panel dataset that links railway expansion to economic and cultural outcomes at the parish level. We use a difference-in-differences framework to estimate the causal effect of railway access on population growth, occupational structure, and the spread of assembly houses and folk high schools. Recognizing concerns about heterogeneous treatment effects and staggered adoption, we apply the method of Callaway \BBA Sant’Anna (\APACyear2021) to ensure that our estimates accurately capture the impact of rail connectivity over time.
Our results show that railway expansion had a significant and persistent impact on economic and social outcomes. First, we find that parishes connected to the railway experienced substantial population growth, confirming findings from other contexts, such as Sweden (Berger \BBA Enflo, \APACyear2017) and Prussia (Hornung, \APACyear2015), where railways drove long-term demographic shifts. This growth was not merely a matter of redistribution; railway access also accelerated structural change, increased employment in manufacturing and other non-agricultural sectors, consistent with evidence from England and Wales (Bogart \BOthers., \APACyear2022) and the United States (Donaldson \BBA Hornbeck, \APACyear2016; Atack \BOthers., \APACyear2011; Hornbeck \BBA Rotemberg, \APACyear2024).
Second, we document a strong relationship between railway access and the spread of Grundtvigian institutions. Assembly houses and folk high schools - key venues for political discourse and collective organization - were significantly more likely to emerge in railway-connected parishes. This aligns with research showing that railways facilitated the diffusion of social movements, such as the temperance movement in the U.S. (García-Jimeno \BOthers., \APACyear2022) and grassroots political mobilization in Sweden (Melander, \APACyear2020). Our findings suggest that, beyond economic integration, railways also played a role in fostering civic participation and new institutional forms.
Our study contributes to several strands of literature. First, it builds on the extensive research on railways and economic development by showing that their impact extended beyond market access and trade expansion to shaping institutional change. While prior work has emphasized the role of railways in industrialization (Atack \BOthers., \APACyear2011, \APACyear2022), we highlight their role in fostering the social infrastructure necessary for Denmark’s cooperative movement. Second, we contribute to the literature on social movements and political change by demonstrating that physical infrastructure can serve as a conduit for ideological diffusion. Finally, our findings contribute to the broader literature on economic history by providing empirical evidence on the long-debated relationship between market access, institutional development, and economic modernization.
The paper proceeds as follows. Section 2 reviews the related literature, situating our study within the broader research on railways, economic development, and institutional change. Section 3 outlines the conceptual framework, illustrating the mechanisms through which railway expansion influenced both economic growth and the spread of Grundtvigian institutions and why this is important to understand how Denmark got to Denmark. Section 4 provides historical background on Denmark’s railway expansion, its economic impact, and its role in shaping local institutions. Section 5 describes the data sources and empirical strategy, detailing our approach to estimating the causal effects of railway expansion. Section 6 presents the main results, examining the impact of railways on population growth, occupational shifts, and the diffusion of assembly houses and folk high schools. Finally, Section 7 concludes with broader implications for understanding how infrastructure investments contribute to both economic modernization and social transformation.
2 Literature Survey
Railroads have long been at the center of debates about their role in economic development. Fogel (\APACyear1964) argued that railroads were not essential to U.S. economic growth, as waterways and canals could have served as viable substitutes. This view challenged earlier narratives that positioned railroads as the driving force behind nineteenth-century American development. However, more recent work has provided strong evidence of their transformative impact. For instance, Atack \BOthers. (\APACyear2010) document that while rail access had only a modest effect on population density, it was instrumental in driving urbanisation in the American Midwest between 1850 and 1860. Moreover, Donaldson \BBA Hornbeck (\APACyear2016) show that railroads significantly expanded market access for U.S. producers, leading to substantial increases in agricultural land values. Finally, Hornbeck \BBA Rotemberg (\APACyear2024) demonstrate that railroads contributed far more to aggregate productivity growth than previously estimated, particularly when accounting for inefficiencies in market access. These findings underscore that railroads were not merely an alternative transportation mode but a crucial factor in shaping market integration and long-term economic growth.
Beyond the United States, extensive research has examined the relationship between railways and population growth, particularly in urban areas. Several studies highlight that early access to railways led to lasting changes in settlement patterns and economic activity. Berger \BBA Enflo (\APACyear2017) show that in Sweden, towns that gained early railway access experienced persistent population growth. However, later-connected towns did not necessarily catch up, suggesting limited convergence effects. The results we present here are the opposite: We demonstrate that in the Danish context, the later lines were more important. Similarly, Hornung (\APACyear2015) finds that railroad access significantly boosted urban growth in 19th-century Prussia, underscoring the role of transport infrastructure in shaping urbanization. The long-term effects of railway infrastructure are also evident in cases where rail access was later removed. Gibbons \BOthers. (\APACyear2024) show that the large-scale closure of railway lines in Britain had persistent negative consequences. Studies from other European contexts provide further evidence of railway-driven population growth.111Esteban-Oliver (\APACyear2023) for Spain, Braun \BBA Franke (\APACyear2022) for Württemberg, Koopmans \BOthers. (\APACyear2012) for the Netherlands However, so far, there is yet to be produced similar evidence for the case of Denmark, with the exception of Vedel (\APACyear2024) for the case of waterways. While our main focus here, is to contribute to a wider literature, we think it is worth noting that we are also filling this gap.
While railways influenced population dynamics, their impact extended beyond this. Bogart \BOthers. (\APACyear2022) find that railways also caused an occupational shift away from agriculture. Similarly, Berger (\APACyear2019) documents that railway expansion in 19th century Sweden played a crucial role in the transition from agricultural to industrial employment. Similarly, Atack \BOthers. (\APACyear2011); Hornbeck \BBA Rotemberg (\APACyear2024) show that the railway is associated with a shift into new forms of production. Korn \BBA Lacroix (\APACyear2024) finds that railways caused within sector reallocations, which they measure using bankruptcy data. Our paper demonstrates a similar result. Railways also facilitate internal migration. Enflo \BOthers. (\APACyear2018) highlight that railways played a critical role in Nordic industrialization by enabling resource exports, supporting rural industry, driving migration toward expanding economic centers, and reducing regional inequality. Büchel \BBA Kyburz (\APACyear2018) show that population growth was seemingly at the cost of localized displacement. Mojica \BBA Martí-Henneberg (\APACyear2011) document how railway expansion in France, Portugal, and Spain facilitated urban growth by attracting populations to cities while simultaneously accelerating rural depopulation. Escamilla-Guerrero (\APACyear2024) finds that railroad expansion in Mexico significantly facilitated mass migration to the U.S..
Railways also played a crucial role in enabling social movements. Melander (\APACyear2020) finds that the expansion of Sweden’s railway network between 1881 and 1910 facilitated the spread of grassroots social movements by increasing individual mobility and connectivity, leading to faster membership growth, more organizations, and greater political mobilization in the 1911 election. Similarly, García-Jimeno \BOthers. (\APACyear2022) show that railroads and the telegraph helped spread the 1873–1874 Temperance Crusade in the U.S., highlighting how traditional communication networks enhanced the reach and organizational capacity of social movements. These findings align with broader literature linking improved communication infrastructure to political mobilization. We demonstrate that railways were a driver of an important cultural shift towards inclusive institutions.
Railways also had other important demographic effects, particularly on fertility. Expanding railway networks slowed fertility decline by increasing market access, which raised incomes affecting the quantity-quality trade-off (Ciccarelli \BOthers., \APACyear2023). In industrializing England and Wales, Galofré-Vilà (\APACyear2024) finds that railway expansion increased local fertility rates by approximately 3 percent, suggesting that improved economic conditions and connectivity may have encouraged larger families. The relationship between railways and technological progress is also well-documented. Andersson \BOthers. (\APACyear2023) show that the expansion of the Swedish railway network facilitated a market for ideas by reducing communication and transport costs, enabling inventors to develop and commercialize innovations beyond their local economies. In Italy, however, the link between railroads and innovation was delayed. Martinez \BOthers. (\APACyear2024) find that railway expansion spurred innovation only after several decades and primarily benefited independent inventors and low-quality patents, with the most pronounced effects occurring during the state-driven first wave of railway construction (1861–1878). Other studies emphasize railways’ broader economic, social, and educational impacts. In Sweden, Cermeño \BOthers. (\APACyear2022) show that nineteenth-century railways helped school inspectors monitor education, leading to higher attendance rates and an increased emphasis on nation-building subjects, while more remote schools remained under local religious control. In England and Wales, Costas-Fernández \BOthers. (\APACyear2020) find that railroad access increased intergenerational mobility. Additionally, railway expansion has been linked to improvements in literacy in India (Chaudhary \BBA Fenske, \APACyear2023) and rising school enrollment in the U.S. (Atack \BOthers., \APACyear2012), underscoring how transport infrastructure influenced human capital accumulation.
The findings suggest that infrastructure development interacts with preexisting economic and social structures in complex ways, shaping long-term development trajectories. Building on this, we examine the role of railways in Denmark’s nineteenth-century transformation, with a particular focus on both economic and cultural change. While previous research has extensively documented how railways influenced population growth, industrialization, and market integration, less attention has been paid to their role in shaping social institutions and cultural movements. By analyzing the relationship between railway expansion and the spread of Grundtvigian institutions, we contribute to a growing body of work that considers the broader societal impacts of transport infrastructure.
3 Conceptual Framework
Getting to Denmark has become a widely adopted analogy describing the challenge of establishing modern, stable, and democratic institutions. Fukuyama (\APACyear2011) emphasizes that such institutions do not emerge fully formed but rather develop through complex historical processes, requiring a stable balance of the state, rule of law, and accountable government. The case of Denmark exemplifies this gradual evolution. In the eighteenth century, Denmark was an absolutist and militarized state comprising multiple cultural and linguistic groups. The transition to a more cohesive and democratic society was far from predetermined. Central to this transformation was the role of N.F.S. Grundtvig, a theologian and nationalist thinker whose ideas about education, civic engagement, and national identity shaped Denmark’s institutional and cultural trajectory (Boberg-Fazlic \BOthers., \APACyear2023; Fukuyama, \APACyear2015).
Grundtvigianism, emerging in the mid-nineteenth century, played a crucial role in fostering democratic participation and rural enlightenment. The movement promoted education through folk high schools, which emphasized lifelong learning, civic responsibility, and national identity. These institutions provided an ideological foundation for the cooperative movement, which became a hallmark of Denmark’s economic model. Alongside these schools, assembly houses (forsamlingshuse) were established as venues for public discourse, education, and political organization. These spaces reinforced the participatory ethos that underpinned Denmark’s political and economic modernization, with impact far beyond Denmark’s shores (Boberg-Fazlic \BOthers., \APACyear2023; Bentzen \BOthers., \APACyear2023, \APACyear2024). At the same time, cooperative creameries came to play a crucial role in this transformation (Boberg-Fazlic \BOthers., \APACyear2023). These cooperatives not only facilitated agricultural modernization but also reinforced inclusive institutions that underpinned long-term development. However, their formation required both tangible and intangible preconditions. On the practical side, successful creameries depended on key inputs such as centrifuges, a reliable supply of high-quality milk, and access to energy sources like coal. Just as importantly, cooperatives required social and institutional foundations - a space for deliberation and decision-making (the constitutional general assembly) and the conceptual framework for collective organization (Lampe \BBA Sharp, \APACyear2018).
We suggest that railways played an important role in enabling both the practical and institutional elements of Denmark’s transformation. By improving transportation infrastructure, railways facilitated the movement of coal, equipment, and finished dairy products, ensuring the viability of cooperative production. Just as critically, railways also contributed to the diffusion of modern ideas, particularly through their role in fostering Grundtvigianism, which emphasized communal organization, education, and civic engagement. The expansion of assembly houses, closely linked to the Grundtvigian movement, provided the physical and ideological foundation for cooperative organization. In other words, railway development was not merely a means of economic integration but also a conduit for new forms of social organization and participatory governance.
The conceptual framework in Figure 1 illustrates these dynamics, showing how railway expansion contributed to both economic growth and institutional development.222This should not be interpreted formally as a causal model (such as a DAG), but is instead included for illustrative purposes. Railways enabled market access and structural transformation, which, in turn, facilitated the emergence of folk high schools and assembly houses—key institutions that fostered civic engagement and cooperative organization. These institutions played a crucial role in supporting the cooperative movement, which became a defining feature of Denmark’s modernization. By linking improved connectivity to economic and cultural change, this framework highlights how infrastructure investment shaped Denmark’s long-run development.
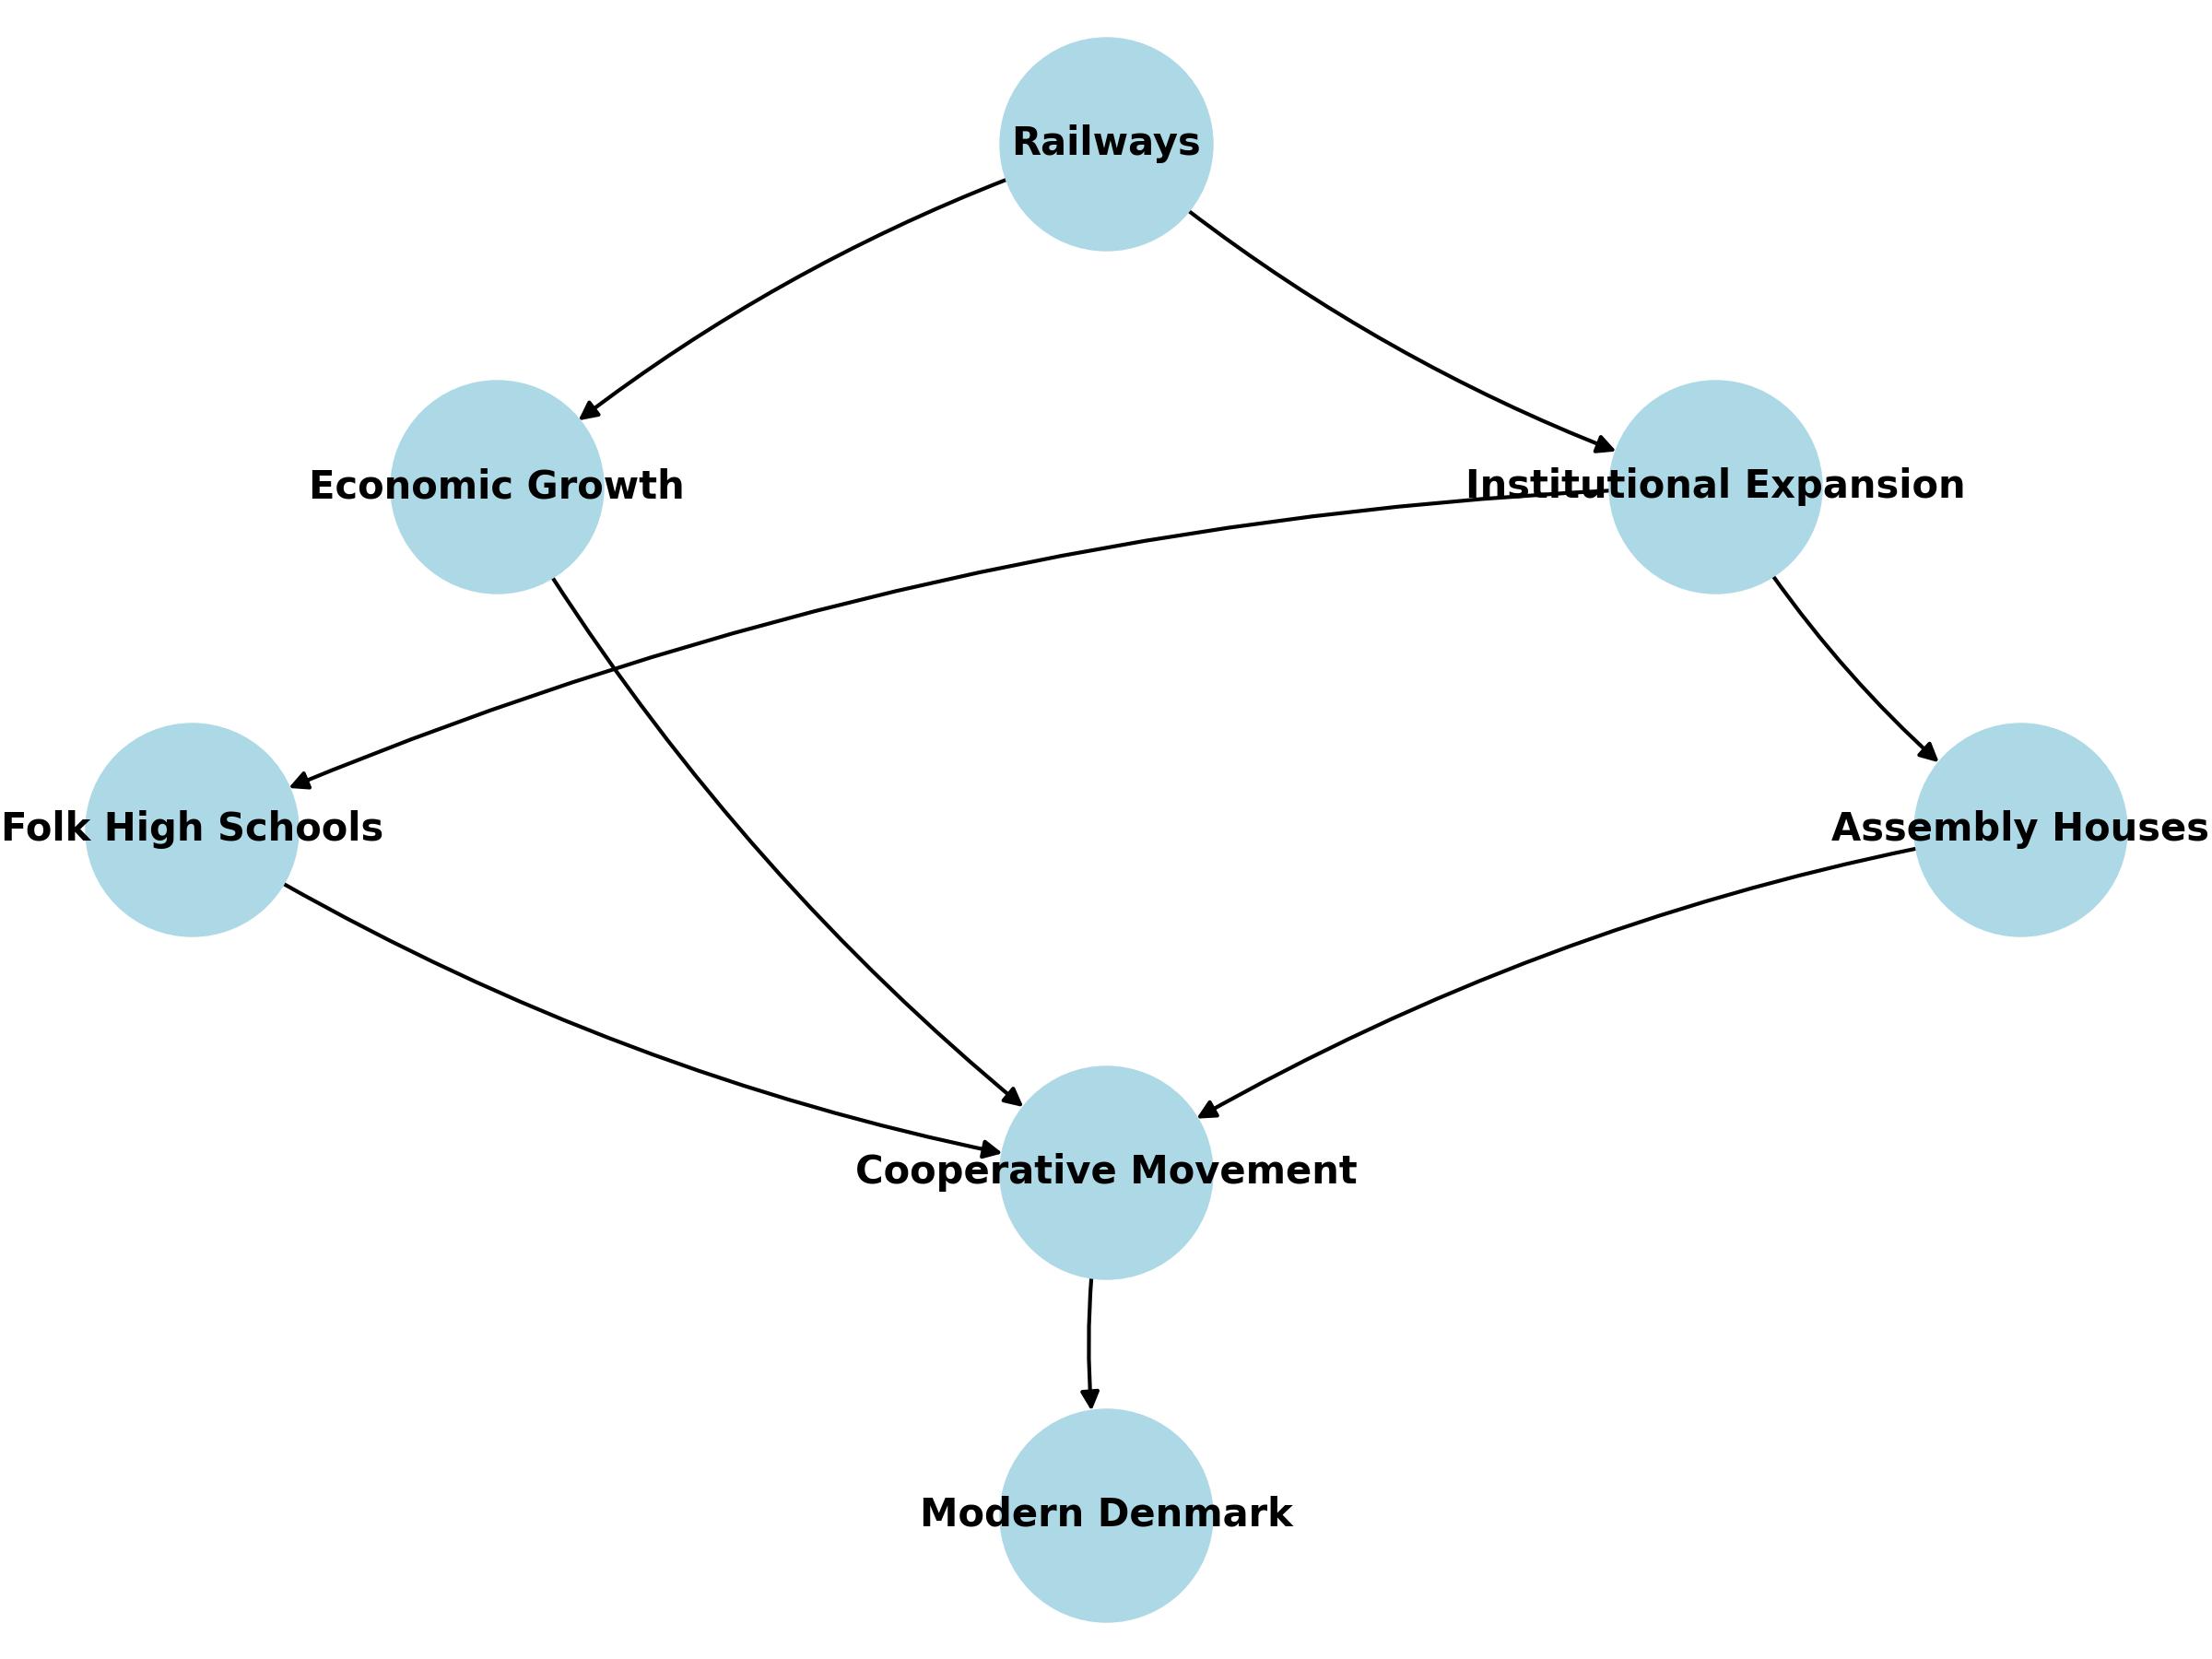
Table 1 presents correlational evidence from 1915, illustrating the relationship between railway connections, assembly houses, and the presence of cooperative creameries. Column 1 indicates that parishes with railway access are 10.7 percent more likely to host a cooperative creamery. Column 2 shows that locations with an assembly house exhibit an even stronger correlation, being 13.8 percent more likely to have a cooperative creamery. Column 3 supports that both relationships remain robust when railway access and assembly houses are included simultaneously. Finally, Column 4 aggregates the analysis to the hundred level, where the number of cooperatives, assembly houses, and railway-connected parishes are considered together. The results suggest that each additional railway connection is associated with an 10.9 percent increase in the number of cooperative creameries, while each assembly house corresponds to a 2.93 percent increase. These findings reinforce the idea that both infrastructure and institutional factors played a crucial role in the emergence of Denmark’s cooperative movement.
| Outcome: | At least one cooperative creamery | Count of coops | ||
|---|---|---|---|---|
| Parish Level | Hundred Level | |||
| (1) | (2) | (3) | (4) | |
| OLS | OLS | OLS | Poisson | |
| Constant | 0.5565∗∗∗ | 0.5511∗∗∗ | 0.4945∗∗∗ | 1.303∗∗∗ |
| (0.0172) | (0.0158) | (0.0200) | (0.0672) | |
| Railway | 0.1072∗∗∗ | 0.1050∗∗∗ | 0.1099∗∗∗ | |
| (0.0228) | (0.0226) | (0.0082) | ||
| Assembly house | 0.1385∗∗∗ | 0.1368∗∗∗ | 0.0293∗∗∗ | |
| (0.0224) | (0.0223) | (0.0055) | ||
| Observations | 1,855 | 1,855 | 1,855 | 155 |
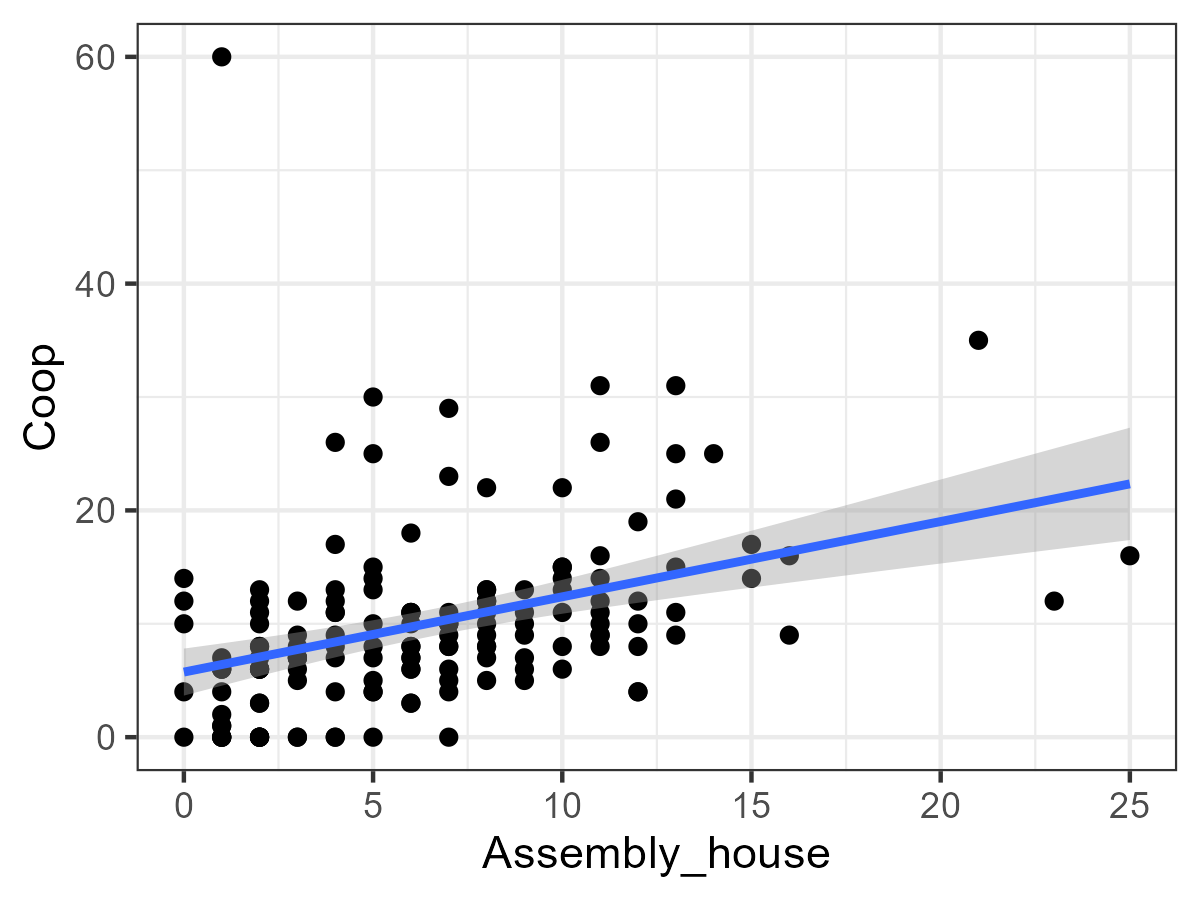
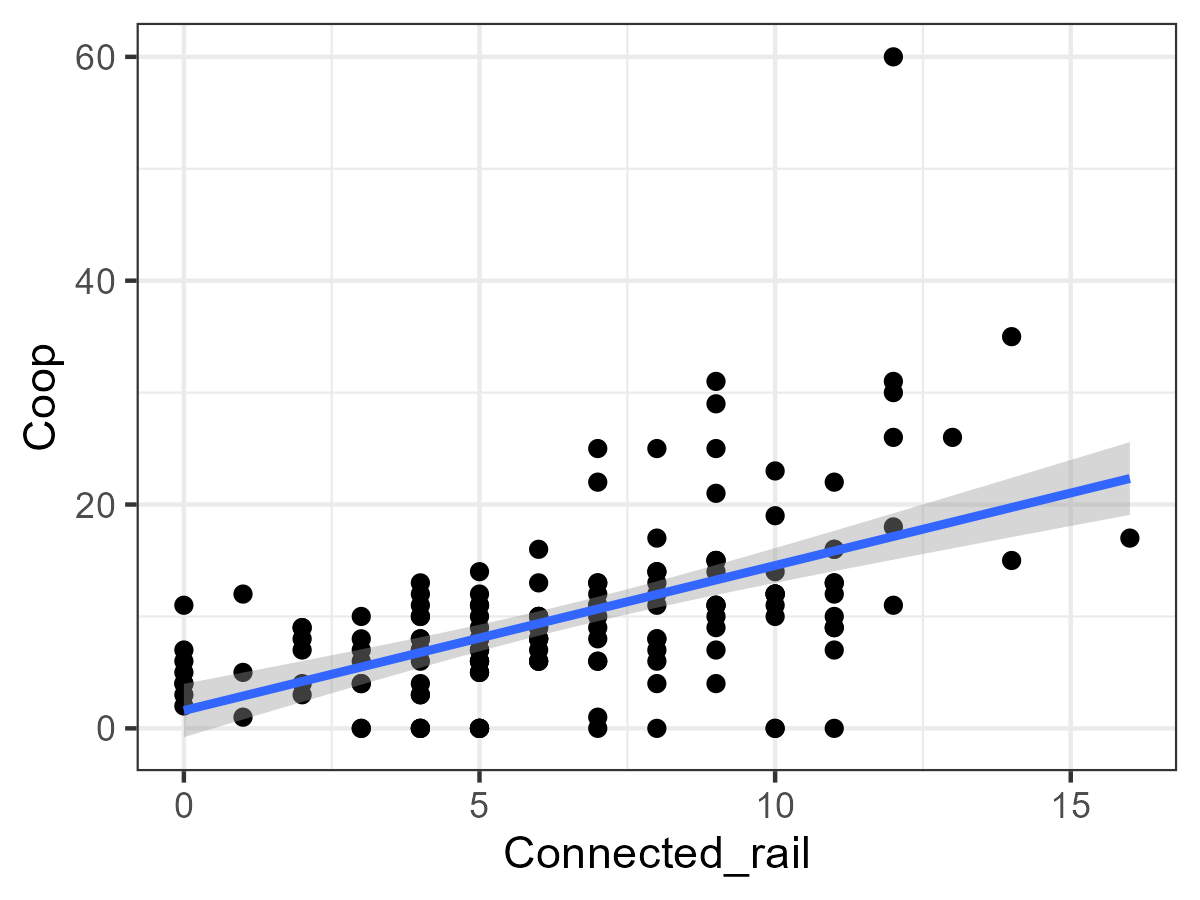
Figure 2 visually illustrates the correlation between cooperative creameries, assembly houses, and railway connections. The development of modern Denmark was contingent on both the spread of modern ideas—facilitated by assembly houses as centers for discussion and organization—and the expansion of railways, which provided the necessary infrastructure for economic growth. This paper seeks to understand how railways contributed to prosperity, which in turn fostered the emergence of assembly houses and the diffusion of cooperative ideals. Fundamentally, we document how improved market access served as a precursor to Denmark’s economic takeoff and argue that railways played a pivotal role in shaping the trajectory of modern Denmark.
The emergence of cooperative creameries, a cornerstone of Denmark’s modern economy, depended not only on the availability of key physical inputs—such as milk supplies, centrifuges, and energy—but also on the necessary social and institutional infrastructure. Assembly houses provided a venue for deliberation and the organizational capacity needed to establish cooperatives, while railways facilitated both the movement of goods and ideas. Importantly, the sequence of events matters: cooperative creameries emerged after railways, suggesting that it cannot be that infrastructure was driven by cooperatives. If anything it could only be the other way around: Infrastructure development preceded and enabled institutional innovation. This implies that economic modernization and cultural transformation were deeply intertwined, with railways serving as both a direct driver of economic change and an indirect catalyst for the spread of cooperative ideals. Before we empirically examine these relationships, in section 5, we detail the historical background of the spread of the Danish railways below.
4 Historical Background
The Danish trunk railway lines were constructed between 1847 and the mid-1870s, with the state playing a central yet evolving role in their development. As only the state could grant concessions for railway construction, the design and expansion of the network were deeply intertwined with contemporary political debates. Consequently, the layout and timing of the railways reflected political interests rather than purely economic considerations (Thestrup, \APACyear1997; Olesen, \APACyear1990).
Two competing perspectives shaped the debate over railway planning. One faction, primarily consisting of Jutlandic peasants engaged in cattle exports, advocated for a north-south railway linking Jutland with Hamburg and Husum to facilitate livestock trade. In contrast, the national-liberal movement sought to reduce Denmark’s dependence on German markets, particularly Hamburg, by strengthening direct trade routes to England. Their preferred railway layout emphasized east-west connections from Jutland to ports on the Limfjord and the western coast, ensuring efficient access to English markets while maintaining strong links to Copenhagen and key merchant towns (Hansen, \APACyear1972).
Denmark’s first railway line, within the then-personal union with Schleswig-Holstein, opened in 1842 between Kiel and Altona near Hamburg. Although proposals for a railway linking the Baltic and North Seas dated back to 1831, the Danish government initially resisted such plans, as they threatened to bypass the lucrative Øresund toll, which accounted for over a quarter of state revenue in 1847. However, geopolitical pressures eventually forced Denmark’s hand, leading to the construction of the Kiel-Altona railway (Thestrup, \APACyear1997). At the same time, national-liberal proponents had suggested an alternative railway from Flensburg to Tønning, which would have strengthened Denmark’s connection with England. However, in an effort to maintain Holstein within the union, the Danish government ultimately favored the Kiel-Altona line. This pattern illustrates how railway planning was subject to national priorities and political considerations rather than strictly economic efficiency (Lampe \BBA Sharp, \APACyear2015).
In 1854, British entrepreneur Sir Morton Peto successfully proposed the Flensburg-Tønning line, adding a side track to Rendsburg to connect with the existing Kiel-Altona railway. His vested interest in steamship operations between England and Tønning partly motivated this project (Thestrup, \APACyear1997). In modern-day Denmark, the first domestic railway line opened in 1847, linking Copenhagen with Roskilde. By 1856, the extension to Korsør dramatically reduced travel times across the country, facilitating connectivity between Copenhagen and Altona in just 14 hours - compared to the 36-hour steamboat journey from Copenhagen to Kiel prior to rail construction (Buch \BBA Gomard, \APACyear1933). As early as 1852, Peto proposed an additional railway connecting Flensburg with Ballum on Jutland’s western coast, intending to create a direct link for agricultural exports to England. His plan included a northward extension through Viborg, Aalborg, and Frederikshavn. This proposal, which prioritized cost-effectiveness over accessibility, received strong support from Jutlandic peasants. However, national liberals criticized it for neglecting populous cities along Jutland’s eastern coast and for failing to provide a direct connection to Copenhagen (Thestrup, \APACyear1997).
After years of political disagreement and economic uncertainty, a compromise was reached in 1861. The final plan reflected national-liberal priorities by including an east-west railway from Aarhus to Limfjorden, enabling steamship connections to England via the newly emerged Agger Channel (Vedel, \APACyear2024). The north-south railway route was also adjusted to pass through the fortress town of Fredericia, fulfilling strategic military objectives following Denmark’s experiences in the First Schleswig War. Additionally, a railway across Funen, linking Nyborg and Middelfart, was approved, along with a direct line from Flensburg to Kolding, completing the north-south connection to Hamburg (Olesen, \APACyear1990).
The Second Schleswig War in 1864, which resulted in Denmark’s loss of southern Jutland, further reinforced the strategic shift towards direct trade with England. This transition was already underway in the 1850s, as evidenced by price integration between the Danish and British butter markets (Lampe \BBA Sharp, \APACyear2015). The loss of Schleswig and Holstein accelerated this reorientation, making reliance on Hamburg politically and economically unviable. In response, Denmark prioritized the construction of Esbjerg harbor on Jutland’s southwest coast, along with railway connections from Holstebro, Varde, and Vejle. The harbor’s rapid development reflected the new commercial reality, as it provided a crucial alternative to Hamburg for agricultural exports (Thestrup, \APACyear1997).
Denmark experienced significant economic growth from the late nineteenth century through the early twentieth century, shifting from a primarily grain-based economy to one focused on animal products. This transition was facilitated by the expansion of railway infrastructure, which enabled efficient livestock transportation and supported the growing dairy industry. The railway network also allowed for the import of critical inputs such as fertilizers and coal, which were essential for large-scale dairy production (Henriques \BBA Sharp, \APACyear2016). Moreover, the spread of railways contributed to the rise of new urban centers, often referred to as railway towns. These settlements emerged around railway stations, developing as local transport and commercial hubs. Many of these towns hosted creameries, grain mills, and other industries tied to the agricultural sector, reinforcing Denmark’s position as a leading exporter of dairy products. Langå, for example, became an important railway junction, and its rapid development highlights how railway connectivity spurred localized economic growth (Groth \BBA Fertner, \APACyear2013).
5 Data and Empirical Strategy
We have two primary empirical objectives. First, we aim to estimate the growth effects of the introduction of railways. Second, we seek to assess the cultural impact of railway expansion. These two dimensions are closely intertwined, and we do not attempt to establish a strict causal hierarchy between them. Rather than determining whether one factor directly caused the other, our approach focuses on testing whether both are causally linked to the introduction of railways. In doing so, we achieve a quantitative measure of the extent to which railways played a pivotal role in shaping the emergence of modern Denmark.
To achieve this, we have matched railway lines from Fertner (\APACyear2013) to parishes from Digdag.dk (\APACyear2021), allowing us to construct a panel dataset that records whether a parish was connected to the railway in any given year. Economic outcomes are measured using census data from Mathiesen \BOthers. (\APACyear2022), from which we extract parish-level population counts and calculate the child-women ratio. Additionally, we compute a measure of migration based on the number of individuals residing in a different county from their birthplace. Occupational data is standardized using Dahl \BOthers. (\APACyear2024), which converts occupational descriptions into HISCO codes.333We tested 200 random samples and report a 95 percent accuracy rate. From this, we compute the number of non-agricultural workers, workers in manufacturing, and the parish-level average HISCAM scores. We classify all occupations with HISCO codes starting with 7, 8, or 9 as manufacturing and those starting with 6 as agricultural workers.
To measure the spread of Grundtvigianism, we follow Bentzen \BOthers. (\APACyear2023), utilizing data on the construction of assembly houses and folk high schools, originally sourced from Trap \BOthers. (\APACyear1906) and Trap \BBA Knudsen (\APACyear1928). We employ two types of outcome variables: A dummy variable indicating the presence of an assembly house or folk high school in a given parish and, to account for establishments in neighboring parishes, the local density of these institutions as an alternative measure. The local density of Grundtvigian institutions is calculated using an inverse distance-weighted measure of market access, following Harris (\APACyear1954). This approach assigns greater influence to nearby institutions while still accounting for the presence of more distant ones. Specifically, for each parish , market access is defined as
| (1) |
where represents the great circle distance to from parish each institution . A higher value of this measure indicates a greater local concentration of assembly houses or folk high schools, suggesting stronger regional diffusion of Grundtvigianism. Conversely, a lower value reflects institutional sparsity, implying weaker exposure to these ideas. This measure captures spatial spillovers, as the presence of institutions in neighboring parishes contributes to the local density, reflecting the extent to which Grundtvigian influence transcends parish boundaries. Table 2 presents summary statistics for all these variables.
| Variable | N | Mean | SD | Min | Max |
|---|---|---|---|---|---|
| A. Census | |||||
| Connected railway | 6356 | 0.17610 | 0.3809 | 0.00 | 1.000 |
| Child women ratio | 6336 | 0.48830 | 0.1115 | 0.00 | 1.364 |
| HISCAM avg | 6355 | 48.63000 | 1.5030 | 44.24 | 82.850 |
| Migration | 6356 | 263.20000 | 390.6000 | 0.00 | 4299.000 |
| Population | 6356 | 793.80000 | 590.5000 | 37.00 | 13090.000 |
| log(Manufacturing + 1) | 6356 | 4.16400 | 0.8498 | 0.00 | 7.941 |
| log(Not agriculture + 1) | 6356 | 4.47100 | 0.8548 | 0.00 | 8.148 |
| B. Grundtvig | |||||
| Connected railway | 119200 | 0.25760 | 0.4373 | 0.00 | 1.000 |
| Share of parishes with a folk high school | 119200 | 0.02945 | 0.1691 | 0.00 | 1.000 |
| Share of parishes with an assembly house | 119200 | 0.17150 | 0.3769 | 0.00 | 1.000 |
| Local density of assembly houses (MA) | 119200 | 4.46400 | 5.4040 | 0.000000 | 20.350 |
| Local density of folk high schools (MA) | 119200 | 0.70240 | 0.4257 | 0.005426 | 3.784 |
Our baseline empirical strategy employs a difference-in-differences estimator:
| (2) |
where represents the outcome of interest, and denote parish and year fixed effects, respectively, and is an indicator variable for whether a parish has a railway passing through it in a given year. The coefficient captures the average effect of railway connection on .
A key concern with this specification is the presence of heterogeneous treatment effects and staggered adoption, which can lead to problematic comparisons where already treated units are used as controls (Goodman-Bacon, \APACyear2021). To address this, we follow the approach of Callaway \BBA Sant’Anna (\APACyear2021), which estimates a series of classical difference-in-differences models, allowing for flexible aggregation to identify group-specific effects. Specifically, we use a specification in which the control group consists of parishes that will eventually receive a railway connection but have not yet been treated.
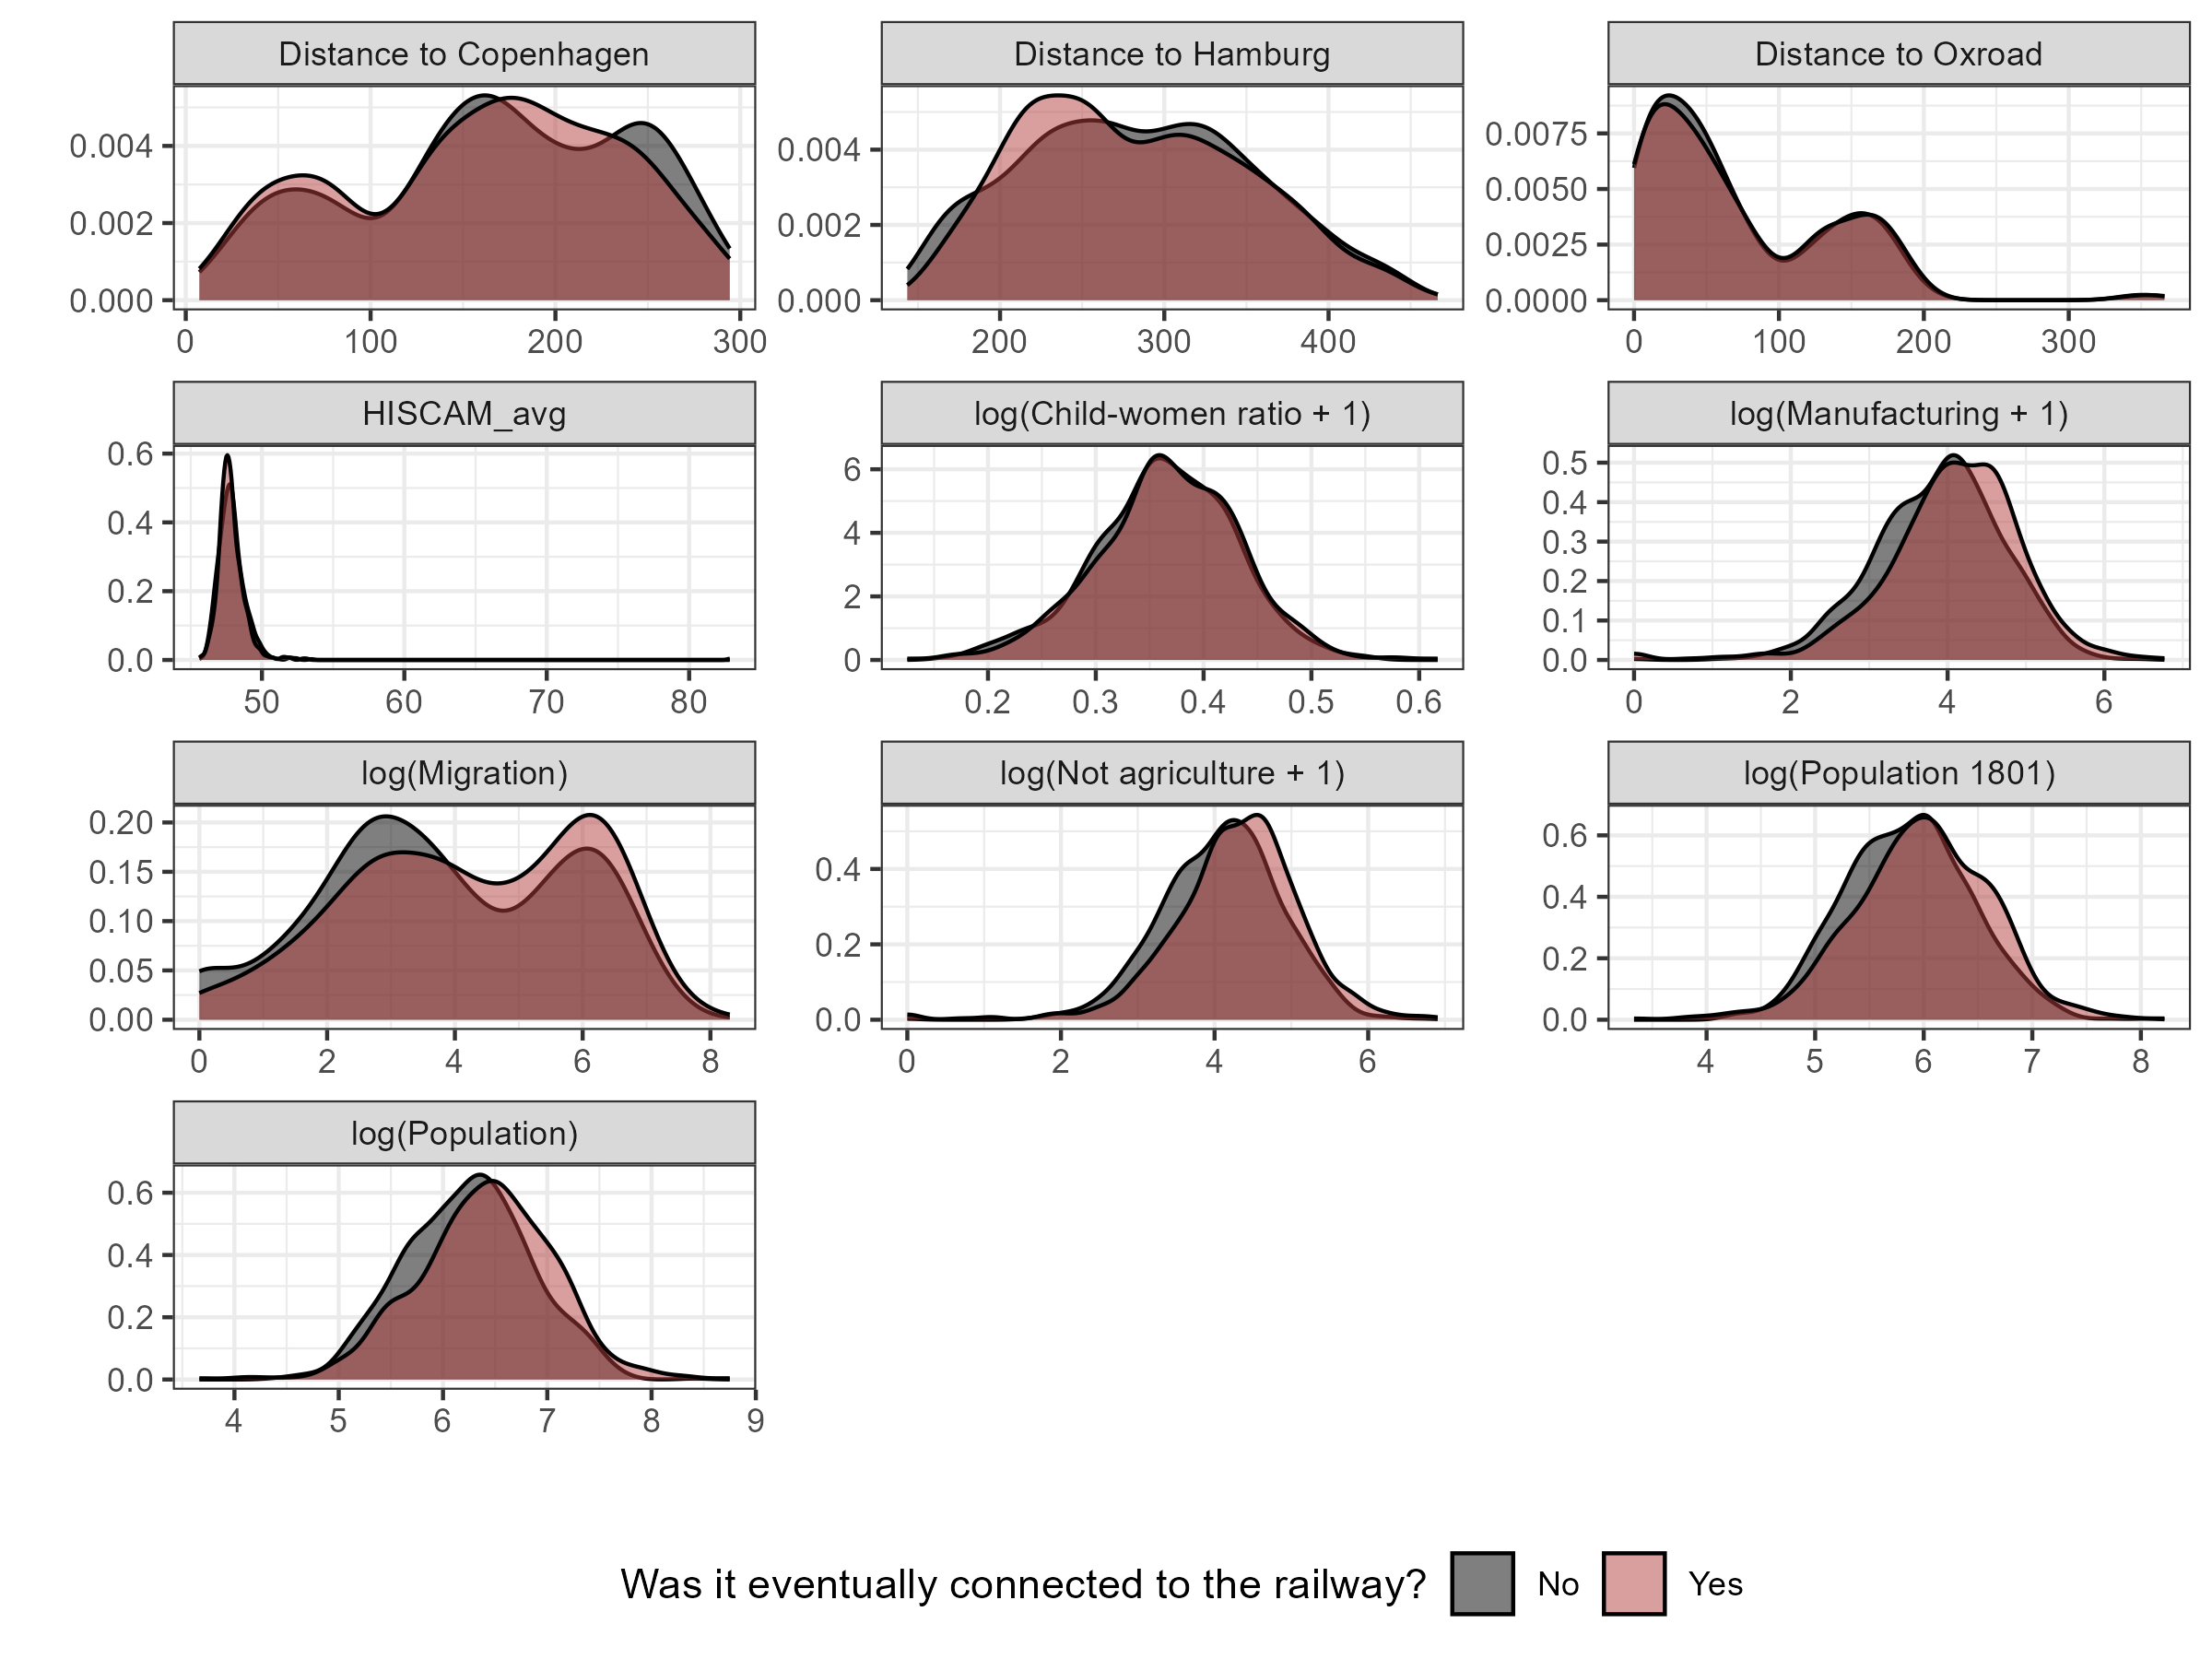
Another concern is whether connected parishes are selected into being connected, and specifically whether parishes, that would be connected were done so, because they were on a differential trajectory, which would bias our estimate. Figure 3 shows density estimates for the main census outcomes in 1850 (before any railway connection), as well as a number of long-run growth related covariates. The similarity in the density plots between parishes that eventually gained railway access and those that did not suggests that selection bias is likely minimal. Specifically, this implies that parishes connected to the railway were not systematically different in key pre-treatment characteristics before the railway expansion began.444Appendix A supplements this with density plots, which are grouped by when the parish was connected. Qualitatively this demonstrates the same. Despite of this we also try a specification with controls in Appendix C.
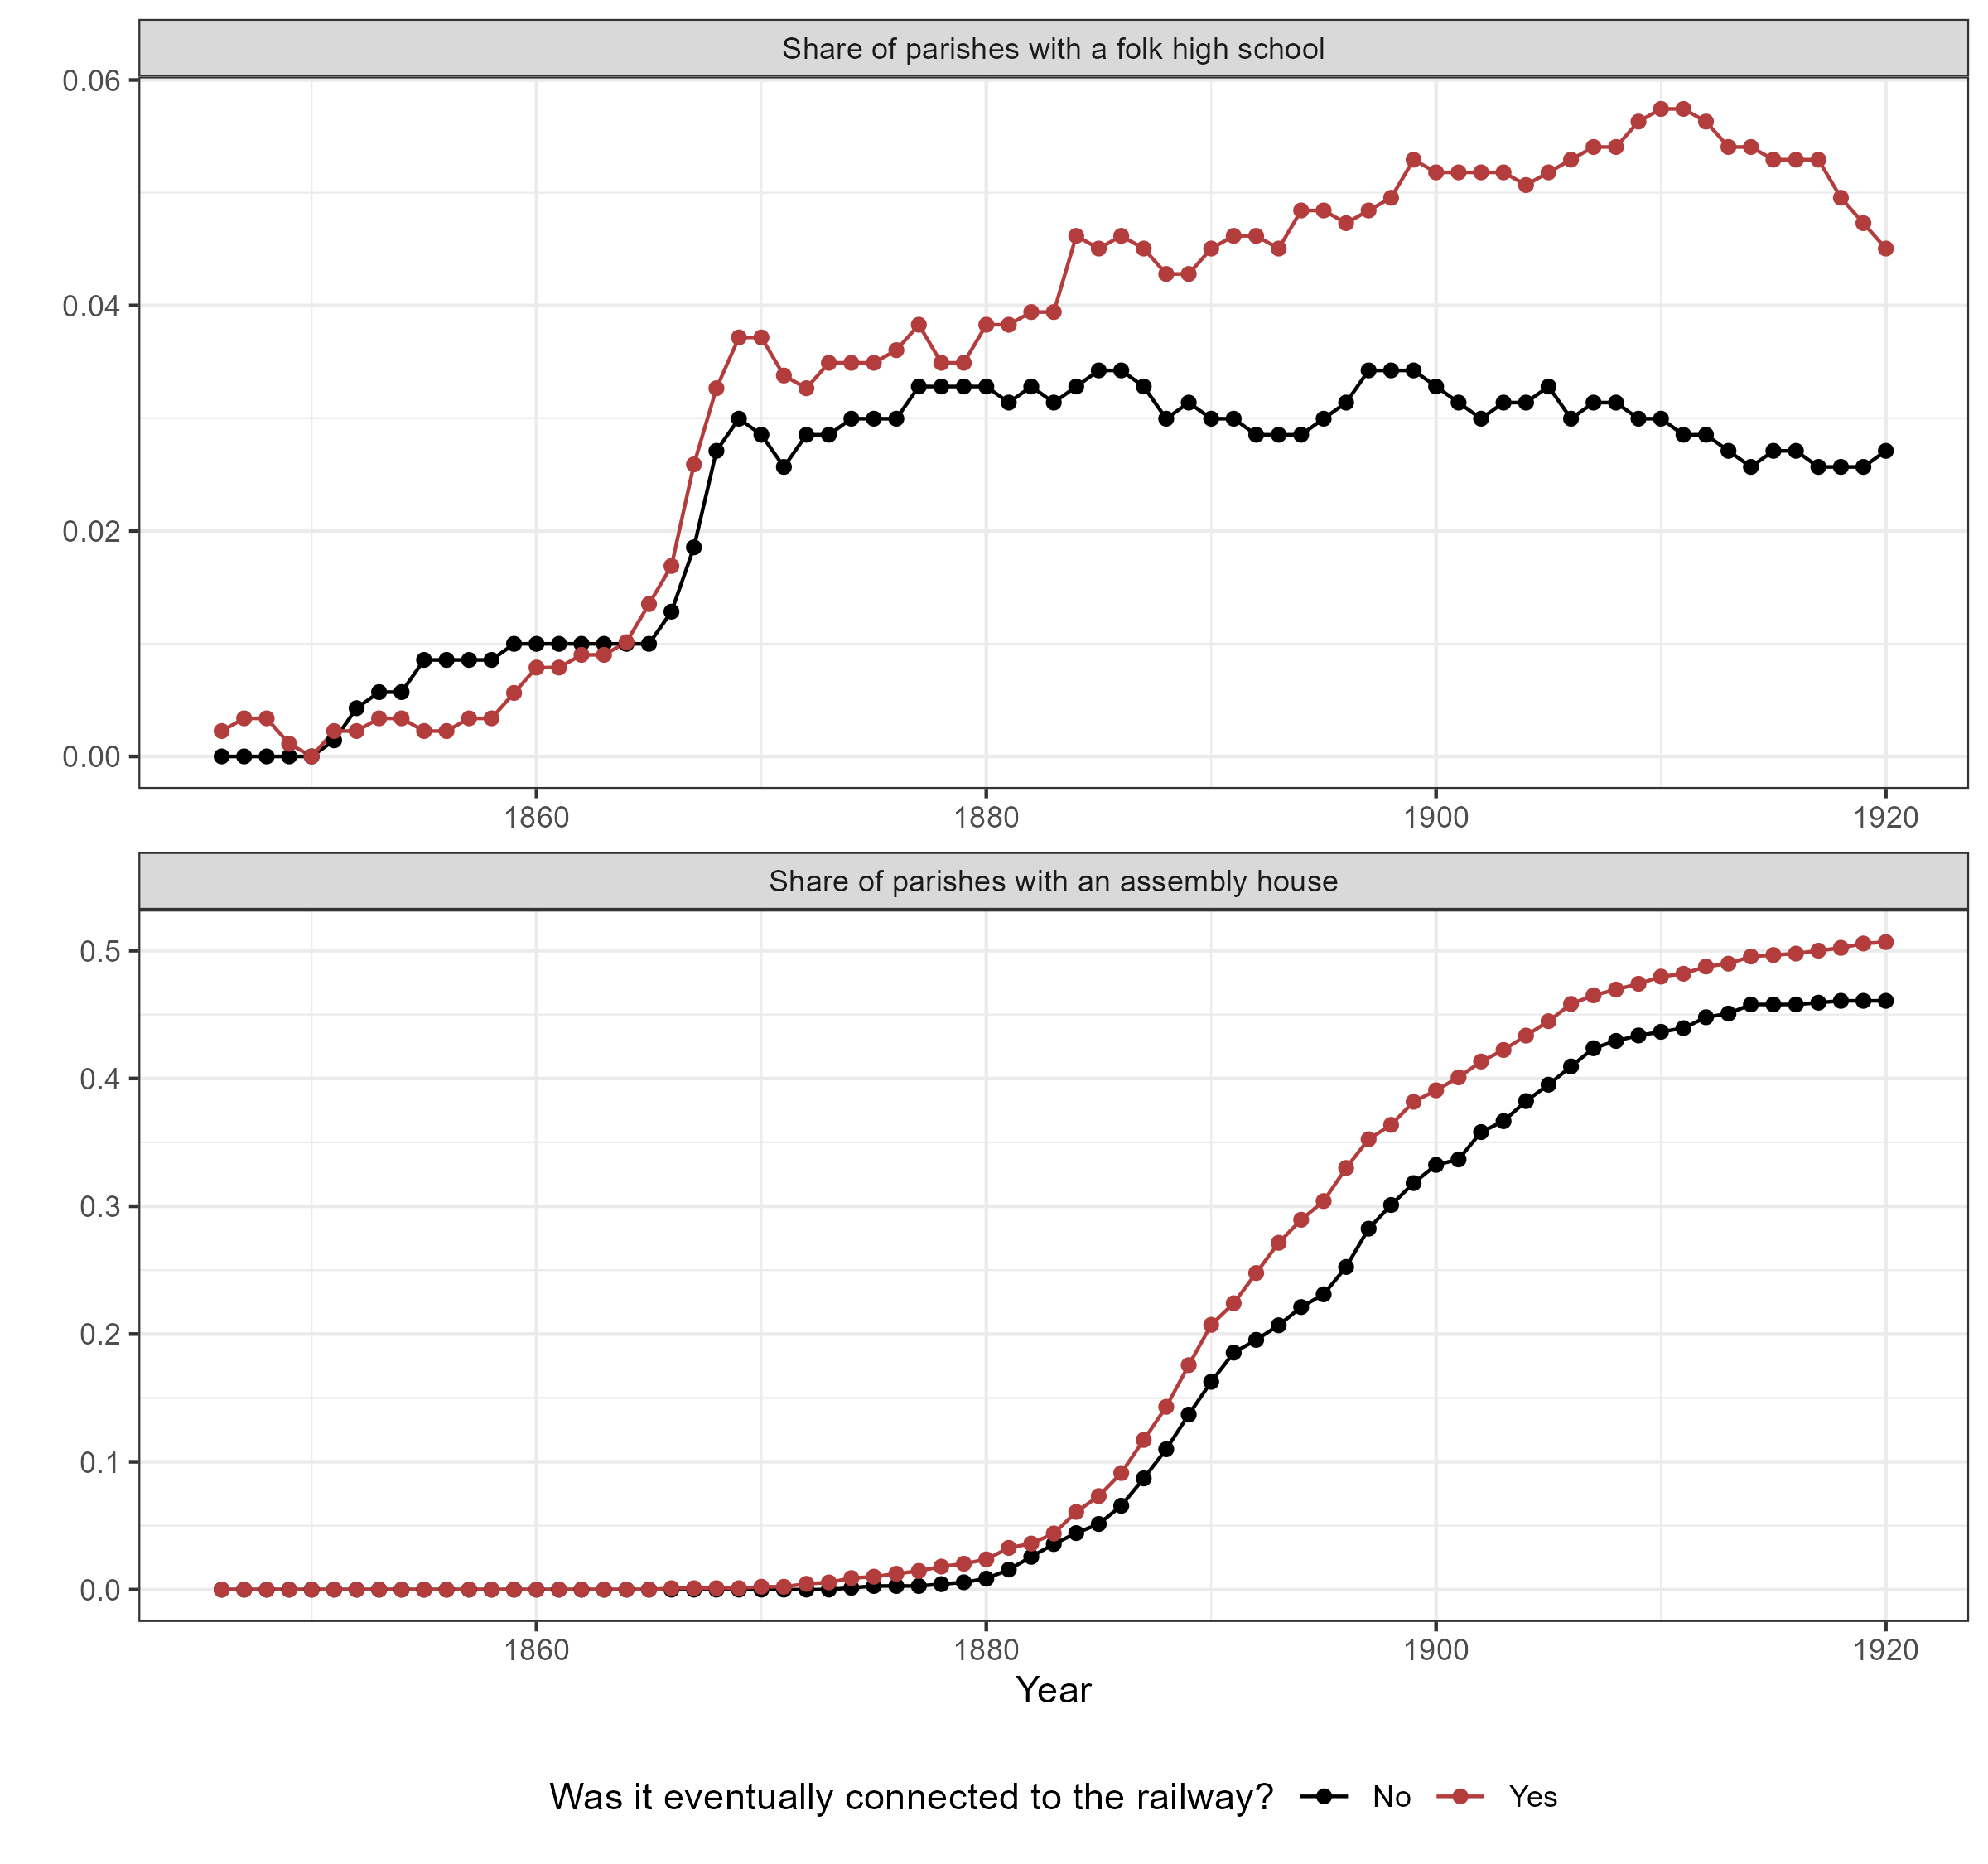
Similarly, for the binary Grundtvigian outcomes we compute the share of parishes with assembly houses and folk high schools over time by railway status. This is illustrated in figure 4. Places that were connected to the railway diverged in terms of assembly houses and folk high schools, both associated with Grundtvigianism.
Further we adopt an IV strategy, which captures well, the main lines of the expansion of the railway, namely whether a least-cost path (given by the terrain) between important market towns connects the parish to the railway. This is described in more detail in Appendix B.
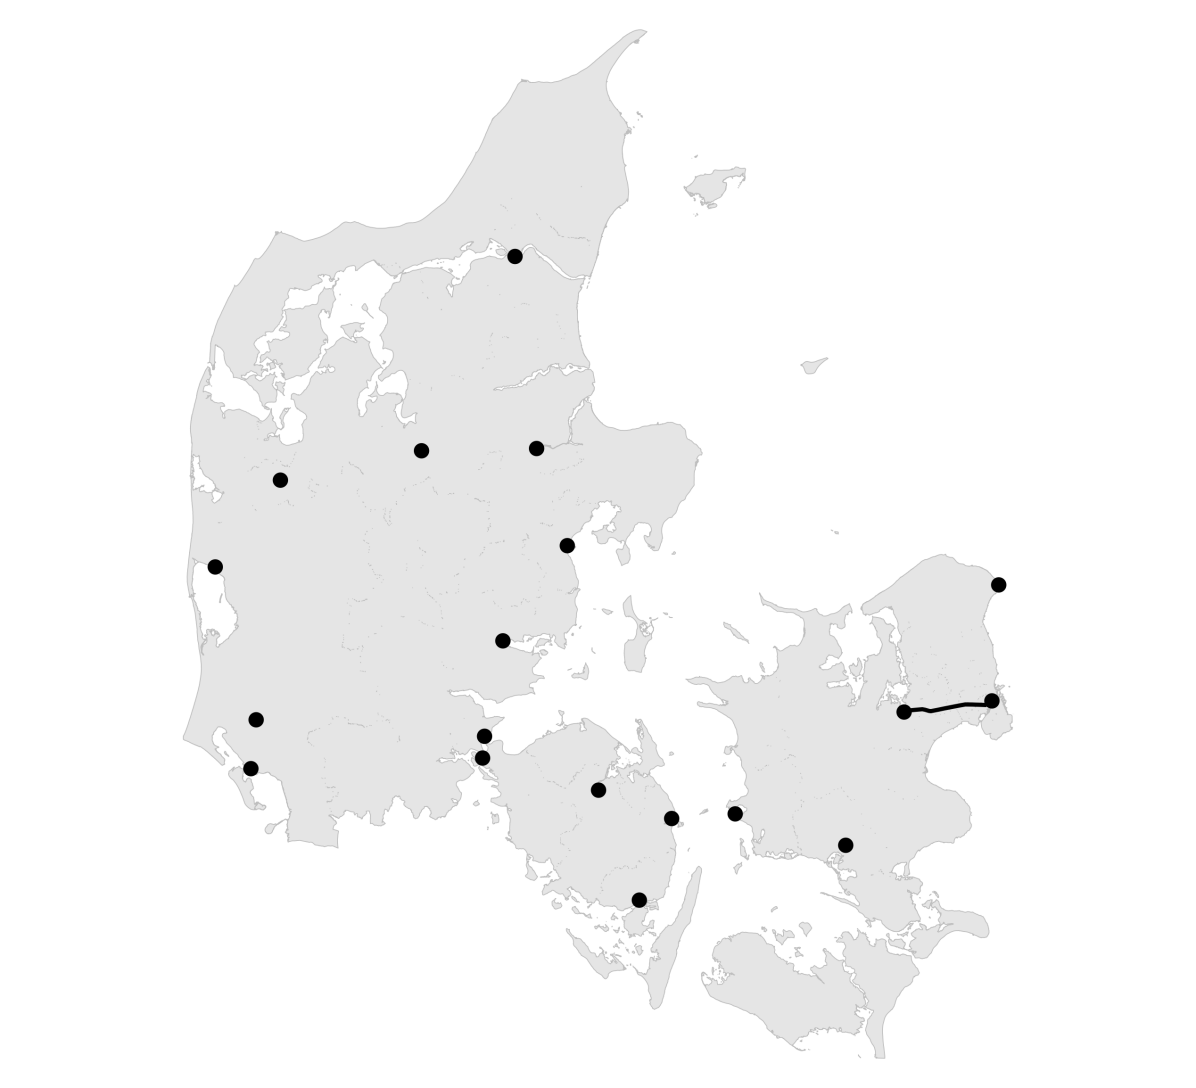
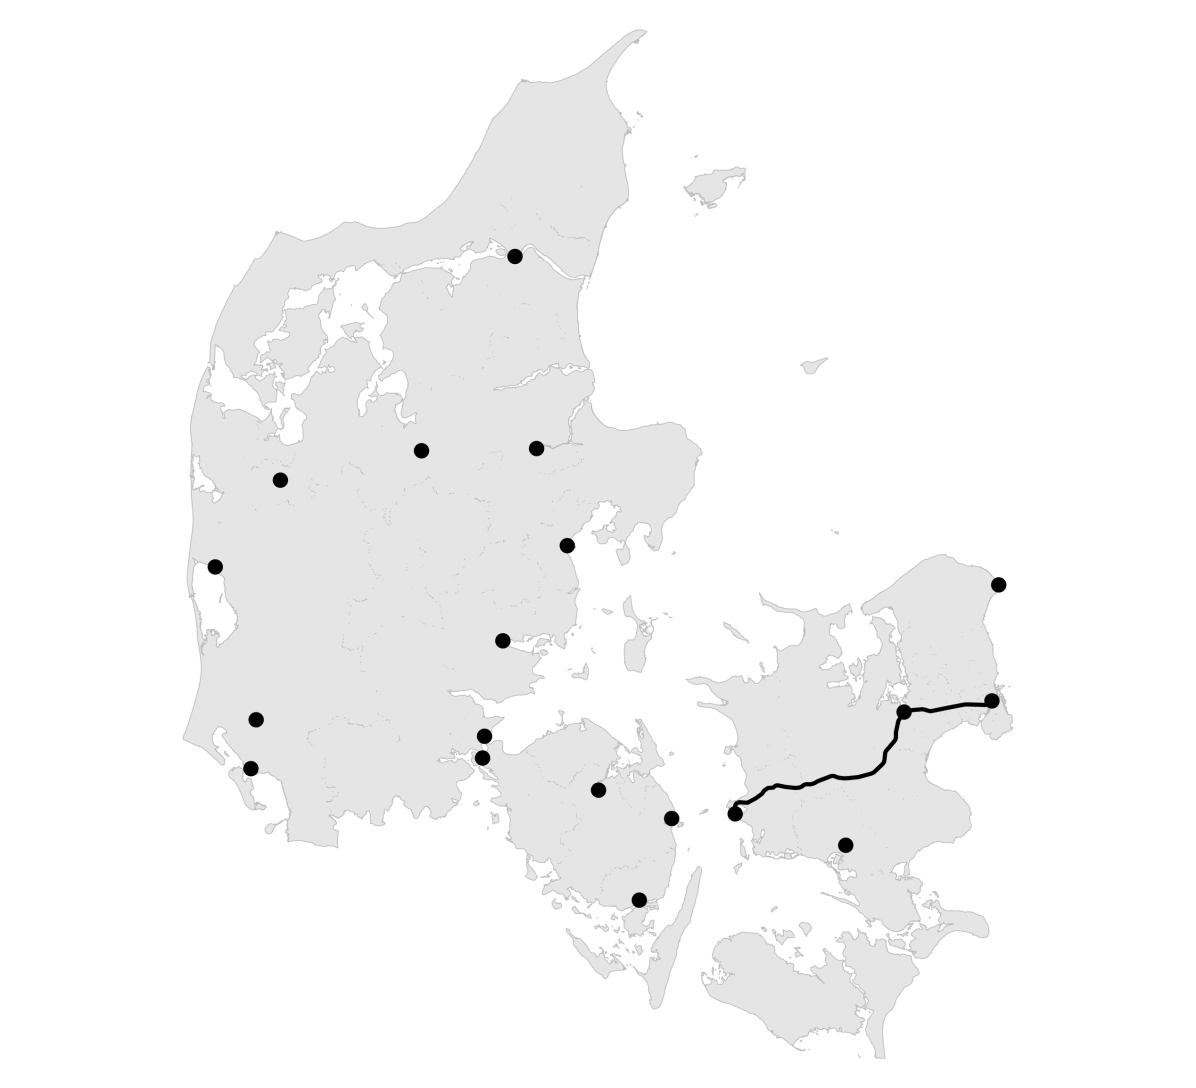
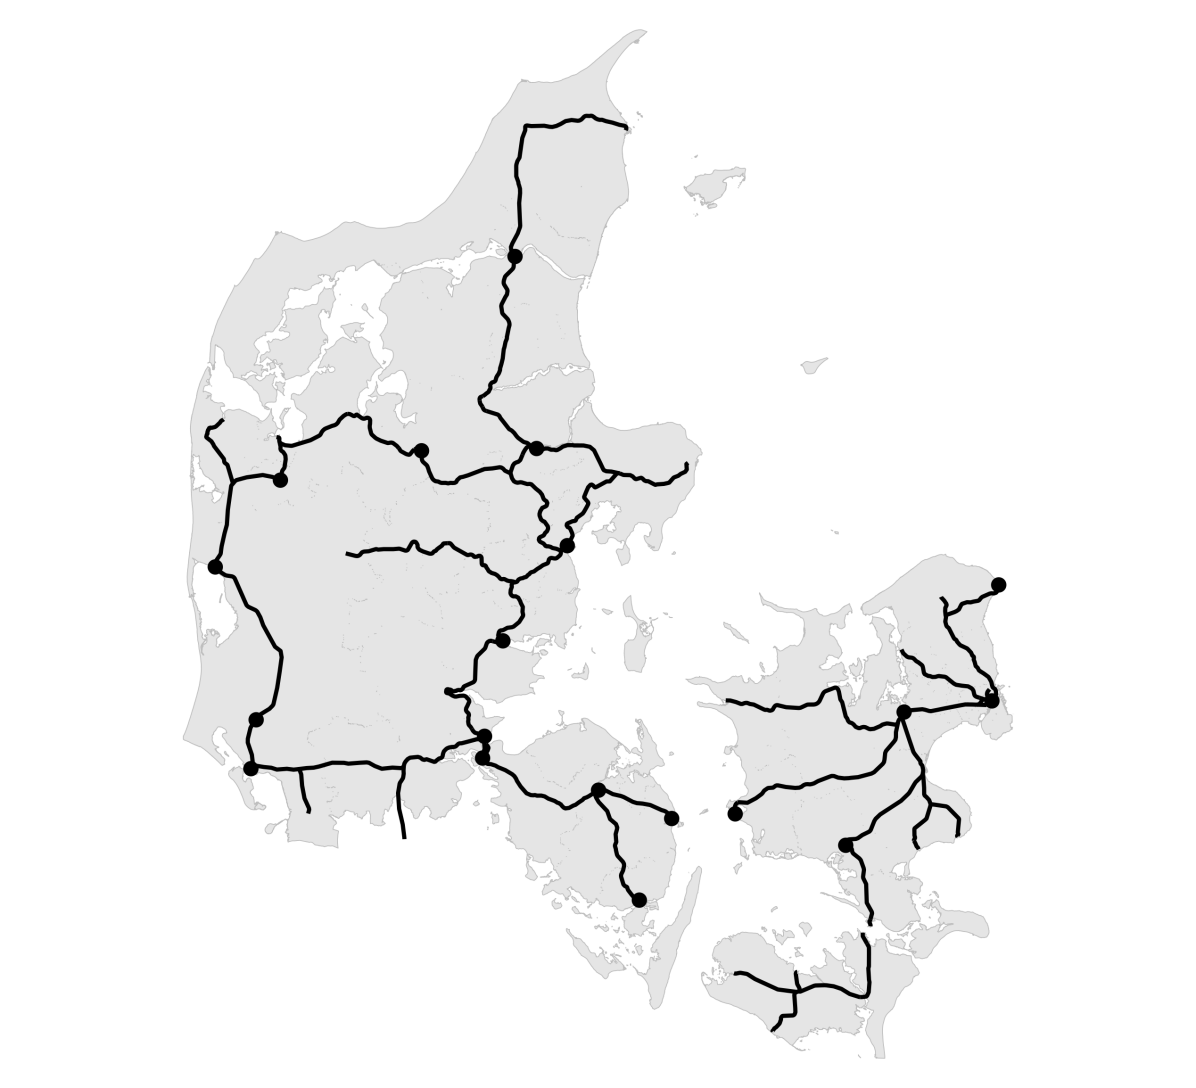
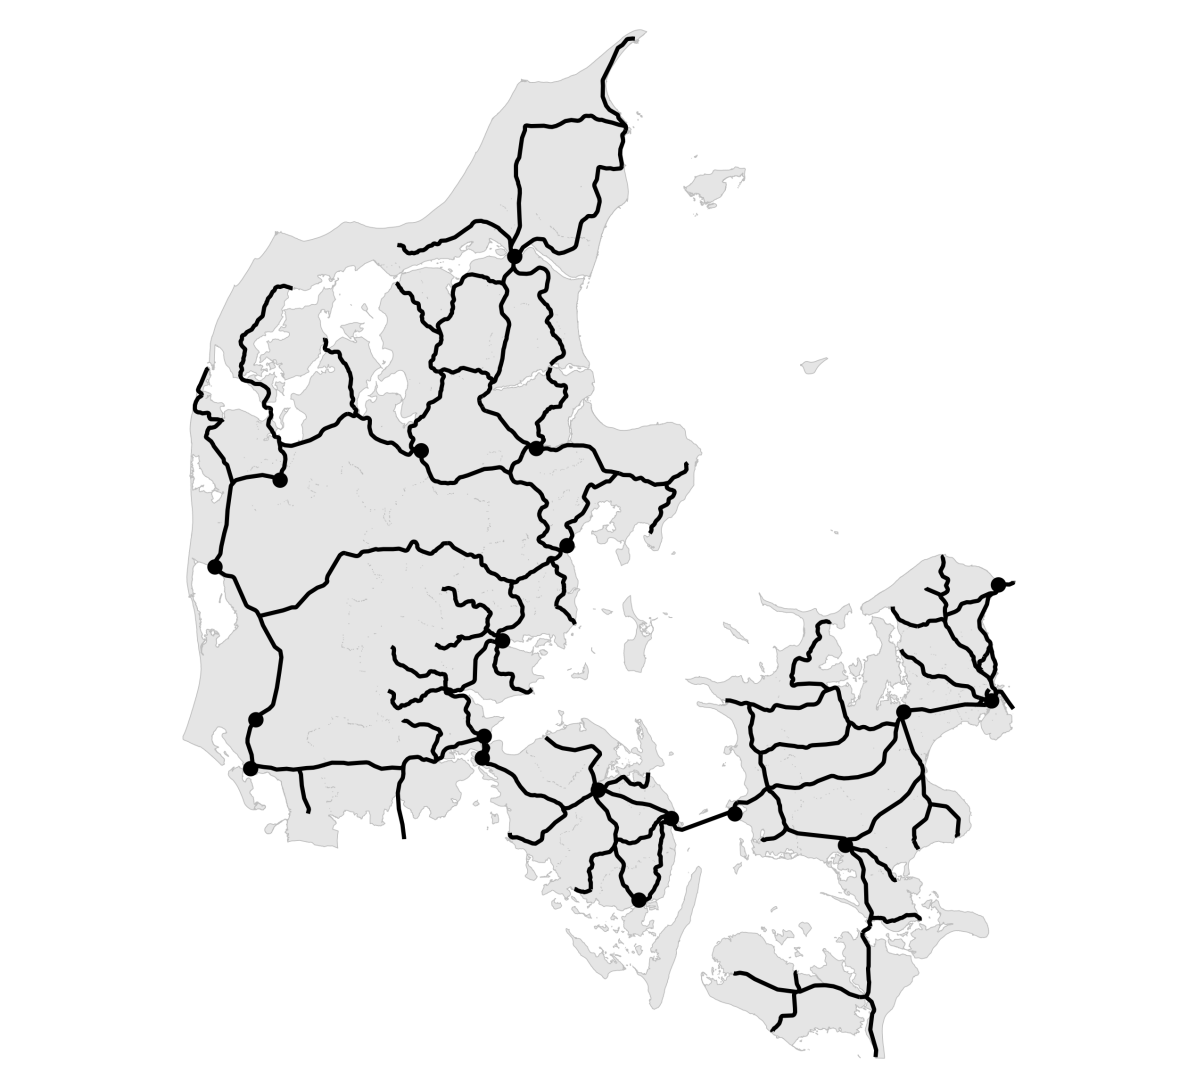
Figure 5 illustrates the expansion of Denmark’s railway network from 1850 to 1901, corresponding to the census years used in our analysis of development outcomes.555Appendix B supplements this with maps including least cost paths. The construction of the railway network was a gradual process, reflecting a combination of economic imperatives and political considerations, as discussed in the historical background. Each panel depicts a different census year. Panel A depicts Denmark’s first railway line, opened in 1847 between Copenhagen and Roskilde. Important nodes,666Defined as market towns with above the 75th percentile of population in 1801 as well as important nodes for crossing water, Korsør and Middelfart, and the West coast Esbjerg, Ringkøbing, Holstebro, and Varde. These were some of the terminal points that politicians aimed for, when Denmark was connected. are also shown. Panel B, showing the railway network in 1860, highlights the extension from Roskilde to Korsør, which was intended to facilitate transport across the Great Belt. However, a direct railway ferry connection was not established until 1883. Hence, prior to this, the absence of a fixed rail link imposed frictions in connectivity, increasing transport costs and travel times for passengers, goods and mail across the Belt between Zealand and Funen. Panel C, capturing the state of the railway network in 1880, marks a period of rapid expansion. Between 1860 and 1880, the railway network grew significantly, linking major towns across Denmark. By this stage, rail access was beginning to influence both economic activity and social change. Panel D, presenting the network in 1901, shows a near-complete railway system.
6 Results
Table 3 presents the regression results for key economic outcomes. Panel A reports the Two-Way Fixed Effects (TWFE) estimates, while Panel B displays the Callaway \BBA Sant’Anna (\APACyear2021) estimates. Column (1) shows that railway access is associated with a population increase of approximately 6.5 percent. Column (2) indicates no significant impact on fertility, as measured by the child-women ratio. Column (3) demonstrates a significant increase in the number of individuals working in manufacturing, while Column (4) shows a similar positive effect for occupations outside agriculture. Notably, both of these effects exceed the overall population growth effect, suggesting that railway expansion was not merely facilitating demographic expansion but also shifting occupational structures. Column (5) provides evidence of an increase in the average parish-level HISCAM score, indicating an overall improvement in occupational status. Finally, Column (6) shows a rise in the number of individuals born in a different county, suggesting that railways facilitated internal migration. These results collectively indicate that railways played a transformative role in local economic development, not only by increasing population but also by reshaping labor markets and patterns of migration.777We note, that the density plots shown above does not call for any controls to be added. Yet, to err on the side of caution, Appendix C shows results using extensive controls in the classical way for TWFE results and using the Sant’Anna \BBA Zhao (\APACyear2020) Doubly Robust method for the Callaway \BBA Sant’Anna (\APACyear2021) results. The TWFE estimates in Table A1 Panel A remain similar, with the exception of the average HISCAM, which is still positive but now insignificant. For Table A1 Panel B, the parameter signs are similar in size an magnitude, but only the result for population growth remain statistically significant.
Table 4 suggests a positive causal relationship between railway connection and the spread of Grundtvigianism, as measured by the presence of assembly houses and folk high schools. Panel A presents the Two-Way Fixed Effects (TWFE) estimates, while Panel B reports the Callaway and Sant’Anna estimates. Columns (1) and (2) show results using an indicator variable for whether a parish had an assembly house or a folk high school. The TWFE estimates indicate that railway access is associated with a statistically significant increase in the probability of a parish having an assembly house (Column 1) and, to a lesser extent, a folk high school (Column 2). The Callaway and Sant’Anna estimates also show a significant increase in the probability of a parish having a folk high school but no significant effect on assembly houses. Columns (3) and (4) use local density, measured via market access, as the outcome variable instead. While the TWFE estimates in Column (3) do not show a significant effect on the density of assembly houses, Column (4) suggests a positive and significant effect on the density of folk high schools. The Callaway and Sant’Anna estimates in Panel B reinforce these findings, showing a significant increase in both density measures.888Once again, we note, that the density plots shown above does not call for any controls to be added. Yet, to err on the side of caution, Appendix C shows results using extensive controls in the classical way for TWFE results and using the Sant’Anna \BBA Zhao (\APACyear2020) Doubly Robust method for the Callaway \BBA Sant’Anna (\APACyear2021) results. The TWFE estimates in Table A2 Panel A remain similar. For Table A1 Panel B, the sign of the estimates remains positive but nothing is significant. Overall, these results suggest that railway access facilitated the expansion of Grundtvigian institutions, reinforcing the role of infrastructure in shaping the emergence of modern Denmark. However, the apparently different results between the two methods, for especially the Grundtvigian outcomes, motivates a further decomposition of dynamics.999Complementing this, the results of the IV estimation are provided in Appendix D. However, it is important to note that our instrument primarily captures the main line rollout. As the decomposition of these results demonstrate below, these early expansions were associated with lower responsiveness, particularly concerning development outcomes. The IV results still lend support to our earlier findings. Specifically, both the Two-Way Fixed Effects (TWFE) regressions, using the LCP instrument for railway access, and the Callaway and Sant’Anna specifications, which employ the instrument directly in a reduced-form approach, reveal statistically significant positive effects of railway access on population growth, average social status, and the local density of assembly houses and folk high schools. Notably, the IV estimates also align well with the expected timing, as suggested by the effect decompositions in Figures 6 and 7, which are introduced below. We turn to this next.
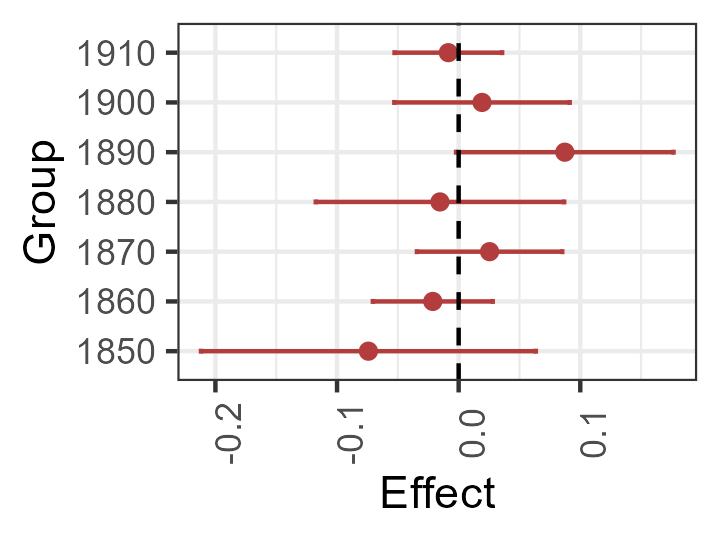
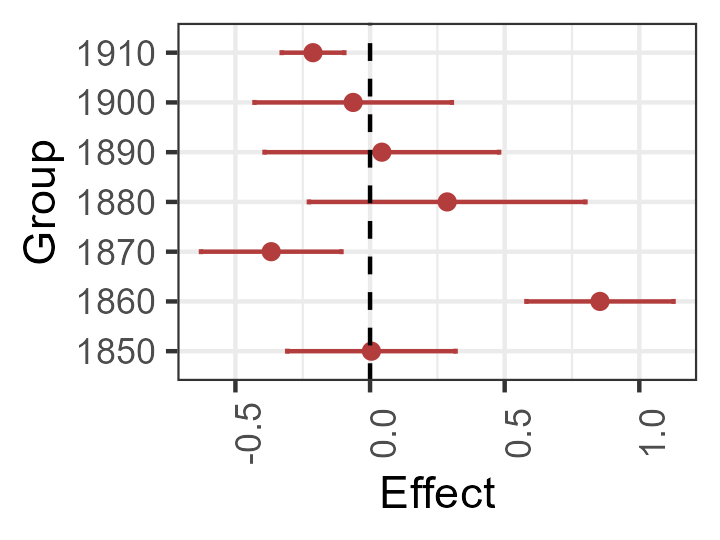
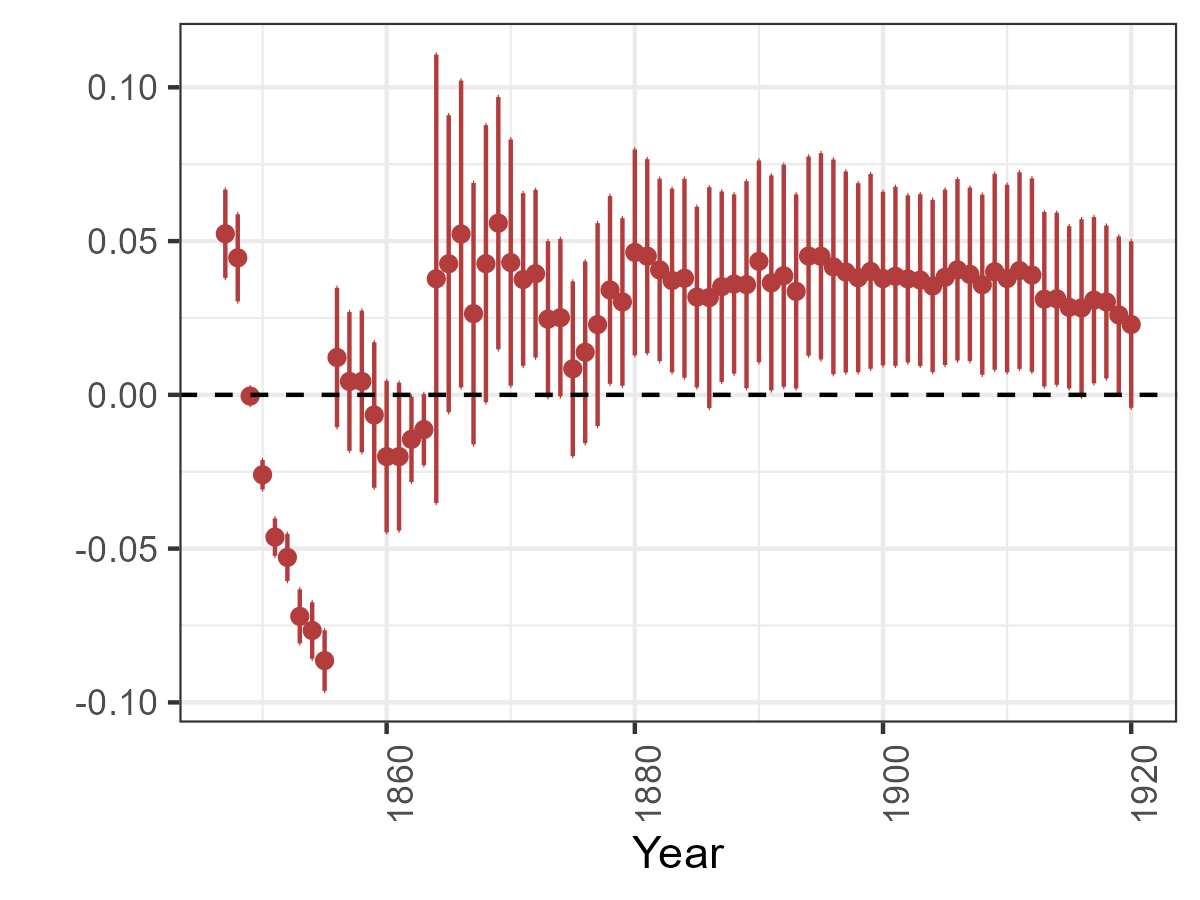
To gain deeper insight into the dynamics at play, we must consider how the impact of railway connection varied over time. Figure 6 presents the results of decomposing the census data results by the period in which a parish was connected — before 1860, between 1861 and 1880, or between 1881 and 1901 — aligned with census years. For each of these groups we compute the average effect over the entire period in which it was connected. Panel A illustrates that population growth was either negligible or slightly negative for parishes connected in the first wave but became positive for later connections. Panel B suggests a borderline negative effect on the child-women ratio for the 1860 group, with no significant effect for the subsequent periods. Panel C indicates a positive impact on manufacturing employment, but only for parishes connected in the 1880 and 1901 waves, with an uncertain effect for the earliest group. Panel D follows a similar pattern, showing growth in non-agricultural occupations primarily for later-connected parishes. Panel E highlights that the only group experiencing a consistent positive impact on HISCAM scores was the 1880 cohort. Finally, Panel F reveals a substantial positive effect on migration (approximately 30 percent) exclusively for the 1901 group, whereas earlier connections saw either no effect or a slight decline. This suggests that migration to railway towns only became a significant factor in the later phases of railway expansion. It should be noted that our measure of internal migration only captures migration from other counties, whereas we cannot pick up local migration within counties.101010An alternative decomposition is offered in Appendix E, where we compute the average effect irrespective of connection timing for each census year. The same the same qualitative patterns remain.
| Outcome: | log(Pop.) | log(Child women ratio) | log(Manufacturing + 1) | log(Not Agriculture + 1) | HISCAM avg | log(Migration) |
|---|---|---|---|---|---|---|
| (1) | (2) | (3) | (4) | (5) | (6) | |
| A. TWFE estimates | ||||||
| Connected railway | 0.0654∗∗∗ | -0.0003 | 0.1200∗∗∗ | 0.0950∗∗∗ | 0.1723∗∗∗ | 0.1124∗∗∗ |
| (0.0106) | (0.0032) | (0.0195) | (0.0190) | (0.0604) | (0.0417) | |
| Observations | 6,356 | 6,336 | 6,356 | 6,356 | 6,355 | 6,356 |
| Mean of outcome | 6.4738 | 0.39484 | 4.1637 | 4.4711 | 48.631 | 4.4012 |
| B. Callaway and Sant’Anna estimates | ||||||
| Connected railway | 0.06736∗∗∗ | 0.001052 | 0.09863∗∗∗ | 0.07238∗∗∗ | 0.2207∗∗∗ | 0.09671∗∗ |
| (0.01127) | (0.003378) | (0.02224) | (0.02218) | (0.07203) | (0.04505) | |
| Observations | 6324 | 6244 | 6324 | 6324 | 6320 | 6324 |
| Mean of Outcome | 6.472 | 0.3949 | 4.161 | 4.468 | 48.62 | 4.394 |
| Outcome: | Assembly house | Folk high school | Density Assembly | Density Folk High |
|---|---|---|---|---|
| houses (MA) | Schools (MA) | |||
| (1) | (2) | (3) | (4) | |
| A. TWFE estimates | ||||
| Connected railway | 0.0405∗∗∗ | 0.0106∗ | -0.0237 | 0.0144∗∗ |
| (0.0134) | (0.0058) | (0.0697) | (0.0073) | |
| Observations | 119,175 | 119,175 | 119,175 | 119,175 |
| Mean of outcome | 0.17150 | 0.02945 | 4.4639 | 0.70244 |
| B. Callaway and Sant’Anna estimates | ||||
| Connected railway | -0.003269 | 0.01582∗∗ | 0.1198∗ | 0.0348∗∗∗ |
| (0.01398) | (0.006652) | (0.0714) | (0.007533) | |
| Observations | 119200 | 119200 | 119200 | 119200 |
| Mean of Outcome | 0.1715 | 0.02945 | 4.464 | 0.7024 |
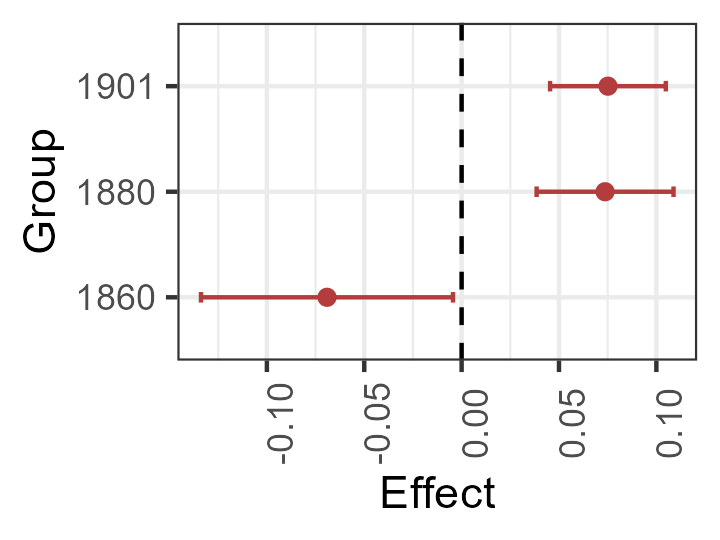
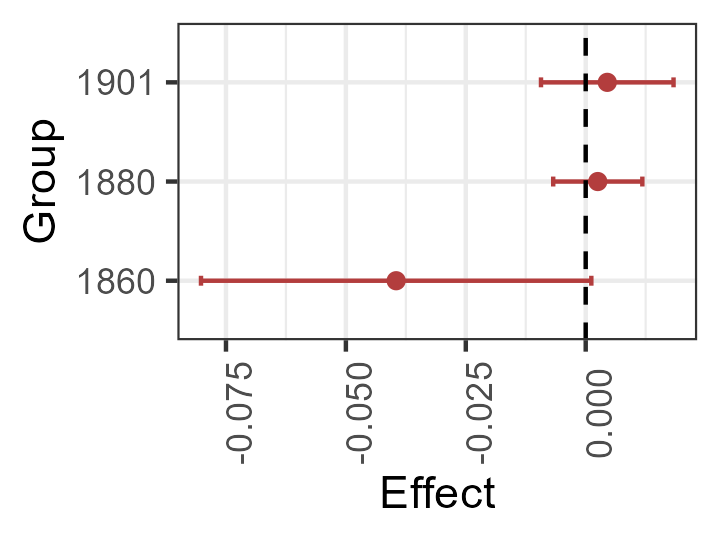
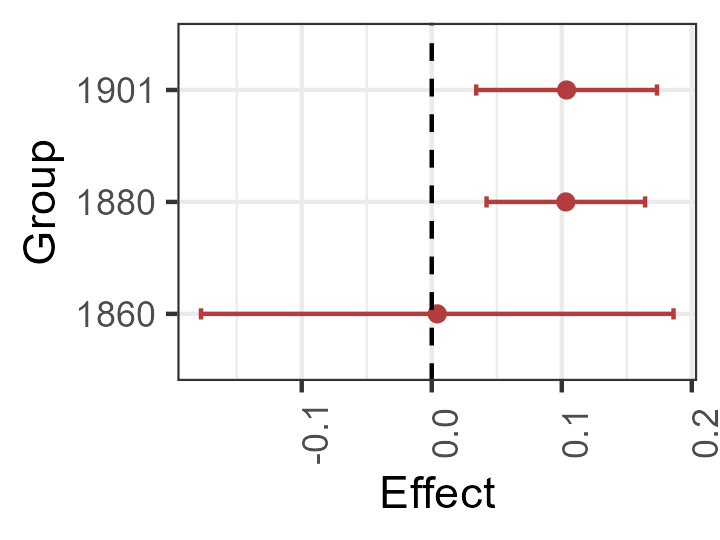


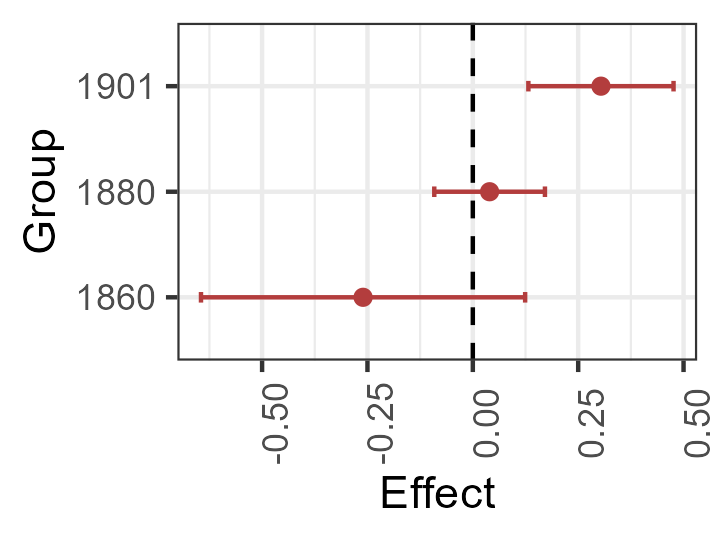
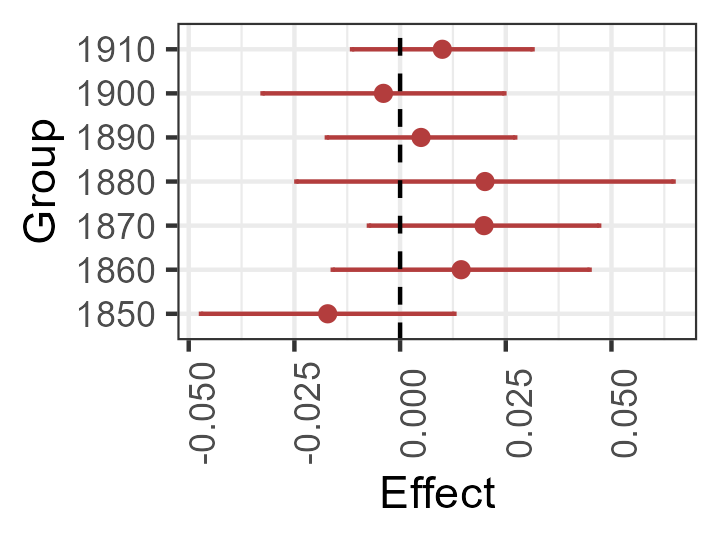
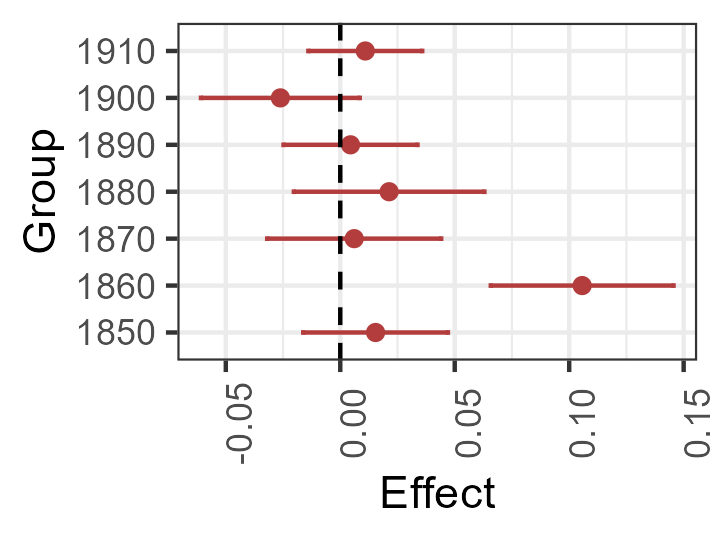
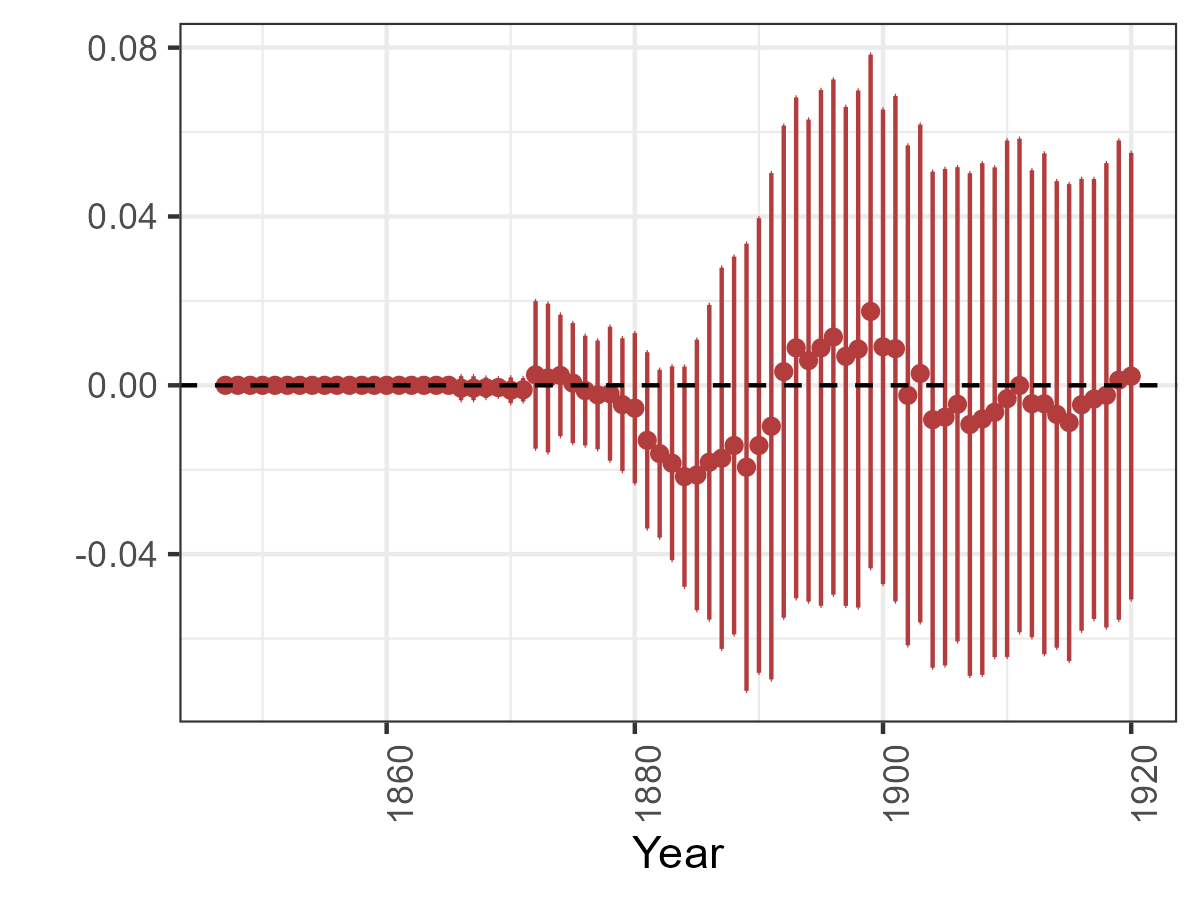
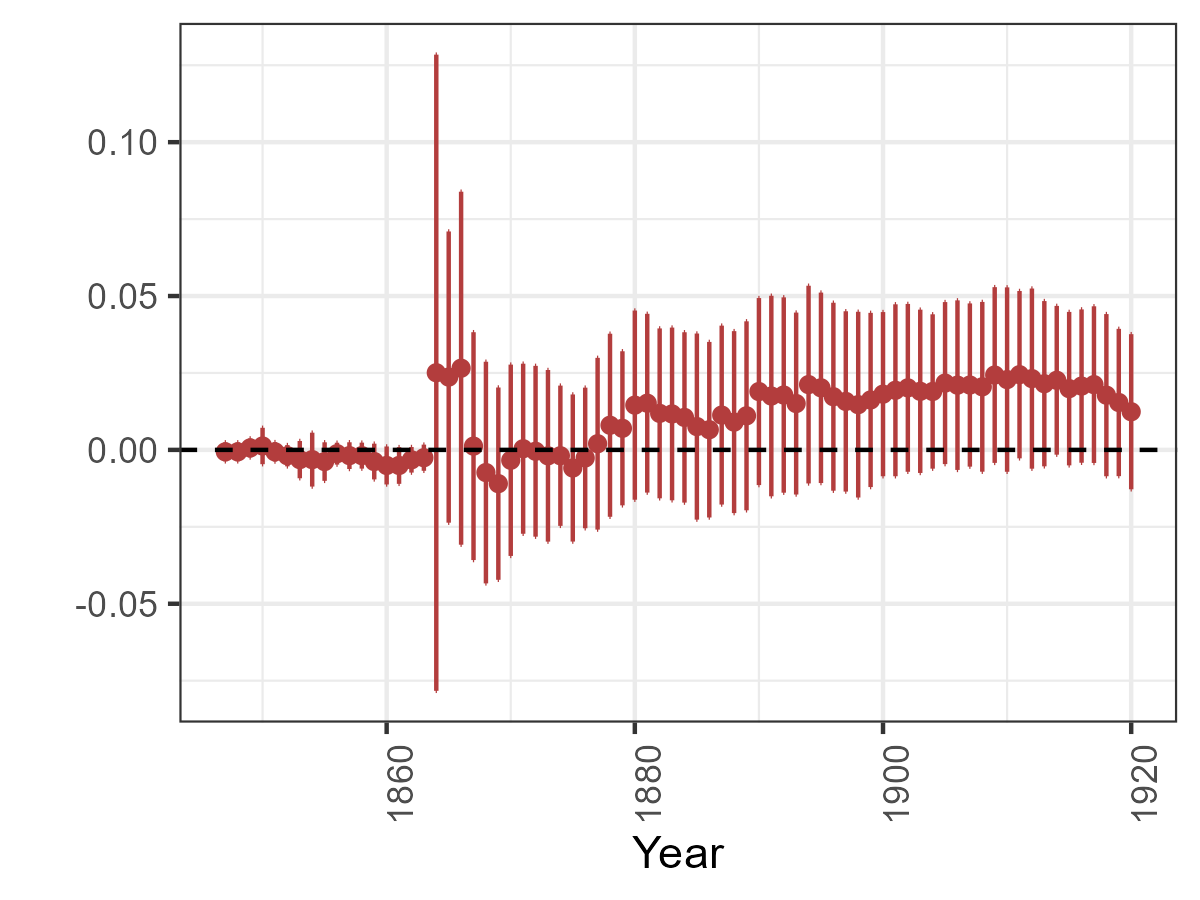
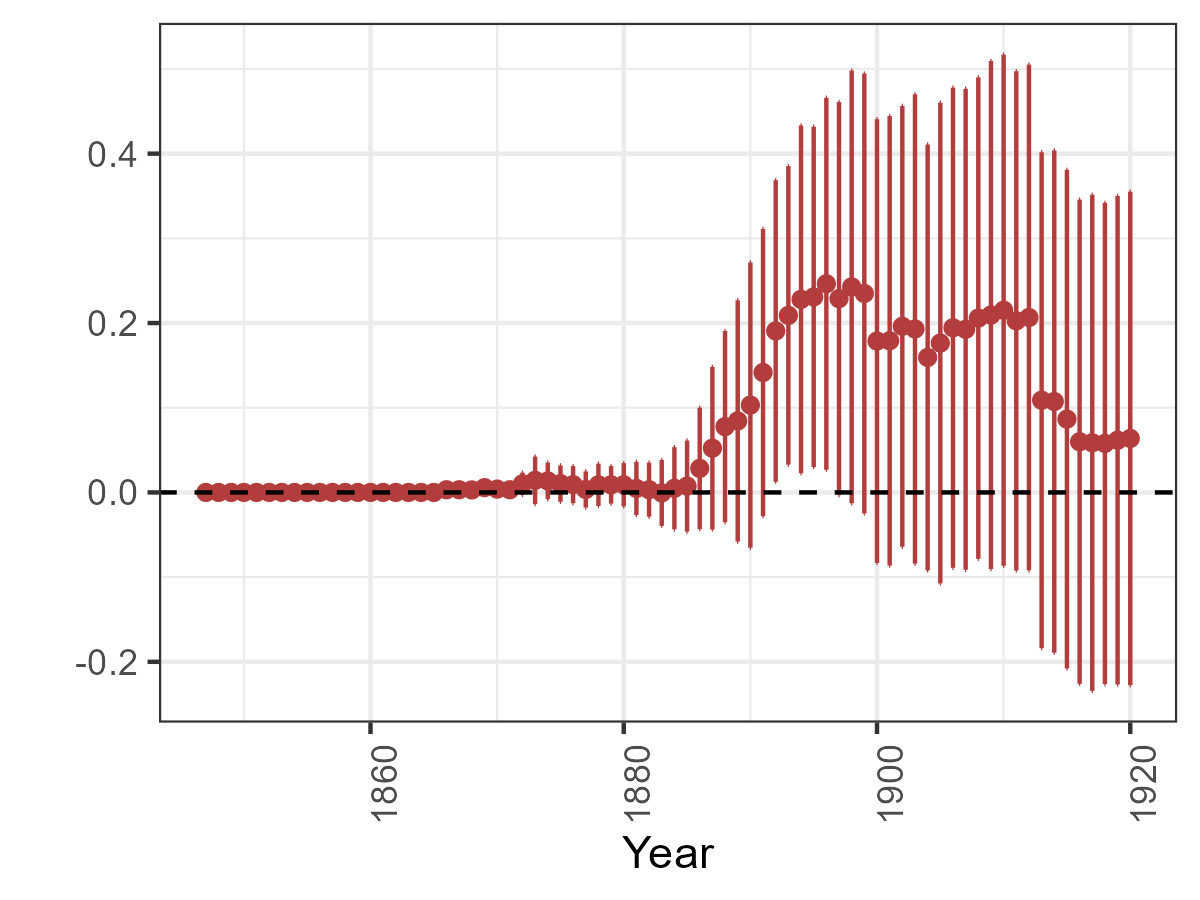
Figure 7 provides a parallel decomposition for the spread of assembly houses and folk high schools, serving as proxies for Grundtvigianism. However, since we have year by year data, there are many groups to compare, and for that reason, we prefer the decomposition by calendar time. That is, we take the average effect for all connected parishes experienced in some particular year. While statistical power is limited, the estimates largely align with the patterns observed for economic and demographic outcomes. Panel A, shows that for assembly houses, the estimated effect remains close to zero or slightly negative until the 1880s, after which it becomes modestly positive. Panel B displays a similar pattern for folk high schools, where initial volatility in the 1860s and 1870s gives way to small positive effects toward the late 19th century. Panels C and D report density measures, capturing not only the presence but also the local concentration of these institutions. For assembly houses in Panel C, the effect is negligible until around the mid-1880s, then rises substantially, while for folk high schools in Panel D, the density effect also shifts from minimal to small positive values post-1880. Overall, all panels consistently illustrate that the railway’s influence on Grundtvigian institutions was minimal before the 1880s and emerged more strongly afterward, highlighting the evolution of these cultural and institutional outcomes over calendar time.111111An alternative decomposition is offered in Appendix F, where we compute the average effect by treatment year, but rounding down to the closest decade. The same the same qualitative patterns remain.
To interpret these results, it key here, to understand that neither assembly houses or folk high schools had any inherent need of the railway, once they were first established. It only requires the idea to arrive (here by railways) and someone to be motivated to manifest these ideas into institutions. The railway mattered for the spread of Grundtvigianism, but it mattered for the local density of these ideas, and less strongly so, for the particular parishes which were connected.
The results presented in this section provide strong evidence that the introduction of railways played a crucial role in shaping both economic and cultural transformations in Denmark. Rail connections facilitated population growth, occupational shifts towards manufacturing and non-agricultural work, internal migration and generally better occupational outcomes as reflected in higher HISCAM scores. At the same time, railways appear to have contributed to the spread of Grundtvigianism, particularly through the establishment of assembly houses and folk high schools. However, these effects were not immediate - especially economic changes materialized with a lag, becoming more pronounced towards the late nineteenth century, whereas the new ideas arrived earlier. This suggests that infrastructure development did not merely accelerate preexisting trends but actively contributed to the emergence of modern Denmark by reshaping patterns of economic activity, migration, and cultural organization.
7 Conclusion
We have examined the role of railway expansion in shaping Denmark’s economic transformation and the spread of social movements during the nineteenth century. While previous research has documented the economic impact of railways in facilitating trade, urbanization, and structural change, our study goes further by exploring their role in fostering social and cultural shifts. Specifically, we provide evidence that railways not only contributed to population growth and occupational change but also played a key role in the diffusion of Grundtvigian institutions, which in turn supported the emergence of cooperative enterprises.
Our empirical findings lend support to the idea that railway access significantly increased local population growth, consistent with findings from other historical contexts. This expansion was not merely redistributive; instead, it facilitated a broader transition away from agriculture and towards manufacturing and services, reflecting structural change that was fundamental to Denmark’s modernization. Importantly, we show that these economic effects were complemented by institutional changes, as railway-connected areas were more likely to develop assembly houses and folk high schools. These institutions, which were central to the Grundtvigian movement, provided the organizational framework for civic engagement and collective decision-making, key preconditions for the emergence of Denmark’s cooperative creameries. By establishing a causal link between railway expansion and the spread of Grundtvigian institutions, our findings contribute to a broader literature on the interplay between infrastructure development and social change. While prior studies have examined how railways facilitated market integration and technological diffusion, we highlight their role as a conduit for ideological transformation. The case of Denmark illustrates how improved connectivity can serve as both an economic and cultural catalyst, reinforcing inclusive institutions that promote long-term development.
Moreover, our findings underscore the importance of sequencing in the development process. We document that railways preceded the establishment of cooperatives, suggesting that economic modernization created the conditions necessary for institutional innovation. This sequence aligns with broader theories of development, which emphasize the interaction between physical infrastructure, market access, and institutional capacity. In Denmark’s case, railways not only enabled economic growth but also created the social preconditions for cooperative organization, which became a cornerstone of the country’s economic model.
These insights have broader implications for understanding how infrastructure investments shape national trajectories. While the Danish case is historically specific, it resonates with contemporary debates on the role of transport networks in fostering inclusive development. Our findings suggest that policymakers should consider not only the economic benefits of infrastructure investments but also their potential to influence institutional and cultural change. By fostering civic participation, education, and collective decision-making, infrastructure projects can have far-reaching effects beyond their immediate economic returns.
Taken together, our results highlight that the impact of railways extended beyond commerce and industry—they helped shape the very institutions that underpinned Denmark’s modern economic and social model. Future research could build on this work by further investigating the mechanisms through which transport networks influence institutional evolution, as well as exploring how similar dynamics have played out in other historical and contemporary contexts.
References
- Aagesen (\APACyear1949) \APACinsertmetastaraagesen1949geografiske{APACrefauthors}Aagesen, A. \APACrefYear1949. \APACrefbtitleGeografiske Studier Over Jernbanerne I Danmark Geografiske studier over jernbanerne i danmark. \APACaddressPublisherI Kommission: H. Hagerup. {APACrefURL} https://books.google.de/books?id=cKYbAAAAIAAJ \PrintBackRefs\CurrentBib
- Andersson \BOthers. (\APACyear2023) \APACinsertmetastarAndersson_et_al_2023{APACrefauthors}Andersson, D., Berger, T.\BCBL \BBA Prawitz, E. \APACrefYearMonthDay202303. \BBOQ\APACrefatitleMaking a Market: Infrastructure, Integration, and the Rise of Innovation Making a Market: Infrastructure, Integration, and the Rise of Innovation.\BBCQ \APACjournalVolNumPagesThe Review of Economics and Statistics1052258-274. {APACrefURL} https://doi.org/10.1162/rest\_a\_01067 {APACrefDOI} \doi10.1162/rest_a_01067 \PrintBackRefs\CurrentBib
- Atack \BOthers. (\APACyear2010) \APACinsertmetastaratack2010{APACrefauthors}Atack, J., Bateman, F., Haines, M.\BCBL \BBA Margo, R\BPBIA. \APACrefYearMonthDay2010. \BBOQ\APACrefatitleDid Railroads Induce or Follow Economic Growth? Urbanization and Population Growth in the American Midwest, 1850-1860 Did Railroads Induce or Follow Economic Growth? Urbanization and Population Growth in the American Midwest, 1850-1860.\BBCQ \APACjournalVolNumPagesSocial Science History342171–197. {APACrefURL} [2025-02-12]http://www.jstor.org/stable/40587344 \PrintBackRefs\CurrentBib
- Atack \BOthers. (\APACyear2011) \APACinsertmetastaratack2011railroads{APACrefauthors}Atack, J., Haines, M.\BCBL \BBA Margo, R\BPBIA. \APACrefYearMonthDay2011. \BBOQ\APACrefatitleRailroads and the Rise of the Factory: Evidence for the United States, 1850-1870 Railroads and the Rise of the Factory: Evidence for the United States, 1850-1870.\BBCQ \BIn P\BPBIR. Rhode \BBA D. Weiman (\BEDS), \APACrefbtitleEconomic Evolution and Revolutions in Historical Time Economic evolution and revolutions in historical time (\BPGS 162–179). \APACaddressPublisherPalo Alto, CAStanford University Press. \PrintBackRefs\CurrentBib
- Atack \BOthers. (\APACyear2012) \APACinsertmetastaratack2012impact{APACrefauthors}Atack, J., Margo, R.\BCBL \BBA Perlman, E. \APACrefYearMonthDay2012. \BBOQ\APACrefatitleThe Impact of Railroads on School Enrollment in Nineteenth Century America The Impact of Railroads on School Enrollment in Nineteenth Century America.\BBCQ \APACjournalVolNumPagesUnpublished Working Paper, Boston University. \PrintBackRefs\CurrentBib
- Atack \BOthers. (\APACyear2022) \APACinsertmetastarAtack2022{APACrefauthors}Atack, J., Margo, R\BPBIA.\BCBL \BBA Rhode, P\BPBIW. \APACrefYearMonthDay2022. \BBOQ\APACrefatitleIndustrialization and urbanization in nineteenth century America Industrialization and urbanization in nineteenth century america.\BBCQ \APACjournalVolNumPagesRegional Science and Urban Economics94103678. {APACrefURL} https://www.sciencedirect.com/science/article/pii/S0166046221000387 \APACrefnoteUrban Economics and History {APACrefDOI} \doihttps://doi.org/10.1016/j.regsciurbeco.2021.103678 \PrintBackRefs\CurrentBib
- Bentzen \BOthers. (\APACyear2023) \APACinsertmetastarbentzen2023holy{APACrefauthors}Bentzen, J\BPBIS., Boberg-Fazlić, N., Sharp, P., Skovsgaard, C\BPBIV.\BCBL \BBA Vedel, C. \APACrefYearMonthDay2023. \APACrefbtitleHoly Cows and Spilt Milk-The Impact of Religious Conflict on Firm-Level Productivity Holy cows and spilt milk-the impact of religious conflict on firm-level productivity \APACbVolEdTR\BTR. \PrintBackRefs\CurrentBib
- Bentzen \BOthers. (\APACyear2024) \APACinsertmetastarbentzen2024assimilate{APACrefauthors}Bentzen, J\BPBIS., Boberg-Fazlić, N., Sharp, P., Skovsgaard, C\BPBIV.\BCBL \BBA Vedel, C. \APACrefYearMonthDay2024. \APACrefbtitleAssimilate for God: The Impact of Religious Divisions on Danish American Communities Assimilate for god: The impact of religious divisions on danish american communities \APACbVolEdTR\BTR. \PrintBackRefs\CurrentBib
- Berger (\APACyear2019) \APACinsertmetastarberger2019{APACrefauthors}Berger, T. \APACrefYearMonthDay2019. \BBOQ\APACrefatitleRailroads and Rural Industrialization: evidence from a Historical Policy Experiment Railroads and Rural Industrialization: evidence from a Historical Policy Experiment.\BBCQ \APACjournalVolNumPagesExplorations in Economic History74101277. {APACrefURL} https://www.sciencedirect.com/science/article/pii/S0014498318302080 {APACrefDOI} \doihttps://doi.org/10.1016/j.eeh.2019.06.002 \PrintBackRefs\CurrentBib
- Berger \BBA Enflo (\APACyear2017) \APACinsertmetastarberger_enflo_2017{APACrefauthors}Berger, T.\BCBT \BBA Enflo, K. \APACrefYearMonthDay2017. \BBOQ\APACrefatitleLocomotives of local growth: The short- and long-term impact of railroads in Sweden Locomotives of local growth: The short- and long-term impact of railroads in sweden.\BBCQ \APACjournalVolNumPagesJournal of Urban Economics98124-138. {APACrefURL} https://www.sciencedirect.com/science/article/pii/S0094119015000595 \APACrefnoteUrbanization in Developing Countries: Past and Present {APACrefDOI} \doihttps://doi.org/10.1016/j.jue.2015.09.001 \PrintBackRefs\CurrentBib
- Boberg-Fazlic \BOthers. (\APACyear2023) \APACinsertmetastarBobergFazlic2023{APACrefauthors}Boberg-Fazlic, N., Jensen, P\BPBIS., Lampe, M.\BCBL \BBA et al. \APACrefYearMonthDay2023. \BBOQ\APACrefatitleGetting to Denmark: the role of agricultural elites for development Getting to denmark: the role of agricultural elites for development.\BBCQ \APACjournalVolNumPagesJournal of Economic Growth28525–569. {APACrefURL} https://doi.org/10.1007/s10887-023-09226-8 {APACrefDOI} \doi10.1007/s10887-023-09226-8 \PrintBackRefs\CurrentBib
- Bogart \BOthers. (\APACyear2022) \APACinsertmetastarbogart2022{APACrefauthors}Bogart, D., You, X., Alvarez-Palau, E\BPBIJ., Satchell, M.\BCBL \BBA Shaw-Taylor, L. \APACrefYearMonthDay2022. \BBOQ\APACrefatitleRailways, divergence, and structural change in 19th century England and Wales Railways, divergence, and structural change in 19th century england and wales.\BBCQ \APACjournalVolNumPagesJournal of Urban Economics128103390. {APACrefURL} https://www.sciencedirect.com/science/article/pii/S0094119021000723 {APACrefDOI} \doihttps://doi.org/10.1016/j.jue.2021.103390 \PrintBackRefs\CurrentBib
- Braun \BBA Franke (\APACyear2022) \APACinsertmetastarbraun2022{APACrefauthors}Braun, S\BPBIT.\BCBT \BBA Franke, R. \APACrefYearMonthDay2022. \BBOQ\APACrefatitleRailways, Growth, and Industrialization in a Developing German Economy, 1829–1910 Railways, growth, and industrialization in a developing german economy, 1829–1910.\BBCQ \APACjournalVolNumPagesThe Journal of Economic History8241183–1221. {APACrefDOI} \doi10.1017/S0022050722000377 \PrintBackRefs\CurrentBib
- Buch \BBA Gomard (\APACyear1933) \APACinsertmetastarbuch1933danmarks{APACrefauthors}Buch, M.\BCBT \BBA Gomard, C\BPBII. \APACrefYear1933. \APACrefbtitleDanmarks Jernbaner. Historisk og Biografisk Haandbog Danmarks jernbaner. historisk og biografisk haandbog (\BVOL 1). \APACaddressPublisherAlex Kappels Forlag. \PrintBackRefs\CurrentBib
- Büchel \BBA Kyburz (\APACyear2018) \APACinsertmetastarBüchel_and_Kyburz_2018{APACrefauthors}Büchel, K.\BCBT \BBA Kyburz, S. \APACrefYearMonthDay201812. \BBOQ\APACrefatitleFast track to growth? Railway access, population growth and local displacement in 19th century Switzerland Fast track to growth? railway access, population growth and local displacement in 19th century switzerland.\BBCQ \APACjournalVolNumPagesJournal of Economic Geography201155-195. {APACrefURL} https://doi.org/10.1093/jeg/lby046 {APACrefDOI} \doi10.1093/jeg/lby046 \PrintBackRefs\CurrentBib
- Callaway \BBA Sant’Anna (\APACyear2021) \APACinsertmetastarCallaway2021{APACrefauthors}Callaway, B.\BCBT \BBA Sant’Anna, P\BPBIH. \APACrefYearMonthDay2021. \BBOQ\APACrefatitleDifference-in-Differences with multiple time periods Difference-in-differences with multiple time periods.\BBCQ \APACjournalVolNumPagesJournal of Econometrics2252200-230. {APACrefURL} https://www.sciencedirect.com/science/article/pii/S0304407620303948 \APACrefnoteThemed Issue: Treatment Effect 1 {APACrefDOI} \doihttps://doi.org/10.1016/j.jeconom.2020.12.001 \PrintBackRefs\CurrentBib
- Cermeño \BOthers. (\APACyear2022) \APACinsertmetastarCermeño_Enflo_Lindvall_2022{APACrefauthors}Cermeño, A\BPBIL., Enflo, K.\BCBL \BBA Lindvall, J. \APACrefYearMonthDay2022. \BBOQ\APACrefatitleRailroads and Reform: How Trains Strengthened the Nation State Railroads and reform: How trains strengthened the nation state.\BBCQ \APACjournalVolNumPagesBritish Journal of Political Science522715–735. {APACrefDOI} \doi10.1017/S0007123420000654 \PrintBackRefs\CurrentBib
- Chaudhary \BBA Fenske (\APACyear2023) \APACinsertmetastarChaudhary_Fenske_2023{APACrefauthors}Chaudhary, L.\BCBT \BBA Fenske, J. \APACrefYearMonthDay2023. \BBOQ\APACrefatitleRailways, Development, and Literacy in India Railways, Development, and Literacy in India.\BBCQ \APACjournalVolNumPagesThe Journal of Economic History8341139–1174. {APACrefDOI} \doi10.1017/S0022050723000372 \PrintBackRefs\CurrentBib
- Ciccarelli \BOthers. (\APACyear2023) \APACinsertmetastarCiccarelli_et_al_WP{APACrefauthors}Ciccarelli, C., Fenske, J.\BCBL \BBA Martí Henneberg, J. \APACrefYearMonthDay2023. \APACrefbtitleRailways and the European Fertility Transition Railways and the European Fertility Transition \APACbVolEdTRThe Warwick Economics Research Paper Series (TWERPS) \BNUM 1477. \APACaddressInstitutionUniversity of Warwick, Department of Economics. {APACrefURL} https://ideas.repec.org/p/wrk/warwec/1477.html \PrintBackRefs\CurrentBib
- Costas-Fernández \BOthers. (\APACyear2020) \APACinsertmetastarcostas2020train{APACrefauthors}Costas-Fernández, J., Guerra, J\BHBIA.\BCBL \BBA Mohnen, M. \APACrefYearMonthDay2020. \BBOQ\APACrefatitleTrain to Opportunity: The Effect of Infrastructure on Intergenerational Mobility Train to Opportunity: The Effect of Infrastructure on Intergenerational Mobility.\BBCQ \APACjournalVolNumPagesDocumento CEDE48. \PrintBackRefs\CurrentBib
- Dahl \BOthers. (\APACyear2024) \APACinsertmetastardahl2024hisco{APACrefauthors}Dahl, C\BPBIM., Johansen, T.\BCBL \BBA Vedel, C. \APACrefYearMonthDay2024. \APACrefbtitleBreaking the HISCO Barrier: Automatic Occupational Standardization with OccCANINE. Breaking the hisco barrier: Automatic occupational standardization with occcanine. {APACrefURL} https://arxiv.org/abs/2402.13604 \PrintBackRefs\CurrentBib
- Digdag.dk (\APACyear2021) \APACinsertmetastardigdag{APACrefauthors}Digdag.dk. \APACrefYearMonthDay2021. \APACrefbtitleDigDag - Digital Atlas of the Danish Historical-Administrative Geography. DigDag - Digital Atlas of the Danish Historical-Administrative Geography. \APACaddressPublisherCopenhagenRigsarkivet (Danish National Archives). {APACrefURL} www.digdag.dk/ \PrintBackRefs\CurrentBib
- Donaldson \BBA Hornbeck (\APACyear2016) \APACinsertmetastardonaldson2016{APACrefauthors}Donaldson, D.\BCBT \BBA Hornbeck, R. \APACrefYearMonthDay201602. \BBOQ\APACrefatitleRailroads and American Economic Growth: A “Market Access” Approach Railroads and American Economic Growth: A “Market Access” Approach.\BBCQ \APACjournalVolNumPagesThe Quarterly Journal of Economics1312799-858. {APACrefURL} https://doi.org/10.1093/qje/qjw002 {APACrefDOI} \doi10.1093/qje/qjw002 \PrintBackRefs\CurrentBib
- Enflo \BOthers. (\APACyear2018) \APACinsertmetastarenflo2018transportation{APACrefauthors}Enflo, K., Alvarez-Palau, E.\BCBL \BBA Marti-Henneberg, J. \APACrefYearMonthDay2018. \BBOQ\APACrefatitleTransportation and Regional Inequality: The Impact of Railways in the Nordic Countries, 1860–1960 Transportation and Regional Inequality: The Impact of Railways in the Nordic Countries, 1860–1960.\BBCQ \APACjournalVolNumPagesJournal of Historical Geography6251–70. \PrintBackRefs\CurrentBib
- Escamilla-Guerrero (\APACyear2024) \APACinsertmetastarescamilla2024all{APACrefauthors}Escamilla-Guerrero, D. \APACrefYearMonthDay2024. \APACrefbtitleAll aboard! Railroad access and Mexico-US mass migration All aboard! Railroad access and Mexico-US mass migration \APACbVolEdTROxford Economic and Social History Working Papers \BNUM 212. \APACaddressInstitutionUniversity of Oxford, Department of Economics. {APACrefURL} https://EconPapers.repec.org/RePEc:oxf:esohwp:_212 \PrintBackRefs\CurrentBib
- Esteban-Oliver (\APACyear2023) \APACinsertmetastarEsteban-Oliver_2023{APACrefauthors}Esteban-Oliver, G. \APACrefYearMonthDay202304. \BBOQ\APACrefatitleOn the right track? Railways and population dynamics in Spain, 1860–1930 On the right track? railways and population dynamics in spain, 1860–1930.\BBCQ \APACjournalVolNumPagesEuropean Review of Economic History274606-633. {APACrefURL} https://doi.org/10.1093/ereh/head007 {APACrefDOI} \doi10.1093/ereh/head007 \PrintBackRefs\CurrentBib
- Fertner (\APACyear2013) \APACinsertmetastarfertner2013{APACrefauthors}Fertner, C. \APACrefYearMonthDay2013. \APACrefbtitleHistorical Railroads in Denmark. Historical Railroads in Denmark. \APAChowpublishedhttps://researchprofiles.ku.dk/en/datasets/historiske-jernbaner-i-danmark-geodatas%C3%A6t. \APACrefnoteGeodataset, accessed on 06.02.2025 \PrintBackRefs\CurrentBib
- Fogel (\APACyear1964) \APACinsertmetastarfogel1964railroads{APACrefauthors}Fogel, R\BPBIW. \APACrefYear1964. \APACrefbtitleRailroads and American Economic Growth Railroads and American Economic Growth. \APACaddressPublisherJohns Hopkins Press Baltimore. \PrintBackRefs\CurrentBib
- Fukuyama (\APACyear2011) \APACinsertmetastarfukuyama2011origins{APACrefauthors}Fukuyama, F. \APACrefYear2011. \APACrefbtitleThe Origins of Political Order: From Prehuman Times to the French Revolution The origins of political order: From prehuman times to the french revolution. \APACaddressPublisherFarrar, Straus and Giroux. {APACrefURL} https://books.google.dk/books?id=eyEONn0WUmMC \PrintBackRefs\CurrentBib
- Fukuyama (\APACyear2015) \APACinsertmetastarFukuyama2015{APACrefauthors}Fukuyama, F. \APACrefYearMonthDay2015. \BBOQ\APACrefatitleNation Building and State Building Nation building and state building.\BBCQ \BIn J\BPBIA. Hall, O. Korsgaard\BCBL \BBA O\BPBIK. Pedersen (\BEDS), \APACrefbtitleBuilding the Nation: N.F.S. Grundtvig and Danish National Identity Building the nation: N.f.s. grundtvig and danish national identity (\BPGS 29–50). \APACaddressPublisherMcGill-Queen’s University Press. {APACrefURL} http://www.jstor.org/stable/j.ctt13x0p07.5 \PrintBackRefs\CurrentBib
- Galofré-Vilà (\APACyear2024) \APACinsertmetastargalofre2024railroads{APACrefauthors}Galofré-Vilà, G. \APACrefYearMonthDay2024. \BBOQ\APACrefatitleRailroads, fertility and the demographic transition in England and Wales Railroads, fertility and the demographic transition in England and Wales.\BBCQ \APACjournalVolNumPagesCliometrica1–19. \PrintBackRefs\CurrentBib
- García-Jimeno \BOthers. (\APACyear2022) \APACinsertmetastarGarcía-Jimeno_et_al_22{APACrefauthors}García-Jimeno, C., Iglesias, A.\BCBL \BBA Yildirim, P. \APACrefYearMonthDay2022January. \BBOQ\APACrefatitleInformation Networks and Collective Action: Evidence from the Women’s Temperance Crusade Information networks and collective action: Evidence from the women’s temperance crusade.\BBCQ \APACjournalVolNumPagesAmerican Economic Review112141–80. {APACrefURL} https://www.aeaweb.org/articles?id=10.1257/aer.20180124 {APACrefDOI} \doi10.1257/aer.20180124 \PrintBackRefs\CurrentBib
- Gibbons \BOthers. (\APACyear2024) \APACinsertmetastargibbons2024{APACrefauthors}Gibbons, S., Heblich, S.\BCBL \BBA Pinchbeck, E\BPBIW. \APACrefYearMonthDay2024. \BBOQ\APACrefatitleThe spatial impacts of a massive rail disinvestment program: The Beeching Axe The spatial impacts of a massive rail disinvestment program: The beeching axe.\BBCQ \APACjournalVolNumPagesJournal of Urban Economics143103691. {APACrefURL} https://www.sciencedirect.com/science/article/pii/S0094119024000615 {APACrefDOI} \doihttps://doi.org/10.1016/j.jue.2024.103691 \PrintBackRefs\CurrentBib
- Goodman-Bacon (\APACyear2021) \APACinsertmetastarGoodmanBacon2021{APACrefauthors}Goodman-Bacon, A. \APACrefYearMonthDay2021. \BBOQ\APACrefatitleDifference-in-differences with variation in treatment timing Difference-in-differences with variation in treatment timing.\BBCQ \APACjournalVolNumPagesJournal of Econometrics2252254-277. {APACrefURL} https://www.sciencedirect.com/science/article/pii/S0304407621001445 \APACrefnoteThemed Issue: Treatment Effect 1 {APACrefDOI} \doihttps://doi.org/10.1016/j.jeconom.2021.03.014 \PrintBackRefs\CurrentBib
- Groth \BBA Fertner (\APACyear2013) \APACinsertmetastargrothfertner2013{APACrefauthors}Groth, N\BPBIB.\BCBT \BBA Fertner, C. \APACrefYear2013. \APACrefbtitleStationsbyer i dag Stationsbyer i dag. \APACaddressPublisherRealdania. \PrintBackRefs\CurrentBib
- Hansen (\APACyear1972) \APACinsertmetastarhansen1972{APACrefauthors}Hansen, S\BPBIA. \APACrefYear1972. \APACrefbtitleØkonomisk Vækst i Danmark Økonomisk vækst i danmark (\BVOL I: 1720-1914). \APACaddressPublisherKøbenhavnUniversitetsforlaget i København. \PrintBackRefs\CurrentBib
- Harris (\APACyear1954) \APACinsertmetastarHarris1954{APACrefauthors}Harris, C\BPBID. \APACrefYearMonthDay1954. \BBOQ\APACrefatitleThe Market as a Factor in the Localization of Industry in the United States The Market as a Factor in the Localization of Industry in the United States.\BBCQ \APACjournalVolNumPagesAnnals of the Association of American Geographers444315–348. \PrintBackRefs\CurrentBib
- Henriques \BBA Sharp (\APACyear2016) \APACinsertmetastarhenriques2016danish{APACrefauthors}Henriques, S\BPBIT.\BCBT \BBA Sharp, P. \APACrefYearMonthDay2016. \BBOQ\APACrefatitleThe Danish Agricultural Revolution in an Energy Perspective: A Case of Development with Few Domestic Energy Sources The danish agricultural revolution in an energy perspective: A case of development with few domestic energy sources.\BBCQ \APACjournalVolNumPagesThe Economic History Review693844–869. {APACrefDOI} \doi10.1111/ehr.12294 \PrintBackRefs\CurrentBib
- Herzog (\APACyear2016) \APACinsertmetastarherzog2016potential{APACrefauthors}Herzog, I. \APACrefYearMonthDay2016. \BBOQ\APACrefatitleThe potential and limits of optimal path analysis The potential and limits of optimal path analysis.\BBCQ \BIn \APACrefbtitleComputational approaches to archaeological spaces Computational approaches to archaeological spaces (\BPGS 179–211). \APACaddressPublisherRoutledge. \PrintBackRefs\CurrentBib
- Hornbeck \BBA Rotemberg (\APACyear2024) \APACinsertmetastarhornbeck24manu{APACrefauthors}Hornbeck, R.\BCBT \BBA Rotemberg, M. \APACrefYearMonthDay2024. \BBOQ\APACrefatitleGrowth Off the Rails: Aggregate Productivity Growth in Distorted Economies Growth off the rails: Aggregate productivity growth in distorted economies.\BBCQ \APACjournalVolNumPagesJournal of Political Economy132113547-3602. {APACrefURL} https://doi.org/10.1086/730548 {APACrefDOI} \doi10.1086/730548 \PrintBackRefs\CurrentBib
- Hornung (\APACyear2015) \APACinsertmetastarhornung_2015{APACrefauthors}Hornung, E. \APACrefYearMonthDay201508. \BBOQ\APACrefatitleRailroads and Growth in Prussia Railroads and Growth in Prussia.\BBCQ \APACjournalVolNumPagesJournal of the European Economic Association134699-736. {APACrefURL} https://doi.org/10.1111/jeea.12123 {APACrefDOI} \doi10.1111/jeea.12123 \PrintBackRefs\CurrentBib
- Koopmans \BOthers. (\APACyear2012) \APACinsertmetastarkoopmans2012{APACrefauthors}Koopmans, C., Rietveld, P.\BCBL \BBA Huijg, A. \APACrefYearMonthDay2012. \BBOQ\APACrefatitleAn accessibility approach to railways and municipal population growth, 1840–1930 An accessibility approach to railways and municipal population growth, 1840–1930.\BBCQ \APACjournalVolNumPagesJournal of Transport Geography2598-104. {APACrefURL} https://www.sciencedirect.com/science/article/pii/S0966692312000361 \APACrefnoteSpecial Section on Accessibility and Socio-Economic Activities: Methodological and Empirical Aspects {APACrefDOI} \doihttps://doi.org/10.1016/j.jtrangeo.2012.01.031 \PrintBackRefs\CurrentBib
- Korn \BBA Lacroix (\APACyear2024) \APACinsertmetastarKorn_Lacroix_24{APACrefauthors}Korn, T.\BCBT \BBA Lacroix, J. \APACrefYearMonthDay2024. \APACrefbtitleThe Bankruptcy Express: Market Integration, Organizational Changes, and Financial distress in 19th century Britain The Bankruptcy Express: Market Integration, Organizational Changes, and Financial distress in 19th century Britain \APACbVolEdTRHannover Economic Papers (HEP). \APACaddressInstitutionLeibniz Universität Hannover, Wirtschaftswissenschaftliche Fakultät. {APACrefURL} https://EconPapers.repec.org/RePEc:han:dpaper:dp-731 \PrintBackRefs\CurrentBib
- Lampe \BBA Sharp (\APACyear2015) \APACinsertmetastarlampe2015danes{APACrefauthors}Lampe, M.\BCBT \BBA Sharp, P. \APACrefYearMonthDay2015. \BBOQ\APACrefatitleHow the Danes Discovered Britain: The International Integration of the Danish Dairy Industry Before 1880 How the danes discovered britain: The international integration of the danish dairy industry before 1880.\BBCQ \APACjournalVolNumPagesEuropean Review of Economic History194432–453. {APACrefDOI} \doi10.1093/ereh/hev013 \PrintBackRefs\CurrentBib
- Lampe \BBA Sharp (\APACyear2018) \APACinsertmetastarmilkandbutter{APACrefauthors}Lampe, M.\BCBT \BBA Sharp, P. \APACrefYear2018. \APACrefbtitleA Land of Milk and Butter A Land of Milk and Butter. \APACaddressPublisherUniversity of Chicago Press. {APACrefURL} https://ideas.repec.org/b/ucp/bkecon/9780226549507.html \PrintBackRefs\CurrentBib
- Lewis (\APACyear2023) \APACinsertmetastarleastcostlib{APACrefauthors}Lewis, J. \APACrefYearMonthDay2023. \BBOQ\APACrefatitleleastcostpath: Modelling Pathways and Movement Potential Within a Landscape leastcostpath: Modelling pathways and movement potential within a landscape\BBCQ [\bibcomputersoftwaremanual]. {APACrefURL} https://CRAN.R-project.org/package=leastcostpath \APACrefnoteR package version 2.0.12 \PrintBackRefs\CurrentBib
- Martinez \BOthers. (\APACyear2024) \APACinsertmetastarMartinezNuvolariVasta2024{APACrefauthors}Martinez, M., Nuvolari, A.\BCBL \BBA Vasta, M. \APACrefYearMonthDay2024. \BBOQ\APACrefatitleRails of Progress? Exploring the Nexus between Railroad Access and Innovation in Italy (19th-20th Centuries) Rails of Progress? Exploring the Nexus between Railroad Access and Innovation in Italy (19th-20th Centuries).\BBCQ \APACjournalVolNumPagesSSRN Working Paper. \APACrefnoteAvailable at SSRN: https://ssrn.com/abstract=5066156 or http://dx.doi.org/10.2139/ssrn.5066156 \PrintBackRefs\CurrentBib
- Mathiesen \BOthers. (\APACyear2022) \APACinsertmetastarmathiesen2022linklives{APACrefauthors}Mathiesen, N., Robinson, O., Thomsen, A.\BCBL \BBA Revuelta-Eugercios, B. \APACrefYearMonthDay2022. \APACrefbtitleLink-Lives Data v.1.2.1. Link-Lives Data v.1.2.1. \APACaddressPublisherDenmarkDanish National Archives/University of Copenhagen. {APACrefURL} https://www.rigsarkivet.dk/udforsk/link-lives-data/ \PrintBackRefs\CurrentBib
- Melander (\APACyear2020) \APACinsertmetastarMelander_2020{APACrefauthors}Melander, E. \APACrefYearMonthDay2020. \APACrefbtitleTransportation Technology, Individual Mobility and Social Mobilisation Transportation Technology, Individual Mobility and Social Mobilisation \APACbVolEdTRCAGE Online Working Paper Series. \APACaddressInstitutionCompetitive Advantage in the Global Economy (CAGE). {APACrefURL} https://EconPapers.repec.org/RePEc:cge:wacage:471 \PrintBackRefs\CurrentBib
- Mojica \BBA Martí-Henneberg (\APACyear2011) \APACinsertmetastarMojica_Henneberg_2011{APACrefauthors}Mojica, L.\BCBT \BBA Martí-Henneberg, J. \APACrefYearMonthDay201106. \BBOQ\APACrefatitleRailways and Population Distribution: France, Spain, and Portugal, 1870–2000 Railways and Population Distribution: France, Spain, and Portugal, 1870–2000.\BBCQ \APACjournalVolNumPagesThe Journal of Interdisciplinary History42115-28. {APACrefURL} https://doi.org/10.1162/JINH\_a\_00203 {APACrefDOI} \doi10.1162/JINH_a_00203 \PrintBackRefs\CurrentBib
- Olesen (\APACyear1990) \APACinsertmetastarnorgaardolesen1990{APACrefauthors}Olesen, M\BPBIN. \APACrefYear1990. \APACrefbtitleDanske Jernbaner Gennem Tiderne Danske jernbaner gennem tiderne (\PrintOrdinal2. udg. \BEd). \APACaddressPublisherLamberths Forlag. \PrintBackRefs\CurrentBib
- Sant’Anna \BBA Zhao (\APACyear2020) \APACinsertmetastarSantanna2020{APACrefauthors}Sant’Anna, P\BPBIH.\BCBT \BBA Zhao, J. \APACrefYearMonthDay2020. \BBOQ\APACrefatitleDoubly robust difference-in-differences estimators Doubly robust difference-in-differences estimators.\BBCQ \APACjournalVolNumPagesJournal of Econometrics2191101-122. {APACrefURL} https://www.sciencedirect.com/science/article/pii/S0304407620301901 {APACrefDOI} \doihttps://doi.org/10.1016/j.jeconom.2020.06.003 \PrintBackRefs\CurrentBib
- Sharp \BOthers. (\APACyear2024) \APACinsertmetastarMDS2024{APACrefauthors}Sharp, P., Henriques, S., McLaughlin, E., Tsoukli, X.\BCBL \BBA Vedel, C. \APACrefYearMonthDay2024. \BBOQ\APACrefatitleA Microlevel Analysis of Danish Dairy Cooperatives: Opportunities for Large Data in Business History – ERRATUM A microlevel analysis of danish dairy cooperatives: Opportunities for large data in business history – erratum.\BBCQ \APACjournalVolNumPagesEnterprise &; Society253698–698. {APACrefDOI} \doi10.1017/eso.2023.13 \PrintBackRefs\CurrentBib
- Thestrup (\APACyear1997) \APACinsertmetastarthestrup1997dampen{APACrefauthors}Thestrup, P. \APACrefYear1997. \APACrefbtitleDampen Binder Danmark Sammen Dampen binder danmark sammen (\BVOL I Til 1914). \APACaddressPublisherJernbanemuseet. \PrintBackRefs\CurrentBib
- Trap \BOthers. (\APACyear1906) \APACinsertmetastartrap1906kongeriget{APACrefauthors}Trap, J\BPBIP., Falbe-Hansen, V., Westergaard, H.\BCBL \BBA Weitemeyer, H. \APACrefYear1906. \APACrefbtitleKongeriget Danmark Kongeriget danmark (\PrintOrdinal3 \BEd). \APACaddressPublisherCopenhagenUniversitetsboghandler G. E. C. Gad. \PrintBackRefs\CurrentBib
- Trap \BBA Knudsen (\APACyear1928) \APACinsertmetastartrap1928kongeriget{APACrefauthors}Trap, J\BPBIP.\BCBT \BBA Knudsen, G. \APACrefYear1928. \APACrefbtitleKongeriget Danmark Kongeriget danmark (\PrintOrdinal4 \BEd, \BVOL 4). \APACaddressPublisherCopenhagenUniversitetsboghandler G. E. C. Gad. \PrintBackRefs\CurrentBib
- Vedel (\APACyear2024) \APACinsertmetastarvedel2024perfectstorm{APACrefauthors}Vedel, C. \APACrefYearMonthDay2024. \APACrefbtitleA Perfect Storm: First-Nature Geography and Economic Development. A perfect storm: First-nature geography and economic development. {APACrefURL} https://arxiv.org/abs/2408.00885 \PrintBackRefs\CurrentBib
Appendix
A Density plots by year
The density plots shown in Figure A1 offer a visual comparison of key variables from the census data, grouped by the period during which each parish was connected to the railway. These groups consist of parishes connected to the railway before 1860, between 1861 and 1880, between 1881 and 1901, and those that were never connected. The distinction between the periods of connection is crucial as it helps us assess whether there were systematic differences between parishes that received railway connections at different points in time. The very first lines, connecting Copenhagen differs slightly, but not enough that we should be concerned that there is a lack of common support (non-overlapping distributions).
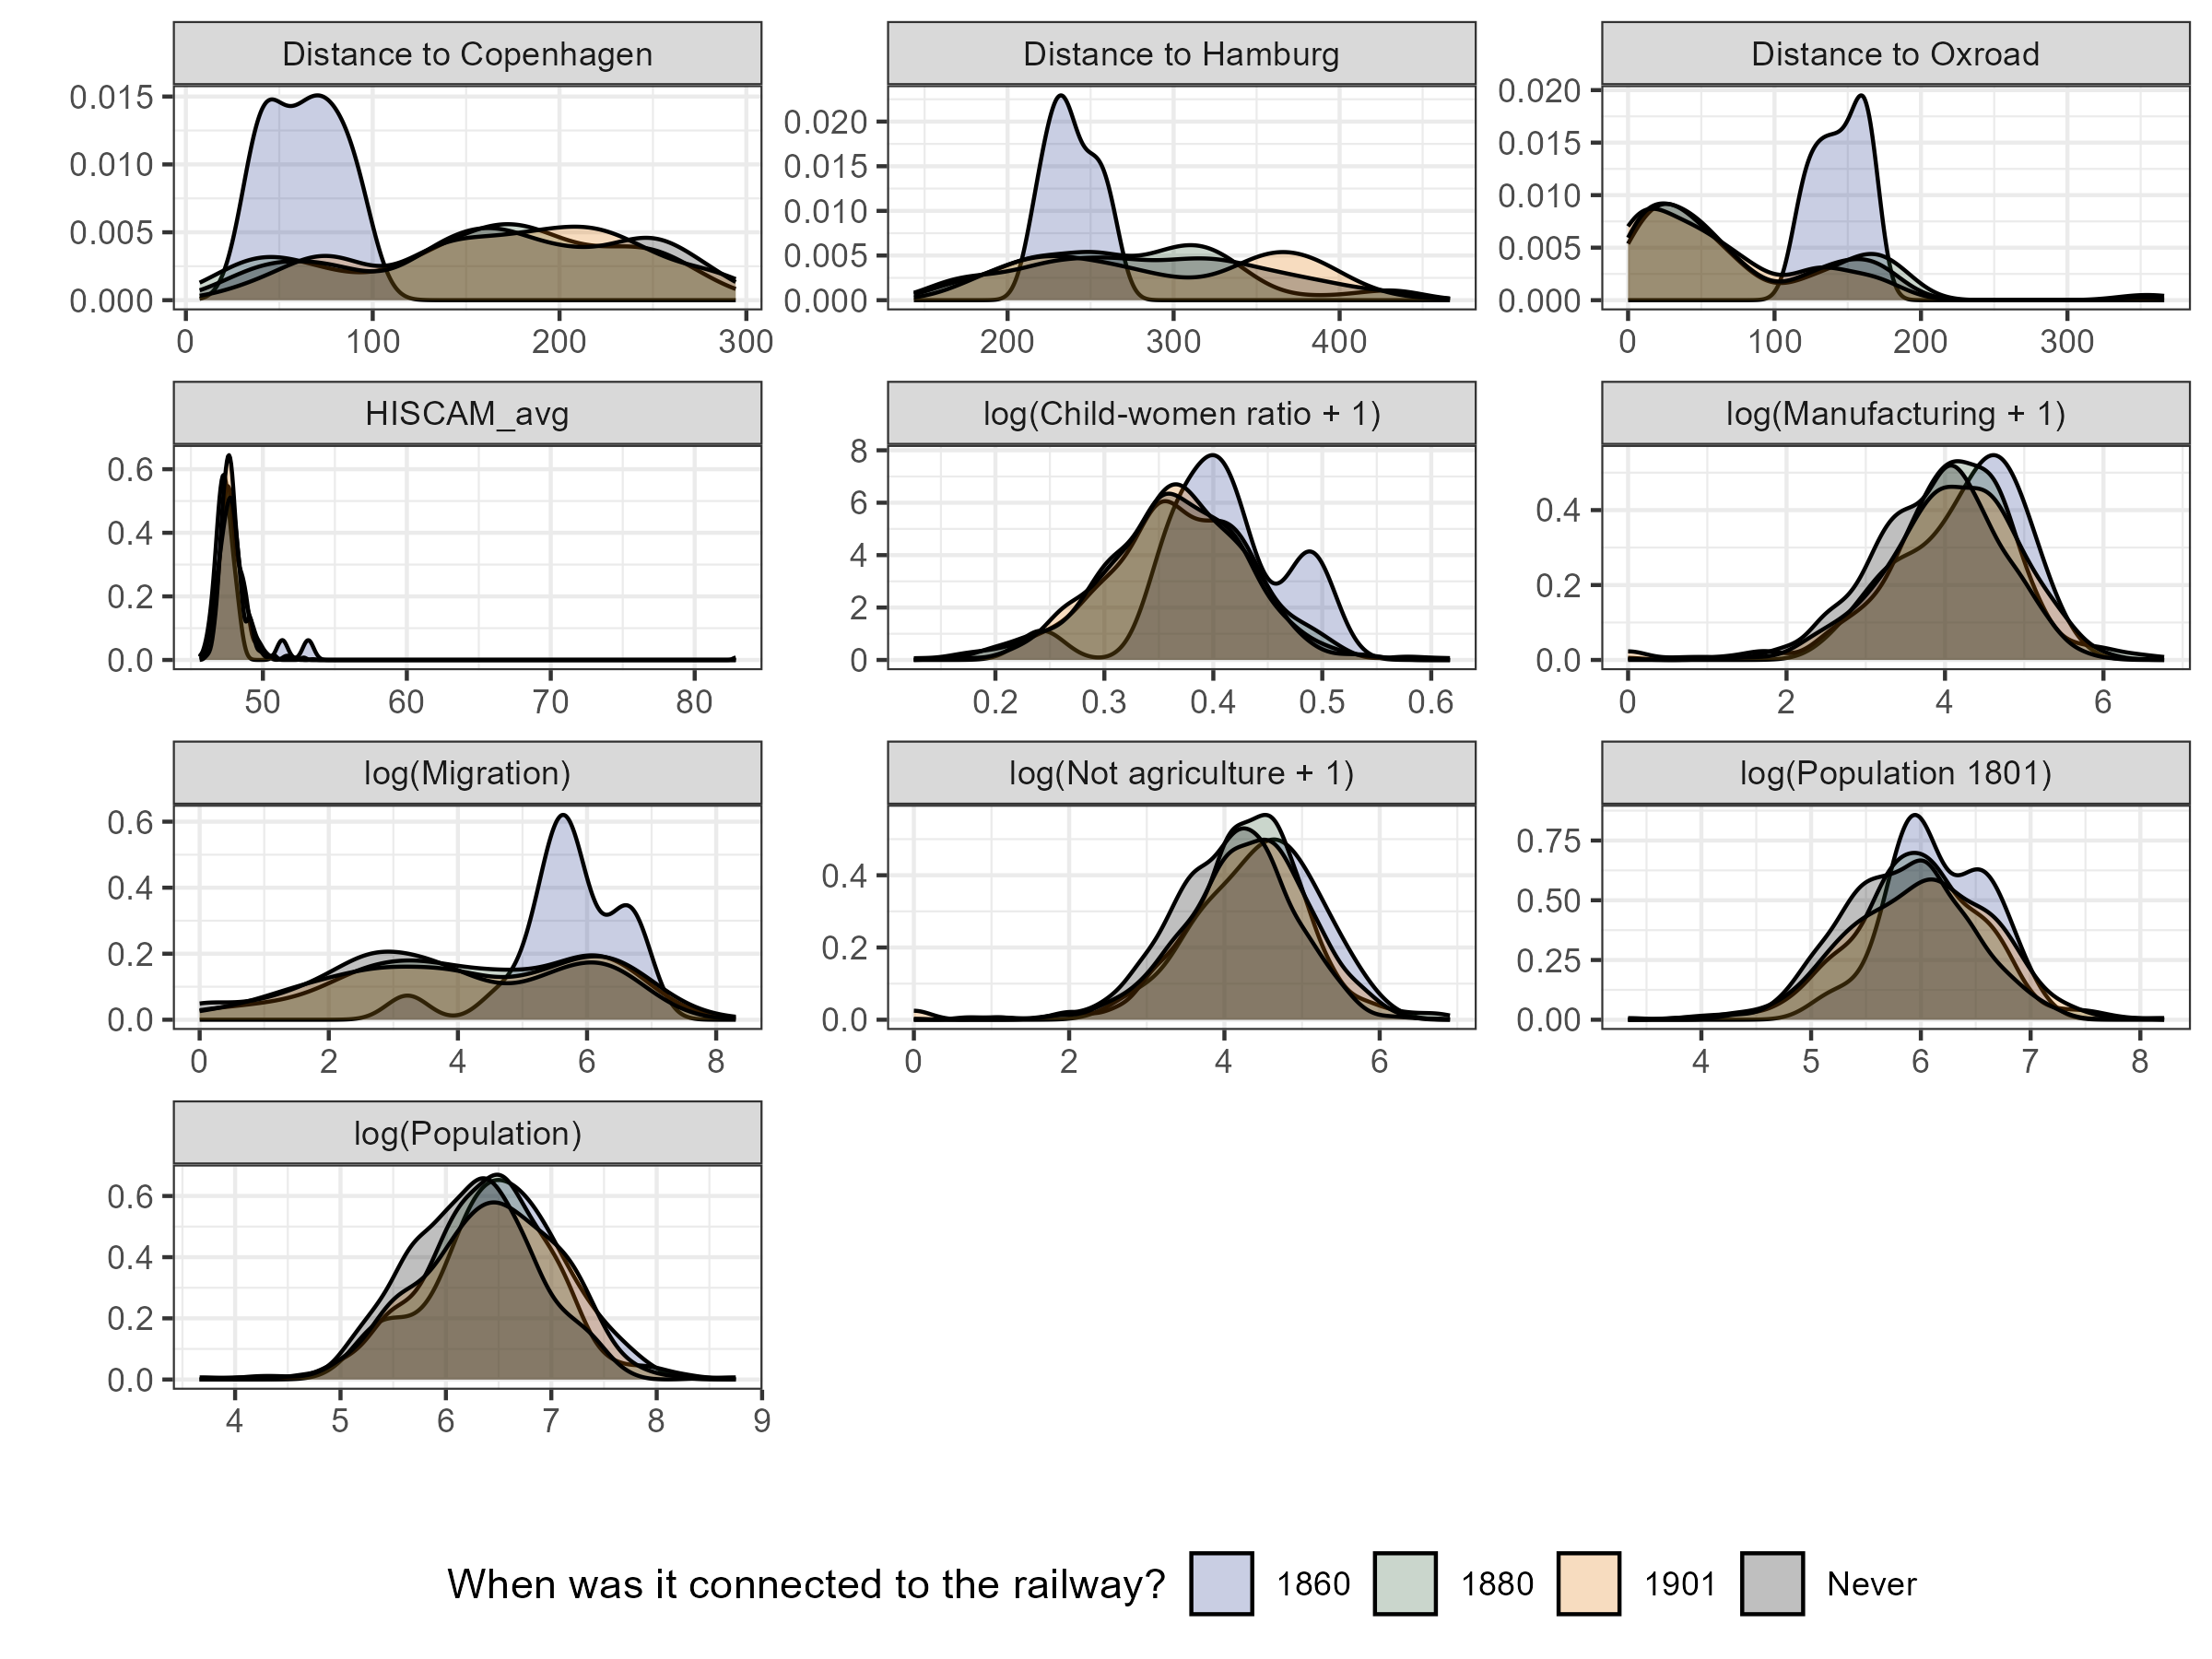
B Details about the computation of the instrument
Denmark is mostly flat, with the highest natural point, Møllehøj, only 170 meters above sea level. Nevertheless, according to Aagesen (\APACyear1949), the terrain played a crucial role in determining the historic Danish railway routes. Specifically, the landscape, especially in East and Central Jutland, is characterized by hilly moraine areas and deep tunnel valleys, and the limited power of early engines restricted the ability to overcome steep inclines. Consequently, paths of least resistance - such as valleys and terraces with minimal gradients - were preferred wherever possible. Building on this insight, we construct least-cost paths between key nodes for our instrumental variable approach, capturing the topographically determined routes that are most feasible given these historical constraints.
We define nodes as the top 25% of market towns in 1801 based on population size. This criterion ensures that the most economically significant urban centers (exogenously determined before the invention of railways) are captured. To achieve comprehensive geographic coverage, we add Esbjerg, Ringkøbing, Holstebro, and Varde (to represent the west coast) and Korsør and Middelfart (to ensure connectivity across Funen and Sealand). All of this aligns well with what we describe in Section 4 on the Historical Background.
The least-cost paths (LCP) are computed using Lewis (\APACyear2023), applying a slope-dependent cost function for wheeled transport suggested by Herzog (\APACyear2016):
| (3) |
where denotes the percentage slope, and represents a critical percentage slope parameter. According to Herzog (\APACyear2016), this critical slope parameter typically ranges between 8% and 16% for wheeled transport, reflecting the point at which switchbacks become more efficient than direct routes.
Given Denmark’s predominantly flat topography we tested all integer critical slope values from 1% to 16% to assess the ability of the resulting LCPs to predict the historical railway network. To determine which critical slope value best predicted the actual lines, we calculated the root mean square error (RMSE) between the realized railway lines and those predicted by the respective LCPs. The critical slope value of 1% yields the lowest RMSE, indicating the closest alignment between the predicted and actual railway routes. This suggests that even small inclines significantly influenced route planning.
For each pair of nodes, we compute the least-cost path in the specific year they were historically connected, generating a panel of parish connections based purely on topographical considerations. This method results in a network resembling the main railway lines established around Denmark by 1876. However, the approach does not capture smaller branch lines constructed after 1876. And as our paper shows, these were in some regards more important, which is the clear drawback of this instrument, that made us relegate it to this appendix.
Figure A2 replicates Figure 5 but adds the LCP lines. Panel A depicts Denmark’s first railway line, opened in 1847 between Copenhagen and Roskilde, and the corresponding LCP, which closely follows the actual route. The nodes used in the construction of the LCPs are also visible. Panel B, showing the railway network in 1860, highlights the extension from Roskilde to Korsør, which was intended to facilitate transport across the Great Belt. However, a direct railway ferry connection was not established until 1883. Panel C, capturing the state of the railway network in 1880, marks a period of rapid expansion. Between 1860 and 1880, the railway network grew significantly, linking major towns across Denmark. This period also coincides with the last variation in the LCP instrument in 1876. By this stage, rail access was beginning to influence both economic activity and social change, particularly through improved market integration and the spread of civic institutions. Panel D, presenting the network in 1901, shows a near-complete railway system. By this time, many of the lines predicted by our LCP instrument had materialized, including key connections such as Copenhagen to Helsingør and Randers to Aalborg.
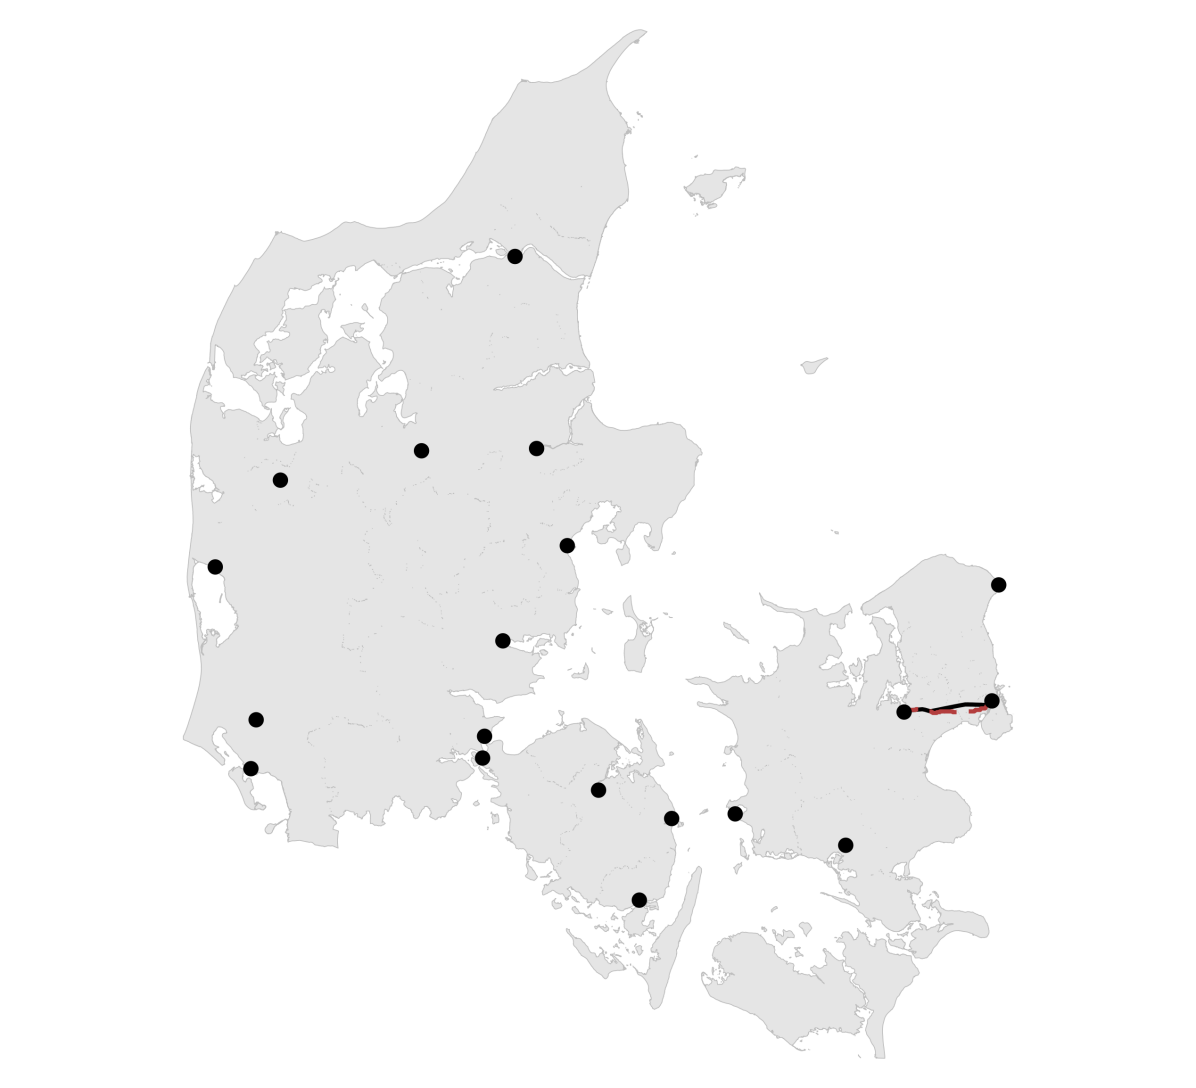
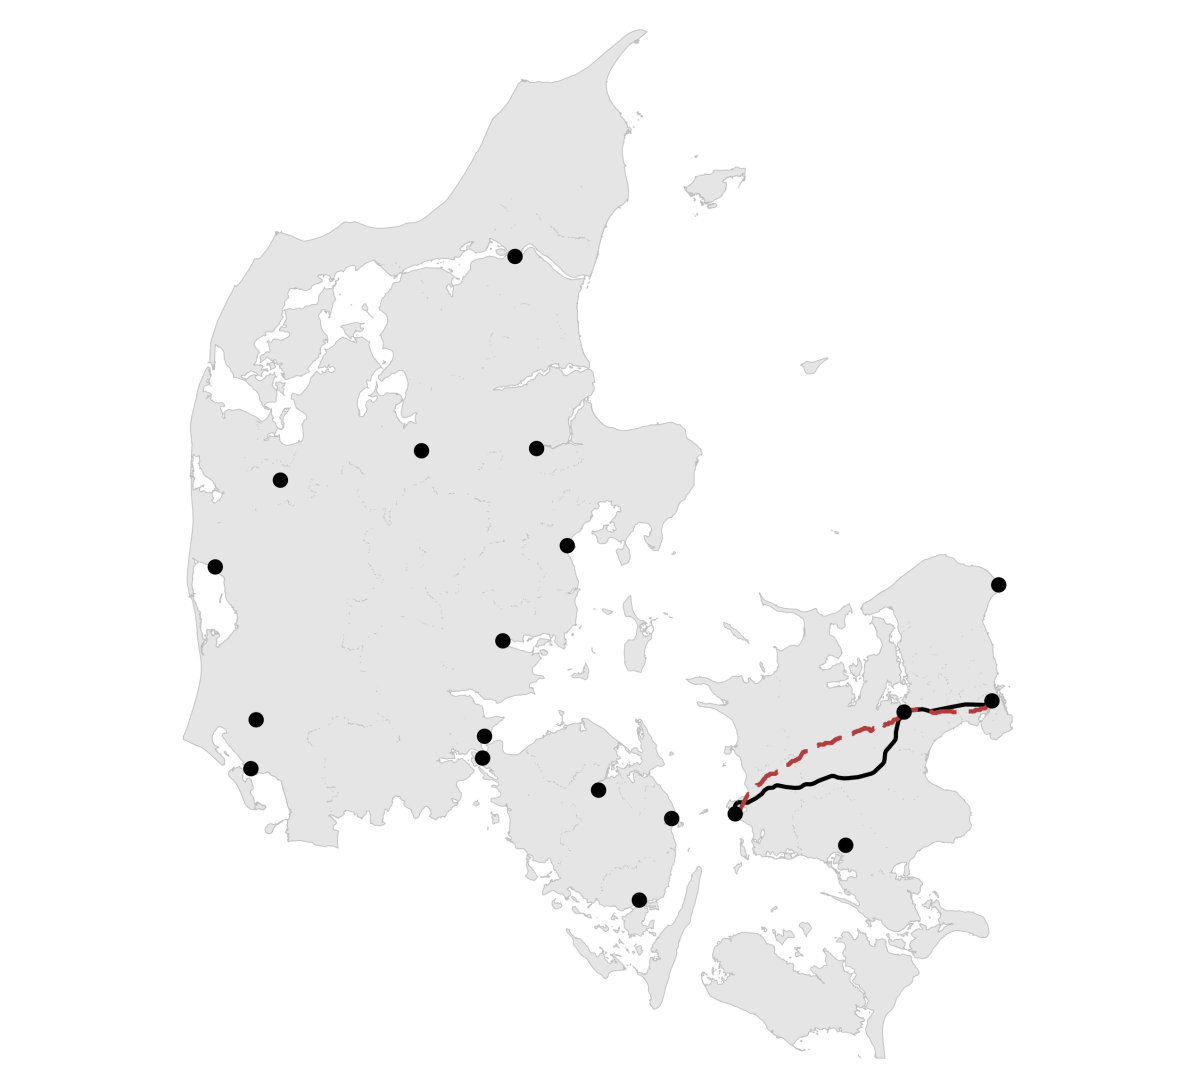
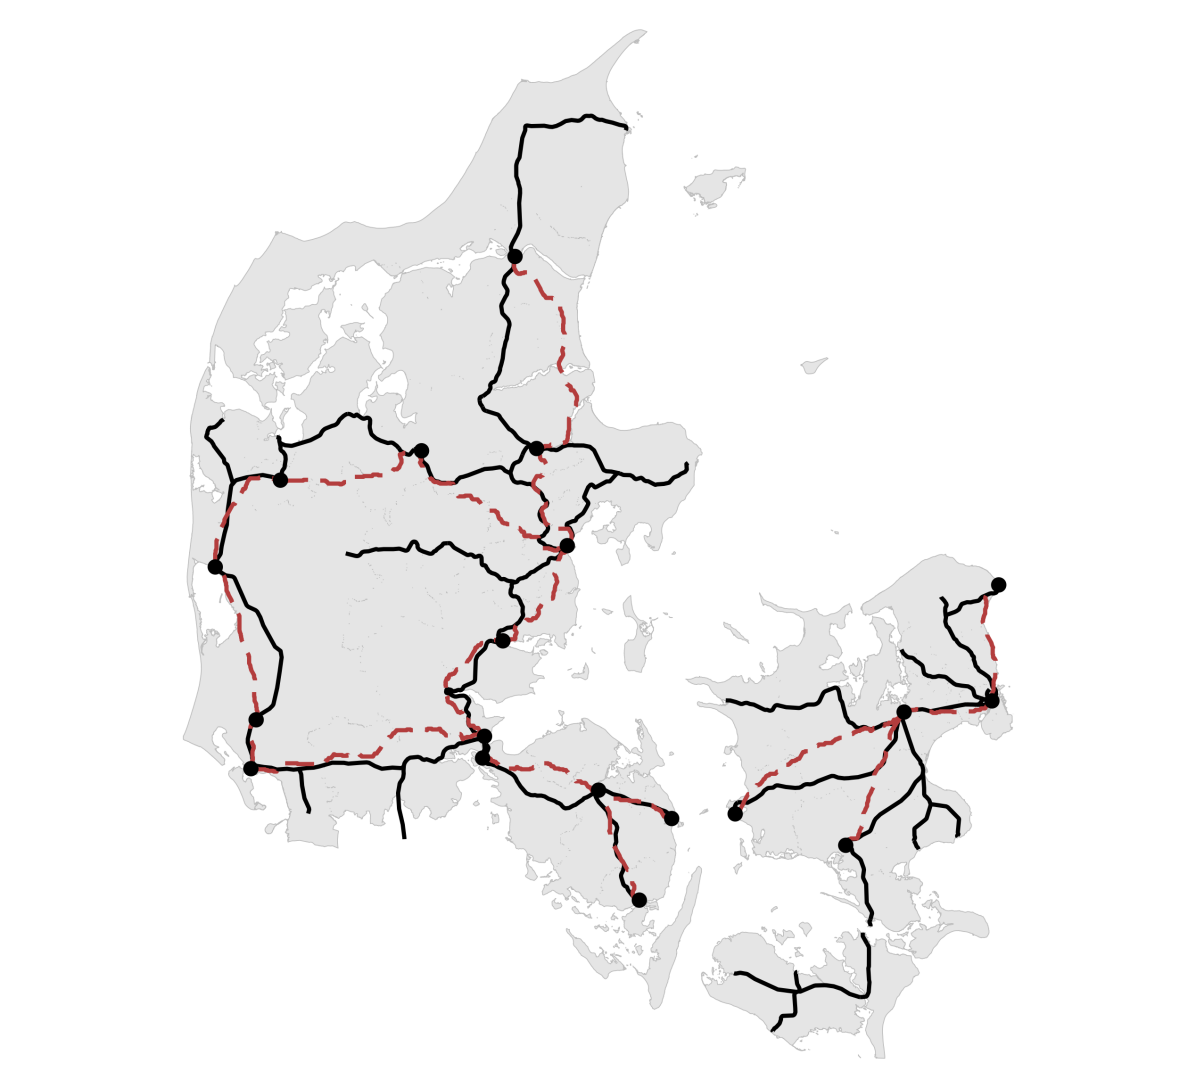
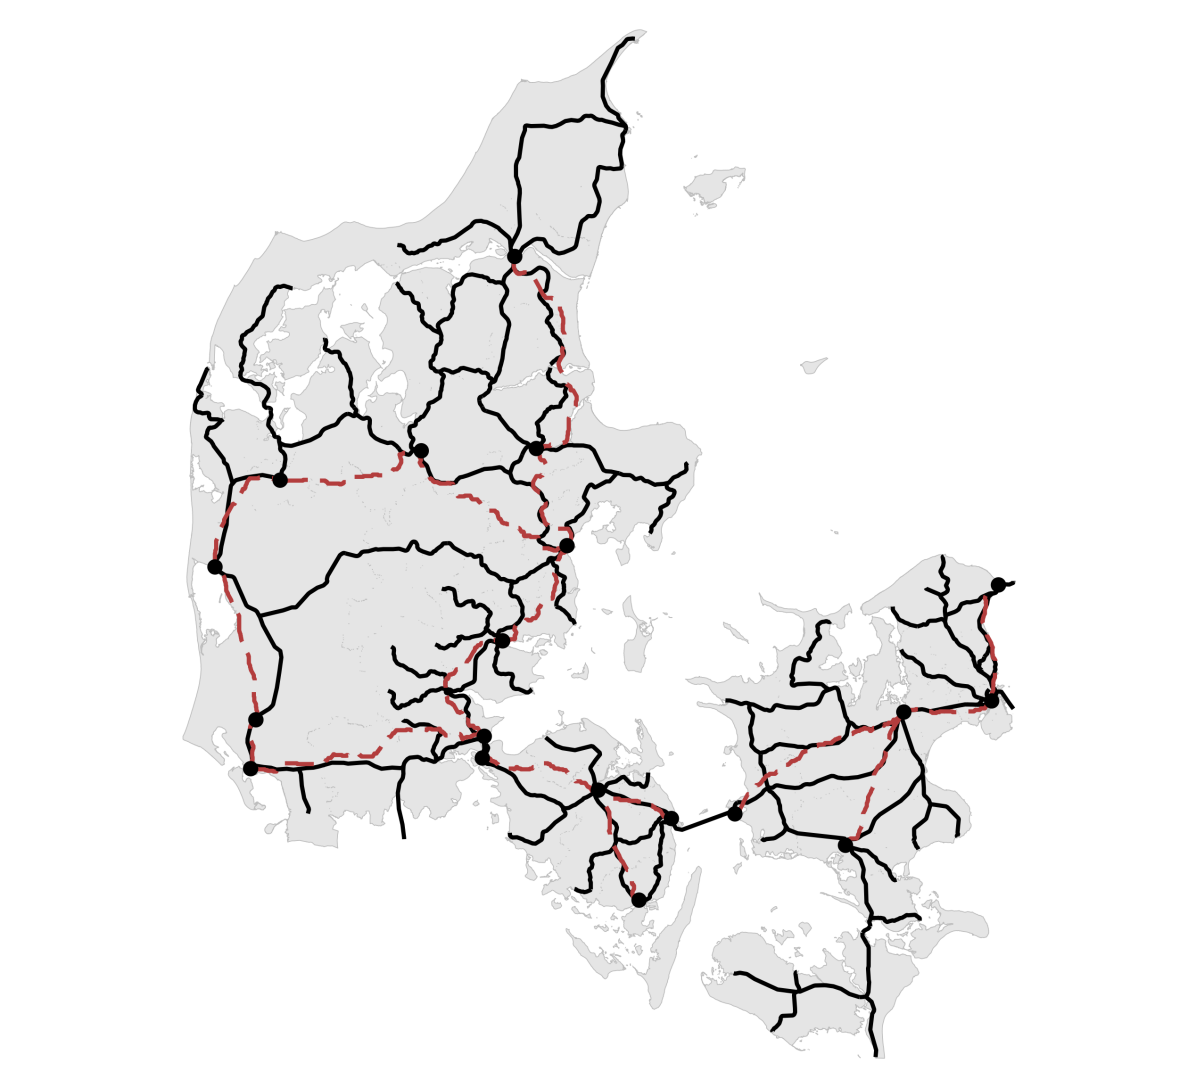
C Regressions with controls
Tables A1 and A2 present estimates of the effect of railway access on local development and Grundtvigian institutions, now including additional controls.
Table A1 reports the results for economic and demographic outcomes. In Panel A, which shows the two-way fixed effects (TWFE) estimates, railway access is associated with a statistically significant 6.6 pct increase in population (Column 1). The effect on the child-women ratio (Column 2) remains effectively zero, suggesting that fertility patterns, on average, were unaffected by railway expansion. Column 3 shows a 12.4 pct increase in manufacturing employment, and Column 4 reports a 10.4 pct increase in non-agricultural occupations, reinforcing the idea that railway access facilitated structural change away from agriculture. However, there is no significant impact on average occupational status as measured by HISCAM scores (Column 5). Lastly, Column 6 indicates that railway access led to an increase in internal migration of around 10.1 pct, suggesting that improved connectivity enabled labor mobility.
Panel B presents estimates using the Callaway and Sant’Anna approach, which accounts for heterogeneous treatment effects across cohorts and staggered adoption. These estimates indicate a 5.1 pct increase in population but suggest a smaller effect on employment shifts compared to the TWFE estimator. Manufacturing and non-agricultural employment effects are positive but imprecisely estimated, while the migration effect remains sizable, though not statistically significant. Overall, both specifications reinforce the conclusion that railway access facilitated urbanization and occupational shifts, primarily through migration and employment transitions outside agriculture.
Table A2 examines the relationship between railway access and the expansion of Grundtvigian institutions (assembly houses and folk high schools). The TWFE estimates in Panel A suggest that railway access increased the likelihood of a parish having an assembly house by 4.0 percentage points (Column 1) and a folk high school by 1.1 percentage points (Column 2), with the latter result being marginally significant. However, when considering density measures (Columns 3 and 4), railway access does not significantly influence the local concentration of assembly houses but does increase the density of folk high schools.
In contrast, the Callaway and Sant’Anna estimates (Panel B) find no statistically significant effects across any of the measures, suggesting that the timing of railway expansion relative to the diffusion of Grundtvigian institutions may be more complex than initially assumed. While the TWFE results indicate some positive correlations, these effects appear weaker when accounting for potential selection into treatment using alternative estimators.
Taken together, these results suggest that railway access played a clear role in fostering local economic transformation, particularly through migration and employment shifts, while its impact on the spread of Grundtvigian institutions appears more modest and less robust across specifications.
We note here, that the pre-treatment distributions shown in Figure 3, does not indicate a need for such controls. The primary issue with the estimates presented in Tables A1 and A2 is the lack of decomposition across time periods or treatment cohorts. Without decomposing the effects, these results only capture the average impact of railway access over the entire period, potentially masking important variation in the timing and dynamics of the effects, which reassuringly reappear once we decompose the effects.
| Outcome: | log(Pop.) | log(Child women ratio) | log(Manufacturing + 1) | log(Not Agriculture + 1) | HISCAM avg | log(Migration) |
|---|---|---|---|---|---|---|
| (1) | (2) | (3) | (4) | (5) | (6) | |
| A. TWFE estimates | ||||||
| Connected_railway | 0.0664∗∗∗ | 0.0011 | 0.1237∗∗∗ | 0.1036∗∗∗ | 0.0862 | 0.1013∗∗ |
| (0.0094) | (0.0032) | (0.0203) | (0.0193) | (0.0645) | (0.0399) | |
| Observations | 6,356 | 6,336 | 6,356 | 6,356 | 6,355 | 6,356 |
| Mean of outcome | 6.4738 | 0.39484 | 4.1637 | 4.4711 | 48.631 | 4.4012 |
| B. Callaway and Sant’Anna estimates | ||||||
| Connected railway | 0.05082∗∗∗ | 0.001728 | 0.03566 | 0.02279 | -0.005995 | 0.1097 |
| (0.01507) | (0.005953) | (0.03963) | (0.03352) | (0.1454) | (0.07472) | |
| Observations | 6324 | 6244 | 6324 | 6324 | 6320 | 6324 |
| Mean of Outcome | 6.472 | 0.3949 | 4.161 | 4.468 | 48.62 | 4.394 |
| Outcome: | Assembly house | Folk high school | Density Assembly | Density Folk High |
|---|---|---|---|---|
| houses (MA) | Schools (MA) | |||
| (1) | (2) | (3) | (4) | |
| A. TWFE estimates | ||||
| Connected railway | 0.0405∗∗∗ | 0.0106∗ | -0.0237 | 0.0144∗∗ |
| (0.0134) | (0.0058) | (0.0697) | (0.0073) | |
| Observations | 119,175 | 119,175 | 119,175 | 119,175 |
| Mean of outcome | 0.17150 | 0.02945 | 4.4639 | 0.70244 |
| B. Callaway and Sant’Anna estimates | ||||
| Connected railway | -0.002901 | 0.0002402 | 0.03798 | 0.00112 |
| (0.02078) | (0.01124) | (0.03091) | (0.0118) | |
| Observations | 119200 | 119200 | 119200 | 119200 |
| Mean of Outcome | 0.1715 | 0.02945 | 4.464 | 0.7024 |
D Instrumented regressions
Tables A3 and A4 present instrumental variable (IV) estimates of the effect of railway access on local development and Grundtvigian institutions. These estimates leverage a least-cost-path (LCP) instrument to isolate exogenous variation in railway expansion, ensuring that the estimated effects are not driven by endogenous placement decisions. We exclude the nodes of the LCP, so all treated parishes we observe here, are connected because they - by chance - are on the LCP between other important places. Additionally, we exclude parishes whose centroids are located within 10 km of a node to account for potential spillover effects.
It is important to note, that the Callaway \BBA Sant’Anna (\APACyear2021) estimates reported in Panel B are based on reduced-form regressions, where the outcome variables are directly regressed on the LCP instrument rather than railway access itself. This approach is necessary because, to the best of our knowledge, there is currently no established method for incorporating an instrument into a staggered adoption difference-in-differences framework. As a result, the reduced-form estimates should be interpreted as the effect of predicted railway access (as determined by least-cost-path placement) rather than the effect of actual railway construction.121212To avoid comparing to places which are connected by actual railways later, we exclude these from this particular regression.
A key consideration when interpreting these results is that the instrument primarily captures the effect of early railway expansion, as the least-cost-path approach is most relevant for identifying the routes of the main railway lines, which were established first. This is important because, as demonstrated elsewhere in the paper, the early railways often had smaller or even negative effects compared to later expansions.
Table A3 presents the instrumented effects of railway access on economic and demographic outcomes. The IV estimates in Panel A suggest that railway access led to a 20.6 pct increase in population (Column 1), a much larger estimate than in the baseline regressions. However, effects on manufacturing and non-agricultural employment (Columns 3 and 4), while positive, are not statistically significant, reinforcing the earlier finding that early railway lines were less effective in driving structural change compared to later expansions.
Similarly, while railway access significantly increased occupational outcomes as measured by HISCAM scores (Column 5, 1.58 points, significant at 5 pct), the effect on migration (Column 6) is negative and imprecise, which is consistent with earlier findings that early railway lines did not immediately drive migration into railway-connected areas. Instead, it was later expansions, coinciding with broader industrialization, that had stronger migration effects.
Panel B presents reduced-form estimates using the Callaway \BBA Sant’Anna (\APACyear2021) approach, which reinforces these conclusions. The population effect (3.9 pct) is still positive and significant, but the effects on employment shifts and migration remain smaller and less robust, further supporting the idea that the main railway lines, established first, had weaker transformative effects than later expansions.
Table A5 show the first stage. The F statistic, at 40.854 is above conventional level to limit concerns of weak instruments. A parish on the least cost path is 14.46 pct more likely to be connected to the railway.
Table A4 examines the impact of railway access on the spread of Grundtvigian institutions. The IV estimates in Panel A suggest that railway access increased the likelihood of having an assembly house by 25.5 percentage points (Column 1), though this estimate is imprecisely measured. The effect on folk high schools is negative but not statistically significant (Column 2). However, the density measures (Columns 3 and 4) suggest that railway access significantly increased the regional concentration of both assembly houses (4.53 points) and folk high schools (0.20 points).
These findings must be understood in the context of railway expansion timing. Since the IV estimates primarily capture the effect of main railway lines, they suggest that early railway connections facilitated the regional spread of Grundtvigian institutions, even if they were not directly responsible for establishing them in individual parishes (effects in parishes are insignificant, but local densities are generally more significant).
The reduced-form Callaway \BBA Sant’Anna (\APACyear2021) estimates in Panel B, where the LCP is directly regressed on the outcomes, suggest no significant effect on assembly houses but a positive effect on folk high schools (1.58 percentage points, Column 2). Furthermore, railway access significantly increased the density of both assembly houses and folk high schools, reinforcing the idea that early railways were instrumental in the regional diffusion of cultural and political movements, even if their immediate impact was weaker than later expansions.
Table A6 show the first stage. The F statistic, at 730.01 is highly above conventional level to limit concerns of weak instruments. A parish on the least cost path is 16.79 pct more likely to be connected to the railway.
| Outcome: | log(Pop.) | log(Child women ratio) | log(Manufacturing + 1) | log(Not Agriculture + 1) | HISCAM avg | log(Migration) |
|---|---|---|---|---|---|---|
| (1) | (2) | (3) | (4) | (5) | (6) | |
| A. TWFE estimates | ||||||
| Connected railway | 0.2064∗ | -0.0109 | 0.2917 | 0.2055 | 1.583∗∗ | -0.6508 |
| (0.1240) | (0.0364) | (0.2599) | (0.2601) | (0.7932) | (0.5248) | |
| Observations | 5,500 | 5,487 | 5,500 | 5,500 | 5,499 | 5,500 |
| Mean of outcome | 6.4738 | 0.39805 | 4.1564 | 4.4656 | 48.613 | 4.4131 |
| B. Callaway and Sant’Anna estimates (reduced form) | ||||||
| Connected railway | 0.0392∗ | 0.002019 | 0.04416 | 0.03679 | 0.4256∗∗∗ | 0.03686 |
| (0.02224) | (0.007529) | (0.04479) | (0.04104) | (0.1628) | (0.07324) | |
| Observations | 3568 | 3528 | 3568 | 3568 | 3568 | 3568 |
| Mean of outcome | 6.397 | 0.3976 | 4.088 | 4.397 | 48.58 | 4.354 |
| Outcome: | Assembly house | Folk high school | Density Assembly | Density Folk High |
|---|---|---|---|---|
| houses (MA) | Schools (MA) | |||
| (1) | (2) | (3) | (4) | |
| A. TWFE estimates | ||||
| Connected railway | 0.2545 | -0.0872 | 4.533∗∗∗ | 0.2019∗ |
| (0.1737) | (0.0791) | (1.196) | (0.1038) | |
| Observations | 103,125 | 103,125 | 103,125 | 103,125 |
| Mean of outcome | 0.17054 | 0.02898 | 4.3991 | 0.69150 |
| B. Callaway and Sant’Anna estimates | ||||
| Connected railway | -0.003269 | 0.01582∗∗ | 0.1198∗ | 0.0348∗∗∗ |
| (0.01398) | (0.006652) | (0.0714) | (0.007533) | |
| Observations | 119200 | 119200 | 119200 | 119200 |
| Mean of Outcome | 0.1715 | 0.02945 | 4.464 | 0.7024 |
| Connected railway | |
| (1) | |
| Variables | |
| Connected LCP | 0.1446∗∗∗ |
| (0.0387) | |
| Fit statistics | |
| F-test (1st stage) | 40.854 |
| Connected railway | |
| (1) | |
| Variables | |
| Connected LCP | 0.1679∗∗∗ |
| (0.0371) | |
| Fit statistics | |
| F-test (1st stage) | 730.01 |
E Census decompose calendar
Figure A3 presents the estimated effect of railway access on the six main census-based outcomes by calendar year, rather than by the time each parish was connected. Panel A shows the impact on the log of total population, indicating that while the effect is somewhat negative around 1860, it becomes clearly positive by 1880 and 1900, suggesting that the railway’s boost to local population took hold after an initial lag. Panel B depicts the log of the child-women ratio—our proxy for fertility—revealing only minor or slightly negative effects in the early years, with little discernible change thereafter. In Panel C, we see the effect on log(manufacturing + 1), where “manufacturing” is the number of individuals employed in HISCO-coded occupations starting with 7, 8, or 9. The estimates become more positive over time, reflecting a growing presence of manufacturing in railway-connected parishes.
Turning to broader occupational structure, Panel D displays the effect on log(non-agricultural employment + 1), combining manufacturing and other non-farm activities. This pattern largely mirrors manufacturing, underscoring a general shift toward non-agricultural work. Panel E shows the average HISCAM score—an index of occupational status—exhibiting a moderate but steady rise from 1860 to 1900 in connected parishes, suggesting that railway access was linked to a gradual upgrading of local occupational structures. Finally, Panel F plots the effect on log(migration), where migration is measured as the number of parish residents born in a different county. Here, the estimates are large and positive around 1860, dip somewhat by 1880, and then rise again by 1900, indicating waves of in-migration to connected parishes as the railway network and economic opportunities expanded. Overall, these results support that railways had increasingly positive effects on population, employment composition, occupational status, and migration over the latter half of the 19th century.
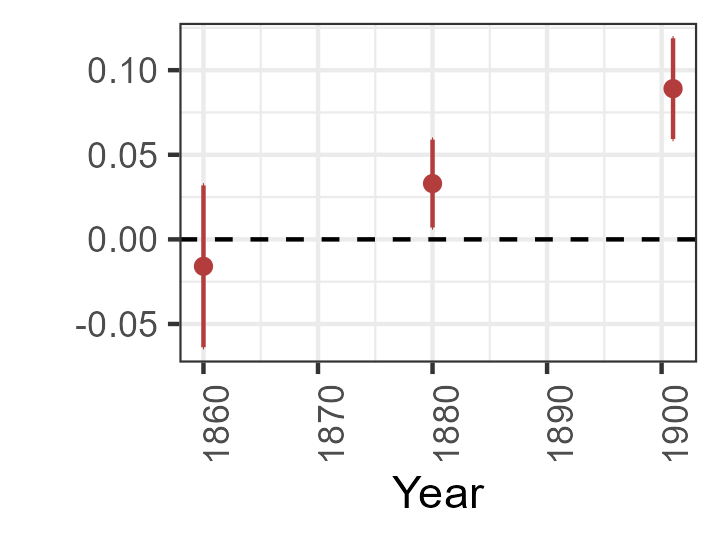
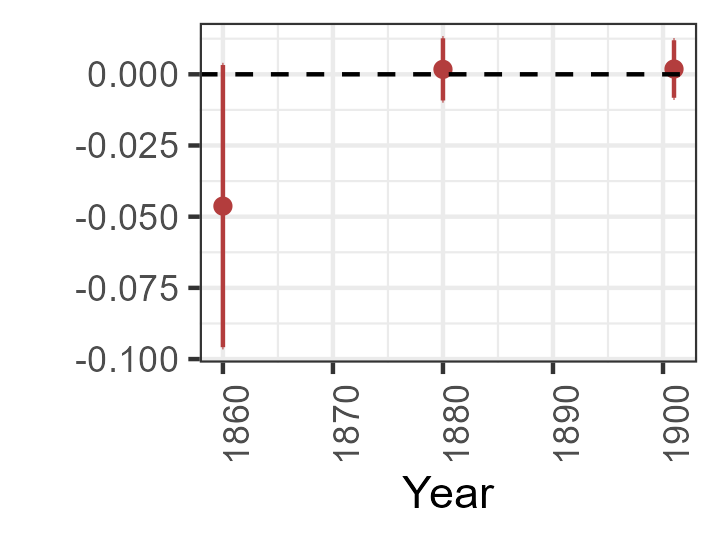


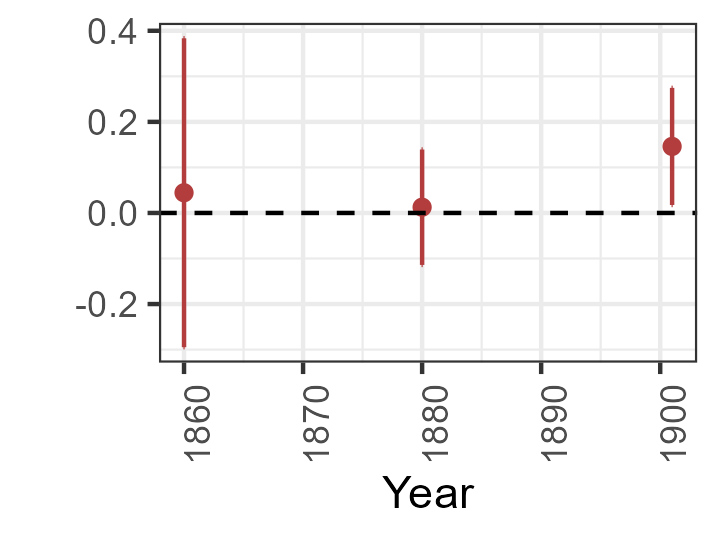
F Grundtvig decompose by decade
Figure A4 plots the estimated effect of the railway on Grundtvigian outcomes, with the results decomposed by decade, by rounding down each treatment year to the closest decade. In Panel A, the only statistically significant effect emerges in the 1880–1890 period, where assembly houses are 8.7 percent more likely (S.E. 0.00963) to be established in railway-connected parishes. For folk high schools (Panel B), no statistically significant effects are observed, though the estimates remain positive across most periods. Panels (C) and (D) present the density-based measures, incorporating neighboring parishes. The parishes connected in the period 1860-1869 experienced a large positive effect on the local density of the Grundtvigian institutions, while there was a slight negative effect on assembly houses in 1870-1879 and no significant results elsewhere.