Phonon anomalies within the polar charge density wave phase of superconductor Mo3Al2C with structural chirality
Abstract
We employ polarization-resolved Raman spectroscopy to study the lattice dynamics of the polar charge density wave phase of the superconductor Mo3Al2C with structural chirality. We show the phononic signatures of the charge density wave transition at = 155 K in Mo3Al2C. The detailed temperature dependence of these phonon modes’ frequency, half-width-at-half-maximum, and the integrated area below reveal anomalies at an intermediate temperature 100 K, especially for the low-energy modes at 130 cm-1 and 180 cm-1. Since these low-energy modes are dominated by Mo-related lattice vibration, we propose that lattice anomalies at within the charge density wave phase are related to a modification of the Mo displacements while preserving the crystal symmetry.
pacs:
74.70.Xa,74,74.25.ndI Introduction
In the year of 1965, Anderson and Blount first proposed the concept of ferroelectric metals or polar metals Anderson and Blount (1965). Although it is proposed long ago and many compounds were predicted Benedek and Birol (2016); Hickox-Young et al. (2023), only a few examples are experimentally verified, as ferroelectricity and metallicity are traditionally considered incompatible Zhou and Ariando (2020); Ghosez and Junquera (2022); Bhowal and Spaldin (2023). Hence, considerable attention is being directed towards exploring various unconventional mechanisms to realize polar metal phases Benedek and Birol (2016); Zhou and Ariando (2020); Ghosez and Junquera (2022); Bhowal and Spaldin (2023). The decoupled electron mechanism Anderson and Blount (1965); Puggioni and Rondinelli (2014); Kim et al. (2016), which involves a significant separation between the density of states of polar modes and the Fermi level, results in the polar distortion being decoupled from the itinerant electrons surrounding the Fermi sea He and Jin (2016); Shi et al. (2013); Lei et al. (2018); Benedek and Fennie (2011). Another unconventional mechanism for the coexistence of polarization and conductivity is demonstrated experimentally by switchable ferroelectric metal WTe2 and 1T′-MoTe2 Fei et al. (2018); Sakai et al. (2016) via interlayer sliding mechanism, which corresponds to the decoupled space mechanism. The third unconventional mechanism is via polar bulking in hyperferroelectric metals being resistant to itinerant electrons, as predicted in hexagonal ABC compounds (LiGaGe type) Garrity et al. (2014).
In principle, breaking symmetry through charge disproportionation and ordering can lead to the emergence of ferroelectricity. In other words, when a non-centrosymmetric charge modulation occurs, it can result in a potential net electric polarization Cheong and Mostovoy (2007); van den Brink and Khomskii (2008); Fiebig et al. (2016). This concept has been proposed and studied in several insulating systems, such as magnetite Fe3O4 Alexe et al. (2009), bond-centered and site-centered PrxCa1-xMnO3 Efremov et al. (2004), mixed-valence compounds Alonso et al. (1999); Ikeda et al. (2005); de Groot et al. (2012), and superlattice systems Park et al. (2017); Krick et al. (2016); Qi and Rabe (2022); Xu et al. (2023). However, the phenomenon of charge ordering or charge density wave (CDW) driven polarization in metallic systems has been little studied.
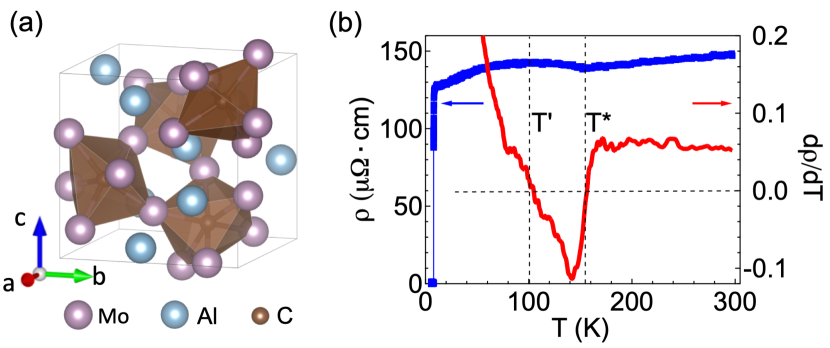
Recently, Mo3Al2C has been reported to be a CDW-driven polar metal coexisting with superconductivity and structural chirality Wu et al. (2024). Mo3Al2C has a cubic structure with space group or (point group ) at room temperature [Fig. 1(a)]. The crystal structure lacks inversion and mirror symmetries. It is noncentrosymmetric, chiral, and nonpolar at room temperature. Upon cooling, resistivity measurement shows a superconducting transition at = 8 K and a dip at around = 155 K [Fig. 1(b)] Zhigadlo et al. (2018). The anomalies at are also reported in previous magnetic susceptibility, specific heat, and nuclear-magnetic-resonance measurements Zhigadlo et al. (2018); Koyama et al. (2013, 2011); Kuo et al. (2012). Our recent transmission electron microscopy and Raman scattering results have established a CDW order below in Mo3Al2C Wu et al. (2024). We also show that the transition at is a cubic-nonpolar-to-rhombohedral-polar transition driven by condensation of soft modes at three symmetry equivalent wavevectors located at the Brillouin zone boundaries, creating a polarization along the three-fold axis in the body-diagonal direction below Wu et al. (2024).
In this work, we present a detailed analysis of the lattice dynamics in the polar CDW phase of the superconductor Mo3Al2C, using polarization-resolved Raman spectroscopy. We identify the phononic signatures associated with the CDW transition at = 155 K in Mo3Al2C. An examination of the temperature dependence of the phonon modes’ frequency, half-width-at-half-maximum, and the integrated area below , particularly for the modes at 130 and 180 cm-1, reveals anomalies at an intermediate temperature, K. We propose that the lattice anomalies at within the CDW phase are related to a change in the Mo displacements while keeping the crystal symmetry unchanged.
II Experiment and Methods
Single crystal preparation and characterization – Single crystals of Mo3Al2C were grown using a laser floating zone furnace described in Ref. Wu et al. (2024). Electric transport measurements were carried out in a standard four-point probe method in the (1 0 0) plane in the He exchanges gas environment using a PPMS in a cooling-down process.
Raman scattering measurements – The polished Mo3Al2C crystals with (1 0 0) plane and (1 1 1) plane used for the Raman scattering study were positioned in a continuous helium flow optical cryostat. The Raman measurements were mainly performed using the Kr+ laser line at 647.1 nm (1.92 eV) in a quasibackscattering geometry along the crystallographic axis. The excitation laser beam was focused into a m2 spot on the plane, with the incident power around 12 mW. The scattered light was collected and analyzed by a triple-stage Raman spectrometer and recorded using a liquid nitrogen-cooled charge-coupled detector. Linear and circular polarizations are used in this study to decompose the Raman data into different irreducible representations. The instrumental resolution was maintained better than 1.5 cm-1. All linewidth data presented in this paper have been corrected for instrumental resolution. The temperature shown in this paper has been corrected for laser heating Wu et al. (2024).
Group theory analysis – Group theory predictions were performed using the tool provided in the Isotropy Software Suite and the Bilbao Crystallographic Server Kroumova et al. (2003); Aroyo et al. (2011); Hatch and Stokes (2003). The information for the irreducible representations of point groups and space groups follow the notations of Cracknell, Davies, Miller & Love Cracknell et al. (1979), which is the same for the Bilbao Crystallographic Server Aroyo et al. (2011, 2006).
| Scattering Geometry | Symmetry Channel (O) |
|---|---|
| Symmetry Channel | Expression |
|---|---|
| Scattering Geometry | Symmetry Channel (O) |
|---|---|
III Results and Discussions
III.1 Phonon modes
The high-temperature phase of Mo3Al2C () belongs to a cubic structure with space group or [point group (432)] at room temperature [Fig. 1(a)]. One of the phases ( or ) is dominant in the sample we studied Wu et al. (2024). The Mo, Al, and C atoms have Wyckoff positions , , and , respectively. From the group theoretical considerations, point phonon modes of the cubic Mo3Al2C can be expressed as = 2 + 4 + 6 + 8 + 10. Raman active modes = 2 + 6 + 8, IR active modes are =9. Note that signals might become Raman active under resonant conditions. The acoustic mode is =. Here, we use the notations in the high-temperature phase for discussions of the phonon modes and their temperature dependence.
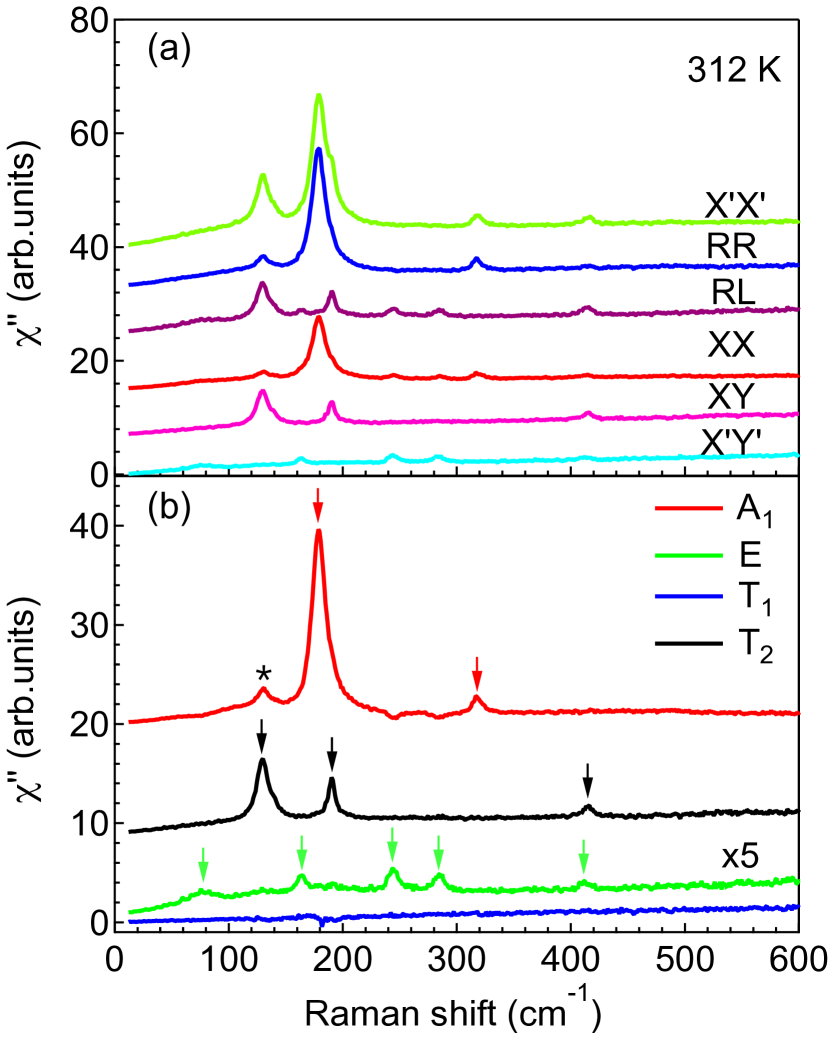
For the point group, the Raman selection rules indicate that the , , , , , and polarization geometries probe the , , , , , and symmetry excitations, respectively. Symmetry analysis for the point group is summarized in Table 1. The algebra used to decompose measured Raman spectra into four irreducible representations for the point group are shown in Table 2.
In Fig. 2(a), we show the phonon spectra of Mo3Al2C at room temperature in the measured six scattering geometries for a polished (1 0 0) surface. Several phonon modes with , , and symmetries are observed in these scattering geometries. As we show the symmetry decompositions according to point group [Table 2] in Fig. 2(b), these phonon modes are separated into the , , , and symmetry channels. In the symmetry channel, we detect two phonon modes at 180 and 319 cm-1, corresponding to Mo and Al fully symmetric lattice vibrations, respectively. In the symmetry channel, we detect three phonons at 129, 190, and 415 cm-1. Note that the low-energy at 129 cm-1 leaks into the symmetry channel, creating a weak peak in the symmetry channel. This leakage signal might be due to imperfect cutting and polishing of the single crystal. In the symmetry channel, we observe five phonon modes at 75, 164, 245, 285, and 413 cm-1. These -symmetry phonon intensities are generally 5 times weaker than the -symmetry phonons. The four sharp modes are first-order phonons, while the broad one at 75 cm-1 is a second-order two-phonon excitation as the linewidth is four times of the three sharp ones. In the antisymmetric channel, we barely detect any phonon modes. The peak positions of the , , and phonons are summarized in Table 4.
| Symmetry | Experiment |
|---|---|
| 75 | |
| 129 | |
| 164 | |
| 180 | |
| 190 | |
| 245 | |
| 285 | |
| 319 | |
| 413 | |
| 415 |
Upon cooling below 155 K, Mo3Al2C undergoes a CDW transition, and becomes a rhombohedral R3 structure with the point group . The primitive cell at low temperature becomes a superstructure and thus four times larger in the hexagonal setting Wu et al. (2024). The correlation table for the point group indicates that and irreducible representations merge into irreducible representation in the R3 phase, irreducible representation does not change, and irreducible representation splits into in the R3 phase Wu et al. (2024). From the group theoretical considerations, point phonon modes of the rhombohedral Mo3Al2C can be expressed as = 96 96. Raman active modes and IR active modes = = 95, and the acoustic mode =. Note that the fully-symmetry carbon lattice vibration mode becomes Raman active in the phase below .
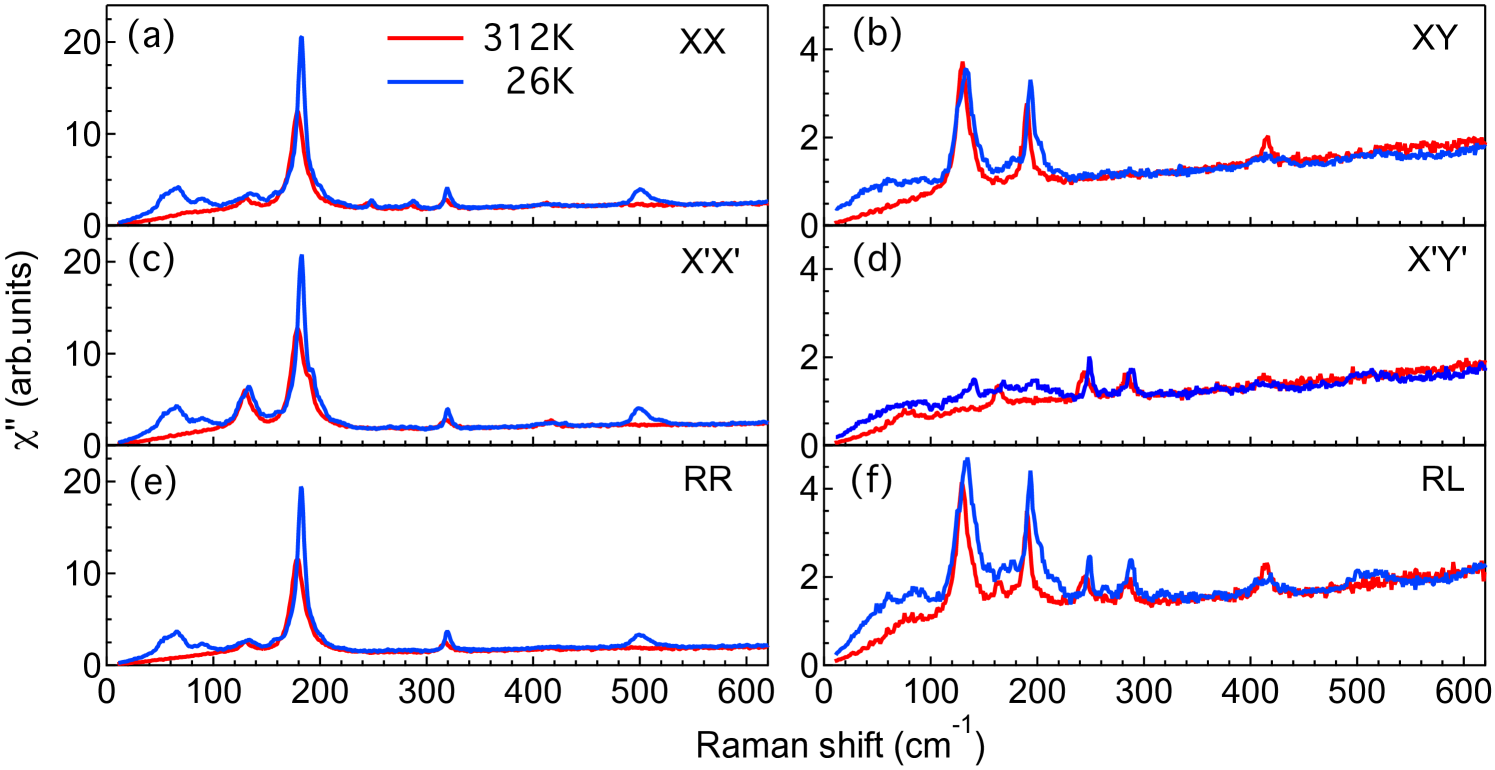
As shown in Fig. 3(a), (c), and (e), several low-energy -symmetry modes appear below 100 cm-1 in the parallel scattering geometries below . They correspond to the Mo lattice vibration modes according to the DFT phonon calculation Reith et al. (2012a). Specifically, the broad peak at around 50 cm-1 appearing at low temperatures is the amplitude mode of the CDW order parameter Wu et al. (2024). Furthermore, a noticeable -symmetry peak at around 500 cm-1 appears in the , , and scattering geometries below . A weaker -symmetry peak at around 520 cm-1 appears in the and scattering geometries. They correspond to the carbon lattice vibrations modes Reith et al. (2012a), which only appear in the symmetry-broken state according to group-theoretical analysis. Lastly, below , the four first-order -symmetry phonon modes do not split as they can be fitted by a single Lorentzian function shown in Fig. 5(e)-(h). In the scattering geometry, we detect two -symmetry phonons at 129 and 190 cm-1 at 312 K. They split into two modes in the 26 K data as shown in Fig. 5(i)-(l).
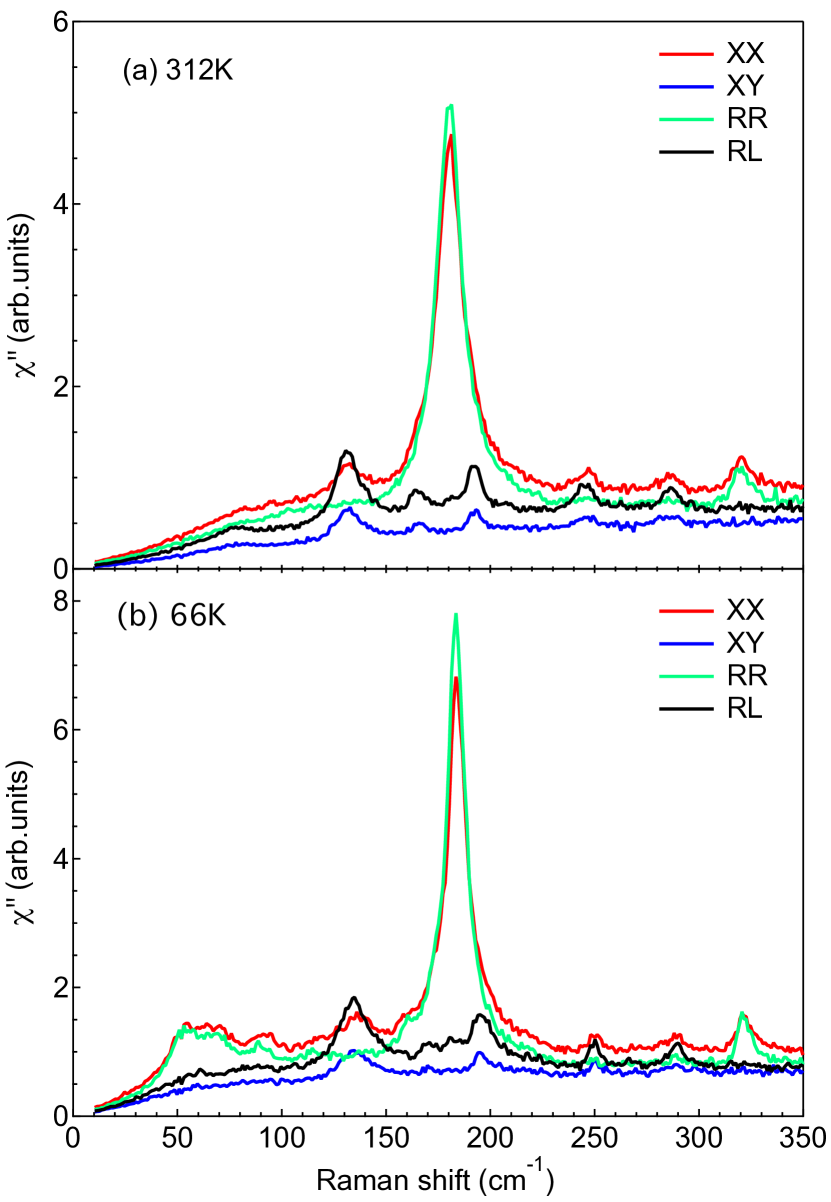
In Fig. 4, we present the Raman response of Mo3Al2C at 312 K and 66 K in the measured four scattering geometries from a polished (1 1 1) surface. The phonon spectra at 312 K and 66 K are consistent with the Raman data measured from the (1 0 0) surface [Figs. 2 and 3]. Regarding the selection rule for the (1 1 1) surface [Table 3], and irreducible representations can be separated in the and scattering geometries, respectively. This is impossible for Raman response from the (1 0 0) surface as the phonons with and symmetries always appear together in the parallel scattering geometries. This point is rather helpful in the discussion of the second-order Raman response in the following section.
III.2 Temperature dependence
After establishing the phonon modes in Mo3Al2C, we switch to study their temperature dependence.
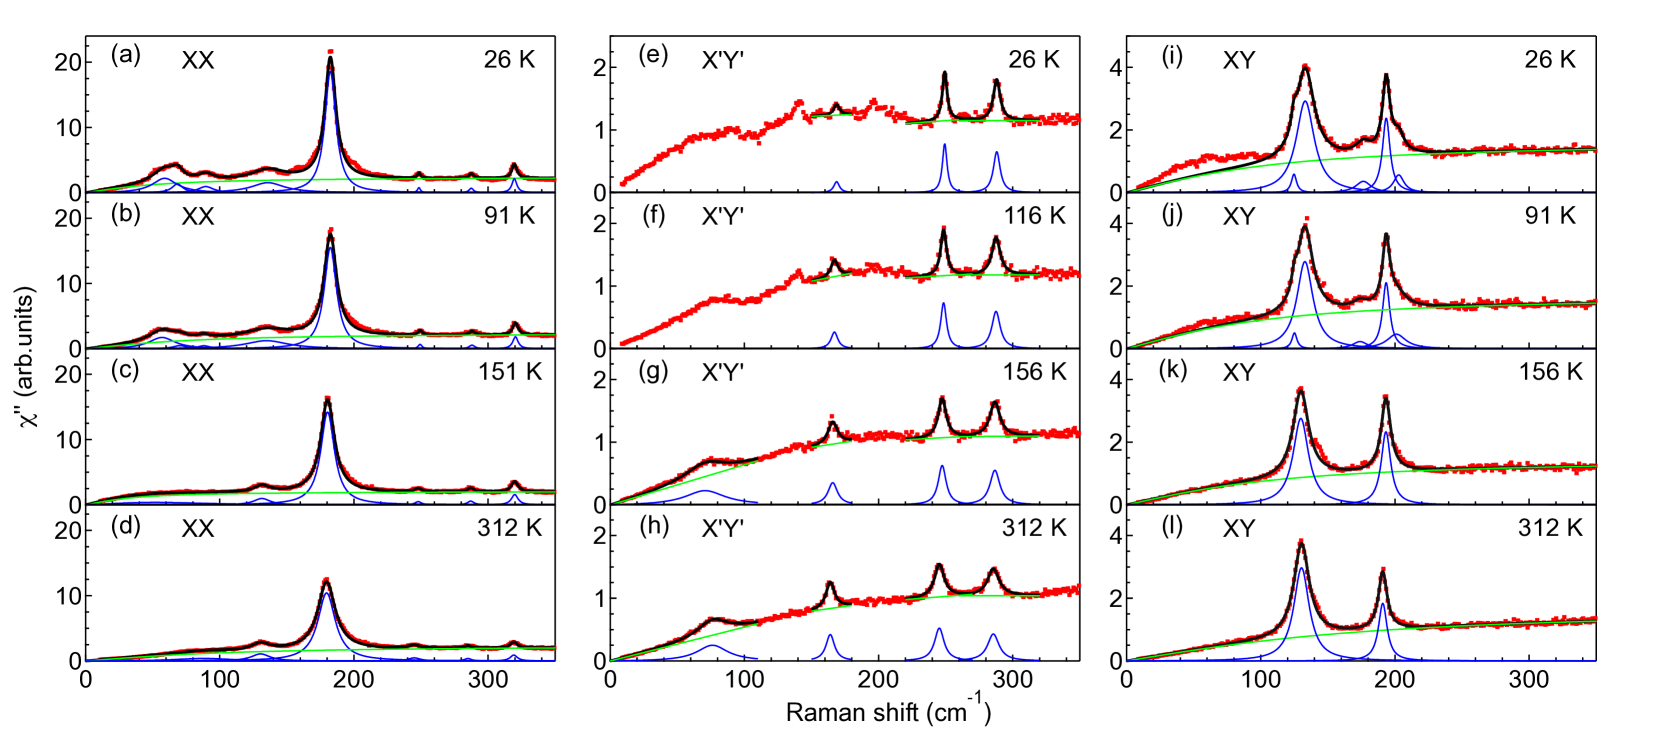
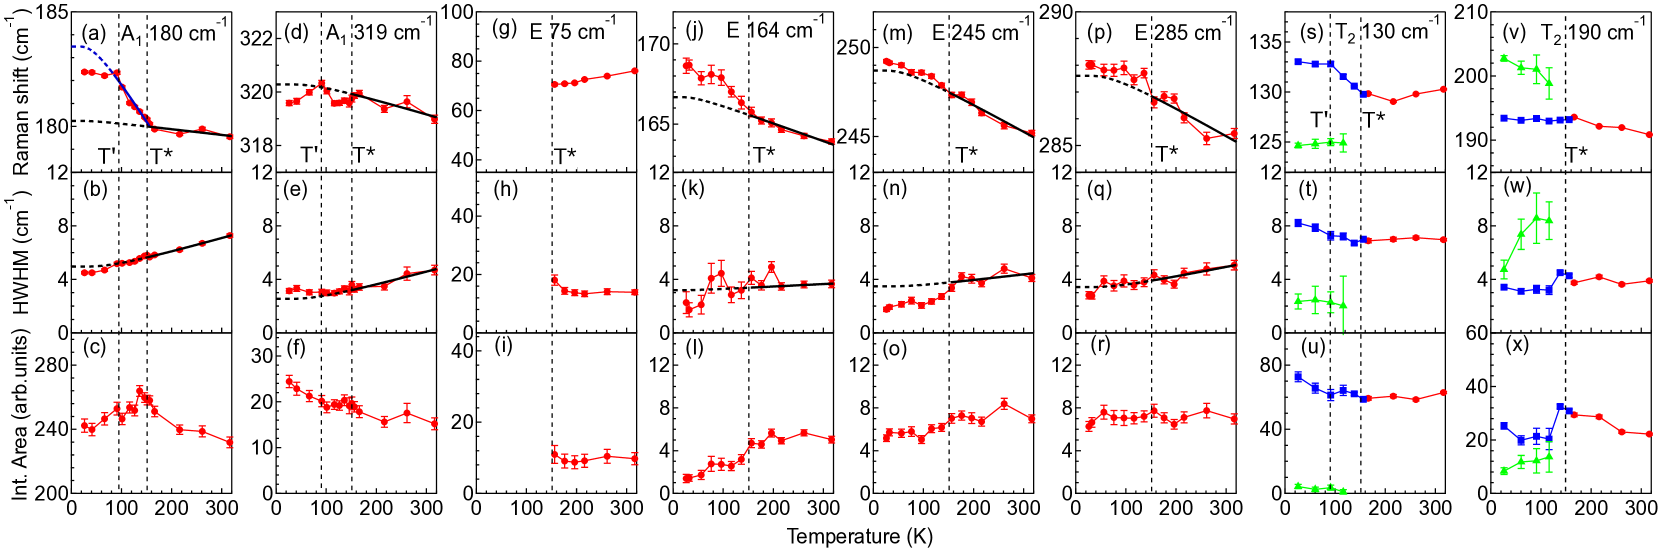
In Fig. 5, we show the fitting results to data in the , , and scattering geometries from (1 0 0) surface of Mo3Al2C at selected temperatures 312, 151, 91, and 26 K by multi-Lorentzian peaks fitting on a smooth background. In Fig. 6, we present the temperature dependence of the peak frequencies, HWHM (half-width at half-maximum), and intergraded area for these , , and phonon modes.
As shown in Fig. 6(a), the phonon mode at 180 cm-1 hardens upon cooling. It shows substantial additional hardening upon cooling below , suggesting this mode couples to the CDW order parameter. Below K, the phonon mode at 180 cm-1 shows a saturation-like behavior. The anomaly at is also found in the -dependence of the resistivity curve where the slope changes sign at , namely, is zero at around [Fig. 1(b)]. The temperature dependence for the mode frequency follows well the anharmonic phonon decay model [Appendix A] in both the temperature range and . On the contrary, the mode at 319 cm-1 decreases a little bit upon cooling below , then increases, finally decreases again, and forms a local maximum at . For the HWHM of these two modes, both of them decease upon cooling, showing anomalies at . For the integrated area, the phonon mode at 180 cm-1 shows an increase upon cooling and decreases below . In contrast, the phonon mode at 319 cm-1 increases continuously upon cooling, indicating the finite electron-phonon coupling in this system Ye et al. (2019).
For the mode at 164, 245, and 285 cm-1, these three phonons harden upon cooling, showing additional hardening below . The additional hardening is larger for the mode at 164 cm-1 than the other two modes [Figs. 6(j), (m), and (p)]. These three phonon modes narrow upon cooling. The HWHM for the modes at 164 and 285 cm-1 follow well the anharmonic phonon decay model [Fig. 6(k) and (q)] while the mode at 245 cm-1 narrow much faster below [Fig. 6(n)]. For the integrated area, the two phonons at 245 and 285 cm-1 remain almost constant [Fig. 6(o) and (r)] while it decreases fast for the mode at 164 cm-1 below [Fig. 6(l)].
The mode at 75 cm-1 softens to 70 cm-1 from 312 K to [Fig. 6(g)]. In contrast, the linewidth and the integrated area for this mode increase slightly upon cooling close to [Fig. 6(h) and (i)]. Note that the linewidth of the 75 cm-1 mode is four times of the other modes. The softening of the 75 cm-1 mode above , the spectra lineshape change below , and its large line-width broadening suggest that it is not a regular first-order phonon mode, but rather a second-order phonon that reflects the softening phonon branch at around points Wu et al. (2024), similar to the study of 2H-NbSe2 Mialitsin (Ph.D. thesis, Rutgers University-Graduate School-New Brunswick, 2010). This -type second-order phonon is symmetry allowed based on the direct product rules: (Appendix B). The details of the second-order scattering process are also shown in Appendix B. Generally, for second-order Raman scattering, the identity representation produces scattering efficiencies considerably stronger than the other channels, as is the case for Si Cardona (1993). For Mo3Al2C, the second-order Raman scattering intensity is more noticeable in the symmetry channel [ in Fig. 4(a)] than that in the symmetry channel [ in Fig. 4(a)], rendering Mo3Al2C as a special case for second-order Raman scattering.
For the phonon modes, these two modes at 130 and 190 cm-1 are observed above shown in Fig. 5(i)-(l). Below , the mode splits into two modes, as shoulder peaks can be seen on the left side of the mode at 130 cm-1 and on the right side of the mode at 190 cm-1. The splitting of the phonon modes is due to the symmetry breaking as a result of the CDW order below Wu et al. (2024). The splittings can be seen from the fitting of these modes shown in Figs. 5(i)-(l). Above , a single Lorentzian function can describe the phonon well while it requires two Lorentzian functions to model the phonon below . Note that a separate peak at 177 cm-1 appears below . It is a new mode, and it does not belong to one of the components of the mode at 190 cm-1.
The fitting parameters for phonon modes are presented in Figs. 6(s)-(x). For the mode at 130 cm-1, it softens 1 cm-1 upon cooling from 312 K to 200 K [Fig. 6(s)] while the HMHW and the integrated area barely change [Fig. 6(t) and (u)]. Below , it splits into two modes: one is at 125 cm-1 and the other one is at 133 cm-1. For the mode at 190 cm-1, it hardens slightly upon cooling [Fig. 6(v)] while the HMHW barely changes [Fig. 6(w)] and the integrated area increases slightly [Fig. 6(x)]. Below , it splits into two modes: one is at 193 cm-1 and the other one is at 202 cm-1. We note that the high-energy component of the split 130 cm-1 mode shows an anomaly at , namely, the -dependence of the mode’s frequency shows a saturation-like behavior below [Fig. 6(s)], similar to the mode at 180 cm-1 [Fig. 6(a)].
Finally, we discuss the origin of the phonon and resistivity anomalies at . Based on the density functional theory phonon calculations, there are three unstable phonon modes in the phonon dispersion for the cubic phase of Mo3Al2C: (0, 0, 0), (0.5, 0.5, 0), and (0.5, 0.5, 0) Wu et al. (2024); Reith et al. (2012b). In our previous study Wu et al. (2024), we have shown that Mo3Al2C undergoes a cubic-nonpolar-to-rhombohedral-polar transition below into an R3 phase, which is driven by condensation of soft modes at three symmetry equivalent wavevectors located at the Brillouin zone boundary, and creates a polarization along the three-fold axis in the body-diagonal direction below . The analysis of the -dependence of the superlattice Bragg peaks and polar domain imaging support that the CDW transition and the polar transition occur at the same temperature SM . From the -dependence of Raman response in the , , and scattering geometries (Fig. 5 in the main text and Fig. 3 in Ref. Wu et al. (2024)), the number of new phonon modes does not change below , thus the phonon anomalies at do not seem to be related to zone-boundary lattice instabilities. Furthermore, the twofold-degenerate modes do not split within the R3 phase (Fig. 3 and Fig. 5), which rules out a symmetry-breaking phase transition at . Consequently, we infer that the phonon anomalies at are related to a modification of Mo-lattice displacements while preserving the point-group symmetry, because the Mo lattice-vibration related modes ( mode at 130 cm-1 and mode at 180 cm-1) Reith et al. (2012a) show clear saturation-like behaviors below . To understand the details of the phase transitions in Mo3Al2C, further high-resolution X-ray structure refinement investigations of the lattice distortions below and are required.
IV CONCLUSIONS
In summary, we study the lattice dynamics of the polar CDW phase of the superconductor Mo3Al2C by polarization-resolved Raman spectroscopy. We investigate the temperature dependence of the phonon modes’ frequency, half-width-at-half-maximum, the integrated area below K, and find anomalies at an intermediate temperature 100 K for the modes at 130 and 180 cm-1. We infer that the lattice anomalies at are related to a modification of Mo displacements within the CDW phase while preserving the lattice symmetry. High-resolution X-ray structure refinement investigations of the lattice distortions below and are required to further understand the phase transitions in the polar CDW compound Mo3Al2C. Our results in this paper provide detailed lattice dynamics information for Mo3Al2C, forming a basis for future studies of the superconducting state in Mo3Al2C which processes both structural polarity and chirality, switchable ferroelectric superconductivity Jindal et al. (2023), nonreciprocal charge transport Tokura and Nagaosa (2018); Nadeem et al. (2023), and unconventional paring mechanism Yip (2014); Kallin and Berlinsky (2016).
Acknowledgements.
The spectroscopy work at Rutgers (S.F.W and G.B.) was supported by NSF Grants No. DMR-2105001. The work at BAQIS (S.F.W.) was supported by the National Natural Science Foundation of China (Grant No. 12404548). The sample growth, characterization, and TEM work (X.H.X., F.T.H, and S.W.C.) was supported by the W. M. Keck foundation grant to the Keck Center for Quantum Magnetism at Rutgers University. T.B. was supported by the Department of Energy through the University of Minnesota Center for Quantum Materials under DESC0016371. The work at NICPB was supported by the European Research Council (ERC) under the European Union’s Horizon 2020 research and innovation programme grant agreement No. 885413.Appendix A Anharmonic phonon decay model
In this appendix, we discuss the anharmonic phonon decay model. We fit the temperature dependence of the phonon frequency and HWHM by anharmonic phonon decay model Klemens (1966); Menéndez and Cardona (1984):
| (1) |
| (2) |
where , is the Bose-Einstein distribution function. and involves mainly three-phonon decay process where an optical phonon decays into two acoustic modes with equal energy and opposite momentum.
Appendix B Direct product of
In this appendix, we study the possibility of two-phonon Raman processes due to the modes. The combination of two phonons with the same wavevector can couple with a number of modes from the point, whereas the combination of two phonons from different points can couple with phonons from the only other point in the Brillouin zone. The complete list of modes that two modes couple to can be predicted by taking the product irreducible representation (irrep) by itself, , and decomposing it into irreducible representations of the space group. Since is a six-dimensional irrep (it has a 2D little group irrep on each of the 3 different points in the star), this product is 36 dimensional. Only 9 of these 36 degrees of freedom are at the point, and they are
| (3) |
where the includes irreps from the point. In other words, the two-phonon processes from modes can couple with a , a , a , or a phonon. (Using the point group irreps labels, these are the , , , and modes respectively.)
The next question that is relevant is what combinations of the 6 degrees of freedom of the modes couple with these modes. In the following, for simplicity, we denote 6 symmetry adapted components of as , respectively. Denoting the only component of the fully symmetric irrep as , the coupling term that is second order in and first order in () is
| (4) |
Similarly, the coupling between (), whose components we denote as and , is
| (5) |
Using a similar notation, the coupling to () is
| (6) |
and the coupling to () is
| (7) |
References
- Anderson and Blount (1965) P. W. Anderson and E. I. Blount, “Symmetry considerations on martensitic transformations: ”ferroelectric” metals?” Phys. Rev. Lett. 14, 217–219 (1965).
- Benedek and Birol (2016) Nicole A. Benedek and Turan Birol, “‘ferroelectric’ metals reexamined: fundamental mechanisms and design considerations for new materials,” J. Mater. Chem. C 4, 4000–4015 (2016).
- Hickox-Young et al. (2023) Daniel Hickox-Young, Danilo Puggioni, and James M. Rondinelli, “Polar metals taxonomy for materials classification and discovery,” Phys. Rev. Mater. 7, 010301 (2023).
- Zhou and Ariando (2020) W. X. Zhou and A. Ariando, “Review on ferroelectric/polar metals,” Japanese Journal of Applied Physics 59, SI0802 (2020).
- Ghosez and Junquera (2022) Philippe Ghosez and Javier Junquera, “Modeling of ferroelectric oxide perovskites: From first to second principles,” Annual Review of Condensed Matter Physics 13, 325–364 (2022).
- Bhowal and Spaldin (2023) Sayantika Bhowal and Nicola A. Spaldin, “Polar metals: Principles and prospects,” Annual Review of Materials Research 53, 53–79 (2023).
- Puggioni and Rondinelli (2014) Danilo Puggioni and James M. Rondinelli, “Designing a robustly metallic noncenstrosymmetric ruthenate oxide with large thermopower anisotropy,” Nature Communications 5, 3432 (2014).
- Kim et al. (2016) T. H. Kim, D. Puggioni, Y. Yuan, L. Xie, H. Zhou, N. Campbell, P. J. Ryan, Y. Choi, J.-W. Kim, J. R. Patzner, S. Ryu, J. P. Podkaminer, J. Irwin, Y. Ma, C. J. Fennie, M. S. Rzchowski, X. Q. Pan, V. Gopalan, J. M. Rondinelli, and C. B. Eom, “Polar metals by geometric design,” Nature 533, 68–72 (2016).
- He and Jin (2016) Xu He and Kui-juan Jin, “Persistence of polar distortion with electron doping in lone-pair driven ferroelectrics,” Phys. Rev. B 94, 224107 (2016).
- Shi et al. (2013) Youguo Shi, Yanfeng Guo, Xia Wang, Andrew J. Princep, Dmitry Khalyavin, Pascal Manuel, Yuichi Michiue, Akira Sato, Kenji Tsuda, Shan Yu, Masao Arai, Yuichi Shirako, Masaki Akaogi, Nanlin Wang, Kazunari Yamaura, and Andrew T. Boothroyd, “A ferroelectric-like structural transition in a metal,” Nature Materials 12, 1024–1027 (2013).
- Lei et al. (2018) Shiming Lei, Mingqiang Gu, Danilo Puggioni, Greg Stone, Jin Peng, Jianjian Ge, Yu Wang, Baoming Wang, Yakun Yuan, Ke Wang, Zhiqiang Mao, James M. Rondinelli, and Venkatraman Gopalan, “Observation of quasi-two-dimensional polar domains and ferroelastic switching in a metal, Ca3Ru2O7,” Nano Letters 18, 3088–3095 (2018).
- Benedek and Fennie (2011) Nicole A. Benedek and Craig J. Fennie, “Hybrid improper ferroelectricity: A mechanism for controllable polarization-magnetization coupling,” Phys. Rev. Lett. 106, 107204 (2011).
- Fei et al. (2018) Zaiyao Fei, Wenjin Zhao, Tauno A. Palomaki, Bosong Sun, Moira K. Miller, Zhiying Zhao, Jiaqiang Yan, Xiaodong Xu, and David H. Cobden, “Ferroelectric switching of a two-dimensional metal,” Nature 560, 336–339 (2018).
- Sakai et al. (2016) Hideaki Sakai, Koji Ikeura, Mohammad Saeed Bahramy, Naoki Ogawa, Daisuke Hashizume, Jun Fujioka, Yoshinori Tokura, and Shintaro Ishiwata, “Critical enhancement of thermopower in a chemically tuned polar semimetal MoTe2,” Science Advances 2, e1601378 (2016).
- Garrity et al. (2014) Kevin F. Garrity, Karin M. Rabe, and David Vanderbilt, “Hyperferroelectrics: Proper ferroelectrics with persistent polarization,” Phys. Rev. Lett. 112, 127601 (2014).
- Cheong and Mostovoy (2007) Sang-Wook Cheong and Maxim Mostovoy, “Multiferroics: a magnetic twist for ferroelectricity,” Nature Materials 6, 13–20 (2007).
- van den Brink and Khomskii (2008) Jeroen van den Brink and Daniel I Khomskii, “Multiferroicity due to charge ordering,” Journal of Physics: Condensed Matter 20, 434217 (2008).
- Fiebig et al. (2016) Manfred Fiebig, Thomas Lottermoser, Dennis Meier, and Morgan Trassin, “The evolution of multiferroics,” Nature Reviews Materials 1, 16046 (2016).
- Alexe et al. (2009) Marin Alexe, Michael Ziese, Dietrich Hesse, Pablo Esquinazi, Kunihiko Yamauchi, Tetsuya Fukushima, Silvia Picozzi, and Ulrich Gösele, “Ferroelectric switching in multiferroic magnetite Fe3O4 thin films,” Advanced Materials 21, 4452–4455 (2009).
- Efremov et al. (2004) Dmitry V. Efremov, Jeroen van den Brink, and Daniel I. Khomskii, “Bond- versus site-centred ordering and possible ferroelectricity in manganites,” Nature Materials 3, 853–856 (2004).
- Alonso et al. (1999) J. A. Alonso, J. L. García-Muñoz, M. T. Fernández-Díaz, M. A. G. Aranda, M. J. Martínez-Lope, and M. T. Casais, “Charge Disproportionation in RNiO3 Perovskites: Simultaneous Metal-Insulator and Structural Transition in YNiO3,” Phys. Rev. Lett. 82, 3871–3874 (1999).
- Ikeda et al. (2005) Naoshi Ikeda, Hiroyuki Ohsumi, Kenji Ohwada, Kenji Ishii, Toshiya Inami, Kazuhisa Kakurai, Youichi Murakami, Kenji Yoshii, Shigeo Mori, Yoichi Horibe, and Hijiri Kitô, “Ferroelectricity from iron valence ordering in the charge-frustrated system LuFe2O4,” Nature 436, 1136–1138 (2005).
- de Groot et al. (2012) J. de Groot, T. Mueller, R. A. Rosenberg, D. J. Keavney, Z. Islam, J.-W. Kim, and M. Angst, “Charge Order in : An Unlikely Route to Ferroelectricity,” Phys. Rev. Lett. 108, 187601 (2012).
- Park et al. (2017) Se Young Park, Anil Kumar, and Karin M. Rabe, “Charge-Order-Induced Ferroelectricity in Superlattices,” Phys. Rev. Lett. 118, 087602 (2017).
- Krick et al. (2016) Alex L. Krick, Chan-Woo Lee, Rebecca J. Sichel-Tissot, Andrew M. Rappe, and Steven J. May, “Interplay between cation and charge ordering in La1/3Sr2/3FeO3 superlattices,” Advanced Electronic Materials 2, 1500372 (2016).
- Qi and Rabe (2022) Yubo Qi and Karin M. Rabe, “Electron-lattice coupling effects in nonadiabatic polarization switching of charge-order-induced ferroelectrics,” Phys. Rev. B 106, 125131 (2022).
- Xu et al. (2023) Shipu Xu, Xing Xu, and Shidang Xu, “Charge-gradient-induced ferroelectricity with robust polarization reversal,” Nano Letters 23, 298–304 (2023).
- Wu et al. (2024) Shangfei Wu, Fei-Ting Huang, Xianghan Xu, Ethan Ritz, Turan Birol, Sang-Wook Cheong, and Girsh Blumberg, “Polar charge density wave in a superconductor with crystallographic chirality,” Nature Communications 15, 9276 (2024).
- Zhigadlo et al. (2018) N. D. Zhigadlo, D. Logvinovich, V. A. Stepanov, R. S. Gonnelli, and D. Daghero, “Crystal growth, characterization, and point-contact Andreev-reflection spectroscopy of the noncentrosymmetric superconductor Mo3Al2C,” Phys. Rev. B 97, 214518 (2018).
- Koyama et al. (2013) Takehide Koyama, Yoshitaka Maeda, Tomoaki Yamazaki, Ko-ichi Ueda, Takeshi Mito, Takao Kohara, Takeshi Waki, Yoshikazu Tabata, Hiroshi Tsunemi, Mikio Ito, and Hiroyuki Nakamura, “Normal and superconducting properties of the noncentrosymmetric Mo3Al2C,” Journal of the Physical Society of Japan 82, 073709 (2013).
- Koyama et al. (2011) T. Koyama, Y. Ozaki, K. Ueda, T. Mito, T. Kohara, T. Waki, Y. Tabata, C. Michioka, K. Yoshimura, M.-T. Suzuki, and H. Nakamura, “Partial gap opening on the Fermi surface of the noncentrosymmetric superconductor Mo3Al2C,” Phys. Rev. B 84, 212501 (2011).
- Kuo et al. (2012) C. N. Kuo, H. F. Liu, and C. S. Lue, “NMR characteristics in noncentrosymmetric Mo3Al2C,” Phys. Rev. B 85, 052501 (2012).
- Kroumova et al. (2003) E. Kroumova, M. I. Aroyo, J. M. Perez-Mato, A. Kirov, C. Capillas, S. Ivantchev, and H. Wondratschek, “Bilbao crystallographic server: Useful databases and tools for phase-transition studies,” Phase Transit. 76, 155–170 (2003).
- Aroyo et al. (2011) M. I. Aroyo, J. M. Perez-Mato, D. Orobengoa, E. Tasci, G. De La Flor, and A. Kirov, “Crystallography online: Bilbao crystallographic server,” Bulg. Chem. Commun 43, 183–97 (2011).
- Hatch and Stokes (2003) Dorian M Hatch and Harold T Stokes, “Invariants: program for obtaining a list of invariant polynomials of the order-parameter components associated with irreducible representations of a space group,” Journal of applied crystallography 36, 951–952 (2003).
- Cracknell et al. (1979) A. P. Cracknell, B. L. Davies, S. C. Miller, and W. F. Love, “Kronecker Product Tables. Vol. 1. General introduction and Tables of irreducible representations of space groups,” (IFI/Plenum, New York, 1979).
- Aroyo et al. (2006) Mois I. Aroyo, Asen Kirov, Cesar Capillas, J. M. Perez-Mato, and Hans Wondratschek, “Bilbao crystallographic server. ii. representations of crystallographic point groups and space groups,” Acta Crystallogr., Sect A: Found. Crystallogr. 62, 115–128 (2006).
- Reith et al. (2012a) D. Reith, C. Blaas-Schenner, and R. Podloucky, “Density functional theory study of phase stability, vibrational, and electronic properties of Mo3Al2C,” Phys. Rev. B 86, 104105 (2012a).
- Ye et al. (2019) Mai Ye, E. W. Rosenberg, I. R. Fisher, and G. Blumberg, “Lattice dynamics, crystal-field excitations, and quadrupolar fluctuations of ,” Phys. Rev. B 99, 235104 (2019).
- Mialitsin (Ph.D. thesis, Rutgers University-Graduate School-New Brunswick, 2010) Aleksej Mialitsin, “Raman scattering from layered superconductors: Effects of charge ordering, two-band superconductivity, and structural disorder,” (Ph.D. thesis, Rutgers University-Graduate School-New Brunswick, 2010).
- Cardona (1993) K. Cardona, “Resonance Phenomena,” in Light Scattering in Solids II, Vol. 50, edited by M. Cardona and G. Güntherodt (Springer-Verlag., 1993) Chap. 2, pp. 45–173.
- Reith et al. (2012b) D. Reith, C. Blaas-Schenner, and R. Podloucky, “Density functional theory study of phase stability, vibrational, and electronic properties of Mo3Al2C,” Phys. Rev. B 86, 104105 (2012b).
- (43) See Supplemental Material at [URL will be inserted by publisher] for the analysis of the -dependence of the TEM diffraction patterns and the polar domain imaging which includes Ref. Wu et al. (2024).
- Jindal et al. (2023) Apoorv Jindal, Amartyajyoti Saha, Zizhong Li, Takashi Taniguchi, Kenji Watanabe, James C. Hone, Turan Birol, Rafael M. Fernandes, Cory R. Dean, Abhay N. Pasupathy, and Daniel A. Rhodes, “Coupled ferroelectricity and superconductivity in bilayer Td-MoTe2,” Nature 613, 48–52 (2023).
- Tokura and Nagaosa (2018) Yoshinori Tokura and Naoto Nagaosa, “Nonreciprocal responses from non-centrosymmetric quantum materials,” Nature Communications 9, 3740 (2018).
- Nadeem et al. (2023) Muhammad Nadeem, Michael S. Fuhrer, and Xiaolin Wang, “The superconducting diode effect,” Nature Reviews Physics 5, 558–577 (2023).
- Yip (2014) Sungkit Yip, “Noncentrosymmetric superconductors,” Annual Review of Condensed Matter Physics 5, 15–33 (2014).
- Kallin and Berlinsky (2016) Catherine Kallin and John Berlinsky, “Chiral superconductors,” Reports on Progress in Physics 79, 054502 (2016).
- Klemens (1966) P. G. Klemens, “Anharmonic decay of optical phonons,” Phys. Rev. 148, 845–848 (1966).
- Menéndez and Cardona (1984) José Menéndez and Manuel Cardona, “Temperature dependence of the first-order Raman scattering by phonons in Si, Ge, and : Anharmonic effects,” Phys. Rev. B 29, 2051–2059 (1984).