11email: carlo.nipoti@unibo.it
Evolution of massive quiescent galaxies via envelope accretion
Abstract
Aims. Massive quiescent galaxies at high redshift are significantly more compact than their present-day counterparts. We investigate the roles, in determining this evolution, of major and minor mergers, and of the accretion of diffuse envelopes of stars and dark matter.
Methods. We model the evolution in stellar mass (), effective radius () and effective stellar velocity dispersion ( of a representative massive quiescent galaxy from to , and compare the model with the observed redshift-dependent - and - relations. In the model we account for the effects of collisionless (dry) major (satellite-to-main galaxy mass ratio ) and minor () mergers, using analytic recipes consistent with the results of -body simulations of binary mergers. For the poorly constrained mini mergers () we explore both a “standard” model (based on the same assumptions used in the case of higher- mergers), and a heuristic “envelope accretion” model, aimed at describing the case in which diffuse satellites are completely disrupted in the galaxy outskirts.
Results. Major and minor dry mergers, at rates estimated observationally from galaxy-pair counts, induce relatively small variations of and , accounting only for of the size evolution and of the velocity-dispersion evolution observed from to . As addition to major and minor dry mergers, envelope accretion performs better than standard mini mergers at reproducing the redshift-dependence of the - and - relations, being also consistent with plausible evolutionary scenarios of scaling relations involving the mass of the central supermassive black hole.
Key Words.:
Galaxies: elliptical and lenticular, cD – galaxies: evolution – galaxies: formation – galaxies: kinematics and dynamics – galaxies: structure1 Introduction
The effective radius and the central stellar velocity dispersion of present-day massive quiescent galaxies (or early-type galaxies; ETGs) correlate with the galaxy total stellar mass (Shen et al., 2003; Hyde & Bernardi, 2009). These empirical scaling relations are found to evolve with redshift at least out to : the evolution is such that, at given , quiescent galaxies at higher redshift have, on average, systematically smaller (e.g. van der Wel et al., 2014; Martorano et al., 2024) and higher (e.g. van de Sande et al., 2013; Cannarozzo et al., 2020, but see also Damjanov et al. 2022). Recent observations with the James Webb Space Telescope revealed that the size evolution of quiescent galaxies occurs also at earlier times, being possibly even stronger at redshift higher than 3 (Ito et al., 2024; Ji et al., 2024; Weibel et al., 2024; Wright et al., 2024).
The main mechanism that is believed to be responsible for this observed size and velocity-dispersion evolution is the growth of individual galaxies via dissipationless (dry) merging, which has the effect of increasing linearly or super-linearly with , while keeping constant or decreasing (Nipoti et al., 2003; Naab et al., 2009; Hilz et al., 2012, 2013).
The observed size evolution is however so strong that it is hard to explain only with dry merging (Nipoti et al., 2009b), also for merger histories with mass ratios and rates expected from cosmological simulations (Cimatti et al., 2012; Nipoti et al., 2012). Observational estimates of the galaxy merger rates based on measurements of the fraction of galaxy pairs are now available over wide redshift ranges (Conselice et al., 2022; Duan et al., 2024). For , Conselice et al. (2022), comparing their results with those of the Illustris cosmological simulation (Vogelsberger et al., 2014), find that the theoretically predicted merger rates (Rodriguez-Gomez et al., 2015) overestimate the actual merger rates, at least for mergers with mass ratio111We define the merger mass ratio as the ratio between the less massive and the more massive galaxy. , even though the corresponding theoretically predicted stellar mass accretion rate is lower than the observational estimate (see also Mundy et al., 2017). This makes even more puzzling the interpretation of the strong observed size evolution of passive galaxies.
In this paper we compare the observed evolution of the - and - relations of ETGs with the predictions of dry-merging models, using observationally motivated merger mass growth rates for major () and minor () mergers. We then explore quantitatively the role of mini mergers (), for which we have recently started to have substantial observational evidence (Suess et al., 2023). The effect of mini mergers depends on the poorly constrained properties of the involved satellites. If they are very diffuse, the cumulative effect of mini merger is expected to be an “envelope accretion”, that is the acquisition of of loosely bound stars and dark matter (DM) in the galaxy outskirts (as originally envisaged by Oser et al., 2010).
Present-day ETGs lie also on scaling laws involving the mass of their central supermassive black hole (BH) , which is found to scale linearly with (Magorrian et al., 1998) and with as a power law with index (Ferrarese & Merritt, 2000; Gebhardt et al., 2000). The evolution of these scaling relations is poorly constrained observationally, because of the difficulty of measuring BH masses in higher- ETGs. However, an indication of the masses of central BHs in high- quiescent galaxies comes from measurements of BH masses in the so-called relic galaxies (Trujillo et al., 2014), which are compact, massive present-day quiescent galaxies with old stellar populations, believed to be descendants of high- compact galaxies that evolved passively down to without merging with other galaxies (see also Hartmann et al., 2025). Relic galaxies tend to have central BHs that are “overmassive” (i.e. much more massive than expected for their stellar mass), but in line with the expectations for their high stellar velocity dispersion (e.g. Comerón et al., 2023). The hypothesis that high- ETGs host overmassive BHs seems supported by the finding that, for galaxies hosting active galactic nuclei, the ratio was higher at than today (Mezcua et al., 2024). Instead, at least with currently available observations, there is no evidence for evolution of the - correlation (Shen et al., 2015). The - and - relations and their evolution represent a complementary tool to test galaxy evolution models (Ciotti & van Albada, 2001; Nipoti et al., 2003; Ciotti et al., 2007). We will thus compare the models discussed in this work also including information on the central BH mass.
Finally, another evolutionary path of quiescent galaxies is that their central DM fraction (for instance measured within ) tend to increase as cosmic time goes on (Mendel et al., 2020; Damjanov et al., 2022; Tortora & Napolitano, 2022). Any successful model of the evolution of ETGs must account also for this trend, which we will thus take into account in our analysis.
This paper is organized as follows. In Section 2 we report the relevant observational data. In Section 3 we introduce a theoretical description of the expected effect of dry mergers on the relevant galaxy properties. The predictions for mergers with mass ratio are compared with observations in Section 4. Sections Sections 5 and 6 consider the contribution of mini mergers (). The evolution of the BH mass and DM fraction is discussed in Section 7. Section 8 concludes.
2 Observational data
Here we describe the redshift-dependent observed scaling relations that we consider in the present work, as well as the relevant observational estimates of the merger mass growth rate for massive galaxies. We limit ourselves to the redshift interval , over which the scaling laws are relatively well characterized and over which Conselice et al. (2022) provides information on the observational estimates of the major and minor merger rates.
2.1 Redshift-dependent size-stellar mass relation
We take as reference for the observed size-stellar mass relation of ETGs the work of van der Wel et al. (2014), who find that the redshift dependence of the median correlation can be written as
| (1) |
where the dimensionless redshift-dependent coefficients and are tabulated222The coefficient is called in van der Wel et al. (2014) in van der Wel et al. (2014) for . While the logarithmic slope is weakly dependent on (with ), the normalization depends strongly on as
| (2) |
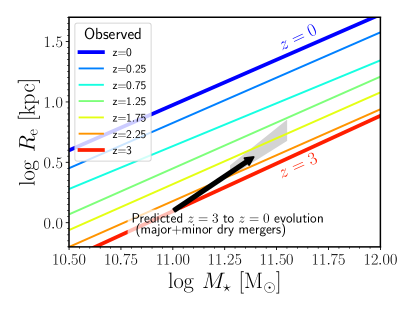
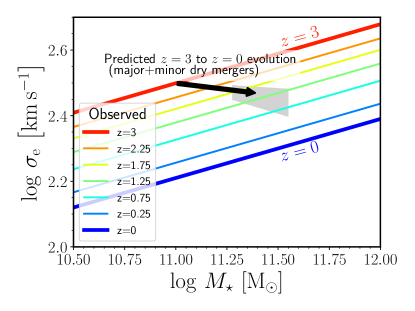
The above size-mass relation is plotted for different values of in the upper panel of Fig. 1, where the curves for and are obtained by adopting, respectively, the same values of as for and , and extrapolating from, respectively, and , using Eq. (2).
2.2 Redshift-dependent velocity-dispersion stellar mass relation
When considering the central stellar velocity dispersion , it is important to specify the aperture within which it is measured. Hereafter, we indicate with the effective velocity dispersion, that is the central velocity dispersion measured within an aperture that can be approximated by a circular aperture of radius .
We take as reference for the observed redshift-dependent - relation of ETGs the results of Cannarozzo et al. (2020), and in particular their extended-sample, constant-slope non-evolving scatter model, for which the median is given by
| (3) |
Though this fit is obtained for galaxies in the redshift range , we extrapolate it out to when plotting, in the the lower panel of Fig. 1, the median - curves for the same selection of redshifts as in the upper panel of the same figure.
2.3 Observed major- and minor-merger mass growth rates
Conselice et al. (2022) measured the galaxy pair and merger fractions as functions of redshift and mass ratio for a large sample of massive galaxies in the redshift range . Based on their merger rate estimates (which probe as minimum mass ratio ), they find that galaxies with stellar mass , from to , grow in stellar mass by a factor via major mergers () and by a factor via minor mergers (). It is worth noting that these estimates are based on a stellar-mass selection; when Conselice et al. (2022) apply instead a constant-number density selection, they find significantly lower stellar-mass growth rates for both major and minor mergers. In the spirit of maximizing the possible effect of mergers on the evolution of the scaling laws, in our analysis we will assume that, on average, from to massive ETGs increase their stellar mass by factors given by the aforementioned values of and , for major and minor mergers, respectively. It is important to stress that the contribution of mini mergers () is not included in these numbers.
3 Effect of dry mergers on and
The effects of mergers on the galactic structural and kinematic properties depend in a complex way on the internal properties of the interacting galaxies, on their mass ratio and on the characteristics of their mutual orbits (see section 8.9 of Cimatti et al., 2019).
Even limiting to the case of gas-poor spheroidal galaxies, the variations on and produced by mergers depend not only on the merger mass ratio, but also on the orbital parameters of the encounter and on the internal distribution of stars and DM of the interacting systems. However, some general physical arguments can be used to obtain approximate analytic predictions for the evolution of and in dry merging.
3.1 Analytic formulae
Under the assumption that and , where is the gravitational radius and is the virial velocity dispersion, the effect of dry mergers on and can be computed using energy conservation and the virial theorem (Nipoti et al., 2003; Naab et al., 2009; Hilz et al., 2012). In particular, in the case of parabolic orbits, under these hypotheses, for a galaxy growing with a sequence of dry mergers with mass ratio , and grow with stellar mass as, respectively,
| (4) |
and
| (5) |
with
| (6) |
and
| (7) |
(Nipoti et al., 2012), where we have assumed that the merging galaxies lie on a size-mass relation .
3.2 Range of validity of the analytic formulae for major, minor and mini mergers
There are a few works in the literature in which the evolution of the effective radius and of the central velocity dispersion in dissipationless mergers has been studied with -body simulations (Nipoti et al., 2003; Boylan-Kolchin et al., 2006; Nipoti et al., 2009a; Hilz et al., 2012; Nipoti et al., 2012; Hilz et al., 2013; Frigo & Balcells, 2017; Rantala et al., 2024). The simulations run in these works differ widely in orbital parameters, mass ratio, and internal structure of the interacting systems, and consequently also the behaviour of and shows a relatively wide variety. However, trying to make a synthesis of the results of these work, Eqs. (4-7) appear to describe sufficiently well the average effects of major mergers (Nipoti et al., 2003; Boylan-Kolchin et al., 2006; Nipoti et al., 2009a; Hilz et al., 2012) and of minor mergers (Nipoti et al. 2012; Frigo & Balcells 2017; but see Rantala et al. 2024, who find stronger size evolution when central BHs are included in the simulations). In -body simulations of equal-mass mergers the central velocity dispersion tends to increase slightly, but the deviation from the constant- prediction of Eq. (7) is typically within 15% (Nipoti et al., 2003; Boylan-Kolchin et al., 2006; Nipoti et al., 2009a; Hilz et al., 2012). Considering overall the results of the aforementioned works, we will then use Eqs. (4-7) for major and minor mergers.
The situation is much more uncertain for mini mergers (), which have been studied relatively little in the literature. As far as we know, the only systematic exploration of the effect of mini mergers on and is that of Hilz et al. (2012), who simulated dry mergers with mass ratios in which the satellite is much less dense than the main galaxy ( ; see also Hilz et al. 2013 and Rantala et al. 2024). Hilz et al. (2012) found significant deviations from the analytic predictions of Eqs. (4-7): in particular the values of found in simulations are systematically higher than those predicted by Eq. (7). Though limited to some very specific cases, the results of these numerical experiments suggest that Eqs. (4-7) do not necessarily capture the effects of mergers with very small mass ratios. Thus, in the attempt of bracketing the realistic behaviour, in the case of mini mergers we will explore two very different scenarios: “standard mini mergers” (Section 5), in which we assume that Eqs. (4-7) hold, and “envelope accretion” (Section 6), in which we assume that the satellites are very diffuse and they deposit the great majority of their stars and DM in the outskirts of the main galaxy.
4 Weak evolution driven by major and minor mergers at the observed rates
We can now compute the evolution of individual galaxies in the - and - planes, due to mergers at the observed rate (Section 2.3), and compare it with the observed evolution of the scaling relations (Sections 2.1 and 2.2). Given that both the considered scaling laws and our model of the merger driven evolution in the - and - planes are power laws, the initial stellar mass of our reference galaxy can be chosen arbitrarily in the mass range in which the scaling laws have been computed. However, to consistently use the merger mass growth rates of Conselice et al. (2022), we limit ourselves to stellar masses . We thus consider as our “initial galaxy” a model ETG that at has , and , values such that it lies on the scaling relations shown in Fig. 1. We then model its evolution assuming that its stellar mass from to grows as
| (8) |
where and are the fractional stellar mass increase factors333These factors can be to a good approximation identified with the ratios and computed by Conselice et al. (2022), because in that paper is the average mass () of the massive galaxy population in the redshift interval . over the redshift range , and the subscripts and indicate at which redshift the quantity is evaluated. It follows from the equations of Section 3 that the corresponding evolution in size and velocity dispersion is described by
| (9) |
and
| (10) |
respectively. Here and are characteristic mass ratios for major and minor mergers, respectively, and we recall that and depend also on .
For our fiducial model we assume , (Section 2.3), (the median value of the - relation logarithmic slope found by van der Wel et al. 2014; Section 2.1), and . With these parameters we obtain , and , where we have introduced the notation , to indicate the variation of a generic quantity for an individual galaxy. In Fig. 1 the black arrows indicate this predicted evolution for our fiducial galaxy in the - plane (upper panel) and - plane (lower panel), with the head of the arrow indicating the predicted position at due to major and minor mergers only. In each panel, the gray shaded area indicates the uncertainty in the position of the head of the arrow. We computed this area considering the uncertainties on and (Section 2.3), as well as those on and , which we approximately account for by allowing and to vary, respectively, in the ranges , and in the range (Section 2.1).
The result shown by the upper panel of Fig. 1 is striking: major and minor mergers at the observed rate are expected to produce a weak size evolution from to , much less than the observed evolution of the size-mass relation over the same redshift interval. Our representative model galaxy at redshift (head of the arrow in the plot) has stellar mass and effective radius , about a factor of five smaller than the average of observed ETGs of similar stellar mass. The lower panel of Fig. 1 shows that also the predicted evolution of the velocity dispersion is too weak: the of the model galaxy decreases slowly and remains as high as , about 50% higher than the of observed ETGs of similar stellar mass.
To quantify the relative contribution of major and minor mergers to the size and velocity-dispersion evolution from to , it is convenient to define the offsets
| (11) |
| (12) |
| (13) |
and
| (14) |
where and are, respectively, the observed - and - correlations (Section 2.1 and 2.2), and , and are the values of , and predicted at by a model accounting only for major and minor mergers (corresponding to the heads of the arrows in Fig. 1). Over the range , the contribution of major and minor mergers is to the size evolution and to the velocity-dispersion evolution.
5 Standard mini dry mergers
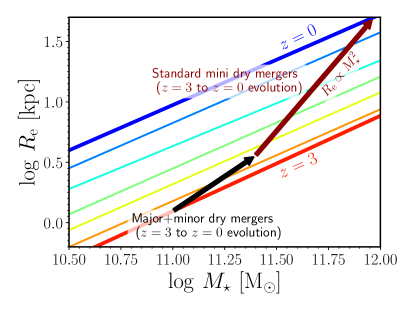
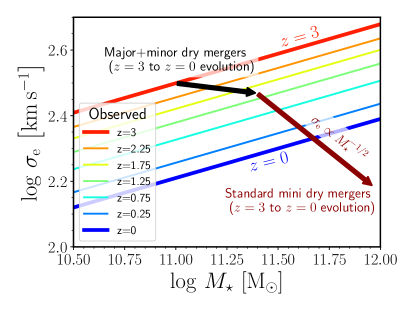
As pointed out in Section 3, the effect on and of mass growth via mini () mergers is poorly constrained. When considering growth via mini mergers we thus explore two different simple scenarios. In this section we consider standard mini mergers, while in Section 6 we consider envelope accretion. With standard mini mergers we mean parabolic dry mergers such that and , so that the formulae of Section 3 apply. Given the uncertainty on the dominant mass ratio of mini mergers and the fact that the observed evolution of the - relation is strong (Fig. 1, upper panel), to maximize the size evolution we model here mini mergers as dry mergers with vanishingly small mass ratio. In the considered hypotheses, taking the limit for of Eqs. (4) and (5) we get444In fact, this is true provided , which is however a standard assumption, generally supported by the observations. and (Naab et al., 2009). In Fig. 2 we show the evolution in the - (upper panel) and - (lower panel) planes of our representative model galaxy when, to the contribution of major and minor mergers (Section 4), we add a contribution of standard mini mergers such that our model galaxy lies on the median - relation of ETGs at . To achieve this, our model galaxy grows in stellar mass by almost a factor of 10 from to (including major, minor and mini mergers). The lower panel of Fig. 2 shows that the same model galaxy is predicted to have way too low at .
In Fig. 2 we show as example of evolution driven by standard mini mergers only the case with vanishingly small mass ratio (), which maximizes the increase of and the decrease of for given stellar mass growth. If, instead of , we assumed for our standard mini-merger model as characteristic mass ratio a more realistic finite value , we would get red arrows with shallower slope in both panels of Fig. 2. However, this would not help solve the problem of the too low predicted at , because higher stellar mass growth via mini mergers would be required to match the - relation, and thus too low values of at would be predicted even with a shallower predicted evolution in the - plane.
We recall that in Section 3 (and thus in the standard mini merger model here considered), we have assumed not only that and are proportional to the gravitational radius and virial velocity dispersion, but also that the mergers are parabolic. If the orbital energy is negative, the final velocity dispersion can be higher than in the parabolic case (Nipoti et al., 2009a; Posti et al., 2014). However, the more bound the orbits, the weaker is the size growth, so it seems unlikely that adding the effects of negative orbital energy can help produce, at the same time, the needed strong evolution in and the relatively weak evolution of , within the framework of standard mini mergers. A more promising solution is the accretion of very diffuse satellites, which we discuss in the next section.
6 Envelope accretion
We consider here the case in which in mini mergers the accreted material end up in an envelope, that is a diffuse, extended component.
6.1 A toy model for envelope accretion
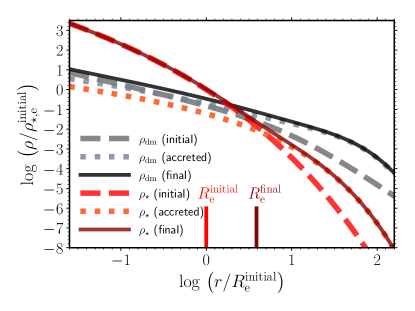
We build a toy model for envelope accretion by considering an initial galaxy model (representing a higher- quiescent galaxy) and a final galaxy model (representing its lower- descendant) obtained by simply adding to the initial galaxy model an accreted stellar component and an accreted DM component. The models, which are spherically symmetric, are computed following the approach of Nipoti et al. (2008). The initial galaxy has stellar density and DM density ; the final galaxy has stellar density and DM density , where and are, respectively, the stellar and DM accreted mass density. We now define the functional forms that we use to model , , and .
6.1.1 Stellar components
Both the initial and the accreted stellar components are described by Sérsic (1968) models. The projected density distribution follows the Sérsic law
| (15) |
where (Ciotti & Bertin, 1999). By deprojecting one obtains the corresponding intrinsic density distribution (Binney & Tremaine, 2008)
| (16) |
which we compute numerically.
6.1.2 Dark-matter components
The DM halo of the initial galaxy is described by a Navarro et al. (1996) model, with density distribution
| (17) |
where is the scale radius and .
The dark accreted component is assumed to have density distribution
| (18) |
where is the projected half-mass radius of the accreted stellar component and is a dimensionless factor such that, for given , the DM-to-stellar mass ratio of the accreted material increases for increasing .
6.1.3 Stellar mass, effective radius and central velocity dispersion
For both the initial and final galaxy models we need to compute the total mass , the effective radius and the effective stellar velocity dispersion . The total stellar mass is obtained by computing numerically the integral
| (19) |
The value of is such that , where
| (20) |
is the projected stellar mass within and is the total stellar surface density.
Assuming isotropic velocity distribution, the radial component of the velocity dispersion tensor is obtained by solving the Jeans equation
| (21) |
where is the total gravitational potential generated by the total density distribution .
For the considered isotropic systems, the line-of-sight velocity dispersion squared is (Binney & Mamon, 1982)
| (22) |
The aperture velocity dispersion within a projected radius is determined via
| (23) |
The effective stellar velocity dispersion is .
6.2 A reference case
We present here a specific example of the toy model for envelope accretion described in Section 6.1. We will take this specific example as a reference case to illustrate quantitatively possible effects of envelope accretion on the evolution of ETGs in the space of the parameters , and . For our purposes we do not need to work in physical units, but we can take as reference mass and length units, respectively, the stellar mass and the effective radius of the initial galaxy model. As it is natural, we adopt as velocity unit .
The initial galaxy model has stellar density profile given by the equations of Section 6.1.1 with effective radius , and such that . Its DM density profile is given by the equations of Section 6.1.2 with and such that , where
| (24) |
is the DM fraction within a sphere of radius . Here and are, respectively, the stellar and DM masses enclosed within a sphere of radius . For the adopted values of the parameters, the initial effective velocity dispersion is .
The accreted component has stellar density profile given by the equations of Section 6.1.1 with effective radius , and such that , and DM density profile given by Eq. (18) with .
The final galaxy model, which by construction has , has and .
Fig. 3 shows the stellar and DM density profiles of the initial galaxy model (dashed curves), the accreted components (dotted curves) and the final galaxy model (solid curves). The assumed profiles are somewhat arbitrary, but we note that the relative distribution of the initial and accreted components is qualitatively similar to those found in cosmological simulations of massive galaxies (Oser et al., 2012; Cooper et al., 2013). Though the model shown in Fig. 3 is just a specific example of accretion of an extended envelope, it nicely illustrates that this process can have the effect of producing an increase of similar to standard mini mergers with , while keeping essentially constant, as it happens in the case of major mergers. Modelling, as in Section 3, the evolution of and with with power laws and , for the model here considered (and shown in Fig. 3) we get
| (25) |
and
| (26) |
6.3 Envelope accretion and scaling laws
Here we want to study the possible evolution induced by the envelope accretion in the planes - and -. Taking the model presented in Section 6.2 as reference to quantify the effects of envelope accretion on and , for this mechanism we assume here with and with (see Eqs. 25 and 26).
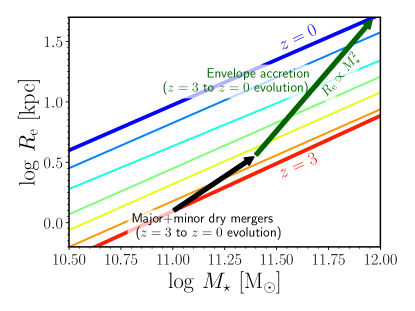
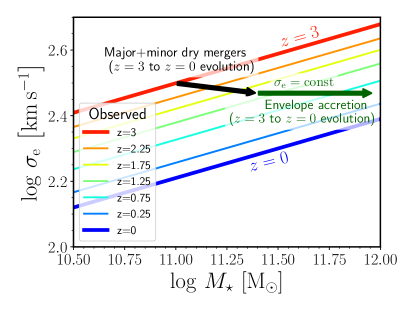
In Fig. 4 we report the result of an exercise similar to that shown in Fig. 2, but assuming that, beside major and minor mergers, the evolution of our reference ETG from to is due to envelope accretion instead of standard mini mergers. As done in Section 5 for standard mini mergers, here the assumed increase in stellar mass attributed to the envelope is such that our model galaxy lies on the median - relation of ETGs at . Comparing the bottom panel of Fig. 4 with that of Fig. 2, the substantial difference in the value of the final in the two models is apparent. The observationally expected value of lies above that predicted by the standard mini merger model and below that predicted by the envelope accretion model. We note that the deviation from the scaling relation of the envelope accretion prediction is significantly smaller than that of the standard mini mergers model, though this result should not be taken at face value, given the highly idealized nature of the considered models. Nevertheless, this exercise shows very clearly that the envelope accretion can have an important role in the evolution of ETGs and that the effect on of the accretion of small satellites (corresponding to mergers with mass ratio lower than ) could be quite different from the standard mini merger model, and needs to be better constrained observationally and theoretically.
Another feature of envelope accretion, which is evident from Fig. 3, is that the inner stellar density distribution is virtually unchanged during the process. This is particularly interesting in light of the fact that for massive ETGs (though so far only over the limited redshift range ) there is no evidence of redshift-dependence of the logarithmic slope of the stellar mass surface density profile within the inner 10 kpc ( Liu et al., submitted).
7 Evolution of black-hole mass and dark-matter fraction
We discuss here the predictions of the considered model involving envelope accretion for the evolution of properties of the dark components of quiescent galaxies, namely the mass of the central supermassive BH and the central DM fraction.
7.1 Scaling relations involving the mass of the central black hole
Little is known observationally about the mass of putative central BHs in high redshift quiescent galaxies. However, useful information in this respect comes from the study of the relic galaxies, which are believed to be rare descendants of massive compact high- ETGs that have evolved passively since . If this is indeed the case, we can assume that high- ETGs have the same as present-day relic galaxies of similar and .
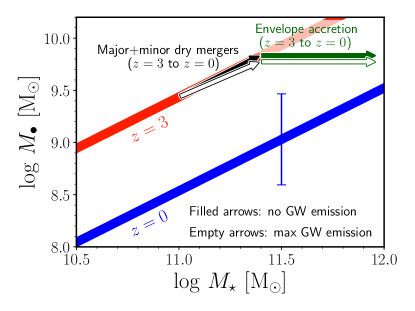
Estimates of masses of central BHs in relic galaxies are provided by Ferré-Mateu et al. (2015, 2017) and Comerón et al. (2023). They tend to have an order of magnitude higher than non-relic present-day galaxies of similar stellar mass. The best studied relic galaxy is NCG 1277, with (Comerón et al., 2023) and (Ferré-Mateu et al., 2017), for which Comerón et al. (2023) estimate . In the hypothesis that, from the structural and kinematic point of view, NCG 1277 is representative of quiescent galaxies of similar stellar mass, we thus construct plausible - and - correlations assuming that they have the same logarithmic slope as the corresponding correlations, but normalization such that NCG 1277 lies on them. These correlations are plotted in Fig. 5 together with the corresponding correlations (with their intrinsic scatter) taken from Saglia et al. (2016, considering their ’CorePowerE’ sample). These curves show strong evolution of the - relation, but negligible evolution of the - relation (within the intrinsic scatter of the observed relation).
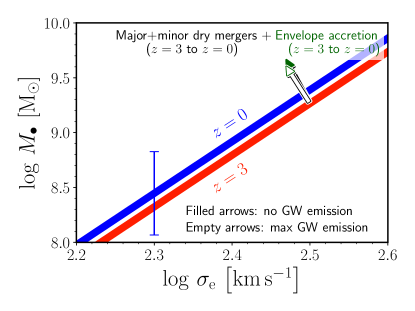
In Fig. 5 we indicate with arrows the predicted evolution from to of our representative massive ETG in the - (left panel) and - (right panel) planes, due to major and minor mergers (black arrows) and to envelope accretion (green arrows). The BH mass is such that the initial model galaxy satisfies the - and - correlations.
The model evolution in and , which is the same as in Fig. 4, is defined in Sections 4 and 6.3. The evolution of due to major and minor mergers is modelled assuming that in each merger each galaxy contains a central BH, that the ratio is the same for both galaxies, and that the two BHs coalesce forming a single BH. The mass of the BH remnant is determined by the amount of energy lost via gravitational waves (GWs), which depends on the properties of the merger (e.g. Barausse et al., 2012; Maggiore, 2018). To bracket a realistic behaviour, in Fig. 5 we consider two cases: no mass loss via GWs (filled arrows) and maximal mass loss via GWs (empty arrows). In the case of no mass loss, the BH mass of the model galaxy grows proportionally to its stellar mass: . In the case of maximal mass loss, we heuristically model the growth of the BH as a power law , with . With this choice, when the stellar mass increases by a factor of 2, the BH increase by a factor of 1.8, corresponding to 10% mass loss via GWs, which is the maximum expected in a BH-BH merger555A factor of 2 growth in stellar mass can be due to combination of mergers with different mass ratios: for instance a single merger or a sequence of ten mergers with satellites with stellar mass 1/10 of the initial . It turns out that the maximum GW-driven BH mass loss is similar in the two cases, because the maximum fractional mass loss per merger decreases for decreasing BH mass ratio (Barausse et al., 2012; Maggiore, 2018)., on the basis of numerical relativity simulations (Barausse et al., 2012). Given that our model galaxy grows by a factor via major and minor mergers, the final BH mass is lower in the maximal mass loss case than in the no mass loss case, so uncertainty on the GW-driven BH mass loss has little effects for our purposes.
The fundamental assumption of the envelope accretion scenario is that the satellites are disrupted in the galaxy outskirts: if these satellites possess central BHs, these BHs (due to long dynamical-friction timescales) are not expected to reach the galactic nucleus of the main galaxy, but to become wandering BHs. We thus assume that there is no evolution of due to envelope accretion. As a consequence, the green arrows in Fig. 5 are horizontal in the - plane (left panel), because only varies, and have zero length in the - plane (right panel), because neither nor varies (see also Section 6.3).
The comparison of the arrows with the ad curves in Fig. 5 suggests that the combination of (major and minor) dry mergers and envelope accretion is qualitatively consistent with the hypothesized evolution of the BH scaling relations. This scenario predicts a significantly weaker growth of than of and very little evolution in the - plane. Taken at face value, the results shown in Fig. 5 indicate that the model slightly overpredict at at given or at given . However, considering the high uncertainty of the high- BH scaling laws, this does not appear as a significant tension. Moreover, BH mergers might well be less efficient than assumed in our model, for instance as a consequence of ejection of BHs due anisotropic GW emission “kicks” (e.g. González et al., 2007) or three-body interactions in BH merging hierarchies (e.g. Hoffman & Loeb, 2007).
7.2 Dark-matter fraction
High- quiescent galaxies tend to have lower central DM fraction than their present-day counterparts (e.g. Mendel et al., 2020). This finding is also supported by the fact that present-day relic galaxies, for which the DM can be estimated more robustly than for high- ETGs, are very DM poor (Comerón et al., 2023). As it is usual, we define here the central DM fraction as the ratio between the DM mass and the total mass within a sphere of radius (Eq. 24). While in high- (and relic) galaxies is typically lower than (Mendel et al., 2020; Comerón et al., 2023), in normal massive present-day ETGs can be higher than (Cappellari et al., 2013).
During the evolution of an individual galaxy, the variation of can be produced by changes of the amount of DM within a region of fixed physical size, as well as by changes of . In major and minor dry mergers increases for the combined effect of the redistribution of matter and increase of . For instance, Nipoti et al. (2009a) find that the projected DM fraction within increases by up to in equal-mass mergers and up to a factor of 2 when the stellar mass doubles with multiple minor mergers. Hilz et al. (2013) and Frigo & Balcells (2017) find similar results measuring the intrinsic central DM fraction in binary major and minor merger simulations. In the envelope accretion scenario, little DM is added in the central regions, but can increase substantially because of the increase of : in other words, after the build-up of the envelope is measured over a volume including more DM dominated regions. This is apparent from Fig. 3: in the reference model shown there the central DM fraction raises from in the initial configuration to in the final configuration.
Though a quantitative comparison between the observed and predicted evolution of appears premature, qualitatively major and minor dry mergers, as well as envelope accretion, are promising processes to explain the increase of with cosmic time.
8 Conclusions
We have studied the structural and kinematic evolution of massive quiescent galaxies from to using state-of-the-art measurements of the evolution of the scaling relations and of the merger rates. Our main conclusions are the following.
-
•
Major and minor mergers (with mass ratio ) at observationally motivated rates produce, over the redshift range , size and velocity dispersion evolution significantly weaker than that measured for ETGs, accounting only for of the evolution in and of the evolution in .
-
•
The poorly constrained contribution of mini mergers (with mass ratios ) can compensate the weak evolution induced by higher- mergers, but only if these small satellites are so diffuse that they are disrupted in the galaxy outskirts, leaving the more central regions of the galaxy almost untouched. In this envelope accretion scenario, size grows fast with stellar mass (approximately as ), while remains essentially constant.
-
•
A model in which quiescent galaxies grow via envelope accretion, in addition to major and minor mergers, predicts, at given stellar mass , higher central BH mass at higher redshift. This trend is consistent with the (though not so stringent) currently available observational constraints on the evolution of the - and - relations of quiescent galaxies.
-
•
Envelope accretion and dry mergers can also explain, at least qualitatively, the finding that the central DM fraction of quiescent galaxies increases with cosmic time.
The starting point of our investigation was highlighting quantitatively the fact that major and minor dry mergers at realistic rate are grossly unable to explain the evolution of the - and the - relation. We have presented an idealized model of envelope accretion that shows that mini mergers can help fill the gap in the evolution of and , if the accreted satellites deposit the vast majority of their dark and luminous matter far from the galactic centre. This model is heuristic and does not include some well-known effects such as the so-called progenitor bias (e.g. Franx et al., 2008), which however should have a minor role for the very high-mass galaxies here considered (Fagioli et al., 2016, see also Clausen et al. 2025). Our treatment of envelope accretion is a proof of concept that can be taken as starting point for theoretical studies aimed at modelling more quantitatively the build-up of envelopes with numerical simulations. From the observational point of view it would be beneficial to improve our knowledge of the redshift-dependence of the - relation and of ( Cannarozzo et al., in prep.), of the scaling relations involving BH masses (in the spirit of Tanaka et al. 2024), and also of the rate and properties of mini mergers by studying very low-mass satellites around massive quiescent galaxies (Suess et al., 2023).
Acknowledgements
The research activities described in this paper have been co-funded by the European Union – NextGenerationEU within PRIN 2022 project n.20229YBSAN - Globular clusters in cosmological simulations and in lensed fields: from their birth to the present epoch.
References
- Barausse et al. (2012) Barausse, E., Morozova, V., & Rezzolla, L. 2012, ApJ, 758, 63
- Binney & Mamon (1982) Binney, J. & Mamon, G. A. 1982, MNRAS, 200, 361
- Binney & Tremaine (2008) Binney, J. & Tremaine, S. 2008, Galactic Dynamics: Second Edition (Princeton University Press)
- Boylan-Kolchin et al. (2006) Boylan-Kolchin, M., Ma, C.-P., & Quataert, E. 2006, MNRAS, 369, 1081
- Cannarozzo et al. (2020) Cannarozzo, C., Sonnenfeld, A., & Nipoti, C. 2020, MNRAS, 498, 1101
- Cappellari et al. (2013) Cappellari, M., Scott, N., Alatalo, K., et al. 2013, MNRAS, 432, 1709
- Cimatti et al. (2019) Cimatti, A., Fraternali, F., & Nipoti, C. 2019, Introduction to galaxy formation and evolution: from primordial gas to present-day galaxies (Cambridge University Press)
- Cimatti et al. (2012) Cimatti, A., Nipoti, C., & Cassata, P. 2012, MNRAS, 422, L62
- Ciotti & Bertin (1999) Ciotti, L. & Bertin, G. 1999, A&A, 352, 447
- Ciotti et al. (2007) Ciotti, L., Lanzoni, B., & Volonteri, M. 2007, ApJ, 658, 65
- Ciotti & van Albada (2001) Ciotti, L. & van Albada, T. S. 2001, ApJ, 552, L13
- Clausen et al. (2025) Clausen, M., Momcheva, I., Whitaker, K. E., et al. 2025, arXiv e-prints, arXiv:2501.04788
- Comerón et al. (2023) Comerón, S., Trujillo, I., Cappellari, M., et al. 2023, A&A, 675, A143
- Conselice et al. (2022) Conselice, C. J., Mundy, C. J., Ferreira, L., & Duncan, K. 2022, ApJ, 940, 168
- Cooper et al. (2013) Cooper, A. P., D’Souza, R., Kauffmann, G., et al. 2013, MNRAS, 434, 3348
- Damjanov et al. (2022) Damjanov, I., Sohn, J., Utsumi, Y., Geller, M. J., & Dell’Antonio, I. 2022, ApJ, 929, 61
- Duan et al. (2024) Duan, Q., Conselice, C. J., Li, Q., et al. 2024, arXiv e-prints, arXiv:2407.09472
- Fagioli et al. (2016) Fagioli, M., Carollo, C. M., Renzini, A., et al. 2016, ApJ, 831, 173
- Ferrarese & Merritt (2000) Ferrarese, L. & Merritt, D. 2000, ApJ, 539, L9
- Ferré-Mateu et al. (2015) Ferré-Mateu, A., Mezcua, M., Trujillo, I., Balcells, M., & van den Bosch, R. C. E. 2015, ApJ, 808, 79
- Ferré-Mateu et al. (2017) Ferré-Mateu, A., Trujillo, I., Martín-Navarro, I., et al. 2017, MNRAS, 467, 1929
- Franx et al. (2008) Franx, M., van Dokkum, P. G., Förster Schreiber, N. M., et al. 2008, ApJ, 688, 770
- Frigo & Balcells (2017) Frigo, M. & Balcells, M. 2017, MNRAS, 469, 2184
- Gebhardt et al. (2000) Gebhardt, K., Bender, R., Bower, G., et al. 2000, ApJ, 539, L13
- González et al. (2007) González, J. A., Sperhake, U., Brügmann, B., Hannam, M., & Husa, S. 2007, Phys. Rev. Lett., 98, 091101
- Hartmann et al. (2025) Hartmann, E. A., Martín-Navarro, I., Huertas-Company, M., et al. 2025, arXiv e-prints, arXiv:2501.06050
- Hilz et al. (2013) Hilz, M., Naab, T., & Ostriker, J. P. 2013, MNRAS, 429, 2924
- Hilz et al. (2012) Hilz, M., Naab, T., Ostriker, J. P., et al. 2012, MNRAS, 425, 3119
- Hoffman & Loeb (2007) Hoffman, L. & Loeb, A. 2007, MNRAS, 377, 957
- Hyde & Bernardi (2009) Hyde, J. B. & Bernardi, M. 2009, MNRAS, 394, 1978
- Ito et al. (2024) Ito, K., Valentino, F., Brammer, G., et al. 2024, ApJ, 964, 192
- Ji et al. (2024) Ji, Z., Williams, C. C., Suess, K. A., et al. 2024, arXiv e-prints, arXiv:2401.00934
- Maggiore (2018) Maggiore, M. 2018, Gravitational Waves: Volume 2: Astrophysics and Cosmology
- Magorrian et al. (1998) Magorrian, J., Tremaine, S., Richstone, D., et al. 1998, AJ, 115, 2285
- Martorano et al. (2024) Martorano, M., van der Wel, A., Baes, M., et al. 2024, arXiv e-prints, arXiv:2406.17756
- Mendel et al. (2020) Mendel, J. T., Beifiori, A., Saglia, R. P., et al. 2020, ApJ, 899, 87
- Mezcua et al. (2024) Mezcua, M., Pacucci, F., Suh, H., Siudek, M., & Natarajan, P. 2024, ApJ, 966, L30
- Mundy et al. (2017) Mundy, C. J., Conselice, C. J., Duncan, K. J., et al. 2017, MNRAS, 470, 3507
- Naab et al. (2009) Naab, T., Johansson, P. H., & Ostriker, J. P. 2009, ApJ, 699, L178
- Navarro et al. (1996) Navarro, J. F., Frenk, C. S., & White, S. D. M. 1996, ApJ, 462, 563
- Nipoti et al. (2003) Nipoti, C., Londrillo, P., & Ciotti, L. 2003, MNRAS, 342, 501
- Nipoti et al. (2009a) Nipoti, C., Treu, T., Auger, M. W., & Bolton, A. S. 2009a, ApJ, 706, L86
- Nipoti et al. (2008) Nipoti, C., Treu, T., & Bolton, A. S. 2008, MNRAS, 390, 349
- Nipoti et al. (2009b) Nipoti, C., Treu, T., & Bolton, A. S. 2009b, ApJ, 703, 1531
- Nipoti et al. (2012) Nipoti, C., Treu, T., Leauthaud, A., et al. 2012, MNRAS, 422, 1714
- Oser et al. (2012) Oser, L., Naab, T., Ostriker, J. P., & Johansson, P. H. 2012, ApJ, 744, 63
- Oser et al. (2010) Oser, L., Ostriker, J. P., Naab, T., Johansson, P. H., & Burkert, A. 2010, ApJ, 725, 2312
- Posti et al. (2014) Posti, L., Nipoti, C., Stiavelli, M., & Ciotti, L. 2014, MNRAS, 440, 610
- Rantala et al. (2024) Rantala, A., Rawlings, A., Naab, T., Thomas, J., & Johansson, P. H. 2024, MNRAS, 535, 1202
- Rodriguez-Gomez et al. (2015) Rodriguez-Gomez, V., Genel, S., Vogelsberger, M., et al. 2015, MNRAS, 449, 49
- Saglia et al. (2016) Saglia, R. P., Opitsch, M., Erwin, P., et al. 2016, ApJ, 818, 47
- Sérsic (1968) Sérsic, J. L. 1968, Atlas de Galaxias Australes (Observatorio Astronomico, Cordoba)
- Shen et al. (2003) Shen, S., Mo, H. J., White, S. D. M., et al. 2003, MNRAS, 343, 978
- Shen et al. (2015) Shen, Y., Greene, J. E., Ho, L. C., et al. 2015, ApJ, 805, 96
- Suess et al. (2023) Suess, K. A., Williams, C. C., Robertson, B., et al. 2023, ApJ, 956, L42
- Tanaka et al. (2024) Tanaka, T. S., Silverman, J. D., Ding, X., et al. 2024, arXiv e-prints, arXiv:2401.13742
- Tortora & Napolitano (2022) Tortora, C. & Napolitano, N. R. 2022, Frontiers in Astronomy and Space Sciences, 8, 197
- Trujillo et al. (2014) Trujillo, I., Ferré-Mateu, A., Balcells, M., Vazdekis, A., & Sánchez-Blázquez, P. 2014, ApJ, 780, L20
- van de Sande et al. (2013) van de Sande, J., Kriek, M., Franx, M., et al. 2013, ApJ, 771, 85
- van der Wel et al. (2014) van der Wel, A., Franx, M., van Dokkum, P. G., et al. 2014, ApJ, 788, 28
- Vogelsberger et al. (2014) Vogelsberger, M., Genel, S., Springel, V., et al. 2014, MNRAS, 444, 1518
- Weibel et al. (2024) Weibel, A., de Graaff, A., Setton, D. J., et al. 2024, arXiv e-prints, arXiv:2409.03829
- Wright et al. (2024) Wright, L., Whitaker, K. E., Weaver, J. R., et al. 2024, ApJ, 964, L10