The Mighty ToRR: A Benchmark for Table Reasoning and Robustness
Abstract
Despite its real-world significance, model performance on tabular data remains underexplored, leaving uncertainty about which model to rely on and which prompt configuration to adopt. To address this gap, we create ToRR, a benchmark for Table Reasoning and Robustness, measuring model performance and robustness on table-related tasks. The benchmark includes datasets that cover different types of table reasoning capabilities across varied domains. ToRR goes beyond model performance rankings, and is designed to reflect whether models can handle tabular data consistently and robustly, across a variety of common table representation formats. We present a leaderboard as well as comprehensive analyses of the results of leading models over ToRR. Our results reveal a striking pattern of brittle model behavior, where even strong models are unable to perform robustly on tabular data tasks. Although no specific table format leads to consistently better performance, we show that testing over multiple formats is crucial for reliably estimating model capabilities. Moreover, we show that the reliability boost from testing multiple prompts can be equivalent to adding more test examples. Overall, our findings show that reasoning over table tasks remains a significant challenge111 ToRR leaderboard at HELM222ToRR code at unitxt.
The Mighty ToRR: A Benchmark for Table Reasoning and Robustness
Shir Ashury-Tahan♠♡, Yifan Mai♣, Rajmohan C♠, Ariel Gera♠, Yotam Perlitz♠, Asaf Yehudai♠, Elron Bandel♠, Leshem Choshen♠♢, Eyal Shnarch♠, Percy Liang♣ and Michal Shmueli-Scheuer♠ ♠IBM Research, ♡Bar-Ilan University, ♣Stanford University, ♢MIT shir.ashury.tahan@ibm.com, shmueli@il.ibm.com
| Dataset | Task | Domain | Metric | Knowledge Extraction | Textual Reasoning | Numerical Reasoning |
| FinQA | Table QA | Finance | Program Accuracy | ✓ | ✓ | ✓ |
| TableBench DA | Data Analysis | Diverse | Rouge | ✓ | ✓ | ✓ |
| TableBench NR | Table QA | Diverse | Rouge | ✓ | ✓ | ✓ |
| TableBench FC | Table QA | Diverse | Rouge | ✓ | ✓ | ~ |
| WikiTQ | Table QA | Wikipedia | F1 Strings | ✓ | ✓ | ~ |
| TabFact | Fact Verification | Wikipedia | Accuracy | ✓ | ✓ | ~ |
| QTSumm | Table-to-Text QA | Wikipedia | Rouge | ✓ | ~ | ~ |
| SciGen | Table-to-Text | Science | Rouge | ~ | ~ | |
| NumericNLG | Table-to-Text | Science | Rouge | ~ | ~ | |
| TURL CTA | Classification | Wikipedia | Exact Match | ~ |
| Legend: | Required ✓ | Partially Required ~ | Not Required |
1 Introduction
Tabular data are ubiquitous across real-world use cases and tasks. Hence, the ability to understand and process tables is a crucial skill for Large Language Models (LLMs). Tabular processing capabilities can manifest in a wide range of NLP tasks, including table-to-text Moosavi et al. (2021); Suadaa et al. (2021), table question answering Pasupat and Liang (2015); Wu et al. (2024) and table fact verification Chen et al. (2020); Gu et al. (2022). In order to solve such problems, LLMs must correctly parse tabular formats, but must also apply various levels of textual and numerical reasoning over the table contents. Thus, tabular data tasks are a challenging test of LLMs’ capabilities and practical utility.

While prior work has explored LLM performance on tabular tasks (Ruan et al., 2024; Fang et al., 2024; Lu et al., 2024; Chen, 2022), existing evaluations often fail to capture the complexities of real-world applications. Specifically, they do not cover the full breadth of tabular tasks and domains, and, crucially, do not systematically assess the robustness of LLMs to variations in table formatting. Given that real-world tables appear in diverse, yet semantically equivalent, textual representations Singha et al. (2023); Sui et al. (2024); Zhao et al. (2023c); Bhandari et al. (2024), evaluating LLM capabilities across formats and examining their robustness becomes paramount.
In this work, we paint a comprehensive picture of the ability of state-of-the-art LLMs to handle downstream table understanding and table reasoning tasks. To this end, we design a pipeline for evaluating LLMs on tabular tasks, as illustrated in Figure 1, and collect datasets belonging to diverse tabular tasks, from multiple domains. Those together amount to our benchmark, ToRR, a broad coverage tabular benchmark, testing different levels of reasoning and table understanding skills. We evaluate the performance and robustness of leading LLMs on ToRR, which highlights significant gaps in model capabilities, even for industry-leading LLMs.
The focus on robustness is inherent to the design of ToRR. Our benchmark examines how models respond to differing prompt configurations – table serialization formats, as well as input perturbations. Thus, going beyond bottom-line model rankings and performance, we are able to conduct an in-depth analysis of LLM behavior on tabular tasks. Our analyses reveal a consistent and pervasive pattern of brittle model behavior, one that is exhibited across all models and datasets. Furthermore, we demonstrate that robustness measurements are pivotal for obtaining reliable estimates of expected model performance, and for choosing which LLM to use in practice. Thus, our findings illustrate that the ranking results from existing benchmarks represent an arbitrary sample of the true model task performance; in contrast, in ToRR we obtain a more complete picture of LLM capabilities.
Our main contributions are as follows:
-
1.
We present the first comprehensive benchmark333We release the leaderboard and complete model inference data, as well as the code for running the benchmark. The leaderboard can be found in ToRR leaderboard, and the code is available in ToRR code. of downstream tabular data tasks, encompassing diverse tasks and incorporating model robustness measurements.
-
2.
We reveal significant gaps for leading LLM in downstream tabular tasks capabilities.
-
3.
Our analysis demonstrates a high sensitivity of LLMs to table formats and perturbations; at the same time, no single format is associated with consistently better performance.
-
4.
We show that evaluating multiple table configurations leads to a much more reliable evaluation of model performance.
2 ToRR Construction
We reviewed numerous existing datasets for downstream tabular data tasks, prioritizing challenging ones based on the required reasoning abilities. Also, we opted for datasets where textual tables can be directly incorporated into the prompt, eliminating the need for external tools (e.g., retrieval, SQL queries, agents). Table 1 presents the selected datasets and their attributes. As can be seen, the datasets are diverse in both the target task and domain. Further details are provided in Appendix A.
For a better understanding of the skills needed to solve each dataset, we performed a qualitative analysis of the nature of the tasks. Specifically, we identify key skills ranked from easiest to hardest:
-
1.
Knowledge Extraction - Extraction of relevant information from the table, such as specific fields, relations, or entities (e.g. "What was the only year Keene won Class AA?"; WikiTQ).
-
2.
Textual Reasoning - Deducing conclusions by combining the accompanying text with the data contained in the table (e.g. "How does the number of examinees affect the pass percentage over the years?"; TableBench).
-
3.
Numerical Reasoning - Performing calculations on the table, such as aggregating information from multiple cells (e.g. "What was the percent of the growth of the Priceline group inc. from 2014 to 2015?"; FinQA).
As shown in Table 1, knowledge extraction ability is a key requirement across all datasets. The level of textual reasoning and numerical reasoning required over the tables varies across datasets and tasks. This analysis also demonstrates that our selection of datasets in ToRR covers a range of challenge levels.
2.1 Prompt Configurations
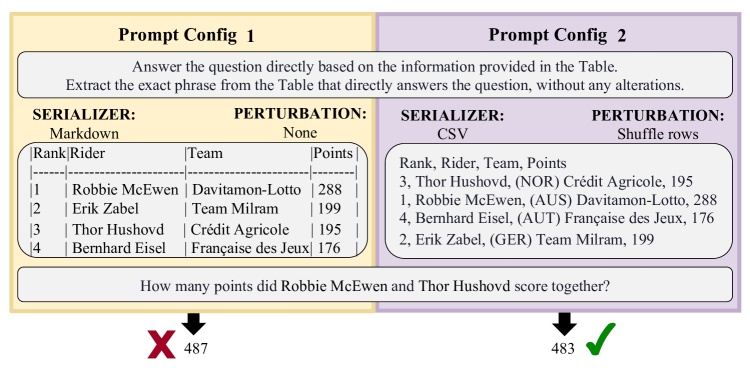
In real-world tabular tasks, the tables provided as input to an LLM can be represented in different formats; for instance, in JSON or HTML format. Although these formats encode the same content (column names, cell values etc.), LLMs may perform differently depending on the input format. Hence, to thoroughly assess a model’s ability on tabular tasks, it is important to vary not just the examined tasks, domains, and input examples, but also the structural properties of how a table is presented to the model.
To this end, we manipulate the table format across dimensions. First, for each input table, we examine serializations i.e., methods to represent the contents of the table as a string (e.g., using JSON or HTML). In addition, we explore structural perturbations which are applied to the tables; for example, shuffling the order of rows, or transposing the rows and columns. An example of the resulting prompts is shown in Figure 2. For details on all prompt configurations, see App. A.3.
2.2 Metrics
ToRR consists of datasets denoted as , and each dataset contains examples , where represents the input, and is the ground-truth response. Each input can be represented using one of prompt configurations (§2.1), denoted as .
Each dataset in ToRR is associated with a specific evaluation metric (see Table 1). All metrics fall within the range , ensuring comparability of aggregated scores across datasets. We denote the score function for an example, as defined by the dataset, as .
Model Performance The performance of a model is its ability to solve table-related tasks, regardless of the table format. Let denote the output of model for input . The performance score, , is the average across prompts and is defined as:
Model Robustness A robust model is expected to perform similarly on different prompt configurations of the same example, i.e., to have a low variance over the example performance scores. Thus, we define the robustness score, , as the complement of the average score range per example:
| Model | () | () | FinQA |
|
QTSumm | SciGen |
|
|
|
|
|
WikiTQ | ||||||||||||
| claude-3-5-sonnet | .49 | .70 | .43 | .16 | .36 | .14 | .85 | .30 | .69 | .42 | .67 | .91 | ||||||||||||
| claude-3-5-haiku | .42 | .61 | .35 | .16 | .34 | .15 | .78 | .23 | .62 | .20 | .55 | .85 | ||||||||||||
| gpt-4o | .49 | .69 | .39 | .19 | .43 | .16 | .83 | .33 | .72 | .39 | .59 | .90 | ||||||||||||
| gpt-4o-mini | .48 | .61 | .33 | .18 | .39 | .16 | .65 | .26 | .65 | .23 | .54 | .88 | ||||||||||||
| deepseek-v3 | .49 | .66 | .46 | .18 | .41 | .16 | .81 | .31 | .71 | .35 | .65 | .90 | ||||||||||||
| gemini-1.5-pro | .48 | .64 | .47 | .18 | .37 | .16 | .79 | .28 | .70 | .31 | .61 | .88 | ||||||||||||
| gemini-1.5-flash | .45 | .63 | .42 | .19 | .34 | .16 | .76 | .28 | .69 | .21 | .57 | .88 | ||||||||||||
| qwen2-72b-i | .45 | .63 | .37 | .16 | .42 | .14 | .78 | .26 | .67 | .23 | .60 | .86 | ||||||||||||
| llama-3-1-405b-i | .46 | .60 | .35 | .12 | .41 | .11 | .82 | .29 | .65 | .31 | .61 | .90 | ||||||||||||
| llama-3-1-70b-i | .44 | .58 | .36 | .12 | .41 | .10 | .72 | .29 | .63 | .26 | .59 | .90 | ||||||||||||
| llama-3-1-8b-i | .28 | .53 | .03 | .10 | .34 | .09 | .55 | .15 | .51 | .09 | .18 | .80 | ||||||||||||
| mixtral-8x22b-i | .41 | .58 | .27 | .19 | .41 | .16 | .73 | .23 | .67 | .20 | .54 | .66 | ||||||||||||
| mixtral-8x7b-i | .34 | .48 | .19 | .17 | .36 | .16 | .64 | .23 | .58 | .12 | .35 | .61 | ||||||||||||
| mistral-7b-i | .32 | .54 | .19 | .13 | .38 | .12 | .55 | .21 | .54 | .09 | .30 | .67 |
2.3 Setup
For each dataset, we sample examples from the test set. For each example, as mentioned in §2.1, we represent its table using different serializations. We also apply different structural perturbations. As the perturbations are orthogonal to the chosen serialization, this yields a total of prompt configurations ( serializations perturbations + without perturbation).
We run a total of models over ToRR. We use 5-shot prompting444Except for WikiTQ, which includes long examples that we had to truncate to one-shot to fit the context window., where each set of 5 shots is randomly sampled for each example, with greedy decoding and limit the maximum token output to . Each model was run on the same set of examples per dataset555The TableBench FC dataset consists of examples. We used examples in ToRR, with the remaining examples serving as demonstrations. prompt configurations.
We utilize the Unitxt library Bandel et al. (2024) to ensure that ToRR is shareable and reproducible, as also highlighted by Reuel et al. (2024). The modular customization of the library allowed us to manipulate the choice of table serialization and apply perturbations while keeping other aspects of prompt design (e.g., few-shot examples) constant.
3 Results & Analysis
ToRR offers multiple insights into the capabilities and performance of models on tabular tasks.
We present the high-level results of ToRR in §3.1. Next, we analyze advanced aspects of model performance in §3.2. Finally, we examine how prompt configurations affect performance (§3.3).
3.1 Model Capabilities
Table 2 showcases the main results of open and closed models on ToRR. claude-3-5-sonnet, gpt-4o and deepseek-v3 (full model names are in Appendix E.1) outperform others in most of the datasets, however models within the larger size range demonstrate similar performance. These models also have higher robustness scores, and overall, it appears that robustness scores correlate with performance scores, e.g., models with better performance tend to be more robust. Two main trends that ToRR show, are:
Even strong models struggle with tables.
The absolute scores of all models are medium-low, at best reaching (see Table 2); but also, the gap between lower-performing models and higher-performing models is narrow. This indicates that better models are only moderately better at table understanding.
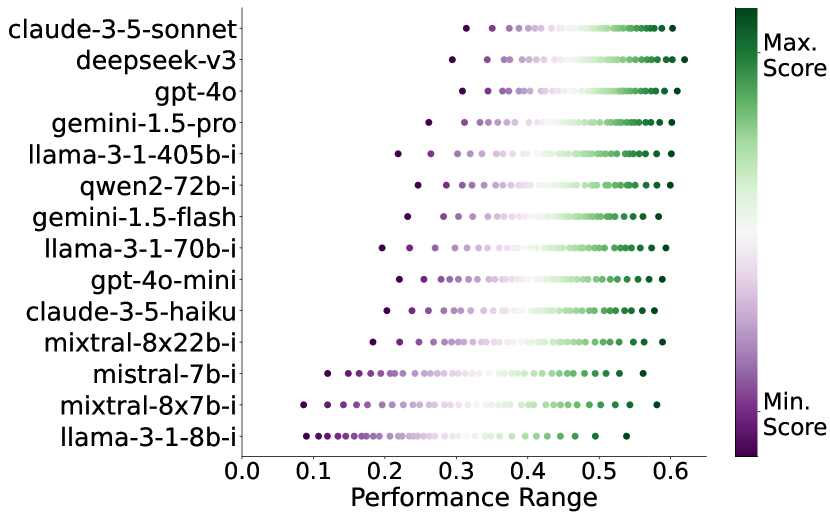
All models are not robust.
For each model and example from the selected datasets, we obtain a set of scores (§2.3) that should all reflect how well the model handles this example and hence expected to mainly agree with each other. Yet in practice, there is a substantial variance within these scores.
Figure 3 illustrates this range of scores for each model, aggregated across examples. As can be seen, the minimal score and the maximal score yield entirely different estimates of model performance. Thus, we see that the models exhibit strikingly brittle behavior, and are highly influenced by the choice of configuration.
3.2 Model Performance Trends
As can be seen in Table 2, performance within model families is directly correlated to the model size. However, the differences in scores within families tend to be relatively small, and are on average666Averaging over the differences between pairs of models within the same family.. Across model families, size does not always indicate performance; for example, qwen2-72b-instruct outperforms llama-3.1-405b-instruct in both performance and robustness.
Table 2 compares model behavior across datasets, highlighting the strengths and weaknesses of each model. For example, while claude-3-5-sonnet outperforms others in classification tasks (e.g., TabFact), mixtral-8x22b-instruct performs the worst in them. However, mixtral-8x22b-instruct shows better capabilities than claude-3-5-sonnet in Table-to-Text tasks (e.g., QTSumm).
3.3 Performance by Prompt Configuration
The notable lack of model robustness observed above raises the question of whether it results from certain configurations outperforming others.
No serializer leads to superior performance.
To evaluate whether specific serializations give rise to better model performance, we calculate the win-rate of serializers at the example level. Then, we aggregate the results for all models and serializers and find that no serializer consistently outperforms others.
When breaking down the results by model, we do find some weak effects of preferred serializations for specific models, with a maximum difference of in overall model performance across serializers. Additional details and figures can be found in Appendix C.1.
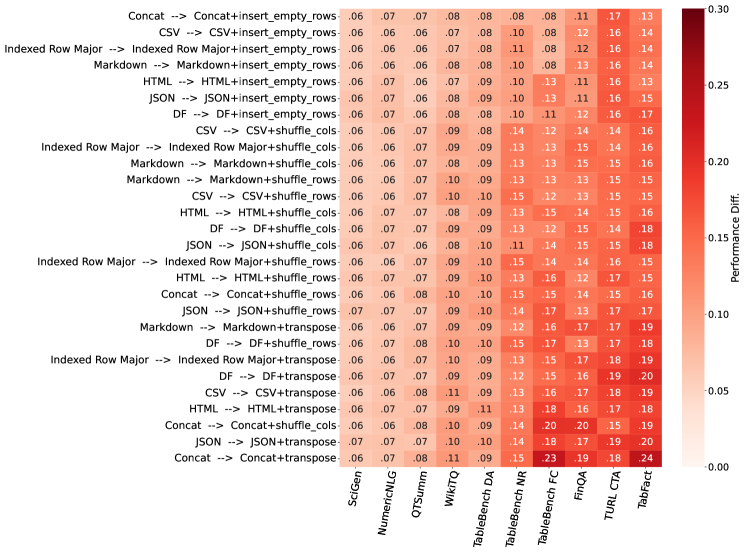
Perturbations have no consistent effect.
4 Properties of ToRR
The value of a benchmark hinges on its reliability and validity. This section assesses these properties for ToRR, specifically examining its separability and dataset agreement.
Benchmark and Dataset Separability
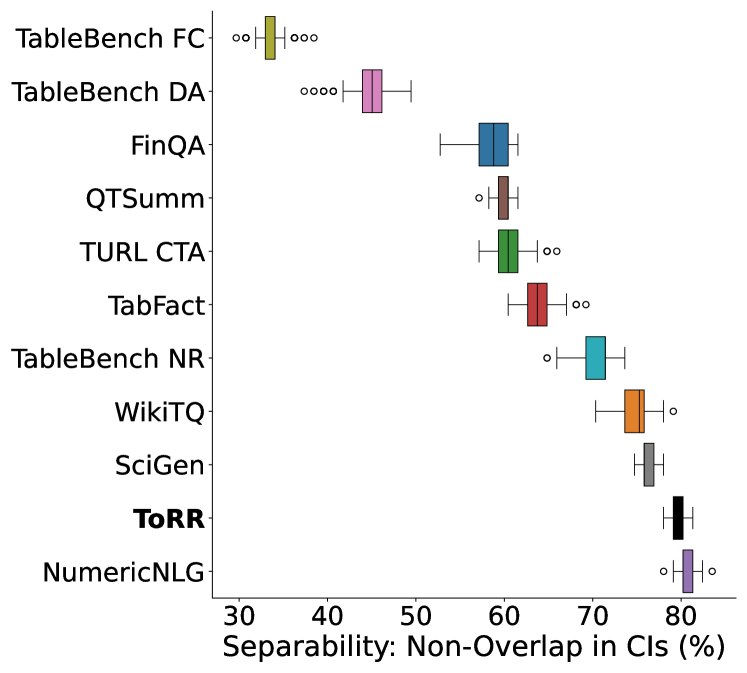
An important feature of benchmark datasets is their ability to separate models well, as emphasized by Li et al. (2024). We adopt their "Separability with Confidence" metric, and calculate for each dataset the percentage of model pairs that have non-overlapping confidence intervals of their benchmark scores777We employed bootstrapping with K randomly selected seeds to sample examples from each dataset.. The results are depicted in Figure 4 and show varied separability levels across datasets; Some datasets, such as WikiTQ, have a high separability score of over , indicating greater reliability. In contrast, others, like TableBench FC, show a lower separability score of only , reflecting less reliable model rankings. This strengthens the need for evaluating models on tables with multiple varied datasets in order to get a reliable result. Indeed, the separability score for the aggregated ToRR is significantly higher, accounting for by applying a similar calculation across all benchmark examples.
Dataset Agreements
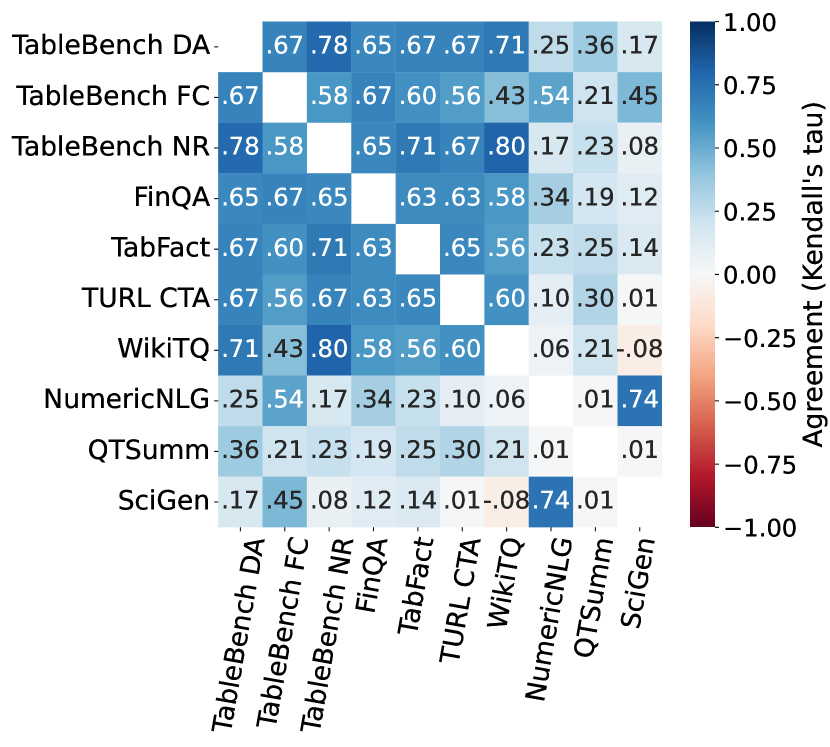
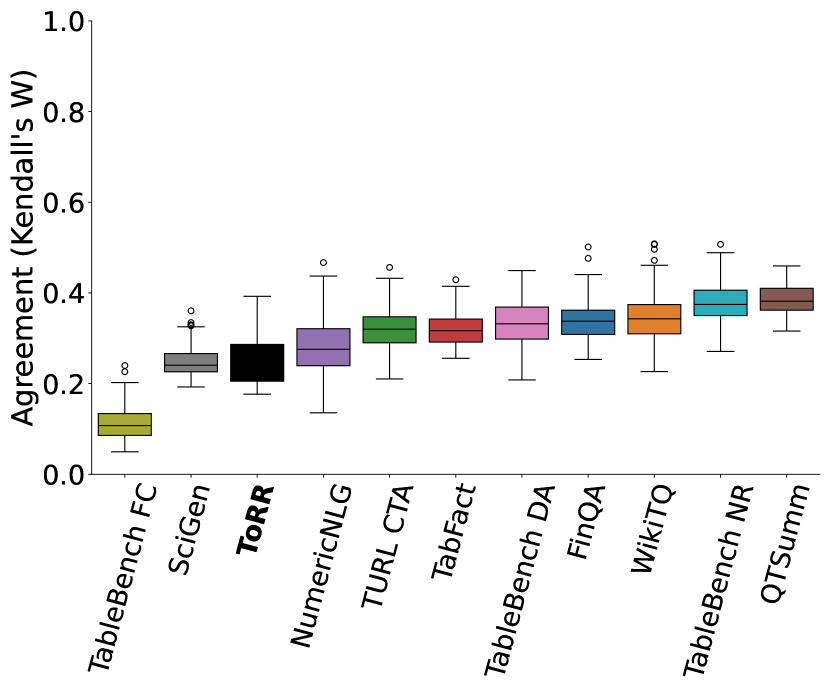
ToRR aims to cover different skills and difficulty levels of tabular tasks by including diverse datasets as described in §2. We validate that those datasets indeed measure different model skills. To this end, we calculate model rankings for each dataset using results from all configurations captured in the benchmark and measure the agreement between the rankings derived from the different datasets using Kendall’s tau.
As seen in Figure 5, most datasets tend to agree with each other on model ranking, ranging from medium to high agreement. In contrast, Table-to-Text datasets have a low agreement with others, while specifically SciGen and NumericNLG align with each other and seem to measure the same aspect as expected.
5 Implications for Reliable Evaluation
A key component in the design of ToRR is the measurement of performance across prompt configurations (§2.1); The different prompts we test differ only in table structure and hence preserve the same underlying semantics.
In terms of average model performance, the results in §3.3 show that the choice of prompt configuration does not have a consistent effect. Nevertheless, the variability introduced by prompt choice is significant for evaluations.
In the following, we ask how the variability in prompt configurations affects the evaluation itself, in terms of obtaining reliable results. Thus, here we utilize ToRR to explore broader questions about desirable evaluation practices. The choice of prompt configuration is an example of a design decision made when building a benchmark, one that can be somewhat arbitrary; such decisions determine the reliability of a benchmark, and the conclusions that can be drawn from it Perlitz et al. (2024a); Reuel et al. (2024).
Reliability can be measured via the agreement between evaluation results (model rankings) obtained when making different decisions (e.g., choosing different prompt configurations). To measure agreement between rankings we adopt Kendall’s W Kendall and Smith (1939) as a main metric. This is a measure of consensus in the rankings provided by a set of raters, in the range .
5.1 Using a Single Prompt Config is Unreliable
Existing benchmarks usually select one prompt format (for example, serialize the table using JSON). We ask to what extent this choice influences the model ranking. Thus, we calculate model rankings based on each of our prompt configurations, and test the similarity between them.
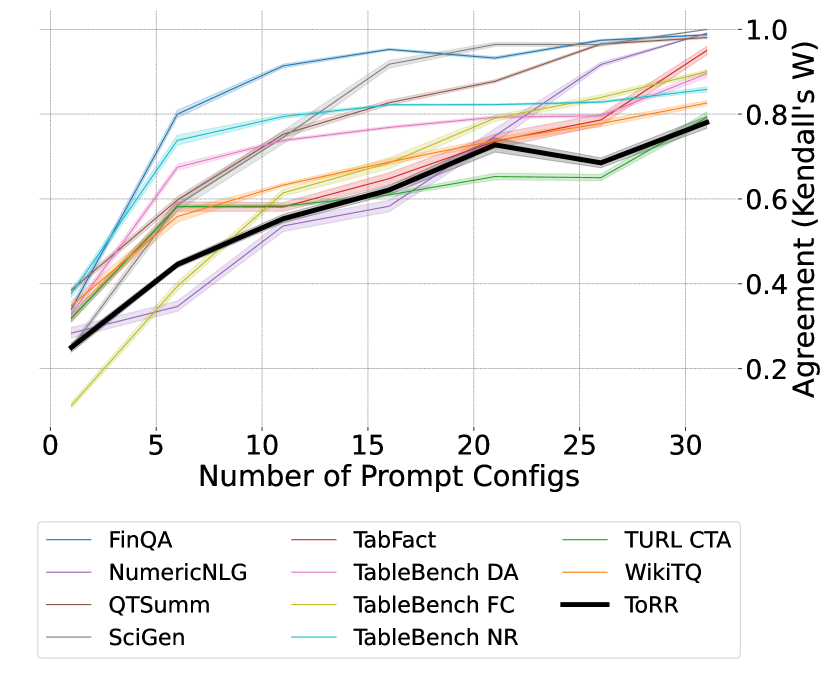
The result is depicted in Figure 6(a). The agreement scores are generally low, demonstrating that model ranking order changes dramatically based on the choice of prompt. In other words, if a benchmark uses only a single configuration, the resulting model ranking would not be reliable.
5.2 Multiple Prompt Configs Increase Reliability
Figure 6(b) depicts the effect of evaluating with multiple prompts. Unsurprisingly, we see that basing the model ranking on more prompts increases the agreement the resulting rankings have with each other. The plot also shows that even a relatively small number of prompt configurations can make a large difference and contribute to a more reliable model ranking. For example, increasing the number of prompts from to increases Kendall’s W score by more than on average.
Another observation from Figure 6(b) is that the datasets exhibit differing patterns of the increase in agreement. For example, the agreement for FinQA increases from to using prompts, while for NumericNLG it increases from to , suggesting that the former is more robust to prompt configurations than the latter. The full ToRR benchmark (black line in Fig. 6(b)) is roughly a lower bound on the prompt robustness of the model ranking across datasets.
5.3 Prompt Configs can Substitute Examples
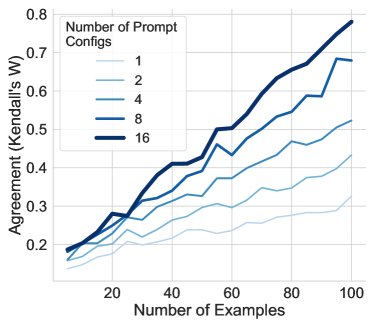
Figure 6(b) shows that more prompts can help increase reliability. A simple explanation for this is that adding more data points helps capture model behavior. A common approach for this would be to add more test instances; however, increasing the size of labeled data is not always feasible.
Thus, we also look at the relation between adding examples and adding prompts. Figure 7 depicts the ranking agreement as a function of the number of test examples, averaged over each dataset. We see that both the number of examples and the number of prompts consistently increase reliability. Strikingly, adding prompts can have an equivalent effect to enlarging the test set; for example, a ranking based on examples and prompt configurations achieves similar reliability to a ranking based on examples over a single prompt configuration.
To conclude, we have shown that measuring multiple prompt configurations provides an added dimension for accurate estimation of model performance. While we demonstrated this for table format, it may be applied in other ways as well Liang et al. (2023); Alzahrani et al. (2024); Mizrahi et al. (2024). This practice increases the reliability of benchmarking results. Moreover, it can help overcome the limitations of smaller test sets.
6 Related Work
Several recent works systematically evaluate LLMs on tabular data tasks, primarily focusing on question-answering type tasks. TableBench (Wu et al., 2024) tests LLMs over four major categories of QA tasks, namely fact-checking, numerical reasoning, data analysis, and visualization. DataBench (Grijalba et al., 2024) examines the reasoning capabilities of LLMs in a tabular context. TQA-Bench Qiu et al. (2024), a multi-table benchmark, evaluates complex question answering over relational data. TabIS Pang et al. (2024) evaluates the table information-seeking capabilities of LLMs. Zhao et al. (2023b) investigate Table-to-text capabilities in several real-world information-seeking scenarios. Compared to ToRR, these benchmarks are limited in the tasks they cover and the model capabilities they reflect.
More recently, there has been an increased focus on also analyzing the robustness of LLMs across table formats and perturbations. Singha et al. (2023) explore the impact of table representation formats and noise operations on self-supervised table structure understanding tasks. Specifically, they consider a set of simple fact-finding and transformation tasks on tables to analyze how GPT-3 model performance varies. Similarly, Sui et al. (2024) analyzes the capabilities of GPT-3.5 and GPT-4 in understanding tables by designing a specific set of table structure understanding tasks using structured data from various public datasets. Several recent works (Bhandari et al., 2024; Zhao et al., 2023c; Liu et al., 2023) explore structural variance and adversarial perturbations on tables, and their impact on Table Question Answering performance. However, existing efforts are often restricted to simple synthetic table understanding tasks or a narrow set of table QA datasets and target models, thus overlooking broader challenges posed by complex table reasoning tasks.
7 Discussion
In this work, we introduce ToRR, the first comprehensive benchmark for table reasoning and robustness. ToRR provides a crucial resource for model developers and users seeking a more realistic and nuanced understanding of how LLMs perform in real-world tabular data scenarios.
Our results over a variety of state-of-the-art LLMs reveal a consistent pattern of relatively low performance on table reasoning tasks. Furthermore, and perhaps more strikingly, we demonstrate that models exhibit extreme sensitivity to seemingly minor variations in table formatting. As we show, this sensitivity does not reflect LLM preference for particular table formats; rather, the response to format variations reflects a more general phenomenon of LLM sensitivity to prompts.
This finding resonates with a growing body of recent research demonstrating the brittleness of LLMs to variations in input formatting, even in seemingly non-structured aspects of textual inputs (Alzahrani et al., 2024). These studies, while focusing on different input modalities, converge on a similar conclusion: LLMs’ performance can be surprisingly brittle and inconsistent when faced with even minor input variations. This brittleness presents a real issue for reliably evaluating LLM performance (Mizrahi et al., 2024).
ToRR directly addresses these reliability concerns by systematically incorporating multiple prompt configurations into the evaluation protocol. Thus, ToRR offers a significant step towards mitigating the evaluation reliability issues, and provides a more reliable assessment of LLM capabilities. Moreover, utilizing multiple prompt configurations can help address the limitations of smaller test sets.
To conclude, ToRR serves as a crucial benchmark for orienting future advancements in LLM table reasoning. At the same time, it sets an example for robust evaluation methodologies that are more reflective of real-world performance. We encourage the AI community to adopt this benchmark and refine the practices it introduces when developing new benchmarks.
8 Limitations
Table Tasks
ToRR includes tasks in which input tables are directly embedded within the prompt. This may not cover all real-world scenarios where models also need to extract or search table data independently.
Selected Datasets
ToRR relies on datasets and evaluation metrics created by external sources, which may introduce biases or inconsistencies that do not fully align with the intended evaluation goals.
Consistency vs. Reliability
Our analysis relies on the assumption that consistency in model ranking is a valid indicator of reliability. However, this may not always hold, as certain biases or dataset-specific factors could influence rankings independently of true model performance Perlitz et al. (2024b).
Acknowledgments
We thank Ella Rabinovich for her valuable contributions in shaping the metrics used in this work. Her insights and feedback significantly improved the design of ToRR and strengthened the analysis presented in this paper.
References
- Alzahrani et al. (2024) Norah Alzahrani, Hisham Abdullah Alyahya, Yazeed Alnumay, Sultan Alrashed, Shaykhah Alsubaie, Yusef Almushaykeh, Faisal Mirza, Nouf Alotaibi, Nora Altwairesh, Areeb Alowisheq, M Saiful Bari, and Haidar Khan. 2024. When benchmarks are targets: Revealing the sensitivity of large language model leaderboards.
- Bandel et al. (2024) Elron Bandel, Yotam Perlitz, Elad Venezian, Roni Friedman, Ofir Arviv, Matan Orbach, Shachar Don-Yehiya, Dafna Sheinwald, Ariel Gera, Leshem Choshen, Michal Shmueli-Scheuer, and Yoav Katz. 2024. Unitxt: Flexible, shareable and reusable data preparation and evaluation for generative AI. In Proceedings of the 2024 Conference of the North American Chapter of the Association for Computational Linguistics: Human Language Technologies (Volume 3: System Demonstrations), pages 207–215, Mexico City, Mexico. Association for Computational Linguistics.
- Bhandari et al. (2024) Kushal Raj Bhandari, Sixue Xing, Soham Dan, and Jianxi Gao. 2024. On the robustness of language models for tabular question answering. arXiv preprint arXiv:2406.12719.
- Chen (2022) Wenhu Chen. 2022. Large language models are few (1)-shot table reasoners. arXiv preprint arXiv:2210.06710.
- Chen et al. (2020) Wenhu Chen, Hongmin Wang, Jianshu Chen, Yunkai Zhang, Hong Wang, Shiyang Li, Xiyou Zhou, and William Yang Wang. 2020. Tabfact: A large-scale dataset for table-based fact verification. In International Conference on Learning Representations.
- Chen et al. (2022) Zhiyu Chen, Wenhu Chen, Charese Smiley, Sameena Shah, Iana Borova, Dylan Langdon, Reema Moussa, Matt Beane, Ting-Hao Huang, Bryan Routledge, and William Yang Wang. 2022. FinQA: A dataset of numerical reasoning over financial data.
- Deng et al. (2020) Xiang Deng, Huan Sun, Alyssa Lees, You Wu, and Cong Yu. 2020. Turl: Table understanding through representation learning.
- Fang et al. (2024) Xi Fang, Weijie Xu, Fiona Anting Tan, Jiani Zhang, Ziqing Hu, Yanjun Qi, Scott Nickleach, Diego Socolinsky, Srinivasan Sengamedu, and Christos Faloutsos. 2024. Large language models on tabular data–a survey. arXiv preprint arXiv:2402.17944.
- Grijalba et al. (2024) Jorge Osés Grijalba, L Alfonso Urena Lopez, Eugenio Martínez-Cámara, and Jose Camacho-Collados. 2024. Question answering over tabular data with databench: A large-scale empirical evaluation of LLMs. In Proceedings of the 2024 Joint International Conference on Computational Linguistics, Language Resources and Evaluation (LREC-COLING 2024), pages 13471–13488.
- Gu et al. (2022) Zihui Gu, Ju Fan, Nan Tang, Preslav Nakov, Xiaoman Zhao, and Xiaoyong Du. 2022. PASTA: Table-operations aware fact verification via sentence-table cloze pre-training. In Proceedings of the 2022 Conference on Empirical Methods in Natural Language Processing, pages 4971–4983, Abu Dhabi, United Arab Emirates. Association for Computational Linguistics.
- Kendall and Smith (1939) Maurice G Kendall and B Babington Smith. 1939. The problem of m rankings. The annals of mathematical statistics, 10(3):275–287.
- Li et al. (2024) Tianle Li, Wei-Lin Chiang, Evan Frick, Lisa Dunlap, Tianhao Wu, Banghua Zhu, Joseph E. Gonzalez, and Ion Stoica. 2024. From crowdsourced data to high-quality benchmarks: Arena-hard and benchbuilder pipeline.
- Liang et al. (2023) Percy Liang, Rishi Bommasani, Tony Lee, Dimitris Tsipras, Dilara Soylu, Michihiro Yasunaga, Yian Zhang, Deepak Narayanan, Yuhuai Wu, Ananya Kumar, Benjamin Newman, Binhang Yuan, Bobby Yan, Ce Zhang, Christian Cosgrove, Christopher D. Manning, Christopher Ré, Diana Acosta-Navas, Drew A. Hudson, Eric Zelikman, Esin Durmus, Faisal Ladhak, Frieda Rong, Hongyu Ren, Huaxiu Yao, Jue Wang, Keshav Santhanam, Laurel Orr, Lucia Zheng, Mert Yuksekgonul, Mirac Suzgun, Nathan Kim, Neel Guha, Niladri Chatterji, Omar Khattab, Peter Henderson, Qian Huang, Ryan Chi, Sang Michael Xie, Shibani Santurkar, Surya Ganguli, Tatsunori Hashimoto, Thomas Icard, Tianyi Zhang, Vishrav Chaudhary, William Wang, Xuechen Li, Yifan Mai, Yuhui Zhang, and Yuta Koreeda. 2023. Holistic evaluation of language models.
- Liu et al. (2023) Tianyang Liu, Fei Wang, and Muhao Chen. 2023. Rethinking tabular data understanding with large language models. arXiv preprint arXiv:2312.16702.
- Lu et al. (2024) Weizheng Lu, Jiaming Zhang, Jing Zhang, and Yueguo Chen. 2024. Large language model for table processing: A survey. arXiv preprint arXiv:2402.05121.
- Mizrahi et al. (2024) Moran Mizrahi, Guy Kaplan, Dan Malkin, Rotem Dror, Dafna Shahaf, and Gabriel Stanovsky. 2024. State of what art? a call for multi-prompt LLM evaluation. Transactions of the Association for Computational Linguistics, 12:933–949.
- Moosavi et al. (2021) Nafise Sadat Moosavi, Andreas Rücklé, Dan Roth, and Iryna Gurevych. 2021. SciGen: a dataset for reasoning-aware text generation from scientific tables. In Thirty-fifth Conference on Neural Information Processing Systems Datasets and Benchmarks Track (Round 2).
- Pang et al. (2024) Chaoxu Pang, Yixuan Cao, Chunhao Yang, and Ping Luo. 2024. Uncovering limitations of large language models in information seeking from tables. arXiv preprint arXiv:2406.04113.
- Pasupat and Liang (2015) Panupong Pasupat and Percy Liang. 2015. Compositional semantic parsing on semi-structured tables. In Proceedings of the 53rd Annual Meeting of the Association for Computational Linguistics and the 7th International Joint Conference on Natural Language Processing (Volume 1: Long Papers), pages 1470–1480, Beijing, China. Association for Computational Linguistics.
- Perlitz et al. (2024a) Yotam Perlitz, Elron Bandel, Ariel Gera, Ofir Arviv, Liat Ein-Dor, Eyal Shnarch, Noam Slonim, Michal Shmueli-Scheuer, and Leshem Choshen. 2024a. Efficient benchmarking of language models.
- Perlitz et al. (2024b) Yotam Perlitz, Ariel Gera, Ofir Arviv, Asaf Yehudai, Elron Bandel, Eyal Shnarch, Michal Shmueli-Scheuer, and Leshem Choshen. 2024b. Do these LLM benchmarks agree? fixing benchmark evaluation with BenchBench.
- Qiu et al. (2024) Zipeng Qiu, You Peng, Guangxin He, Binhang Yuan, and Chen Wang. 2024. TQA-Bench: Evaluating LLMs for multi-table question answering with scalable context and symbolic extension. arXiv preprint arXiv:2411.19504.
- Reuel et al. (2024) Anka Reuel, Amelia Hardy, Chandler Smith, Max Lamparth, Malcolm Hardy, and Mykel J. Kochenderfer. 2024. Betterbench: Assessing ai benchmarks, uncovering issues, and establishing best practices.
- Ruan et al. (2024) Yucheng Ruan, Xiang Lan, Jingying Ma, Yizhi Dong, Kai He, and Mengling Feng. 2024. Language modeling on tabular data: A survey of foundations, techniques and evolution. arXiv preprint arXiv:2408.10548.
- Singha et al. (2023) Ananya Singha, José Cambronero, Sumit Gulwani, Vu Le, and Chris Parnin. 2023. Tabular representation, noisy operators, and impacts on table structure understanding tasks in LLMs. In NeurIPS 2023 Second Table Representation Learning Workshop.
- Suadaa et al. (2021) Lya Hulliyyatus Suadaa, Hidetaka Kamigaito, Kotaro Funakoshi, Manabu Okumura, and Hiroya Takamura. 2021. Towards table-to-text generation with numerical reasoning. In Proceedings of the 59th Annual Meeting of the Association for Computational Linguistics and the 11th International Joint Conference on Natural Language Processing (Volume 1: Long Papers), pages 1451–1465, Online. Association for Computational Linguistics.
- Sui et al. (2024) Yuan Sui, Mengyu Zhou, Mingjie Zhou, Shi Han, and Dongmei Zhang. 2024. Table meets LLM: Can large language models understand structured table data? a benchmark and empirical study. In Proceedings of the 17th ACM International Conference on Web Search and Data Mining, pages 645–654.
- Wu et al. (2024) Xianjie Wu, Jian Yang, Linzheng Chai, Ge Zhang, Jiaheng Liu, Xinrun Du, Di Liang, Daixin Shu, Xianfu Cheng, Tianzhen Sun, Guanglin Niu, Tongliang Li, and Zhoujun Li. 2024. Tablebench: A comprehensive and complex benchmark for table question answering.
- Zhao et al. (2023a) Yilun Zhao, Zhenting Qi, Linyong Nan, Boyu Mi, Yixin Liu, Weijin Zou, Simeng Han, Ruizhe Chen, Xiangru Tang, Yumo Xu, Dragomir Radev, and Arman Cohan. 2023a. Qtsumm: Query-focused summarization over tabular data.
- Zhao et al. (2023b) Yilun Zhao, Haowei Zhang, Shengyun Si, Linyong Nan, Xiangru Tang, and Arman Cohan. 2023b. Investigating table-to-text generation capabilities of LLMs in real-world information seeking scenarios. arXiv preprint arXiv:2305.14987.
- Zhao et al. (2023c) Yilun Zhao, Chen Zhao, Linyong Nan, Zhenting Qi, Wenlin Zhang, Xiangru Tang, Boyu Mi, and Dragomir Radev. 2023c. Robut: A systematic study of table QA robustness against human-annotated adversarial perturbations. arXiv preprint arXiv:2306.14321.
Appendix A ToRR Benchmark
In this section, we provide more details about the benchmark and the decisions made as part of its development.
A.1 Overview of Datasets in ToRR
-
1.
FinQA (Chen et al., 2022) – An expert-annotated question answering (QA) dataset designed to tackle numerical reasoning in real-world financial data. FinQA contains questions that require models to perform complex operations, such as multi-step calculations and logical reasoning over financial reports containing both text and table.
-
2.
TableBench (Wu et al., 2024) – A dataset designed to evaluate a model’s table question answering capabilities across various tasks. It includes 18 distinct sub-tasks grouped into four major categories: Fact Verification (FV), Numerical Reasoning (NR), Data Analysis (DA), and visualizations.
-
3.
WikiTableQuestions (Pasupat and Liang, 2015) – A dataset designed for question answering over tables sourced from Wikipedia. It often requires reasoning over table data, including operations like aggregation, comparisons, and filtering, to derive accurate answers.
-
4.
TabFact (Chen et al., 2020) – A large dataset focused on fact verification using tables, containing Wikipedia tables paired with human-annotated statements. The task is to determine whether a given statement is supported, refuted, or unverifiable based on the information in the table often requiring logical and numerical reasoning over table data.
-
5.
QTSumm (Zhao et al., 2023a) - A summarization dataset focused on query-based summarization, where summaries are generated based on specific user queries to retrieve relevant information from a table.
-
6.
Scigen (Moosavi et al., 2021) - A dataset designed for reasoning-aware data-to-text generation, featuring tables from scientific articles along with their corresponding descriptions.
-
7.
Numeric nlg (Suadaa et al., 2021) - A dataset for table-to-text generation that pairs tables with their corresponding descriptions from scientific papers, with a focus on numerical-reasoning texts.
-
8.
TURL (Table Understanding through Representation Learning) (Deng et al., 2020) – The TURL Column Type Annotation (CTA) dataset, derived from Wikipedia tables, supports semantic type assignment to table columns from a given list of Freebase types. It tests models’ ability to understand the meaning of table columns in context.
A.2 Evaluation metrics
We evaluated each of the datasets using the same metrics as reported in the original papers, with some exceptions: (1) For WikiTableQuestions, while the original paper focuses on exact-match for scoring the prediction, we assessed models using F1 score888We tokenized both the reference and predicted tokens, where true positives are determined by the intersection of these token sets, false positives are the tokens present in the reference set but absent from the predicted set, and false negatives are the tokens in the predicted set that are missing from the reference set., to provide a better normalization of model performance. (2) In the case of FinQA, we calculated both execution accuracy and program accuracy, but used the latter as the main metric since execution accuracy tends to overestimate the performance. (3) As for Scigen, since the base paper states that none of the evaluated metrics align with human judgment, we adopted the primary metric of NumericNLG, as they correspond to the exact same task.
| Format | Example Representation |
| HTML |
<table><thead>
<tr><th>Name</th><th>Age</th><th>Sex</th></tr> </thead><tbody> <tr><td>Sophia</td><td>26</td><td>F</td></tr> <tr><td>Aarav</td><td>34</td><td>M</td></tr> <tr><td>Oliver</td><td>30</td><td>M</td></tr> </tbody> </table> |
| CSV |
Name, Age, Sex
Sophia, 26, F Aarav, 34, M Oliver, 30, M |
| JSON | {‘‘0": {‘‘Name": ‘‘Sophia", ‘‘Age": ‘‘26", ‘‘Sex": ‘‘F"}, ‘‘1": {‘‘Name": ‘‘Aarav", ‘‘Age": ‘‘34", ‘‘Sex": ‘‘M"}, ‘‘2": {‘‘Name": ‘‘Oliver", ‘‘Age": ‘‘30", ‘‘Sex": ‘‘M"}} |
| Markdown |
|Name|Age|Sex|
|---|---|---| |Sophia|26|F| |Aarav|34|M| |Oliver|30|M| |
| Indexed Row Major | col : Name | Age | Sex row 1 : Sophia | 26 | F row 2 : Aarav | 34 | M row 3 : Oliver | 30 | M |
| DataFrame | pd.DataFrame({‘‘Name": [‘‘Sophia", ‘‘Aarav", ‘‘Oliver"], ‘‘Age": [26, 34, 30], ‘‘Sex": [‘‘F", ‘‘M", ‘‘M"]}, index=[0, 1, 2]) |
| Concatenation | Name Age Sex Sophia 26 F Aarav 34 M Oliver 30 M |
| Perturbation | Example Transformation |
| Row Swapping |
Name, Age, Sex
Aarav, 34, M Oliver, 30, M Sophia, 26, F |
| Column Swapping |
Age, Name, Sex
26, Sophia, F 34, Aarav, M 30, Oliver, M |
| Transpose |
, 0, 1, 2
Name, Sophia, Aarav, Oliver Age, 26, 34, 30 Sex, F, M, M |
| Add Empty Rows |
Name, Age, Sex
, , Sophia, 26, F , , Aarav, 34, M Oliver, 30, M |
A.3 Prompt Configurations
A.3.1 Serializations
As tables can be presented in various formats during pre-training, models may have biases in how they interpret them as demonstrated by Sui et al. (2024). Several standard methods exist for converting structured data into text formats that can be embedded in a prompt. We select seven of the most commonly used serializations: HTML, CSV, JSON, Markdown, Indexed Row Major, Data Frame and Concatenation. An example representation of each serialization format is provided in Table 3.
A.3.2 Structural Perturbations
These perturbations present a slightly different structure of the table from the original one, without any change to the content or relations between the table cells. Since the information is preserved but presented in a different form, there should be no significant change in the model performance ideally. The perturbations considered are as follows:
-
•
Row Swapping: The process of exchanging the positions of rows within a table.
-
•
Column Swapping: The act of changing the positions of columns in a table.
-
•
Transpose: The action of switching the rows and columns of a standard table, transforming rows into columns and vice versa.
-
•
Add Empty Rows: An addition of some empty rows to the table.
Refer to Table 4 for an example of these structural perturbations with CSV as a base serializer.
A.4 Challenges
Building a robust benchmark for table reasoning like ToRR presented several challenges, particularly related to dataset quality and evaluation consistency.
Saturated Data.
Many existing table datasets are derived from the same sources, particularly Wikipedia tables, which large language models have likely seen during pre-training. As a result, these datasets may be less challenging, as models can rely on memorization rather than genuine reasoning.
Evaluation Rigor.
The evaluation metrics used in prior work do not always accurately reflect model performance. Several studies indicate that automatic metrics often fail to align with human evaluations, leading to misleading conclusions about model capabilities. This inconsistency makes it difficult to assess true reasoning ability and robustness.
Unreliable Data.
Some datasets rely on automatically aggregated structured data, which can introduce inconsistencies and errors. For instance, a dataset with high potential for benchmarking included web tables, but the extracted table HTML was broken at times, making it unreliable for structured reasoning tasks as such issues can compromise the integrity of the benchmark.
Appendix B Performance Analysis
This part of the paper presents additional analyses and graphs illustrating model performance.
B.1 Model Performance across Datasets
Figure 8 compares the performance of all models across each dataset in the benchmark. In general, performance tends to be lower on more challenging datasets- FinQA, TableBench Numerical Reasoning, TableBench Data Analysis as well as Table2Text ones. On the other hand, performance scores are relatively higher on question answering and fact-checking datasets including WikiTQ, TabFact and others.
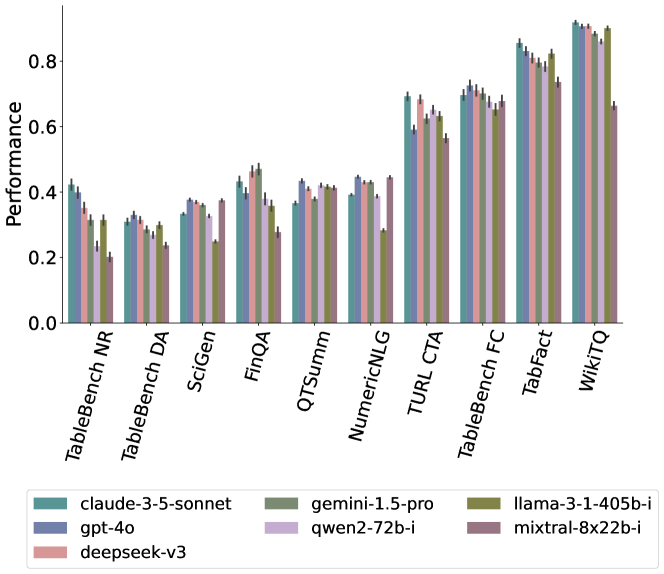
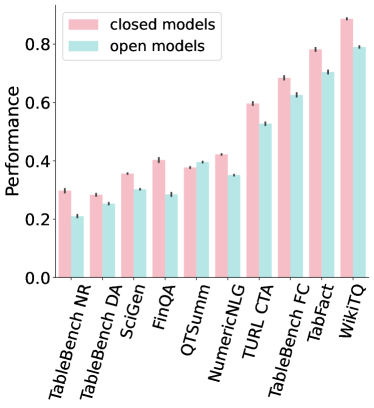
B.2 Open vs. Closed models
Figure 9 presents the performance comparison between open-weight and closed-weight models across all the benchmark datasets. As can be seen, closed-weight proprietary models considerably outperform open models across most benchmark datasets.
Appendix C Robustness Analysis
In this section, we present additional analyses of the key components of prompt configurations: serializers and structural perturbations.
We provide both performance scores and win rate graphs. All scores are calculated in a manner similar to that described in 2.2. Win rate calculations were performed at the example level: for each model’s score on an example, we counted the number of times it was higher than the others, and then normalized it by the total number of wins over this example. For example, given the following scores of serializers across an example: , the counting vector will be , and the normalized win rate scores will be .
C.1 Serializers Impact
Here, we provide more in-depth analysis of trends concerning serializers. We approach this in steps: starting with the lowest level of aggregation for each model-dataset pair, we then move to model-oriented and dataset-oriented aggregations, and finally conclude with an overall aggregation of the serialization results.
| FinQA |
|
QTSumm | SciGen |
|
|
|
|
|
WikiTQ | |||||||||||||
| claude-3-5-haiku | .04 | .01 | .01 | .01 | .02 | .06 | .02 | .07 | .11 | .05 | ||||||||||||
| claude-3-5-sonnet | .02 | .01 | .01 | .00 | .02 | .03 | .01 | .08 | .07 | .02 | ||||||||||||
| deepseek-v3 | .04 | .02 | .01 | .00 | .02 | .06 | .02 | .03 | .04 | .04 | ||||||||||||
| gemini-1.5-flash | .03 | .01 | .10 | .00 | .02 | .08 | .01 | .04 | .06 | .03 | ||||||||||||
| gemini-1.5-pro | .04 | .01 | .03 | .01 | .04 | .05 | .01 | .04 | .05 | .05 | ||||||||||||
| gpt-4o | .05 | .00 | .01 | .00 | .04 | .04 | .01 | .04 | .05 | .03 | ||||||||||||
| gpt-4o-mini | .06 | .01 | .01 | .01 | .03 | .09 | .01 | .05 | .06 | .03 | ||||||||||||
| llama-3-1-405b-i | .04 | .07 | .02 | .06 | .04 | .04 | .05 | .23 | .06 | .03 | ||||||||||||
| llama-3-1-70b-i | .02 | .07 | .01 | .03 | .04 | .06 | .04 | .20 | .04 | .04 | ||||||||||||
| llama-3-1-8b-i | .03 | .01 | .02 | .01 | .17 | .07 | .07 | .22 | .07 | .02 | ||||||||||||
| mistral-7b-i | .06 | .04 | .02 | .04 | .03 | .08 | .01 | .14 | .04 | .04 | ||||||||||||
| mixtral-8x22b-i | .04 | .01 | .02 | .01 | .02 | .04 | .01 | .09 | .06 | .06 | ||||||||||||
| mixtral-8x7b-i | .05 | .03 | .03 | .02 | .16 | .06 | .02 | .11 | .03 | .09 | ||||||||||||
| qwen2-72b-i | .06 | .07 | .01 | .05 | .02 | .03 | .01 | .06 | .03 | .02 |
C.1.1 Model-Dataset Score Variability
To measure the extent of variability with respect to serializers, we calculated the score for each model-dataset pair across all serializers and computed the difference between the highest and lowest scores. The result is shown in Table 5. While on average the drop in score is about , there are some exceptional cases were it can be much worst, e.g. llama-3-1-8b-i has a drop in score of over TableBench FC.
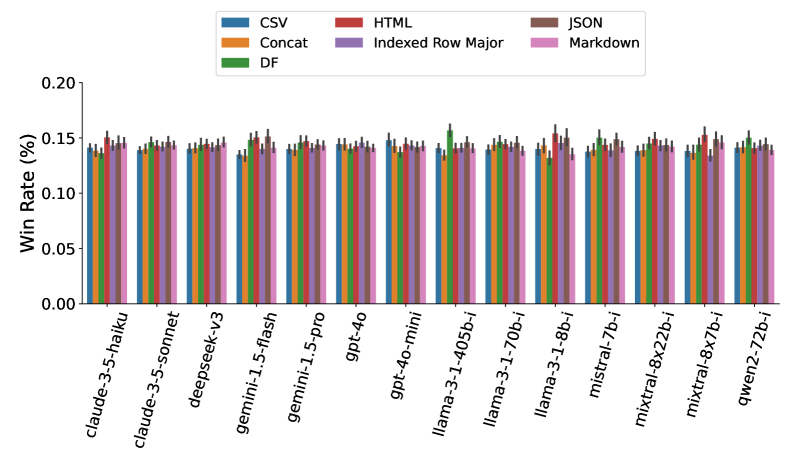
C.1.2 Serializer Preference across Models
To identify trends related to models, we aggregate the results across models, as illustrated in Figure 10. This figure shows the serializer preferences of all models within our benchmark, indicating that different models exhibit varying preferences, with no single serializer consistently ranking highest across all models. Overall, since preferences are highly model-dependent, selecting the most suitable serializer may require case-by-case tuning.
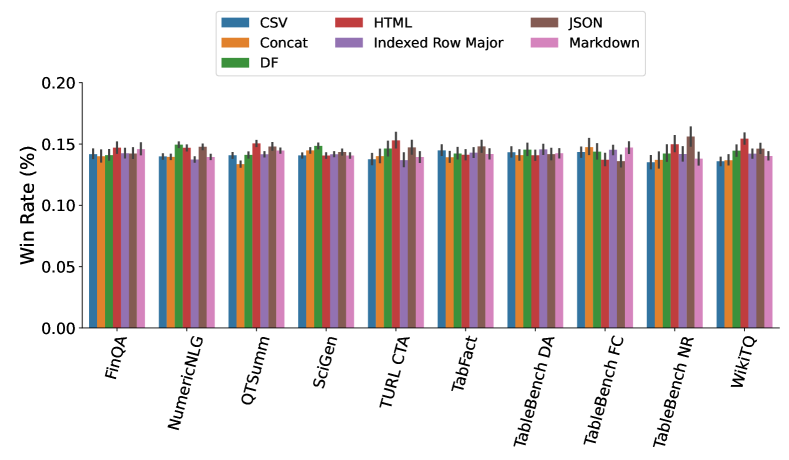
C.1.3 Serializer Preference across Datasets
We explored signals indicating which serializers perform better for different tasks and datasets, as shown in Figure 11. The results show that no single serializer consistently outperforms others across all datasets. In some cases, the ranking differences among serializers is marginal, while in others, a clear performance gap emerges. This emphasizes the need for dataset-specific evaluation rather than a one-size-fits-all approach.
C.1.4 Overall Serializer Preferences
The results presented above show a lack of consistency in preferences. Unsurprisingly, aggregating all the results across models and datasets demonstrates that no serializer consistently outperforms others.
C.2 Perturbations Impact
Here, we present a more detailed analysis of trends associated with the structural perturbations in ToRR. We begin with the low-level aggregations of the differences between scores with and without perturbations, and then we aggregate the overall results.
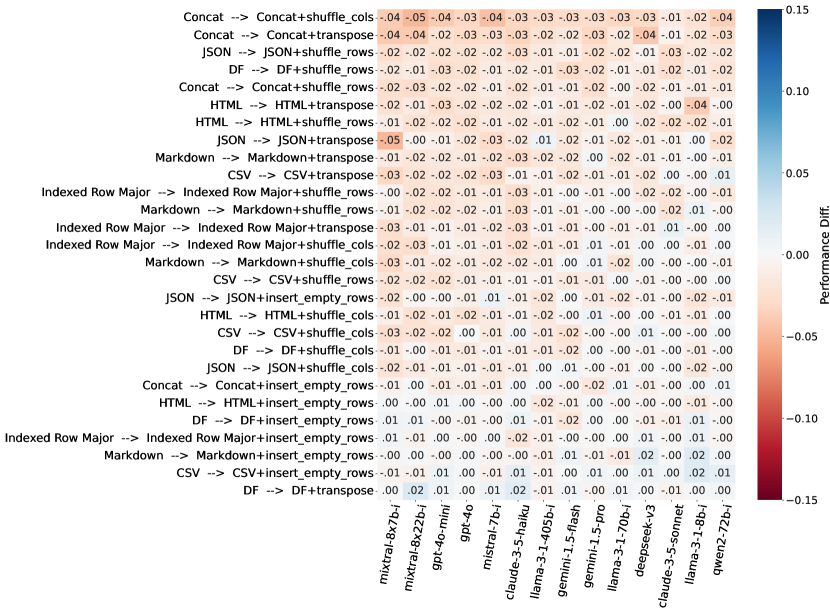
C.2.1 Perturbations Impact
To gain deep insights into the impact of perturbations on performance, we analyzed the score differences introduced by each perturbation across benchmark models. We established a baseline using prompts with a specific serializer and no perturbations, and then measured the score deviations caused by each perturbation in comparison to this baseline.
The result, depicted in Figure 12, reflects small yet inconsistent variability in model scores. Models exhibit an average difference of in overall performance.
C.2.2 Granular Look: Absolute Perturbations Impact
While some perturbations exhibit a strong positive or negative impact on certain examples, their effects vary inconsistently across all datasets and models. A simple average, as we see in Figure 12, can be misleading as effects may cancel out. Here we report Mean Absolute Impact, which quantifies the overall effect using absolute score changes (). Let us denote the number of examples, and the difference between observed and expected scores of perturbation with respect to its baseline. The Mean Absolute Impact is defined as:
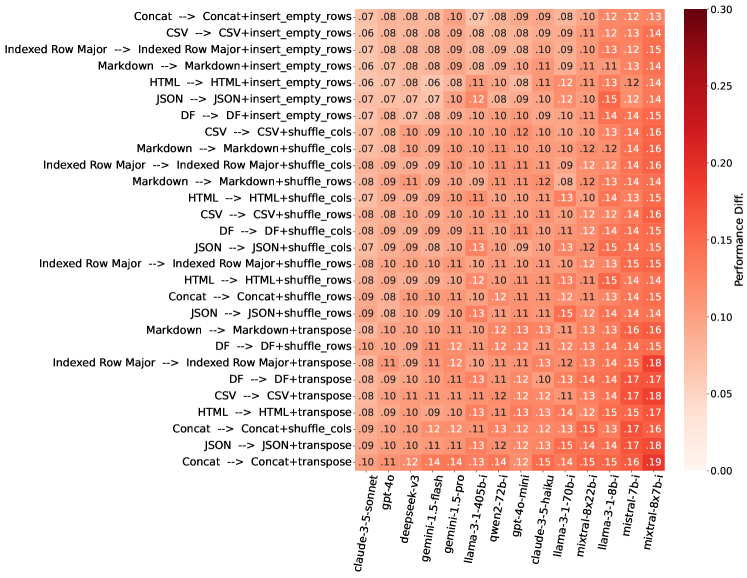
Figure 13 shows the Mean Absolute Impact on performance scores due to different perturbations for each benchmark dataset, averaged across all models. The impact is higher for Table QA and Fact-checking datasets and lower for Table-to-Text datasets. Similarly Figure 14 displays the Mean Absolute Impact on performance scores for each model, averaged across all benchmark datasets. The impact of perturbations is more pronounced in smaller models compared to larger models in general. Overall, it seems that both datasets and models are key factors that influence robustness.
C.2.3 Overall Perturbations Effect
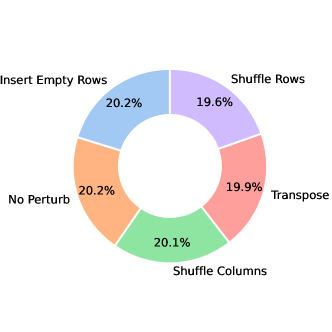
Figure 15 presents the win-rate of structural perturbations, representing the percentage of times a perturbation outperforms all others aggregated across the benchmark. The win rate results are nearly identical across all perturbations, indicating that no single perturbation consistently leads to under-performance or out-performance of models when aggregated across the benchmark datasets and models.
Appendix D Additional Properties of ToRR
Another perspective on benchmark variability can be gained by examining it at the example level. We present two analysis that relate to example difficulty and can serve for indicating better on this variability in ToRR.
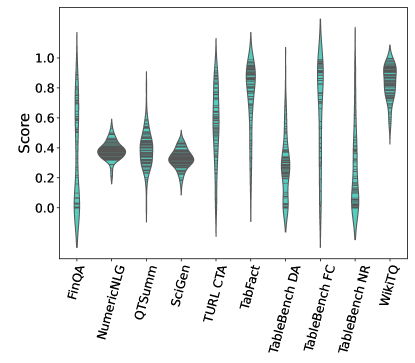
D.1 Score Distribution in ToRR
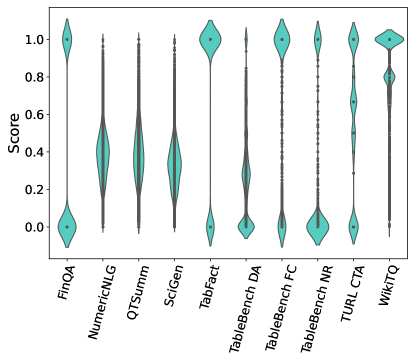
To gain insight into the difficulty of each dataset, we analyze the scores achieved by the models across different prompt configurations, focusing on the score distribution. The distribution patterns show notable differences, even when datasets were evaluated with the same metric, as shown in Figure 16. For example, datasets like TableBench, Numeric NLG, and QTSumm, which all use ROUGE, exhibited distinct score patterns. This suggests that the dataset itself has a strong and varied impact on model performance.
D.2 Example Difficulty in ToRR
We also analyze the difficulty of examples within our benchmark by computing the mean score for each example across all models and prompt configurations. We then examine the distribution of these aggregated mean scores across datasets, as illustrated in Figure 17. The figure indicates that our benchmark encompasses both easy and challenging examples, with the majority falling within a medium difficulty range.
Appendix E Full Names
E.1 Model Names
| Full Model Name | Short Name |
| qwen2-72b-instruct | qwen2-72b-i |
| mixtral-8x22b-instruct-v0.1 | mixtral-8x22b-i |
| mixtral-8x7b-instruct-v0.1 | mixtral-8x7b-i |
| mistral-7b-instruct-v0.3 | mistral-7b-i |
| llama-3-1-70b-instruct | llama-3-1-70b-i |
| llama-3.1-70b-instruct | llama-3-1-70b-i |
| llama-3.1-405b-instruct | llama-3-1-405b-i |
| llama-3.1-8b-instruct | llama-3-1-8b-i |
| gpt-4o-mini-2024-07-18 | gpt-4o-mini |
| gpt-4o-2024-11-20 | gpt-4o |
| gemini-1.5-flash-002 | gemini-1.5-flash |
| gemini-1.5-pro-002 | gemini-1.5-pro |
| claude-3-5-sonnet-20241022 | claude-3-5-sonnet |
| claude-3-5-haiku-20241022 | claude-3-5-haiku |
E.2 Dataset Names
| Full Dataset Name | Short Name |
| TURL - Column Type Annotation | TURL CTA |
| TableBench - Data Analysis | TableBench DA |
| TableBench - Numerical Reasoning | TableBench NR |
| TableBench - Fact Verification | TableBench FC |
Appendix F Prompt Example