2064 global population crisis scenario predicted by the most general dynamic model
Abstract
There is currently no consensus on how the global population will evolve in the next decades and in the next century [1]. The reason for this uncertainty is the absence of reliable population dynamic models. A recent study has shown, by gathering all the global population growth data available since the start of the Holocene to date, that the global population trend vs time in various epochs is mathematically described by four types of different functions [2]. Currently, none of the known mathematical population-dynamic models can reproduce all these four types of functions as its solutions. This is of course a great impediment on the way towards forecasting trends in global population growth, which is an ever more urgent exercise in an era dominated by substantial climate and ecological threats. In this paper, we remedy to this situation by reporting on a population dynamic model, a single nonlinear differential equation adapted from the physics of disordered systems [3], which is able to mathematically describe all the various regimes encountered in the global population recorded as a function of time, over the past 12000 years until now. Regimes of simple exponential growth (Malthus), logistic (Verhulst) plateaus as well as stretched-exponential and compressed-exponential growth regimes are all reliably described by this mathematical equation in its various limits. Besides showing that this is, indeed, the most general population dynamic model, we use it to explore its solutions projected into the future. In particular, two different scenarios are predicted. In one of them, which assumes that the future evolution would continue along a similar pattern as the past decades (hence without any major global ecological crisis affecting the resource exploitation), a von Foerster-type doomsday scenario with a sudden rise of the global population to unsustainable levels could appear as early as 2078. In the opposite scenario, if a global ecological crisis were to set in today, affecting the ability to exploit resources, given the current estimates of the Earth’s carrying capacity, the global population is forecasted to reduce by half by 2064. Furthermore, the proposed dynamic model provides with a new aggregated parameter (, in the model) that can be monitored and controlled so as to avoid the doomsday scenarios.
The first modern attempt to mathematically describe the time evolution of biological populations goes back to Malthus, who identified two central facts which regulate the growth of a population based on the number of its individual elements. The first is that each new element is generated by a sexual or asexual process (birth), and the second is that each element ceases to be a member of the population (death). Of course there are many complex factors which determine the population-averaged birth and death rates, but assuming a closed population (with no inward or outward fluxes) nothing forbids one to define an average birth rate per element per unit time and an average death rate per element per unit time. This leads to the following equation for the rate of change of the number of elements in the population, , originally proposed by Malthus in 1798 [4]:
| (1) |
where and are the birth rate per element per unit time and the death rate per element per unit time, respectively, and is known as the productivity of the individual element. If both and are constants, so is also , and the solution to Eq. (1) is an exponential growth if or an exponential decrease if . In demography, the exponential growth (Malthusian) scenario has often been used to advocate population-control public policies in order to avert a potential doomsday due to overpopulation outrunning food supply (the latter growing arithmetically and not exponentially). The Malthusian or neo-Malthusian perspective has remained popular until our time, with many prominent modern thinkers, including e.g. C. Lévi-Strauss [5], adhering to its world view. However, short after Malthus’ influential essay, it became clear that assuming a constant is too strong an assumption, because a population will have a natural tendency to self-regulate its growth based on available resources. This led Verhulst [6] to hypothesise that is a decreasing function of , and in particular to assume a linear decrease: , where is a constant and is the carrying capacity of the environment, or the maximum population that the environment can sustain. With this correction in Eq.(1), the unbounded exponential growth is replaced by a limited growth, which ends with a plateau or stable equilibrium, for . This is the famous logistic growth curve with its typical sigmoidal shape, which has been used many times to fit empirical data on animal populations in ecology or bacterial colonies in petri dishes [7, 8].
Taking a different view, von Foerster and co-workers argued [9] that intelligent beings would organize in a strongly linked society, thus reducing the original problem to that of a two-person game between the population and nature as its opponent. Based on this game-theoretical assumption, the growth of the population would lead to more effective ways to counter hazards and to produce resources. As a result, the productivity of the population would be an increasing function of the population size , for example a power-law increasing function of . von Foerster and co-workers applied this idea to fit the then available data of global population growth, and found an excellent fitting provided by a hyperbolic function: , where is the ”doomsday” year at which the population size was predicted to diverge to infinity. This hyperbolic form is the exact solution to the modified differential equation upon setting in Eq. (1), with a constant. It was however recognized already in the following decades that the global population trend was diverting from the von Foerster’s formula prediction, thus averting the predicted doomsday scenario in 2026.
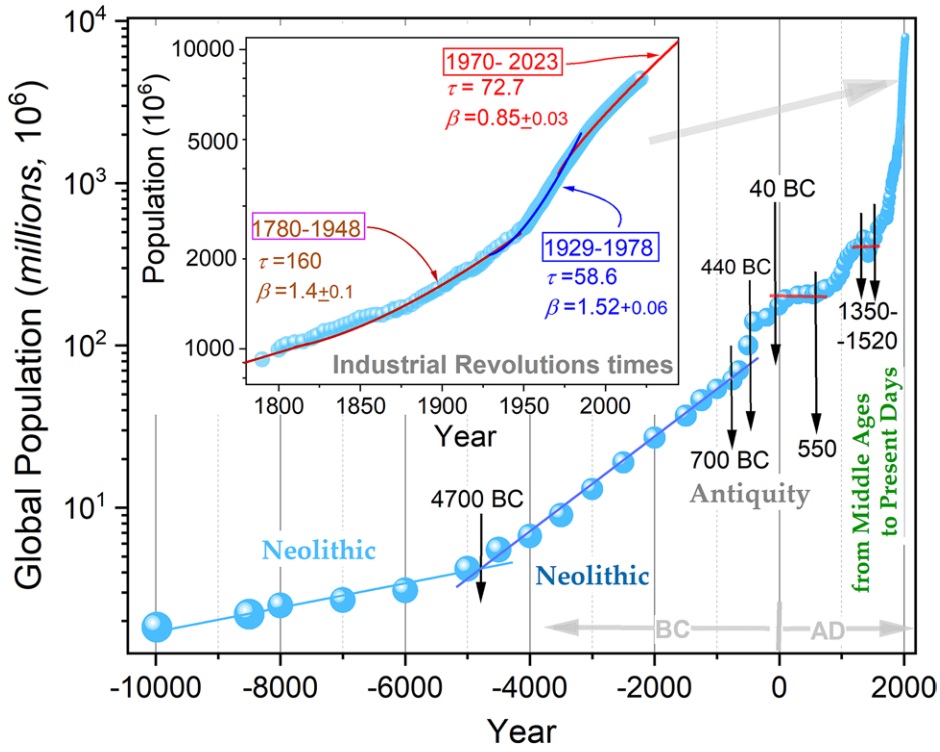
A recent important work [2] has shown that the global population evolution as a function of time over the past 12000 years has gone through various growth regimes, including short intervals of decline e.g. corresponding to the Black Death plague epidemics. Excluding these very short decline periods, the most prominent regimes, as visible in Fig. 1, are described by the following functions: (i) simple exponential growth (Malthus), corresponding to straight lines in the semi-logarithmic plot; (ii) flat or horizontal lines , corresponding to Verhulst or logistic plateaus; (iii) stretched-exponential function (SEF), with and (iv) compressed-exponential function (CEF), with .
A similar stretched-exponential function function, with only a difference of sign inside the argument of the exponential, , has been studied for almost two centuries in physics, at least since when Kohlrausch studied the electric discharge as a function of time of a prototypical capacitor, the Leyden jar [10, 11]. Since then, the stretched-exponential time decay, also referred to as the Kohlrausch function, has been observed in countless experiments and simulations of time-dependent phenomena in glasses and other amorphous solids [12, 13, 14], such as dielectric relaxation [15, 16], mechanical relaxation experiments [17, 18], and in the time-dependence of atomic-scale cooperative motions [19]. More recently, also the compressed exponential decay in time, with , has been experimentally detected in the atomic dynamics of metallic glasses [19, 20] as well as in colloidal gels [21].
The only theoretical model, which is able to produce all the above functional trends (i)-(iv) as its solutions, represents the productivity rate by the following function of the population size : , where is a real number, which could be positive or negative, and is a time constant. The corresponding differential equation thus reads as (compare to Eq. (1)):
| (2) |
This is the most general model of population growth, because it allows the productivity rate to either increase with the population size for or to decrease with the population size for . In particular, SEF solutions to Eq. (2) are obtained for , while CEF solutions are obtained for .
In the physics and chemistry of glasses and supercooled liquids, Eq. (2) (sometimes referred to as the Trachenko-Zaccone (TZ) equation) has an extra minus sign: [3, 22] because it describes relaxation, i.e. a delay or lag in the response of a material to an external (mechanical, electrical or magnetic) perturbation. Hence, the physically measurable response is described by a decaying function of time, the simplest being the simple exponential (Debye) decay, and, more common in liquids and glasses, the Kohlrausch relaxation function already quoted above [12, 11, 23]. The key physical mechanism that gives this equation in the context of glassy dynamics, is that local events (correlated atomic motions) do not occur independently but influence the rate of future events (for liquids, glasses and other systems, this influence is due to long-ranged elastic stresses in the material). In glasses, and in the TZ equation correspond to local relaxation events slowing down and speeding up the relaxation of future events, respectively. In Ref. [22], it has been shown numerically that a 1:1 relation exists between the Kohlrausch exponent in the relaxation functions (note the minus sign) and the TZ parameter , for both SEF and CEF . The same 1:1 correspondence relations exists for the parameter in Eq. (2) and the SEF and CEF growth functions (now mind the plus sign inside the exponential). In particular, in Eq. (2), corresponds to SEF growth in time, while corresponds to CEF growth in time.
Equation (2) can be readily shown to recover the Malthus equation, Eq. (1), upon linearizing the productivity rate about , setting . Upon linearizing it for , we obtain , where is a positive real number. In this limit, Eq. (2) recovers the Verhulst logistic growth. If, instead, we linearize the exponential for , , where , Eq. (2) reduces to the Riccati equation with constant coefficients , where and , which is solved by the von Foerster’s doomsday formula [9], with and in the limit of , where is the integration constant. Hence, in this limit, Eq. (2) predicts a doomsday scenario with a divergence of the global population to infinity at a time .
In its general form, and without linearizing the exponential, Eq. (2) admits exact solutions in terms of the exponential integral function and its inverse [24, 25], as follows:
| (3) |
where we used a dimensionless time . For values of the argument , the inverse exponential integral function can be written as a series expansion:
| (4) |
where is the Ramanujan-Soldner constant and are polynomials defined recursively by .
As already mentioned above, Eq. (2) among its solutions, admits both the SEF and the CEF growth regimes, alongside simple exponential, von Foerster, and sigmoidal when the exponential is linearized. Therefore, it is clear that Eq. (2) is the most general form of a population dynamics model, which is able to mathematically describe all the regimes in Fig. 1 as its particular solutions. We are not aware of any other differential equation or dynamical model which can achieve such a comprehensive mathematical description. Also, by making a function of time, Eq. (2) is able to mathematically describe the crossovers between different growth regimes, e.g. from SEF to CEF and viceversa, and of course also from Malthusian to Verhulst and viceversa, and, in fact, between any of the regimes (i)-(iv) in Fig. 1, from and to each other. For glassy relaxation this was demonstrated in Ref. [3].
In the above model, we considered as the most generic function describing the productivity rate of global population as the result of complex social, economic and environmental factors. The value of is the only parameter which modulates the growth and is a lumped function of all these complex factors. Using the physical meaning of in condensed matter systems, we can say that the sign of is set by whether the occurrence of local events slow down or speed up the occurrence of future events [3].
Based on the numerical correspondence between the SEF/CEF exponent and the parameter in Eq. (2), the crossover around 1970 from CEF to SEF growth corresponds to a crossover from to in Eq. (2). In Fig. 2(a), we show the comparison between the empirical best fitting SEF of the global population growth data for the period 1970-2023 (cf. Fig. 1) with the prediction of Eq. (2) for . The agreement is very good and the maximum deviation is within % in relative error. A systematic deviation appears at about 290 years from the starting point () set at 1970. While the prediction of Eq. (2) seems to slow down compared to the SEF, the predicted global population at this point (i.e. in 2260) is already 20 times the global population in 1970. This means a global population of 73.9 billions, which is clearly an unsustainable number.
A different scenario is explored in Fig.2(b) and (c), where the empirical CEF growth regimes ranging from the industrial revolution to the Second World War (CEF1), and from the 1929 crisis to 1978 (CEF2), are analyzed. Also in this case, the numerical solution to Eq. (2) is in fair agreement with the best fitting CEF functions, for both time periods, with values of the parameter in the range . Because now we have , as required to describe CEF, we notice the presence of a catastrophe in the numerical solution to Eq. (2), when . This value marks a transition from a growth trend which tends to flatten out in the long-time limit, (blue dashed line) to a trend which exhibits a rather sudden growth (by a few orders of magnitude) before starting to flatten out at huge values of (orange dashed line).
Extrapolating into the future, while the CEF remains bounded (even though astronomically large population sizes are reached), the solution to Eq. (2) displays a doomsday criticality, i.e. a divergence-type sudden explosion in the population size at a finite time, as a result of the strongly nonlinear dynamics underlying Eq. (2), in the regime where is an exponentially increasing function of . Recall that, already for , one gets a similar divergence in the solution to the corresponding Riccati equation as shown by von Foerster et al. [9] – hence, with and this singularity is also expected to occur. According to the predictions of Eq. (2), this doomsday scenario may occur as early as 2078. However, as already mentioned, this CEF growth regime has crossed over into SEF already around 1970 (possibly thanks to worldwide increase in average education [2, 26, 27]), which should avert the doomsday criticality, unless the global population growth reverts to a CEF-type growth regime with in Eq. (2). Based on these predictions, the present study clearly confirms the possibility of a doomsday criticality of the von Foerster type, which has to be avoided by keeping the global population growth far from the regime in Eq. (2). This could be enforced through, e.g., adequate population control policies.
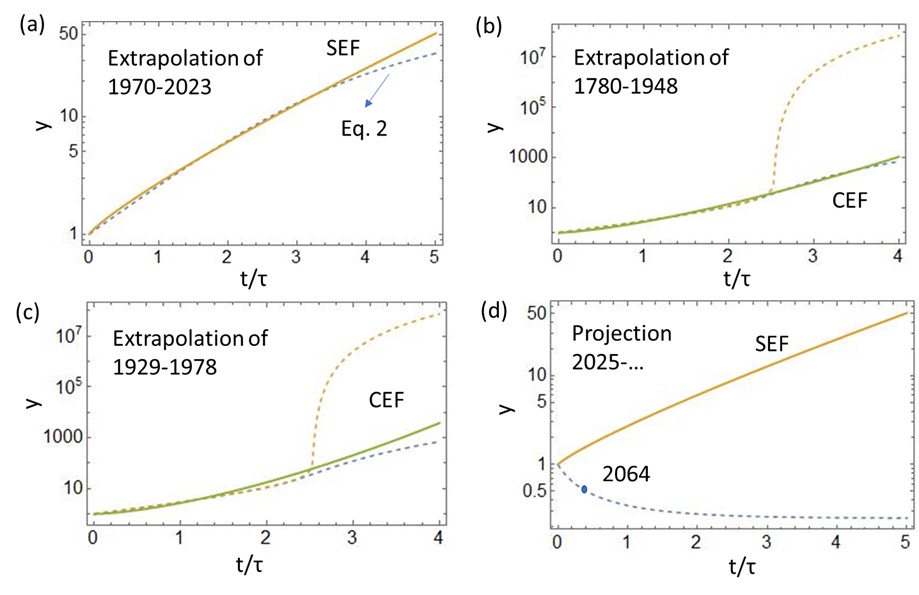
While the SEF scenario with which best describes the population growth from 1970 until now does not present any doomsday criticality, it is still possible that future developments may lead to a diversion from this trend. This deviation may be caused by a sudden crisis such as a global conflict, a catastrophic acceleration of the climate crisis, or a major global epidemic. As a result of such crisis, the current high efficiency in the exploitation of natural resources may significantly, and suddenly, decline. While the Earth’s limited carrying capacity () has not been influencing the global population growth at least since the industrial revolution, thanks to great technological and scientific developments, it cannot be excluded that the situation may change as a result of a global crisis which would compromise the efficiency of resource exploitation and management. After having shown the ability of Eq. (2) to mathematically describe all the regimes in the global population evolution over the past 12000 years, we can now explore its predictions in a hypothetical scenario where a global crisis would lead the population dynamics to depend on the Earth’s carrying capacity . This hypothesis would thus lead to the following dynamic equation, where the effect of Earth’s carrying capacity is made explicit [8]:
| (5) |
where is the Earth’s carrying capacity. If the sudden crisis leading to Eq. (5) were to set in today, we would have , since this provides the best fitting of the global population data (Fig. 1) from 1970 till now. By conservatively setting according to the available estimates [28, 29, 30], the above Eq. (5) predicts the trend shown as a dashed line in Fig. 2(d). According to this prediction, there will be a halving of the current global population by 2064. Given that the current population on Earth is a bit more than 8 billions, this prediction would imply a catastrophic decline of the global population with the disappearance of about 4 billions individuals over a period of just 29 years.
In conclusion, a single ordinary differential equation, Eq. (2), is able to mathematically describe all the various regimes encountered in the global population recorded as a function of time, over the past 12000 years until now. Regimes of simple exponential growth (Malthus), logistic (Verhulst) plateaus as well as stretched-exponential and compressed-exponential growth regimes are all reliably described by Eq. (2) in its various limits.
Based on Eq. (2), which is thus the most general population dynamics model known to date, future scenarios have been analyzed. While the current global population growth trend does not lead to a doomsday criticality, adequate population growth control is necessary in order to keep the control parameter in Eq. (2) strictly negative. Failing to do so would lead to a doomsday criticality of the von Foerster type as predicted by the exact solution to Eq. (2) in Fig. 2(b)-(c).
In a different scenario, a global crisis as due to a planetary war outbreak, a sudden acceleration of global warming or a vast epidemic with a high mortality rate, could lead to the modified Eq. (5), where the effect of Earth’s limited carrying capacity becomes explicit. Considering the current estimates of the Earth’s carrying capacity, if the crisis were to happen today Eq. (5) predicts a catastrophic decline of the world’s population with a net decrease by 4 billions human lives over a relatively short period of 29 years.
Acknowledgments
Many useful discussions with Dr. Valeriy Ginzburg are gratefully acknowledged. A.Z. gratefully acknowledges funding from the European Union through Horizon Europe ERC Grant number: 101043968 “Multimech”, from US Army Research Office through contract nr. W911NF-22-2-0256, and from the Niedersächsische Akademie der Wissenschaften zu Göttingen in the frame of the Gauss Professorship program.
References
- Adam [2021] D. Adam, Nature 597, 462 (2021).
- Sojecka and Drozd-Rzoska [2024] A. A. Sojecka and A. Drozd-Rzoska, Scientific Reports 14, 9853 (2024).
- Trachenko and Zaccone [2021] K. Trachenko and A. Zaccone, Journal of Physics: Condensed Matter 33, 315101 (2021).
- Malthus [1798] R. T. Malthus, An Essay on the Principle of Population (J. Johnson, in St. Paul’s Church-yard, London, 1798).
- Stoczkowski [2013] W. Stoczkowski, Diogenes 60, 79 (2013), https://doi.org/10.1177/0392192114568268 .
- Verhulst [1838] P.-F. Verhulst, Correspondance mathématique et physique 10, 113 (1838).
- Lotka [1956] A. J. Lotka, Elements of Mathematical Biology (Dover, New York, 1956).
- Murray [2002] J. D. Murray, Mathematical Biology (Springer, New York, 2002).
- von Foerster et al. [1960] H. von Foerster, P. M. Mora, and L. W. Amiot, Science 132, 1291 (1960).
- Kohlrausch [1854] F. Kohlrausch, Pogg. Ann. Phys. Chem. 91, 179 (1854).
- Phillips [1996] J. C. Phillips, Reports on Progress in Physics 59, 1133 (1996).
- Ngai [2011] K. L. Ngai, The Glass Transition (Springer, New York, 2011).
- Binder and Kob [2011] K. Binder and W. Kob, Glassy Materials and Disordered Solids (World Scientific, Singapore, 2011).
- Zaccone [2023] A. Zaccone, Theory of Disordered Solids (Springer, Cham, 2023).
- Lunkenheimer et al. [2005] P. Lunkenheimer, R. Wehn, U. Schneider, and A. Loidl, Phys. Rev. Lett. 95, 055702 (2005).
- Cui et al. [2017a] B. Cui, R. Milkus, and A. Zaccone, Phys. Rev. E 95, 022603 (2017a).
- Donth [2001] E.-J. Donth, Relaxation and Diffusion in Complex Systems (Springer, New York, 2001).
- Cui et al. [2017b] B. Cui, J. Yang, J. Qiao, M. Jiang, L. Dai, Y.-J. Wang, and A. Zaccone, Phys. Rev. B 96, 094203 (2017b).
- Ruta et al. [2012] B. Ruta, Y. Chushkin, G. Monaco, L. Cipelletti, E. Pineda, P. Bruna, V. M. Giordano, and M. Gonzalez-Silveira, Phys. Rev. Lett. 109, 165701 (2012).
- Wu et al. [2018] Z. W. Wu, W. Kob, W.-H. Wang, and L. Xu, Nature Communications 9, 5334 (2018).
- Li et al. [2019] Q. Li, X. Peng, and G. B. McKenna, Soft Matter 15, 2336 (2019).
- Ginzburg et al. [2024] V. V. Ginzburg, O. V. Gendelman, and A. Zaccone, Macromolecules 57, 2520 (2024), https://doi.org/10.1021/acs.macromol.3c02480 .
- Zaccone [2020] A. Zaccone, Journal of Physics: Condensed Matter 32, 203001 (2020).
- Abramowitz and Stegun [1964] M. Abramowitz and I. A. Stegun, Handbook of Mathematical Functions, ninth dover printing ed. (Dover, New York City, 1964).
- Lebedev [1965] N. N. Lebedev, Special functions and their applications (Prentice-Hall, Englewood Cliffs, N. J., 1965).
- Korotayev et al. [2006] A. Korotayev, A. Malkov, and D. A. Khaltourina, Introduction to Social Macrodynamics: Secular Cycles and Millennial Trends (KomKniga/URSS, Moscow, 2006).
- Impicciatore and Tomatis [2020] R. Impicciatore and F. Tomatis, Genus 76, 35 (2020).
- Lianos and Pseiridis [2016] T. P. Lianos and A. Pseiridis, Environment, Development and Sustainability 18, 1679 (2016).
- Dasgupta [2019] P. Dasgupta, Time and the Generations (Columbia University Press, New York, 2019).
- Tamburino and Bravo [2021] L. Tamburino and G. Bravo, Ecological Indicators 129, 107973 (2021).